If the Polar Vortex is due to Global Warming, Why are U.S. Cold Waves Decreasing?

January 31st, 2019 by Roy W. Spencer, Ph. D.

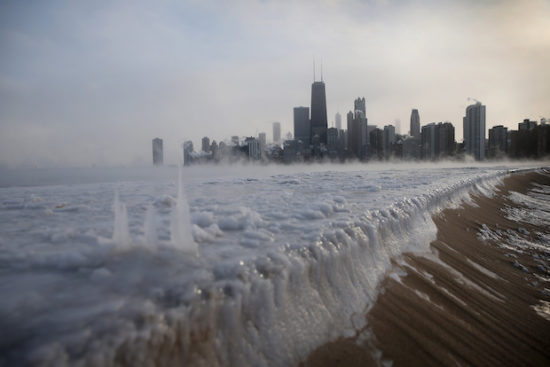
It’s much easier to devise and promote a climate change theory than it is to falsify it. Falsification requires a lot of data over a long period of time, something we don’t usually have in climate research.

The “polar vortex” is the deep cyclonic flow around a cold air mass generally covering the Arctic, Canada, and Northern Asia during winter. It is irregularly shaped, following the far-northern land masses, unlike it’s stratospheric cousin, which is often quite symmetric and centered on the North and South Poles.

For as long as we have had weather records (extending back into the 1800s), lobes of cold air rotating generally from west to east around the polar vortex sometimes extend down into the U.S. causing wild winter weather and general unpleasantness.

We used to call this process “weather”. Now it’s called “climate change”.

When these cold air outbreaks continued to menace the United States even as global warming has caused global average temperatures to creep upward, an explanation had to be found. After all, snow was supposed to be a thing of the past by now.

Enter the theory that decreasing wintertime sea ice cover in the Arctic (down about 15% over the last 40 years) has tended to displace the polar vortex in the general direction of southern Canuckistan and Yankeeland.

In other words, as the theory goes, global warming sometimes causes colder winters. This is what makes global warming theory so marvelously adaptable — it can explain anything.

In the wake of the current cold wave, John Christy skated into my office this morning with a plot of U.S. winter cold waves since the late 1800s. He grouped the results by region, and examined cold waves lasting a minimum of 2 days at a station, and 5 days at a station. The results were basically the same.

As can be seen in the plot below, there is no evidence in the data supporting the claim that decreasing Arctic sea ice in recent decades is causing more frequent displacement of cold winter air masses into the eastern U.S., at least through the winter of 2017-18:

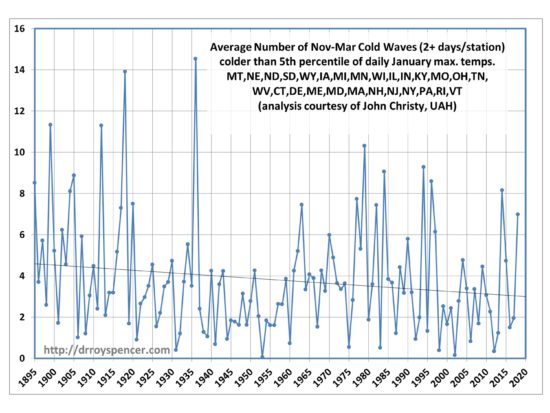
The trend is markedly downward in the most recent 40 years (since 1979) which is the earliest we have reliable measurements of Arctic sea ice from satellite microwave radiometers (my specialty).

Now, I suppose that Arctic sea ice decline could have some influence. But weather is immensely complex. Cause and effect is often difficult to ascertain.

At a minimum we should demand good observational support for any specific claim. In this case I would say that the connection between Eastern U.S. cold waves and Arctic sea ice is speculative, at best.

Just like most theories of climate change.


90 Responses to “If the Polar Vortex is due to Global Warming, Why are U.S. Cold Waves Decreasing?”

Toggle Trackbacks

  1. ren says:

    The Arctic ice theory makes no sense, because the waves of the Arctic air reach North America from Siberia.
    https://pics.tinypic.pl/i/00978/hlc5msj8vfeo.png
    https://earth.nullschool.net/#2019/01/31/1200Z/wind/isobaric/70hPa/orthographic=-91.25,43.86,361

  2. ren says:

    Brief Introduction to Stratospheric Intrusions
    Stratospheric Intrusions are when stratospheric air dynamically decends into the troposphere and may reach the surface, bringing with it high concentrations of ozone which may be harmful to some people. Stratospheric Intrusions are identified by very low tropopause heights, low heights of the 2 potential vorticity unit (PVU) surface, very low relative and specific humidity concentrations, and high concentrations of ozone. Stratospheric Intrusions commonly follow strong cold fronts and can extend across multiple states. In satellite imagery, Stratospheric Intrusions are identified by very low moisture levels in the water vapor channels (6.2, 6.5, and 6.9 micron). Along with the dry air, Stratospheric Intrusions bring high amounts of ozone into the tropospheric column and possibly near the surface. This may be harmful to some people with breathing impairments. Stratospheric Intrusions are more common in the winter/spring months and are more frequent during La Nina periods. Frequent or sustained occurances of Stratospheric Intrusions may decrease the air quality enough to exceed EPA guidelines.
    https://www.cpc.ncep.noaa.gov/products/stratosphere/strat_int/gif_files/gfs_toz_NA_f00.png

    • Roy W. Spencer says:

      If stratospheric air made it all the way to the ground, it would be very warm compared to the ambient air.

      • ren says:

        The fronts show that the ozone wave displaces water vapor from the south.
        https://files.tinypic.pl/i/00978/j0svthnbcg8n.png

      • ren says:

        A good joke.

        • Bobdesbond says:

          So you are calling the person with the qualifications and the person on your side of the climate debate a joke. Much as I disagree with his assessment of the climate situation, the only person here who qualifies as a joke is you.

          • Mike Flynn says:

            B,

            So you are trying your mind reading again, are you?

            Maybe you should ask what he means first?

            Maybe the joke is on you. I don’t know. Do you?

            Cheers.

          • Bobdesbond says:

            He is welcome to respond with an explanation at any time. Perhaps you should butt out and let him take care of himself.

          • Mike Flynn says:

            B,

            You didn’t ask Ren a question, did you?

            Why would he need to take care of himself? Do you think he might be damaged by your imaginary razor sharp wit?

            If I challenged you to a battle of wits, I’d be liable to prosecution for taking unfair advantage of an unarmed simpleton.

            I’m sure you can look after yourself with appropriate assistance. Be sure to let me know if I’m wrong, eh?

            Cheers.

      • pochas94 says:

        “If stratospheric air made it all the way to the ground, it would be very warm compared to the ambient air.”

        Hence, the arctic temperature inversion.

      • Joe DAleo says:

        Roy, you might remember in the Day after Tomorrow, the premise was three huge cold swirls resulted from failure of the AMOC and would move to the ground producing flash freezes and monster snow. When paleoclimatologist modeler Dennis Quaid was asked if the cold descends wouldn’t it warm, he said it was sinking too fast to warm. The laws of physics don’t hold if you move fast enough.

  3. ren says:

    The polar vortex pattern changes very slowly. The strong wind in the stratosphere operates in the troposphere in the winter due to its stability. Therefore, the jet stream in winter is compatible with the polar vortex in the lower stratosphere.
    https://earth.nullschool.net/#2019/01/31/1500Z/wind/isobaric/70hPa/orthographic=-358.17,84.35,314
    https://earth.nullschool.net/#2019/01/31/1500Z/wind/isobaric/500hPa/orthographic=-358.17,84.35,274

  4. ren says:

    When the speed of the solar wind increases, the ozone wave can be cut off in the south.
    https://images.tinypic.pl/i/00978/db00rlbit7tl.png

  5. ren says:

    The graphic shows how the stratospheric polar vortex was broken in January.
    https://www.cpc.ncep.noaa.gov/products/stratosphere/strat-trop/gif_files/time_pres_UGRD_MEAN_JFM_NH_2019.png
    I remind you that solar activity is currently minimal.

  6. Entropic man says:

    Dr Spencer

    That is very noisy data.

    Did John Christy calculate confidence limits, especially for the linear regression?

    My own numbers are

    Mean=3.6

    Standard Deviation=7.5

    95% confidence limits=+/-15

    Against 95% confidence limits of +/-15 a trend of -1.6 in 123 years looks rather insignificant.

    There is a debate going on in the meteorological community about the Francis hypothesis at the moment. The physics is sensible, but statistical confirmation or falsification won’t come for a while yet

    • JDHuffman says:

      E-man says: “The physics is sensible, but statistical confirmation or falsification won’t come for a while yet.”

      Wrong again, E-man.

      The “physics” of “warming causing a weakening polar vortex” is NOT sensible. It takes energy to form a tight, organized vortex. You’ve got it backwards.

      And the statistical confirmation is provided by John Christy’s graph. You just chose to ignore it.

      • Entropic man says:

        ” It takes energy to form a tight, organized vortex. ”

        It does indeed. Which is why the low temperature gradient and low energy has allowed the usual tight Winter vortex to split into two weaker ones.

        You can see the two cold cells on opposite sides of the arctic in the NASA graphic here.

        https://www.theguardian.com/us-news/2019/jan/30/polar-vortex-us-weather-latest-temperatures-midwest-east

        • Mike Flynn says:

          EM,

          And precisely how did CO2 create all this energy? Magic, perhaps?

          Certainly not in accordance with any testable GHE hypothesis, because you haven’t got one, have you?

          Just more pseudoscientific tactics of deny, divert and confuse.

          Keep waffling. The audience of the usual nutters will no doubt applaud long and loud.

          Cheers.

          • bobdroege says:

            I remember that you posted a testable and falsifiable GHE hypothesis a while ago.

            What, did you sleep since then?

    • Norman says:

      Entropic man

      YOU: “There is a debate going on in the meteorological community about the Francis hypothesis at the moment. The physics is sensible, but statistical confirmation or falsification wont come for a while yet.”

      What physics makes her hypothesis sensible? In the Mid-Summer the jet stream retreats far North and the severe weather goes down considerably in the US. The gradient is greatly reduced between tropics and North pole.

      https://www.spc.noaa.gov/climo/online/monthly/newm.html

      This is a link to tornado counts monthly. It clearly shows that the when the gradient is greater severe weather is far more likely. Tornadoes drop considerably in July and August as the gradient between tropics and North pole decline.

      I am wondering how less cold air in the Arctic would be able to move further South. Christy graph shows it doesn’t.

      Everything I have read on Rossby waves says that as the gradient decreases the amplitude of the waves decreases. It is the opposite of what Francis is claiming.

  7. Norman says:

    Roy Spencer

    Thanks for posting the graph and logical thought process.

    I have argued this in the past on Skeptical Science. I suggested that by claiming all bad weather is because of climate change (droughts, floods, extreme cold, extreme heat) then they also need to include all the nice pleasant days, mild temps gentle winds and plenty of sunshine, and attribute all the nice days to climate change. I am most certain that the nice days would out do the extreme ones, so using their logic climate change is most beneficial since it leads to many nice pleasant days. I guess it will be about 60 F in Omaha this weekend.

    Also I am not sold at all on the Francis idea that less temperature differential will lead to a jet stream with much deeper waves. All that I have read and the real world suggests quite the opposite. In the Mid-Summer months the polar jet stream is very far North, moves slowly and the cold air does not meander down (there is not much of it). Also weather moderates. There are considerably less weather events in Mid-Summer in the USA than in Spring when the differential is at a maximum (much warmer gulf but still very cold Arctic Air). I think that idea was just made up, as you point out with this post, to get climate change hysteria to work on any and all bad weather events to manipulate people emotionally to react in a way the Elite want us to and force thousands of windmills (who someone made lots of money building and installing).

    I accept the GHE as a scientific fact but the Climate Change mentality has to be reined in to keep it a scientific study. Most correct that if one proposes an even (fire in California) is caused by Climate Change, strong proof and supporting mechanisms must be presented. Just making the declaration is what the non-scientists that post here do. You are most correct to call out those doing so.

  8. gbaikie says:

    It seems real global warming would not have cold arctic vortex. Though could have arctic vortex or changes in weather patterns.
    Or warm summers in arctic, are weather rather than global warming.

  9. Curious George says:

    I have a serious problem with your graph. There are just too many arbitrary choices how to produce it – time period (Nov-Mar)?, 2+? days per station, colder than 5th? percentile, of daily?, January?, max?, temps, and which states to include. We should leave these shenanigans to warmists.

  10. AZ1971 says:

    I see far more of a cyclical sine wave form in the graph than a direct linear decrease since 1895. Surely that’s due to the oceanic cycles, whether PDO, AMO, AO, or whichever. Thoughts?

    • John of Cloverdale, Western Australia says:

      I have noticed a similar pattern of John Christie’s plot above to the detrended AMO plot which in turn is similar to the NH sea ice plot and historical Arctic temperatures. Anyone agree?

  11. spalding craft says:

    Hope you tweeted this. Twitter is abuzz with this subject.

  12. Mike Flynn says:

    From a journalist at CBC –

    “The fact is, it’s climate change, or global warming, that’s behind this extreme cold.”

    Or maybe it’s just the physics of an unpredictable non-linear chaotic system called the atmosphere.

    Take your pick.

    Cheers.

  13. Jeffrey says:

    “The trend is markedly downward in the most recent 40 years”

    Couldn’t this be interpreted as support for global warming in general ?
    (albeit not for Polar Vortexes caused by Global Warming)

    • gbaikie says:

      -Couldnt this be interpreted as support for global warming in general ?
      (albeit not for Polar Vortexes caused by Global Warming)–

      Satellite measurement over last 40 years, indicates warming trend of .13 C per decade.
      And it thought over last 100 years global temperature has increased by about 1 degree.

      And it seems possible that in another 100 years global temperature may warm as much as 1 degree.
      And if it does we should expect to have less frequency of the cold artic vortex.

      And generally, longer seasons. And less chance of the great lakes freezing over. And/Or Niagara falls freezing.

  14. An Inquirer says:

    The trouble with John Christy’s graph is that he did not cherry pick his starting point. If he started the graph in 1940, he likely would be producing a graph that shows increasing polar vortexes correlated with increased levels of CO2.

    And he could justify this starting point with an implicit assumption of the adjustment process used for historic temperatures: monitors of weather stations in the 1930s did not know how to read thermometers. Hence, we in 2019 through algorithms can better determine what the thermometers were saying better than the people who read them.

    • barry says:

      I trust the people who regularly impugn the global surface data will scoff at Christy’s effort.

      Gordon and others could not possibly agree with Christy, because they think the data he is using is corrupted.

    • gbaikie says:

      –The trouble with John Christys graph is that he did not cherry pick his starting point. If he started the graph in 1940, he likely would be producing a graph that shows increasing polar vortexes correlated with increased levels of CO2.–

      You are free to cherry pick 1940, it indicate, no significant trend and C02 effect ending couple decades ago.

  15. Myki says:

    No polar vortex in Australia:

    “January 2019 was Australia’s hottest month since records began in 1910, data to be released by the Bureau of Meteorology (BOM) today will show.

    It followed the hottest December on record for Australia and there is no relief in sight for the months ahead.

    January had the highest minimum, the highest maximum and the highest mean temperatures for Australia as a whole.

    The mean temperature for January averaged across the country exceeded 30 degrees Celsius the first time this had occurred in any month, the BOM said.”

    https://www.abc.net.au/news/2019-02-01/australian-weather-hottest-month-on-record-in-january/10769392

    • Bobdesbond says:

      A month ago, ren tried to claim the drought in Australia was over.

    • Mike Flynn says:

      Myki,

      As you are aware, the BOM declared all official records prior to 1910 unreliable. This made the inconvenient heat wave of 1896-1897 vanish from history.

      Phew. Stroke of luck, that.

      I suppose you are still hoping that the usual crop of fools will believe that extra CO2 in the atmosphere simultaneously creates heat, drought, and flooding rains in Australia, and extreme cold, extreme heat, drought, and floods in the US.

      Many will. You’re in good company, obviously.

      Does your missing testable GHE hypothesis account for all the above? How does it account for four and a half billion years of planetary cooling?

      Are you sure that Bindidon hasn’t been playing with your pencil?

      Cheers.

      • Bobdesbond says:

        All of the data back to 1859 is included in the BOM data set … none has “vanished”.

        Any records from that period still stand. January 1896 is still down as the 4th warmest January in the record. So, eff knows what you mean by “vanish”.

        Ranks for each of those 24 months (out of 161 for January and 160 for the rest of the months):

        Jan 1896 … 4
        Feb 1896 … 95
        Mar 1896 … 122
        Apr 1896 … 109
        May 1896 … 113
        Jun 1896 … 139
        Jul 1896 … 159
        Aug 1896 … 156
        Sep 1896 … 130
        Oct 1896 … 25
        Nov 1896 … 134
        Dec 1896 … 57
        Jan 1897 … 114
        Feb 1897 … 107
        Mar 1897 … 148
        Apr 1897 … 29
        May 1897 … 123
        Jun 1897 … 69
        Jul 1897 … 93
        Aug 1897 … 137
        Sep 1897 … 70
        Oct 1897 … 95
        Nov 1897 … 9
        Dec 1897 … 118

        Your “heatwave of 1896-1897” is in fact just two very hot months amongst a sea of cold. But keep that fiction coming.

        • Mike Flynn says:

          B,

          From the BOM –

          “2018 was Australia’s third-warmest year on record (the national temperature dataset commences in 1910). . . .

          . . . Temperature measurement from before approximately 1910 used a wide variety of non-standard configurations and are therefore not directly comparable to modern measurements.”

          Go ahead. Rank away with figures not included in the national temperature dataset. Who cares? You are confusing weather with climate, surely. Try taking refuge in the magic of the average, if you think it would help.

          Do you really think that CO2 makes thermometers hotter?

          Still cannot find that amazing missing testable GHE hypothesis, can you? Keep playing with your pencil. Play with Bindidon’s as well, if it helps to confuse gullible Warmist acolytes.

          Maybe you could redefine 1896 to occur after 1910. Its records could then be included in the national temperature dataset. That is the approved pseudoscientific way, isn’t it?

          Cheers.

          • Bobdesbond says:

            You seem to be confused by the difference between the Sydney temperature record and the national temperature record.

            As stated, the SYDNEY record goes all the way back to 1859, includes January 1896 as the 4th warmest January, and shows no sign of a 2-year heatwave in 1896-97.

            Data from individual stations goes all the way back to the opening years for those stations, but they have combined the data into a national average only back to 2010.

            So please tell me in which part(s) of Australia should I look for this supposed heatwave in the station data?

          • Bobdesbond says:

            Edit: 1910

          • Mike Flynn says:

            B,

            Don’t ask me to do your work for you. Are you not able to look up the records for yourself?

            Complain to the BOM for confusing you. Sydney’s a reasonable size. What is the precise location of the site that you claim has been a included or not, and why do you think those records should be included (or not)?

            Why would you think there was a two year heatwave? Are you mentally defective?

            What is your point? Do you believe you can predict the future from detailed examination of the past, like the deluded Bindidon?

            Have you two pencils, perhaps? It would be difficult to achieve your standard of stupidity and ignorance by playing with one.

            I assume you have a point to your peculiar comments, but it’s not at all clear what it is.

            Cheers.

          • Bobdesbond says:

            Thanks for confirming, due to your inability to provide a source, that your claim of “the heat wave of 1896-1897” was a fabrication, and did not extend beyond the 24 day heat wave of January 1896, exclusively in southeast Australia.

            Apparently you believe I should waste time digging through records for every station in Australia to look for something that does not exist.

            You do realise that it is standard practice for people making a claim to provide their own evidence for the claim, right? Otherwise it becomes obvious that you just pulled it out of your ass.

            I have made no claim whatsoever about whether or not records SHOULD be included, only that they ARE included, contrary to your BS claim. You just keep wheeling out those straw men.

          • Mike Flynn says:

            B,

            “Two extreme heatwaves occurred in January 1896 and in the heatwave summer of 1897-98”. You can check the reference if you wish.

            The second was hotter than first. I lumped them together. Sorry if you were too ignorant to contextualise history and weather.

            You still don’t appear to have a point to your complaints. I won’t ask you if you have one, as I’m fairly sure you are as pointless as your comments.

            Carry on regardless – I’m sure you can.

            Cheers.

          • Bobdesbond says:

            Sydney ranks for summer 1897/98:

            Dec 1897: 117th
            Jan 1898: 60th
            Feb 1898: 65th

            Only 6 days over 30C that summer compared to 17 over 30C in the first two months of this summer.

            So no heatwave that summer in Sydney.

            I found the source of your link. Funny how you omitted the fact that this heatwave occurred only “in parts of eastern Australia”. So you chose to represent a heatwave over a very small fraction of the country as a whole-Australia heatwave. So you can see that it was actually your original comment that was lacking a point.

        • Crakar24 says:

          Come on B the temps before 1910 may be on a website but they are not included in the dataset…..by the way for a majority of I watched a bom site getting blasted by jet exhaust because the jets are now parking in a different location. The bom are oblivious to this but if course accuracy is not important the message is

          • Bobdesbond says:

            If station data is on the website, is included in the averages for that station, and is also included in the records for that station, in what sense is it “not included in the dataset”?

            And … “for a majority of I watched a bom site getting blasted by jet exhaust” … is that English?

          • Mike Flynn says:

            Crakar24,

            One BOM site where I worked was a shared military airport. The exhaust from large military jets turning around on the tarmac travels far and wide. I believe it is worse now, as the digital sensors sample at one second intervals or so.

            A one second reflection of the Sun from a reflective surface can create erroneous spikes. All pointless anyway – achieves precisely nothing of use.

            Historical curiosity – nothing more, nothing less, but endlessly absorbing and captivating to those of limited mental acuity.

            Like B, for example.

            Cheers.

          • Bobdesbond says:

            How about you name this site so that the data can be checked.

            Tell me, in a day of 86400 seconds, how many “one second reflections of the Sun from a reflective surface” do you envisage would strike the enclosed sensor some distance away?

          • Mike Flynn says:

            B,

            You demanded, in your usual stupid and ignorant fashion

            “How about you name this site so that the data can be checked”

            No. Throw yourself on the floor, hold your breath until you turn blue – still no.

            As to your demand –

            “Tell me, in a day of 86400 seconds, how many one second reflections of the Sun from a reflective surface do you envisage would strike the enclosed sensor some distance away?”

            Once again – no. Why should I? If you were really interested, you would be able to answer your own question. Try addressing your stupid gotchas to someone who gives a toss about what you think.

            Get a grip, laddie.

            Cheers.

          • Bobdesbond says:

            Thanks for admitting to yet another fabricated claim.

        • Geoff Sherrington says:

          Australian heat waves in our capital cities are instructive because that is where the longest records are and that is where most of our people live.
          Here is a graphical tour. CDO is Climate Data Online, the official BOM raw data site. Acorn is “ACORN_SAT” version one, the “adjusted” raw data for some 110 stations from 1910 onwards.
          Your detaiuled question about heat waves in 1897 and 1897 is not seen in these graphs, but it is calculated on the working spreadsheets behind these graphs.
          The poin to note is the false claim by Australian officials that Australian heat waves are becoming longer, hotter and more frequent. Try to prove that official assertion bu using these graphs, because they are official data, not fiddled, without cherry picked dates (by me).
          These graphs help put Australian heat waves into proper prespective. Geoff.
          http://www.geoffstuff.com/graphs_sydmelb_heatwaves.pdf

    • Geoff Sherrington says:

      Myki,
      In Australia, the BOM has quietly released a new, adjusted version of national temperatures, ACORN-SAT Version 2. If you plot original data, Acorn V1 and Acorn V2 on the same graph and draw error limits around all 3, you end up with an accuracy to 2 sigma of something like +/- 1.5 degrees C. It is a guess what the ACTUAL temperature was at a given time and place. So much for setting records.
      Also, the BOM is transitioning to the latest Platinum Resistance Thermometer device in the latest screen design, but there is little sign of comparison data with Liquid-in-Glass thermometry. So much for data transparency.
      The Acorn Version 2 has the interesting property that there is no objective test to describe if an adjustment improves or degrades the data. Nonetheless, the tendency to cool the past relative to a warm present continues, with quite massive trend changes since 1910.
      Science has become science fiction here, sadly. Geoff

  16. Eben says:

    Chicken bones reading again

    • ren says:

      Current temperature (C) in the Midwest and Northeast.
      https://pics.tinypic.pl/i/00978/wfoonc6wuv4s.png

    • ren says:

      The response of the nonlinear oscillatory system to an insignificant external disturbance has been considered as applied to the effect of solar activity on climatic processes. Based on a simplified model, it has been indicated that the response of a nonlinear oscillator to a weak disturbing impact can be substantial. The oscillator fluctuation spectrum can decrease under the action of a disturbing factor. This means that the effect of an even weak solar or cosmophysical signal to the Earths climatic system can lead to significant climate variations if this system is nonlinear. However, it will be rather difficult to identify the solarclimatic nature of these variations because a linear relation between the cause and response is absent.
      https://link.springer.com/article/10.1134%2FS0016793210010020

  17. barry says:

    “If the Polar Vortex is due to Global Warming…”

    I’m all for shining a light on hype and ignorance, but muddy headlines like this don’t help.

    Jennifer Francis’ hypothesis remains a hypothesis. But she does not claim that the Polar Vortex is caused by global warming.

    Slower progression of upper‐level waves would cause associated weather patterns in mid‐latitudes to be more persistent, which may lead to an increased probability of extreme weather events that result from prolonged conditions, such as drought, flooding, cold spells, and heat waves.

    One of the reasons it’s a hypothesis is that the sample period is a little short:

    As the gradient has decreased with a warming Arctic, the upper‐level zonal winds during fall have also weakened since 1979 (Figure 3, right), with a total reduction of about 14% (>95% confidence). Winter winds are more variable but exhibit a steady decline since the early 1990s.

    https://agupubs.onlinelibrary.wiley.com/doi/full/10.1029/2012GL051000

    There’s no point testing back to the 1880s, because we have no knowledge of whether the PV has slowed for much of the 20th century. And not much reason to expect it when Arctic sea ice loss was probably little for most of the 20th Century.

    A test on point for Winter cold snaps would start in the early 1990s, and would also check for duration, which is the basis for the hypothesised consequences.

  18. ren says:

    This study showed that the disturbances of the troposphere circulation associated with SA/GCR variations
    take place over the entire globe. The spatial structure of the observed pressure variations is determined by the
    influence of SA/GCR on the main elements of the large-scale atmospheric circulation (the polar vortex, the
    planetary frontal zone and extratropical baric systems). The temporal structure of the SA/GCR effects on the
    atmosphere circulation at high and middle latitudes is characterized by a ~60 yr periodicity, with the changes
    of the correlation sign taking place in 1890-1900, the early 1920s, the 1950s and the early 1980s. The ~60 yr
    periodicity is likely to be due to the changes of the epochs of the large-scale atmospheric circulation. A sign
    of the SA/GCR effects seems to be related to the evolution of the meridional circulation C form. A
    mechanism of the SA/GCR effects on the troposphere circulation may involve changes in the development of
    the polar vortex in the stratosphere of high latitudes. Intensification of the polar vortex may contribute to an
    increase of temperature contrasts in frontal zones and an intensification of extratropical cyclogenesis.
    http://geo.phys.spbu.ru/materials_of_a_conference_2010/STP2010/Veretenenko_Ogurtsov_2010.pdf

  19. ren says:

    Stationary front blocks the flow of water vapor from the south to the Midwest.
    https://images.tinypic.pl/i/00978/5zodf16isqv4.png

  20. The climate has not changed in any dramatic way since the Little Ice Age came to a close.

    Now however there is a chance to revert back to a significant decline in global temperatures which would mark a dramatic change.

    Overall oceanic sea surface temperatures falling will be the first indication of this if/when it happens which I still expect will be the case.

    Other then that we can just keep going in circles because there is no evidence of any dramatic climate changes currently.

    • Bobdesbond says:

      It is now five months since your ultimatum to yourself expired … that you would admit to being wrong if UAH temperatures did not fall consistently to zero and below.

  21. Russell Klier says:

    Global warming caused a disastrous cold snap… It’s called “Having your cake and eating it too”….. If it’s a dry spell, that’s evidence of Climate Change, a wet spell…Climate Change……Big hurricane…Climate Change…Period of few hurricanes…Climate Change… Big tornado outbreak… Climate Change ..Dearth of Tornados… You get the picture……

    • Entropic man says:

      I get the picture.

      Think of three stages of cause and effect.

      The first is the release of CO2 by our civilization.

      The second is the increase in global average temperature, otherwise known as global warming.

      The third is climate change. Depending on circumstances that can be make a locality wetter, dryer, hotter, cooler, stormier or more settled.

      For example, global warming heats the Atlantic. Warmer water evaporates more water vapour. A noreaster pulls that warm wet air over cold land and the water precipitates as snow. Because of the extra water vapour you get more snow.

      In this specific case global warming produces more snow. Elsewhere global warming might warm land above 0C and what would previously have fallen as snow, falls as rain instead. Both are examples of climate change.

  22. Nate says:

    ‘At a minimum we should demand good observational support for any specific claim. In this case I would say that the connection between Eastern U.S. cold waves and Arctic sea ice is speculative, at best.’

    Agreed. The Media gets hyped about speculation.

    I think most reputable climate scientists agree that it is still speculative.

    Are you knocking down a strawman? Similar to your Chuck Todd one?

  23. TomK says:

    Ren, I am somewhat curious, why are you building a theory on essentially no data which is substantially different from Dr. Spencer’s display of actual long term data?

    • ren says:

      It does not differ, rather confirms.
      The temporal structure of the SA/GCR effects on the
      atmosphere circulation at high and middle latitudes is characterized by a ~60 yr periodicity, with the changes
      of the correlation sign taking place in 1890-1900, the early 1920s, the 1950s and the early 1980s. The ~60 yr
      periodicity is likely to be due to the changes of the epochs of the large-scale atmospheric circulation.

        • TomK says:

          I do not see your periodicity in the graph.

          Also earlier you mentioned that Ozone would be driven down into the lower atmosphere from stratospheric masses. This is extremely difficult to believe given the mixing of these high wind weather patterns. Also when we are seeing “worst cold since 1985” or “1925” that suggests no real periodicity. I would suggest raised Ozone being generated by the much greater power demands of the extreme cold.

          Again, referring back to the ice core research and the shorter term periodicity of the Warm Periods interspersed with the cooler, the Little Ice Age that appears the worst on record, we have no need to treat our present conditions as anything more than normal. I don’t know how to call chaotic weather events “normal” but that has to be what we see.

          As someone from the west coast that has long experience with Pacific Decadal Oscillation and how climate predictions are only vaguely accurate my skepticism is well founded.

  24. TomK says:

    I quite agree. Close examination of the ice core data from the Antarctic, Alaska and Siberia shows virtually identical general conditions as we have now. Why should we invent entire scenarios pretending that somehow we are special?

  25. TomK says:

    Salvatore, remember that falling oceanic temperatures increase CO2 solubility into seawater and would be signaled by falling levels of atmospheric CO2.

    • Bindidon says:

      “and would be signaled by falling levels of atmospheric CO2.”

      Ooops?! Does that not first depend on how much more of that CO2 goes into the oceans than we yearly emit?

      And what do you mean with ‘oceanic temperatures’ ?

      If you mean their heat content, than they certainly are not falling for a while. Only the surface cools a little bit.

  26. Bill D says:

    Relax folks and enjoy the weather. None of us will be here long enough to make a real difference. And, most of the debate is about funding and recognition, or recognition and funding. The one who can get the most $$$$$$ with the best argument will be the most successful.

  27. Lisa P says:

    This is completely unrelated. My sister was listening to NPR this week and heard them talking about this study/article. Apparently, colonization and subsequent dying off of indigenous peoples in the Americas is what caused the Little Ice Age. (And they admit the CO2 level only dropped 7-10 ppm). Just FYI. https://www.bbc.com/news/science-environment-47063973

    • Bindidon says:

      Lisa P

      “And they admit the CO2 level only dropped 7-10 ppm). Just FYI. ”

      https://www.bbc.com/news/science-environment-47063973

      *
      To be honest: I always feel somewhat terrified by such publications.

      At that time, there were lots of incredibly strong volcano eruptions:

      – 1257 Samalas, Lombok Island, VEI 7
      – 1280 Quilotoa, Andes VEI 6
      – 1452/3 Kuwae, Vanuatu, VEI 6+
      – 1477 Bárðarbunga, VEI 6
      – 1563 Agua de Pau, Acores, VEI 5
      – 1580 Billy Mitchell, Solomon Island, VEI 6
      – 1586 Kelut, Island, VEI 5
      – 1600, Huaynaputina, Peru, VEI 6
      – 1641, Mount Melibengoy, Phillipines VEI 6
      – 1650, Kolumbo, Greece, VEI 6
      – 1660, Long Island (Papua New Guinea), VEI 6

      and inbetween all these, about 35 eruptions with VEI 3-4.

      A proposal: to read e.g.

      https://agupubs.onlinelibrary.wiley.com/doi/full/10.1029/2011GL050168

      Sounds a little bit more serious to me…

    • Svante says:

      Hi Lisa P,
      I think I’m the only one here that subscribes to that hypothesis.

      That small change could have a sizable impact because feed backs had time to complete, and because the effect is logarithmic (so the first increase has greater yield).

      They do say it was just one factor, I think Samalas was a likely trigger.

      Here’s the big picture, see it from the start:
      https://www.youtube.com/watch?v=1TOTsmqgmL8&t=37m50s

  28. travis casey says:

    And just like that National Georgraphic confirms the premise that cold spells are getting warmer. This after a week of climate scientists telling us the polar vortex was colder because of climate change. https://apple.news/AF4qu1rtcTByhri-qjRCDJw

  29. ren says:

    Stationary front now cuts off water vapor from the south in the Northeast.
    https://files.tinypic.pl/i/00978/uy93x7d1krps.png

  30. ren says:

    It must be clearly emphasized that sudden warming in the startosphere occurred at the end of December and its effects reached the surface only at the end of January.
    https://images.tinypic.pl/i/00978/zcx0ojcj048q.gif

  31. ren says:

    Very low temperature in western North America associated with visible stratospheric intrusion.
    https://images.tinypic.pl/i/00979/d0zdd8epu6g5.png

  32. ren says:

    The pattern of the polar vortex in the lower stratosphere is the cause of very low temperatures in North America.
    https://earth.nullschool.net/#2019/02/19/0900Z/wind/isobaric/70hPa/orthographic=-115.49,63.71,340
    https://images.tinypic.pl/i/00979/l2vnzllngfe1.png

  33. ren says:

    Temperature anomalies in North America on 20/02/2019.
    https://www.tropicaltidbits.com/analysis/models/gfs/2019022000/gfs_T2ma_us_1.png
    W okresach niskiej aktywności słonecznej jonizacja w niższej stratosferze nad kołem polarnym wzrasta w wyniku wzrostu promieniowania galaktycznego. W rezultacie temperatura w niższej stratosferze wzrasta ponad kołem polarnym. Powoduje to zahamowanie cyrkulacji z zachodu na wschd.
    https://pics.tinypic.pl/i/00979/x1e8fpkc1fxp.png

    • ren says:

      Sorry.
      During periods of low solar activity, the ionization in the lower stratosphere over the polar circle increases as a result of the increase in galactic radiation. As a result, the temperature in the lower stratosphere increases over the polar circle. This results in the inhibition of circulation from west to east.
      https://pics.tinypic.pl/i/00979/x1e8fpkc1fxp.pn

  34. ren says:

    Snowstorm in southern California and Arizona.
    https://pics.tinypic.pl/i/00980/qhaw9jf1qw07.jpg

  35. marion says:

    Roy see rloss Mckittrick at Uiversity of Guelph for 150 years of canadian data. It shows i is actualler in the two levels of souther canadian teirs

Leave a Reply to ren