Australia’s Record Hot January: Mostly Weather, Not Climate Change

February 4th, 2019 by Roy W. Spencer, Ph. D.

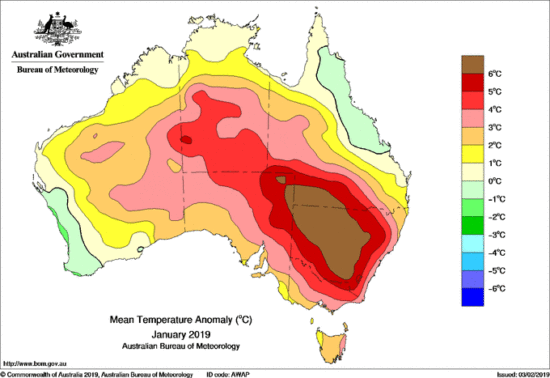
The Australian Bureau of Meteorology (BOM) claims January, 2019 was record-hot. There is no doubt it was very hot — but just how hot… and why?

The BOM announcement mentions “record” no less than 28 times… but nowhere (that I can find) in the report does it say just how long the historical record is. My understanding is that it is since 1910. So, of course, we have no idea what previous centuries might have shown for unusually hot summers.

The assumption is, of course, that anthropogenic global warming is to blame. But there is too much blaming of humans going on out there these days, when we know that natural weather fluctuations also cause record high (and low) temperatures, rainfall, etc.

But how is one to know what records are due to the human-component of global warming versus Mother Nature? (Even the UN IPCC admits some of the warming since the 1950s could be natural. Certainly, the warming from the Little Ice Age until 1940 was mostly natural.)

One characteristic of global warming is that it is (as the name implies) global — or nearly so (maybe not over Antarctica). In contrast, natural weather variations are regional, tied to natural variations and movements in atmospheric circulation systems.

That “weather” was strongly involved in the hot Australian January can be seen by the cooler than normal temperatures in coastal areas centered near Townsville in the northeast, and Perth in the southwest:

The extreme heat was caused by sinking air, which caused clear skies and record-low rainfall in some areas.

But why was the air sinking? It was being forced to sink by rising air in precipitation systems off-shore. All rising air must be exactly matched by an equal amount of sinking air, and places like Australia and the Sahara are naturally preferred for this — thus the arid and semi-arid environment. The heat originates from the latent heat release due to rain formation in those precipitation systems.

If we look at the area surrounding Australia in January, we can see just how localized the “record” warmth was. The snarky labels reflect my annoyance at people not thinking critically about the difference between ‘weather’ and ‘climate change’:


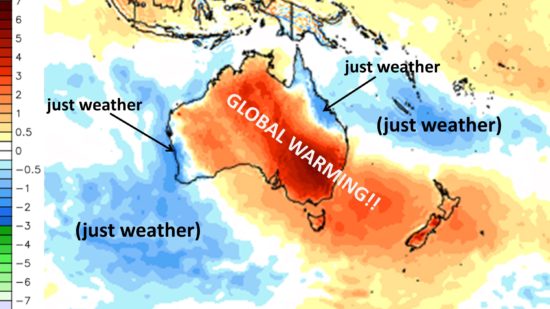
January 2019 surface temperature anomalies (deg. C, relative to the 1981-2010 average) from NOAA’s Global Forecast System (GFS) analysis fields. Unlabeled graphic courtesy of WeatherBell.com.

So, the claims of the usual suspects such as “Australia’s Extreme Heat is a Sign of Things to Come” is just one more example of the blind leading the blind.


2,298 Responses to “Australia’s Record Hot January: Mostly Weather, Not Climate Change”

Toggle Trackbacks

  1. Rhys Jaggar says:

    I have read reports elsewhere that incredibly cold temperatures were occurring in Siberia at just the time very hot temperatures were occurring in Australia.

    Does anyone go around summing (temperature deviation from mean *area of deviation) across significant areas of land and see what that actually adds up to?

    It would not surprise me at all if the cold in Siberia cancelled out the heat in Australia to a significant if not complete degree….

    • quaesoveritas says:

      Surely that is what the global mean temperature is.

    • Bob Weber says:

      incredibly cold temperatures were occurring in Siberia at just the time very hot temperatures were occurring in Australia

      The Australian record this winter and the US summer record heat in 2018 were consequences of the effect of lower evaporation off the ocean from long duration low TSI going into this solar minimum, which tends to clear the skies for higher UV index days that desiccates the ground and drives land temperatures higher.

      The record cold temperatures and snow resulted from the solar minimum long duration low TSI, compounded by the longer-term solar energy deficit since 2004, the end of the solar modern maximum in sunspot activity. TSI also declined July-Dec 2018.

      The solar minimum establishes one set of conditions while the solar maximum another, sometimes with similar outcomes.

  2. Entropic man says:

    Dr. Spencer

    In 2013 the BOM had to add extra colours to its temperature contour maps because measured temperatures were showing values not previously recorded.

    https://www.businessinsider.com/australia-adds-new-color-to-temperature-maps-2013-1?r=US&IR=T

  3. Entropic man says:

    Take a look at the daily data here.

    http://www.bom.gov.au/jsp/awap/temp/index.jsp?colour=colour&time=history%2Fnat%2F2019011620190122&step=1&map=maxave&period=daily&area=nat

    Note the two brown additions to the top of the temperature scale.

    Ifyou have to extend your scales upward, then something more than normal weather is going on.

    • Wade Williams says:

      You’re telling me no temperature records were ever established or broken before 1940?

      • Stephen P Anderson says:

        No, he’s telling you ancient scientists (pre 2000) didn’t know how to use thermometers. All of their data has to be “adjusted.”

    • Ken says:

      I live in Perth, and the last few summers have all been like this..cooler than in the 1990’s where we had record high temps and heatwaves that lasted for weeks. The question I often ask of that recent ‘dramatic heatwave’ that crossed the country, is how did they measure it? More homogenisation? There are few weather stations in the northwest across to the south east due to lack of civilisation. The reason there is a lack of towns in the centre is, that in summer, it is always extremely hot in those places. Understandably if the prevailing winds are from the right direction it will carry that heat through to the coastal cities. The only thing that controls this from happening regularly, is prevailing weather patterns around those Eastern cities. So yes, it’s weather.

      I have worked at oil rigs in communications, and have experienced working in 48c heat, I’ve also been on site and been barred from going outside to work due to extreme heat (above 52c). But of course, according to the BOM, there are no temperatures like that because its not official.
      Jo Nova an Australian science presenter has a blog site that well covers the antics of the BOM, she and others have been cross checking newspaper archives and comparing the figures with the BOM website, discovering many alterations of observations. This is not science.

  4. ken says:

    Here in Canuckistan we are getting record cold. It too is being blamed on global warming.

    I’m beyond fed up with the nonsense of any weather event being blamed on global warming. Its the weather, stupid.

    People won’t get over the global warming hysteria until the continental ice sheets push us into Mexico (if we can get across the wall).

  5. David Jung says:

    Afternoon temperatures at Bourke, NSW this month have averaged 4C cooler than January 1896, with every day since January 4 cooler than 1896.

    https://realclimatescience.com/wp-content/uploads/2019/01/JanuaryDailyMaximumTemperaturesAtBourkeNSW1_shadow-1.jpg

  6. Harry Cummings says:

    Unfortunately BOM have a record of not being the most honest broker in town. Dr Jennifer Marohasy has had a go at them a number of times

    Regards
    Harry

  7. Nate says:

    At least we’re hearing about extra hot as well as extra cold places!

  8. Chris Warren says:

    Roy’s post is misconstrued.

    A record is a record – full stop, and climate change is reflected in changed weather – particularly the frequency of extreme events.

    Global warming increases evaporation which leads to greater rainfall.

    Australian data shows this clearly since 1900.

    http://www.tinyurl.com/BOM-climate-change

    Rainfall is increasing at trend of around 3 inches per century.

    There were no instances of rainfall over 600 mm/yr before the Second World War but at least 5 since.

    Marohasy keeps trying, but to no avail.

    • Bob Fernley-Jones says:

      Chris, that’s a simplistic argument to show the map for the whole of Australia because it includes the monsoonal north. Isn’t it true that around the globe, monsoonal activity is historically known to be irregular and even as recently as about 500 years ago the Khmer civilization collapse has been attributed to prolonged regional failure of monsoons.

      If you click on the menu you linked, other regions are much flatter since 1900, even trending slightly negative in the southeast, and -11.45 mm/decade in the southwest.

      Quite apart from that, periods of high temperature are associated with drought as a consequence of reduced or zero evapotranspiration (evaporative cooling)

      • Chris Warren says:

        Bob

        Monsoonal events are affected by climate change – so have to be included.

        Why focus on “other regions are much flatter since 1900,” which is false – Northern Territory is much, much steeper. You have to use the average of all “ups” and “downs”.

        There may be an evaporative cooling effect, but where is their evidence and is the magnitude relevant?

        • Bob Fernley-Jones says:

          Chris,

          I think other readers here will understand my point even if you choose not to

          • Ken says:

            Yes Bob, we do understand. That graph is unfit for any purpose, especially to make a point on Australian climate. Tully in Queensland has an average of over 4,000mm per year, (with a March average of 752mm).. in 1950 it recorded 7,900mm (the record for Australia).. In 1893, Crohamhurst Queensland recorded 907 mm of rain in one day, other areas receive no rain for years and then get inundated by rain bearing depressions from ex cyclones. I believe the ‘monsoon’ that created the recent floods was also the ‘tail’ of a cyclone that never fully developed. This along with the direct effect of monsoon rains and even droughts created by El Nino, La Nina events.
            Areas around Perth WA are steadily declining in rainfall and I do not know of any regions in WA that are increasing.
            The single biggest issue with these averages is the number of weather stations in existence prior to the 1940’s and the number that have made a more recent appearance, The BOM are taking readings from old and new stations and applying averages to areas that never had any observations of their own, and even altering observations of those that did. Not surprising that all that homogenised data, has managed to reverse a flat and even some negative temperature trends, to obvious warming trends.
            The Perth ‘official site’ has moved a number of times, from the top of a hill overlooking the river, to within 150 metres of the river directly ahead of the breeze that comes in over the river every hot summers afternoon, to the middle of the cbd and then five km inland to central suburbia. What hope of an accurate record?

          • Svante says:

            Ken says: “What hope of an accurate record?”

            Here’s a great way to handle those problems:
            http://tinyurl.com/h5z2vkx

          • Dr Roys Emergency Moderation Team says:

            Svante, please stop trolling.

    • ianl says:

      Why pick 1900 as a start point ?

      Cherrypicker Warren at it again.

      The hot January weather in SE Aus was weather. If you insist it was “climate change” you need to drop the “GLOBAL” meme from AGW.

  9. Jeff says:

    “The BOM announcement mentions record no less than 28 times but nowhere (that I can find) in the report does it say just how long the historical record is. My understanding is that it is since 1910.”

    I think it just depends on each location.
    For a few locations the record goes back to the 1880s.
    Others don’t start til the 1970s.
    Often there are gaps in the recording.
    It is very rare to find a continuous long recording for one particular weather station ID.

  10. geeaye says:

    This is the common defintion being applied here

    record:a thing constituting a piece of evidence about the past, especially an account kept in writing or some other permanent form.

    So if records started yesterday then today will be a record high or low. Speculating about whether it was warmer or cooler during any other time period is spurious since they are not a part of the record.

    Which is to say, “So, of course, we have no idea what previous centuries might have shown for unusually hot summers. “, is bunk.

  11. Mike Flynn says:

    Thanks Dr Spencer.

    As far as I know, the BOM method of recording temperatures did not comply with WMO guidelines, at least up until late 2017.

    The BOM appears to have been technically incompetent, at least in the information provided to the public and researchers.

    The BOM quickly issued at least one heavily corrected document, after factual inaccuracies, and misleading information (either intentionally or due to ignorance) was pointed out.

    However, the fact that the BOM apparently believed their own nonsense for a number of years, makes reliance on any temperature readings derived from electronic sensors and associated circuitry, irresponsible, if used for any purpose requiring reliability and accuracy.

    In relation to accuracy, from the BOM –

    “Individual AWS digitisation modules were tested in the metrology laboratory on occasion but as with the in-glass probes there is an assumption that the combined resistance- digitisation temperature measurement tolerance of 0.5 C is a sufficient test for these thermometers.”

    Hopefully, the BOM has moved on from assumptions.

    The BOM is on record as changing its story when faced with documentary evidence of fabrication.

    The BOM claims official records prior to 1910 are unreliable for a number of spurious reasons.The BOM claims official records to date are reliable, when by their own admissions, the BOM instituted procedures to alter inconvenient cold temperatures to something more in line with expectations. Presumably all in the interests of science.

    Believe them at your peril.

    Cheers.

    • Ross Brisbane says:

      Slandering BOM to prove your stupid denail.

      • Mike Flynn says:

        RB,

        I assume you are disagreeing with me about something or other. Maybe you could be a little more specific?

        I also assume you mean denial rather than denail. What is it you think I am denying, or do you just throw pointless words around, in an attempt to be gratuitously offensive?

        I generally decline to take offence without good reason, and you have given me none so far.

        Carry on – a fact or two might help.

        Cheers.

        • Ross Brisbane says:

          BOM is respected. Your post is obscene. This is simply not true of BOM. They have been investigated and found reliable by an Australian Senate Enquiry. But go on spread keep up the lies and some of our lying fellow Australian deniers here.

          • Mac says:

            I’m afraid that Mike Flynn is correct….just google
            “BOM falsify temperature readings” for reports….

            It is well known that there are a number of Australian media outlets which push AGW, such as the BOM, the ABC and the Melbourne AGE…

          • Nate says:

            While you’re at it, Google ‘Flat Earth Evidence’.

          • Dr Roys Emergency Moderation Team says:

            Nate, please stop trolling.

  12. Charles Lever says:

    Slandering the BOM is no substitute for evidence.

    No comment from Mike Flynn was accompanied with any reference or citation.

    0.5 C may well be a sufficient test.

    So it is Mike Flynn who is “technically incompetant”

    • Mike Flynn says:

      Charles Lever,

      I assume you are disagreeing with me about something?

      What, in particular? What efforts have you made to satisfy yourself as to the veracity of my statements?

      Presumably none, but feel free convince me otherwise.

      I assume that if the BOM didn’t want to be quoted, they woukdn’t publish the following –

      “One aspect of the system unchanged over the past 100 years is that the Bureau does not calibrate SAT thermometers. Instead their outputs are assumed to be in the relevant temperature scale (Fahrenheit or Celsius) within prescribed tolerance limits.”

      No calibration. Assumed to be correct.

      You were blathering . . . ?

      Cheers.

    • Nate says:

      Mike doesnt get that his critiques, if legitimate, cannot be taken seriously.

      There is just too much ad-hom nonsense in his regular posts.

      The signal cannot be separated from the noise.

  13. Joe says:

    It’s just about the peak of summertime in Australia. Why is this constantly omitted in the articles?

  14. Ross Brisbane says:

    This the most complete nonsense I have ever seen written by Dr Roy Spencer it is ridiculous and sublimely stupid of him to selectively choose a graph and make false misleading conclusions about Queensland Australia. I live here in this state. I have lived here for over 60 years from a young child till now. I have never seen weather this bad, this extreme and this hot since my early days of childhood going back to 1958. We have never had hot summers this extreme. We’ve had heat just below 50 degrees in the desert parts of Queensland. We have had extreme heat buildup like a bubble in Central Australia and spread out. BOM just is grasping at the extreme increasing temperatures of heat in the summer periods in our hemisphere. This American so called scientist has no idea in hell about the hell that we are going through at the moment in the state of Queensland. We have had a monsoon break all records of rain in the northern part of Queensland in the last two weeks since records began since occupation. Increased precipitation has been caused by the extremely hot seas off shore North Eastern of Australia. It is the only thing that has cooled down the state of Queensland in areas where heat records have broken one town after another. This monsoonal trough after all the record downpours releases heat buildup from the extreme dry soil conditions. Dr Roy Spencer is clueless and it’s a bit rich for him to be talking about Australia like this to prove his stupid silly points about non climate change and his denial goes to the high heaven of absolute stupidity. Like his stupid cohort Christy they deserve nothing but contempt from from we the citizen scientist as well the scientific community. The silly religious wingnut conservative stand on climate change. They drink their own self made cool aide as do many climate change deniers. History will judge these men very harshly. I think the creator will as well.

    • Bob Fernley-Jones says:

      Really?

      For a start, you might get a surprise if you open this BoM record for maximum mean temperature for January in Queensland. It was hotter four times as far back as 1947:

      http://www.bom.gov.au/cgi-bin/climate/change/timeseries.cgi?graph=tmax&area=qld&season=01&ave_yr=0

      Check the menu for December. You are even further away from reality according to the BoM’s homogenised data. It has been quite equable as far back as 1937 in Queensland in terms of maximum temperatures

      I cannot be bothered with the rest of your rant

      • Ross Brisbane says:

        Sustained heat not max recorded. The heat is record breaking it is sustained and if you do not live stop looking at stupid cherry statistics. Actually your wrong dead wrong

      • Mike Flynn says:

        Bob,

        I was about to warn you about the wrath of the cultists.

        However, I discovered that they ran 300 computer models to design their torches and pitchforks.

        What were actually manufactured were a quantity of tealights and tuning forks. According to the modelling cultists, this was close enough. A rapid response group is being formed, and reports will be presented for consensus by climate scientists (or pseudoscientific posers, whichever occurs first).

        After the consensus, and arguing about colours and quantities, the mob will fly off at various tangents, while attempting to throw each other under the closest passing bus.

        Keep calm and carry on. The predictions of imminent doom by boiling, frying, roasting or toasting, appear to be greatly exaggerated.

        Cheers.

      • Chris Warren says:

        Bob Fernley-Jones

        While a picked year for a Queensland January was hotter in the past – this is not the point. The BOM statement did not restrict itself to Queensland.

        It is possible that every single state had hotter periods at some time since 1900, but you have to pick different years each time.

        This is unacceptable. The BOM statement refers to a single year across Australia as a whole.

        • Bob Fernley-Jones says:

          Chris,

          I was responding to Ross Brisbane’s:

          …I have never seen weather this bad, this extreme and this hot since my early days of childhood going back to 1958. We have never had hot summers this extreme. Weve had heat just below 50 degrees in the desert parts of Queensland…

        • Mike Flynn says:

          CW,

          If you find it unacceptable, don’t accept it.

          Do you expect anyone to care? Maybe you are more important than I thought, but then again, maybe not.

          You tell me.

          Cheers.

    • An Inquirer says:

      Ross Brisbane,
      You have been around for 60 years, and that is a long time. However, you were not around in the late 1800s when temperatures were hotter in Australian than they are now.

      I have been around for almost 70 years, and my family has tracked temperatures for about 100 years. I remember more heat waves in years gone by; our temperature data base agrees with my memory. I also checked out farm records with local weather stations, and those records agree.

      Personal experience is not proof on the CAGW issue, but neither is it to be tossed out without consideration.

  15. David Jung says:

    Heres temperature data from 1896 and a news article documenting hotter temperatures. The current heat is not unprecedented. BOM is cherry picking the data to brainwash you poor sods.

    https://realclimatescience.com/wp-content/uploads/2019/01/JanuaryDailyMaximumTemperaturesAtBourkeNSW1_shadow-1.jpg

    https://realclimatescience.com/wp-content/uploads/2017/06/Image777_shadow.png

    • Ross Brisbane says:

      That’s NSW Jung head. Bats fell in thuosands and died. Suspect the environment is getting hotter. Reef.
      , right through to rain forests the evidence is wide spread. Our climate here is getting hotter and drier. Cherry picking a date is not climate change. That is weather. Sustained seasonial chandes over multiple years is climate change. Yours is present denial of reality

      • Bob Fernley-Jones says:

        Here oh wise one is an extract from The Settlement at Port Jackson, by Watkin Tench (1793)

        An immense flight of bats driven before the wind, covered all the trees around the settlement, whence they every moment dropped dead or in a dying state, unable longer to endure the burning state of the atmosphere. Nor did the perroquettes, though tropical birds, bear it better. The ground was strewn with them in the same condition as the bats.

        https://ebooks.adelaide.edu.au/t/tench/watkin/settlement/chapter17.html

        • Bill in Oz says:

          With any luck the continued hot weather will wipe out a few more thousand more of the flying foxes ( humungous bats ! )

          We certainly need it in South Australia where thye are not native and have never been present until a colony flew over around 2008 to much rejoicing from some dopey conservationists.

      • PhilJ says:

        Ross,

        ‘Our climate here is getting hotter and drier’

        perhaps its getting hotter because its getting drier?

        Water cools the surface…

  16. Ross Brisbane says:

    Sustained heat not max recorded. The heat is record breaking it is sustained and if you do not live here stop looking at stupid cherry statistics. Actually your wrong dead wrong

  17. Ross Brisbane says:

    That’s NSW Jung head. Bats from heat fell in thousands and died. Suspect the environment is getting hotter. Reef right through to rain forests the evidence is wide spread. Our climate here is getting hotter and drier. Cherry picking a date is not climate change. That is weather. Sustained season shifts and changes over multiple years is climate change. Yours is present denial of reality Inreaased rains cyclones all evidence of tropical north hot seas

    • Bob Fernley-Jones says:

      Here oh wise one is an extract from The Settlement at Port Jackson, by Watkin Tench (1793)

      …An immense flight of bats driven before the wind, covered all the trees around the settlement, whence they every moment dropped dead or in a dying state, unable longer to endure the burning state of the atmosphere. Nor did the perroquettes, though tropical birds, bear it better. The ground was strewn with them in the same condition as the bats…

      https://ebooks.adelaide.edu.au/t/tench/watkin/settlement/chapter17.html

  18. Ross Brisbane says:

    I suspect this site attracts wing nuts

    • Mike Flynn says:

      Away with ye, loathsome troll.

      • Ross Brisbane says:

        I learnt a long time ago…about 10 years. This is a true thing. You are the real troll fella. You seriously think you are winning the war with this stuff. You are not only misinformed and selective, you are delusional.

        Quoting random heat things. This aren’t random my state is experiencing progressive non gap unrelenting progressive sustained milder climate state to a much hotter extreme climate (effects on coastal devastating heat and downpour (metrological river events) hot offshore seas Eastern, coral bleaching constants year after year and stuck El Nino type condition.

        We do get heatwaves but nothing like this. Time to roll over fella and let the young generations decide.

        • Mike Flynn says:

          RB,

          I suppose, given the opportunity, you might let me know what you really think.

          Take 10 years, if you think you need it. I can wait.

          Cheers.

    • Nathan says:

      Hi Ross

      This blog does attract RWNJ
      Look closer at his colour scheme above, as the blue colours only go down to -3 (and none on the map go below -2) but the reds go all the way up to +7, he’s just done a trick to make the area around Australia look cooler. If he’d used only blue colours down to -7 you’d hardly see any blue on the map (it would be very pale).

      So it’s all bluster as usual.

      • Ross Brisbane says:

        He (Roy Spencer) also cherry-picked that show Monsoonal cool-down for the far Northen regions of Australia. This was after unrelenting heat sustained in record anomalies over a prolonged record period.

        Record evaporation through sustained record heat waves in the outback had decimated the cattle industry. The whole state of QLD was literally under-water about a decade earlier. We had cyclones of unusual increasing intensities comparable to the early century one-offs. Coral bleaching is severe to the North. It happens mainly when offshore shallow seas build up too much heat.

        The deniers here are conflating single day recording (which induct noise) and complete their misunderstanding of climate change patterning these with BOMs temperature back in time. The record-breaking statements from BOM are absolutely true.

        Roy Spencer is always conflating single day statistics or centering on particular even peculiar event anomalies in data.

        All he is doing is using noise within the data record and proving a very weak theory of his. It gets weaker as the decades roll on.

        I think after reading his material over the last decade, he is conflating his own conservativism with his theories and trashing anything spoken or implied as coming from the liberal political spectrum. It is a faith bias created within his own biased enculturated American Baptist organization. There are many variants of Baptists in the US.

        His theology along with Christy’s is terribly constructed and misconstrued. There are far too much enculturation and localization issues within their belief system. I can’t tell whether they are 7 literal day creationist or 7 eon event summaries of Genesis. (eon – Hebrewic derived is the correct translation of a 24 literal day within the Genesis account. It means a remarkable duration of time span. (7 eons). This very theology would greatly affect the idea that mankind’s contribution is of no consequence to global warming.

        Coal once raised the standards of millions of people. It also killed millions of people in its dirty process in becoming much cleaner to burn through technology but not clean enough to stop rampant global warming through CO2 emissions. It is right here. Their DENIAL is a wanton disregard for others in their community of fellow scientists, mankind and their own pet theory on Global Warming. Their idealization of economics carries great weight in their policy setting and presentation to Congress. I have followed their statements carefully in the hearing before Congress.

        • Mike Flynn says:

          Ross Brisbane,

          You don’t appear to be able to find a testable GHE hypothesis, or even a useful description of the GHE.

          You are perfectly free to hew to your particular fantasy.

          All the GHE theology and unquestioning belief in the world, plus $5, will usually be enough to buy a cup of coffee.

          If you want to convince scientists, you might have to throw in a few tit-bits of science. Otherwise, they might conclude that you are merely a stupid and ignorant GHE true believer. Up to you, I suppose.

          Cheers.

  19. Mike Flynn says:

    From the BOM, relating to Surface Air Temperature measurements –

    “The current SAT network uncertainty does not meet WMO guidelines for realisable uncertainty.”

    So much for complying with world standards.

    And –

    “Since 1938, the metrology and transfer standards related to national standards of measurement have improved by an order of magnitude.”

    Hopefully, nobody actually depends on records prior to 1938, as they were an order of magnitude worse than now.

    It might seem to some that records prior to 1910 are unreliable, records prior to 1938 are inaccurate, and records since then use uncalibrated thermometers, which are assumed to be accurate enough – for something. Certainly not for predicting the future.

    Cheers.

    • Myki says:

      I know it must pain you to do so, but could you at least provide a link to the supposed quotes by BoM.
      That is the usual practice when engaging in a scientific discussion.
      (Or am I being too generous in assuming you can participate in such a discussion?)

      • MIke Flynn says:

        M,

        Why should I do your work for you? If you are too stupid and ignorant to spend a minimum amount of time to do your own research, why imply it is my fault?

        What effort have you made? None?

        About what I would expect from a witless Warmist

        Off you go now. Its not really that difficult for a person of normal intelligence. Take more than 30 seconds if you can spare the time.

        Cheers.

        • Myki says:

          In that case I must assume your quotes are simply fake.
          Why should I, or anybody else, believe the dribblings of a senile old denialist ?

          • Mike Flynn says:

            M,

            Assume what you must.

            You may believe what you wish.

            Neither the facts, nor I, care what you assume or believe. So sad, too bad.

            Cheers.

  20. Nathan says:

    Your colour scheme is an unusual choice, certainly sea temperatures were lower than average around Australia, but they’re not comparable to the land temps that were above average.
    the sea temps were between 0.5 and 2 degrees lower, whereas the land temps were from 0.5 to 7 degrees warmer.

    You should adjust your colour scale and remove the green colours. Otherwise your colour scheme gives a false impression.

    • MIke Flynn says:

      N,

      Which graphic are you referring to? The one from the Bureau of Meteorology, or that from WeatherBell.com?

      Have you complained to either organisation, or are you just trolling?

      Cheers.

      • Nathan says:

        The second one in the original blog post.

        • Nathan says:

          It doesn’t matter who made the figure, it is deceptive the way it’s constructed.

          • Mike Flynn says:

            N,

            Maybe you should let WeatherBell.com know what you think.

            With any luck, they will pay as much attention to your comments as I do.

            Complain away.

            Cheers.

          • Nathan says:

            So I went to that websitee and it wasn’t there. There is no version of that map ‘on the website’ I assume you need to put in a data request? In any event it’s a terrible map and you should understand how deceptive it is. It’s amusing that your answer is to just brush it off as and I don’t care.

            Not very skeptical are you?

          • Mike Flynn says:

            Nathan,

            Are you really blaming me because you are too incompetent to complain to the authors of a graphic you dont like?

            I am glad you are are amused that I dont care whether you complain or not. I am not aware of any adverse side affects from being amused.

            In order to be of assistance, here is more amusement for you – I do not care about your complaint, and I do not care about your opinions.

            If you want to be amused even more, please let me know. I am here to help.

            Cheers.

          • Nathan says:

            I don’t know who posted it here. But clearly the image is deceptive, and clearly you don’t care.

            Probably because you’re more interested in promoting your agenda

          • Mike Flynn says:

            Clearly you are a witless troll of the deluded Warmist variety.

            Begone, troll.

  21. Ross Brisbane says:

    The TRENDS are unmistakable.

    http://www.bom.gov.au/climate/change/?ref=ftr#tabs=Tracker&tracker=timeseries&tQ=graph%3Dtmean%26area%3Daus%26season%3D0112%26ave_yr%3D15

    BOM was held to inquiry by Conservatives within the Conservative-Liberal Party Abbott the then Prime Minister (President equivalent) who was a stated climate denier lead the charge due to misleading press releases by Murdoch’s (News Corp in THew Australian) – Aka Fox Network USA – the self-proclaimed judge and jury of everything but is the true experience of “Newspeak” for our century. It is propaganda and fake news.

    Here are results of that finding on BOM:

    https://www.abc.net.au/news/2015-09-24/government-discussed-bom-investigation-over-climate-change/6799628

    As you see here all do is join in the choir and chirp along. I am not patting him on the back (Mr Roy Spencer). You deniers are all are just doing a Dorothy Dicky thing around here on Forum singing in his choir. I for one do cheer this site on. It contains far too much misleading and selective information. It cannot be relied upon to tell the WHOLE truth.

    I lost trust in this site some ten years ago about not telli’ the whole truth and nothin’ but the truth.

    • Mike Flynn says:

      RB,

      I suppose you are stupid and ignorant enough to believe you can predict the future by intensive examination the past.

      Nope. Won’t work. Prayer is just as effective – maybe more so.

      Maybe you are confusing assumption with prediction. As in assuming the Sun will come up tomorrow. Assuming you will still be alive tomorrow, and so on.

      If you do manage to crack the problem of reliably predicting the future, you will become fabulously wealthy. Then you can laugh at me – just as I laugh at you at the moment.

      Remember, he who laughs last, laughs best. Maybe you can get a few tips on predicting the future from the BOM? That sound you heard was me laughing (just a little. I couldn’t help it.

      All part of the rich tapestry of life, eh?

      Cheers.

    • Bart says:

      Nobody disputes that temperatures have warmed around the globe in the past half century, Ross. The question is, why?

      Putative warming from CO2 is supposed to be global, and your little corner of the world is only a fraction of that area. Moreover, this episode is just a blip in time. It really does not tell us anything about the legitimacy of the AGW models.

      Just because you hear noises in the night does not mean there are monsters under your bed.

  22. Myki says:

    The area of Australia is about 7.7 million square kilometers !!
    The warm temperature anomaly extends over about twice this area taking the oceanic values into account !!
    The time scale involved is at least a month long.
    To describe this as merely “weather” is not very convincing.

    Secondly, you can try and deny the legitimacy of the BoM temperature records till you are blue in the face.The fact is that the heat wave is the worst in living memory for many elderly Australians. It certainly was for the now deceased long-lived inland fish species who lie rotting along the major rivers.

    Really, ignoring significant extreme events like this is akin to ticking your head further and further into the sand. It really is petty. Why? Because the next bit of regional, short-lived cool weather will be jumped on by deniers as evidence that the globe as a whole is not warming.
    You cannot have it both ways.

    • MIke Flynn says:

      M,

      Why do you think the BOM are publishing falsehoods in their official publications?

      I have no reason to doubt the BOM is telling the truth.

      Do you the think the BOM is telling lies under the influence of Big Oil? Maybe you are really stupid and ignorant, rather than just pretending to be stupid and ignorant.

      Do you understand the difference between climate and weather? Climate is the average of weather over a notional period, often 30 years. Nothing more, nothing less.

      Have a try describing the weather of Australia in objective numerical terms, and quantify the difference between now and 30 years ago. Or you could grow wings and fly to the Moon, if you think that would be easier.

      Or just keep dreaming that increasing the amount of CO2 between a heat source and a thermometer will make the thermometer hotter!

      Cheers.

  23. Ross Brisbane says:

    I emphasize once again despite this bullshit coming from the denier mob madness that seems to inhabit these spaces on the internet, the BOM Australia data is rated as ONE OF THE BEST in the WORLD!

    This is a direct quote from a declassfied document after a “witch hunt” was carried as to the reliability of Climate data that would suggest OB JECTIVe evidence of real trending climate change in Australia.

    • Mike Flynn says:

      Ross,

      Maybe you could provide some quotes from official BOM documents to contradict the quotes from official BOM documents which I have provided?

      Or are you blaming me for the language that the BOM uses in their official documents?

      It’s not my fault the BOM says what it does, is it?

      Who cares?

      Cheers.

    • JDHuffman says:

      Ross, Austrailia is setting records for high temps, while other places on the globe are setting records for cold temps.

      Australia has an enormous population of kangaroos. The other places do not have kangaroos. The correlation is pretty evident, huh?

      And, the “causation”? Roos exhale CO2.

      Case closed.

      The solution is obviious.

  24. Charles Lever says:

    It would help clarify things if those running the denial agenda, produced competent evidence. So far Mike Flynn has produced nothing but an amputated quote he did not understand.

    The BOM record was cited in specific terms, but so far all the denialists have invented different terms, either different regions, or different years.

    Plus are fair amount of partisan slander against the BOM.

    You can lead denialists to science but you can’t make them think.

    • JDHuffman says:

      Charles, I just checked with “those running the denial agenda”, and they report that the competent evidence is already out there. It’s “hidden” in full view.

      1) CO2 can NOT warm the planet.
      2) The Alarmist models have been consistently wrong.
      3) Even with a 25-year warming trend, and following a super El Niño, January was only 0.37, and the average is only 0.13. Hardly alarming.

    • Mike Flynn says:

      Charles Lever,

      Here is your opportunity to provide an explanation of the GHE, supported by a testable GHE hypothesis.

      A true believer such as yourself would, of course, have such basic scientific knowledge at this fingertips.

      No need for links, just copy and paste (unless you are too lazy, ignorant, or stupid to understand how to do it).

      How hard can it be?

      Only a pseudoscientific foolish Warmist would believe in a GHE that does not exist. Surely you are not one of those stupid and ignorant fools, are you?

      Cheers.

  25. David Jung says:

    Ross Brisbane, No reason to insult people on this site. We are only trying to present BOM data to you that shows the current hysteria you seem engulfed in is unfounded. Where I live, it was -24 degrees F last week. Quite frankly, I hope all of you in Australia, spend a fortune installing solar panels on your homes, build thousands of windmills, and purchase electric cars. That just means more affordable, clean, and efficient fossil fuel energy for us in the States. More jobs, more competitive companies and a better standard of living for my children.

    Cheers Mate!

  26. David Jung says:

    Ross Brisbane, BOM starts all their imaginary global warming graphs in 1910 so the sheep dont see the steaming hot temperatures that existed in the late 1800s. Why? Because it would wreck their man-made global warming scam. But, hey, its your country and your money. Go crazy with all the solar and wind power and good luck. See Germany for a preview of how thats going to workout.

    Please dont export your stupidity. We dont want it.

  27. jg says:

    This blog entry is a simple restatement of the scientific “evidence” provided by the tobacco industry (plus leaded gas industry and others):

    Since no one can predict the specific day and specific diagnosis of a particular smoker’s death, say “Fred” the 2 pack a day smoker, science cannot say tobacco causes cancer.

    Dead Fred = weather
    Tobacco smokers as a population = climate

    Anyway, at best, scientifically wrong-headed then, scientifically wrong-headed now. At worst, simple intentional disinformation both times.

    • Nate says:

      Well put, jg.

    • Bart says:

      Yeah…. no. It’s more like the mirror image. The big financial interests here are decidedly on the warmist side. Big Wind and Big Solar are despoiling the environment, and making money hand over fist selling virtue-signaling devices that produce a pittance of intermittent and unreliable power.

      Alarmist scientists are building empires, jetting to exotic locales ostensibly to share information over Mai Tais in luxury resorts, and enjoying the encomiums of the adoring (and scientifically illiterate) press corps.

      And, politicians are greedily rubbing their hands at the prospect of taxing the peasants for the very air they breathe.

      The Tobacco Institute demonstrated that scientists are not a preternaturally honest group with superhuman objectivity, but can be bought and paid for. Res ipsa loquitur.

      • jg says:

        3 points…

        1. The amount of money on the fossil fuel side denial side of the issue compared to the amount of money on the scientific side isn’t even close by orders of magnitude. Try living for a decade or two on a scientist’s salary working scientist hours and see how rich, and drunk at expensive resorts, you get. And that doesn’t even count the decades in training at negative or minimal income. You are simply clueless about this issue. Dr. Spencer could set you straight here should he desire.

        2. The “researchers” on the science denial side of tobacco were not, in general, expert scientists with substantial publication histories in public health issues. The Tobacco Institute was not a science institution publishing professional level research in mainstream science sources. Sound familiar?…You see people can be bought to publish in vanity journals and special interest sources, but getting such papers through peer review in professionally respected sources is MUCH more difficult.

        3. Don’t know about “taxing the air we breathe” but I do know about using the atmosphere as a free dump. Google “tragedy of the commons”.

        • Bart says:

          1) Correct. The money on the alarmist side absolutely dwarfs that on the realist side. The government windfalls are spectacular. Even the oil companies are subsidizing the alarmist side.

          You’re telling me Michael E. Mann, Director of the Earth System Science Center at Penn State is a pauper? James Hansen, recipient of tens of millions of $$$ in prizes and grants, is down and out? Sorry, dude. That dog won’t hunt.

          2) Meh. “Experts” judging each others’ expertise. Nice work, if you can get it.

          3) CO2 is not a pollutant. It is vital for life. If anything, we’re on the low side.

        • Nate says:

          Bart lives in an alternative universe, where we all have goatees, renewable energy is evil and more polluting than coal, where the energy produced is not profitable nor useful, where scientists get richer in proportion to the warming they find.

          Its a weird mirror universe of the one we live in.

    • Nate says:

      ‘Yeah…. no. It’s more like the mirror image.’

      And you didnt grasp his entirely valid point at all, you just changed the subject.

    • Mike Flynn says:

      jg,

      More stupidity and ignorance? Tobacco? Smoking?

      Provide a scientific definition of the GHE, and provide a testable GHE hypothesis.

      It is the starting point for scientific investigation. Part of the scientific method.

      You can’t do it of course, because you follow pseudoscience of the climatological type.

      Only a blithering idiot would believe that increasing the amount of CO2 between a heat source and a thermometer would make the thermometer hotter.

      Would you as willingly believe that moving the thermometer halfway through the CO2 (having the amount), closer to the heat source would make it colder? Really? Maybe you truly believe that moving away from a fire makes you colder, but I dont think even you could be that stupid and ignorant.

      Correct me if I am wrong about your stupidity and ignorance.

      Cheers.

      • jg says:

        Dr. Spencer has made it clear on many occasions he is not a greenhouse effect denier. While many, including me, disagree with some of his assertions, he simply has never made that one nor would he. In point of fact no actual, practicing and published scientist since a decade or two after the Civil War would make such an assertion.

        As for experimental “PROOF”!!!… Do tell us your experimental PROOF of how scientists think that stars are (mostly) giant balls of fusing hydrogen at great distances. Only experimental proofs are allowed.

        • Mike Flynn says:

          jg,

          Go for it. Deny, divert, confuse.

          How are you going with GHE science? Not well, I know.

          That’s because there isn’t any!

          You are stupid and ignorant enough to demand experimental proof of something quite unrelated, but no matter. Science doesn’t work that way.

          As Einstein said –

          “No amount of experimentation can ever prove me right; a single experiment can prove me wrong.”

          Trot out your non-existent testable GHE hypothesis, and it can be tested.

          Carry on blathering about your pseudoscientific climate cult, if you wish. Facts outweigh fantasy, so you are still stuck in your imaginary world of CO2 magic. I wish you well.

          Cheers.

          • jg says:

            So your EXPERIMENTAL proof that stars are giant balls of fusing hydrogen at great distances is…??? No answer??? I thought not as the only PROOF is, er, well, nonexperimental, “fantasy” models. Many sciences cannot use experimental methods. Tobacco and cancer is another as I mentioned earlier.

            Re. Einstein: It’s always quite comical that greenhouse effect deniers delight so much in giving sophomoric lectures on the scientific method to professionals!

          • Mike Flynn says:

            jg,

            What have stars and tobacco to do with the fact that no GHE explanation or testable GHE hypothesis exists?

            If you don’t like what the Nobel Laureate Einstein said, try another Nobel Lareate, Richard Feynman (yes, I know, using authorities, but foolish Warmists love ’em) –

            “It doesn’t matter how beautiful your theory is, it doesn’t matter how smart you are. If it doesn’t agree with experiment, it’s wrong.”

            Pseudoscientific climatological types cannot even come with a testable GHE hypothesis, let alone a GHE theory.

            Are you as stupid and ignorant as you make out, or merely pretending? Was your path to becoming a professional foolish Warmist taxing, or did you emerge at the top of the class?

            Maybe you could try using all caps in your comments. Even better, make that all bold caps!

            What do you think? Actually, I do not care what you think, so you could save yourself the effort of responding, if you want to. Your call.

            Cheers.

          • jg says:

            Nice to see you have no answers and exhibit no real understanding. Of course that was obvious from the beginning.

            Stars really are, very likely, giant balls of fusing hydrogen at great distances even though there is zero experimental proof. The idea is indeed not testable given present tech. And yes, this fact is, in fact, related to your completely wrong notions about what science is and is not.

        • Mike Flynn says:

          jg,

          You wrote (apparently not realising that astronomy is science, unlike climatology, which is not yet quite up to the standard of astrology) –

          “Stars really are, very likely, giant balls of fusing hydrogen at great distances even though there is zero experimental proof.”

          Indeed. There are theories, not yet capable of experimental disproof. At one time, John Tyndall theorised that the heat of the Sun was due to meteoric bombardment, as there was no other reasonable explanation. Tell me why you think his explanation was incorrect, if you can.

          However, experiments have been carried out with thermonuclear reactions, both in hydrogen bombs, and slightly less spectacular things like Tokamaks, and the Farnsworth Fusor which can sit on your tabletop.

          What part of hydrogen fusion are you saying has not been confirmed experimentally?

          Theory, backed by various observations, supports the speculation that stars are powered by thermonuclear reactions. Who really knows?

          Of course, by now you will have discovered that there is no useful description of the GHE, and precisely no testable GHE hypothesis. Whether you acknowledge this or not is irrelevant. Other readers are free to reach their own conclusions.

          Mine is that there is no GHE. increasing the amount of CO2 between a heat source and a thermometer does not make the thermometer. End of story. Believe or don’t – I assume you have no power to change anything anyway, so you are just trolling.

          Cheers.

          • jg says:

            Sorry. Astrophysics is every bit as much a science as climate physics or quantum mechanics.

            BTW, I don’t suppose you know that much of QM has no experimental proof either. It’s rather hard, after all, to randomly assign electrons to treatment and control groups. As such, true experiments are not possible. QM ohysics is based on, wait for it,…models!

          • Mike Flynn says:

            jg,

            What are you babbling about? There is no science of climate physics. Climate is the average of weather. A little basic arithmetic – no science at all.

            You are obviously stupid and ignorant. Science does not use formal proof – that is for mathematics.

            You haven’t specified what you mean by QM, but no prediction made by QED (quantum electrodynamics) has been disproved by experiment to date.

            You are obviously suffering from some form of mental condition or delusion.

            I would be inclined to give you a point for astrophysics, apart from the fact that neither you nor I had referred to it previously. Carry on trying to deny, divert and confuse.

            Still no GHE. No testable GHE hypothesis.

            Off you go now, dream up some more pseudoscientific nonsense. It is quite diverting to watch a bumbling buffoon attempting to defend the indefensible.

            Cheers.

          • jg says:

            Uh, don’t know how to tell you this but there will NEVER be “experimental” proof of anything in quantum mechanics. To have experimental proof requires a Maxwell’s Demon who can randomly assign particles to conditions.

            All such physics is nonexperimental and merely observes whether large numbers of whatever, say photons, are detected arrayed in a certain predicted pattern. There is no experimentally testable hypothesis as there is no treatment particle versus control particle.

            Anyway, GHE denial is simply crankery, so I have nothing much more to say. Tilting at windmills is for Quixote, not me.

          • Mike Flynn says:

            jg,

            I suppose you deny things such as this –

            “Quantum mechanics (QM) is a tool that was invented to explain experimental results. It is nothing more and nothing less than that. The utility of QM is therefore based entirely upon its ability to predict and explain experimental results, and by this measure it is a phenomenal success. There has yet to be an experiment of any type that violates the basic principles of QM.”

            No exceptions. None – to date, anyway.

            Your comment about GHE denial is completely meaningless. You can’t even define the non-existent GHE, can you?

            Run away – quit while you’re behind. Go back to your fantasy. That way, you won’t have to face reality. No GHE. No CO2 heating. Bad luck for you.

            Cheers.

          • bobdroege says:

            jg,

            I can only assume you are unfamiliar with all the double slit experiments that are experimental evidence for quantum mechanics.

            From photons and electrons to phthalocyanine.

            And you shouldn’t put physics after Quantum Mechanics, it’s a big clue you don’t know what you are babbling about.

        • Bart says:

          There is a huge leap between “IR absorbing gases inhibit egress of radiative energy from the planet’s surface” and “combustion of fossil fuels releases latent CO2 into the atmosphere” to “humans are causing catastrophic warming of the planet”. The evidence to date is at best ambiguous, if not outright contradictory.

  28. Chris Warren says:

    JDHuffman is mistaken if they truly believe;

    1) CO2 can NOT warm the planet.

    CO2 warms the planet and this is demonstrated clearly here:

    https://www.youtube.com/watch?v=bX4eOg2LaSY&feature=youtu.be&t=59

    Notice, as others have, that denialists make crazy statements such as JDHuffman BUT never produce any evidence or when they do, they have misunderstood what they cite.

    US scientists were aware of the CO2 effect in the 1960’s but nothing was done.

    • JDHuffman says:

      Chris, you must have searched youtube for something you believed “proved” the GHE. Unfortunately, that video has been debunked long ago.

      Briefly, the flame heats the CO2. The tube has such a high level of CO2 that it can absorb all the infrared, thereby blocking the flame.

      All that is valid, but then reality sets in.

      The flame is warming the CO2. But the CO2 is not warming the flame. The CO2 could not add any heat to the system.

      It’s fun searching youtube, huh?

      • Chris Warren says:

        JDHuffman

        When CO2 absorbs infrared – the CO2 heats up itself. Extra heat is added to the system compared to earlier when more heat escaped to outer space.

        The CO2 is not warming the flame. The temperature of the flame does not change.

        • MIke Flynn says:

          Chris Warren,

          Unfortunately, you haven’t got the faintest idea what you are talking about.

          No extra heat is added to the system. None.

          What you say is about as stupid as saying that you get warmer when you move away from a fire. There is now more CO2 between you and the fire, so by your strange logic, you should get warmer.

          Or, if you move towards the fire (less CO2 between you and the fire) – you believe you will get colder?

          Mindless adherence to the GHE pseudoscientific nonsense is no substitute for fact. You can’t even come up with a testable GHE hypothesis, can you? Not surprising, as you cannot even explain how the GHE is supposed to work, in any way that makes sense.

          You are talking nonsense. Whether this is due to stupidity, ignorance, or both, I do not know.

          Cheers.

        • Nate says:

          Ignore the trolliest troll we have Mike Flynn. There is no detectable signal in his ad hom noise.

          He is too thick to grasp the explanation hes heard many times of the GHE. So he invents his own strawman version.

          • Mike Flynn says:

            Nate,

            An excellent command to the other stupid and ignorant GHE true believers.

            How do you intend to enforce your order? You cannot seem to comply with your own demands – why should your fellow foolish Warmists?

            I wish they would, but I don’t think you engender that much respect.

            I wish you every success. Let me know how you go.

            Cheers.

          • Nate says:

            Mike, your bot-commments about things between the sun and thermometers, have been debunked and proven to be thoroughly dumb dozens of times.

            -a piece of glass between the sun and a thermometer warms it. Done.

            -You stupidly ignore that the CO2 is ALSO between the warm Earth surface and the extreme cold of space.

            Your bot-comments about no GHE ignore the fact that without the GHE weather prediction models would fail to work. The GHE is proven every day. Done.

          • Mike Flynn says:

            N,

            I see you do not intend to follow your own advice. Do you suffer from a lack of self control?

            Howeve –

            – Glass? What is the relevance? None? Done.

            – No I don’t, but you seem to ignore that CO2 works to attenuate energy flows in all directions. Basic physics. Done.

            You still cannot bring yourself to describe this GHE, can you? In any case, numerical weather forecasting methods attempt to use physics, not the non-existent and indescribable GHE. Done.

            No GHE. No CO2 heating. Done.

            Cheers.

          • Nate says:

            “– No I don’t, but you seem to ignore that CO2 works to attenuate energy flows in all directions. Basic physics. Done.”

            Not done, but closer to reality.

            Now add the fact that CO2 attenuates selectively in IR. Most strongly, in fact near the peak of out-going flows.

          • Nate says:

            Mike, mike, mike!?

            Has no response to CO2 selectively attenuates IR, most strongly for outgoing heat.

            Of course not, that wrecks his strawman version of GHE.

          • Mike Flynn says:

            N,

            You are a fool. No amount of CO2 in the atmosphere prevents the surface from cooling.

            It does so every night, and has cooled from the molten state over the last four and a half billion years or so.

            This is why you cannot even define the GHE.

            Want to demonstrate you can? Here’s your chance!

            Only joking, I know you can’t. Nor can anybody else.

            Cheers.

          • Nate says:

            ‘You are a fool. No amount of CO2 in the atmosphere prevents the surface from cooling.

            It does so every night, and has cooled from the molten state over the last four and a half billion years or so.’

            Interesting that when people give the actual science behind the ghe, what you constantly ask for, you are dumb-struck.

            Then you spout declarative dumb statements.

          • Nate says:

            ‘It does so every night, and has cooled from the molten state over the last four and a half billion years or so.’

            Except where you live in the Tropics, where the sun has obviously warmed the Earth.

            What part of that reality do you deny, Mike?

          • Mike Flynn says:

            N,

            You fool. The surface in the tropics is not molten.

            Cheers.

    • Nate says:

      ‘The flame is warming the CO2. But the CO2 is not warming the flame.’

      The experiment is not claiming any such thing, is it?

      Congrats JD, you’re a Ninja strawman killer.

      • JDHuffman says:

        I never said the experiment claimed “any such thing”, Nate. So, you’re the one making up straw men. Just another false accusation from an anonymous coward.

        And, only a 7 minute response to my comment! You’re reallly on guard. Your handlers will be very impressed.

        • Norman says:

          JDHuffman

          https://principia-scientific.org/natural-philosophy-meteorology-climatology-2/#comments

          You claim you are not G.e.r.a.n but on the PSI blog you say the same things you do when you go by “JDHuffman” here. You complain about long comments, consider them rambling. I have been on Climate blogs a long time and you and G.e.r.a.n are the only posters I have ever seen talking about rambling and long posts. Weird that of all the posters one reads on various climate blogs only the two of you say the same things. Also G.e.r.a.n on PSI also brings up identical analogies to the ones you do. About adding ice to a room etc. Weird to have identical posting material yet you both claim you don’t know each other. Why not hook up with g.e.r.a.n. You would find a soul mate in the process. More logical is that you are one and same poster but it is remotely possible you can have two people who post identical ideas that don’t have a clue about each other.

          • JDHuffman says:

            Norman, just keep stalking and rambling. Maybe that will keep you from insulting, making false accusations, and misrepresenting others.

            You certainly have no science to offer.

      • Mike Flynn says:

        Nate,

        Congratulations. You have been convinced that CO2 (like all other matter in the known universe), can be heated by a heat source!

        You may not be aware that O2, N2, dry air (which has been scrubbed free of CO2 and H2O), can all be heated.

        Your ignorant demonstrator could have replaced the CO2 with a piece of cardboard or brass, which will also block and absorb IR, and heat as a result.

        If you believe that increasing the amount of CO2 between a heat source and a thermometer raises the temperature of the thermometer, you are both stupid and ignorant.

        This is why nobody can actually explain how the GHE is supposed to operate, or provide a testable GHE hypothesis. The GHE is a figment of the imagination of pseudoscientific cultists.

        Provide a testable GHE hypothesis, and scientists can test it experimentally. Otherwise, the concept remains a fantasy – one which you appear to share. You support fantasy, I base my opinion on facts.

        No GHE. No gravitothermal effect, Gavin Schmidt is an undistinguished mathematician who thinks that a probability less than that of a coin toss means “near certainty”, and Michael Mann’s claim of winning a Nobel Prize shows that he is either delusional, or stupid and ignorant.

        I’m right, you’re wrong, so sad, too bad.

        Cheers.

    • spike55 says:

      oh dearie me.

      Chris seems to think the atmosphere is a glass bottle.

      Bizarre !!!

      Perhaps that is where he spends most of his time ??

    • Bart says:

      Chris –

      The experiment demonstrates that CO2 impedes radiative transfer. That’s all it does. Nothing else. It does not even begin to demonstrate that CO2 warms the planet under any and all circumstances.

      A carefully controlled lab experiment over an enclosed, compact, non-circulating volume does not even come close to replicating the climate system of the Earth.

  29. Mike Roberts says:

    Even the UN IPCC admits some of the warming since the 1950s could be natural

    Do you have a link? As I understand it, the last IPCC report says that the best estimate for human caused warming is more than 100% of the warming since 1950 (with other factors offsetting some of it).

    Weather is localised and temporary but climate change can alter the likelihood of certain weather events and that is the critical question.

    You also say:

    Certainly, the warming from the Little Ice Age until 1940 was mostly natural

    Do you have a link for that, also? What were the actual causes (“natural” seems almost magical but those natural changes also had causes, just not predominantly human behaviour)?

    • Mike Flynn says:

      Mike Roberts,

      You wrote –

      ” . . . climate change can alter the likelihood of certain weather events and that is the critical question.”

      Given that climate is the average of weather, it seems a little silly to say that ” the average of weather can alter . . . certain weather . . . ”

      Your critical question seems to based on a foundation of the average of something being able to change that something which produced the average. Are you always this confused and illogical, or is this a one off?

      If you are just trying to pose a stupid gotcha, rather than genuinely seeking knowledge, others might suppose you to be a stupid and ignorant troll!

      Would you like to rephrase your question, or do want to quit while you’re behind?

      Cheers.

      • Mike Roberts says:

        Mike Flynn said,

        silly to say … the average of weather can alter . . . certain weather . . .

        I agree. I wonder if anyone would be silly enough to say that.

        A change in the climate means there is an increased (or decreased) likelihood of certain weather events. In the case of heat waves, it is increasing such likelihood. I could make this even easier to grasp but I would hope most people can get the idea.

    • Chris Hanley says:

      “… the last IPCC report says that the best estimate for human caused warming is more than 100% of the warming since 1950 …”.
      The IPCC assume that natural forcings and natural variability have been virtually non-existent since 1950, that after 4.5 billion years Mother Nature went on strike, and that assumption is absurd …
      https://ar5-syr.ipcc.ch/ipcc/sites/default/files/AR5_SYR_Figure_1.9.png
      … therefore all the net warming since 1950 is human-caused, and that is circular reasoning.
      Human CO2 emissions prior to 1950 were relatively insignificant before 1950

      • Chris Hanley says:

        And that Mother Nature’s sudden inactivity just happened to coincide with the upsurge of human CO2 emissions after 1950, a truly astonishing coincidence.

        • Entropic man says:

          “The IPCC assume that natural forcings and natural variability have been virtually non-existent ”

          No assumption needed. The natural variations are measurable and measured.

          They are either constant or changing in a way that would produce a slow cooling trend.

          At present we are cooling by about 0.01C per decade due to natural variation and warming by about 0.21C due to AGW.

          Hence the observed warming of about 0.2C.

          • Bart says:

            This is circular reasoning.

          • Mike Flynn says:

            Em,

            I hope you are only pretending to be stupid. Are you really saying that we are warming due to AGW?

            Warming due to warming seems a bit circular. In science, rising temperatures are due to additional heat, in simple terms.

            I wonder if you would mind specifying the source of the additional heat causing temperatures to rise?

            Cheers.

          • Entropic man says:

            Mike Flynn

            Summary data on the graph here.

            “I wonder if you would mind specifying the source of the additional heat causing temperatures to rise?”

            Certainly. It is coming from the Sun. It enters the atmosphere as sunlight ( shortwave radiation ).

            Increasing forcing decreases the amount of energy radiating to space.The difference between incoming and outgoing energy accumulates, warming the planet.

          • Mike Flynn says:

            Em,

            You wrote –

            “Increasing forcing decreases the amount of energy radiating to space.The difference between incoming and outgoing energy accumulates, warming the planet.”

            Don’t be stupid. There is no forcing. That is just sciency sounding pseudoscientific climatological jargon.

            The planet has cooled over the last four and a half billion years or so. No warming, no heating, no forcing, no GHE.

            Not that you could even describe the non-existent GHE, could you? If you started, you would very quickly realise you were talking nonsense, and everyone with any sense would start laughing.

            But keep believing, if it gives you solace.

          • Bart says:

            “Increasing forcing decreases the amount of energy radiating to space.”

            I take that to mean increasing the impedance provided by increasing CO2 concentration. But, even if that is potentially true, it is only one of the myriad interfaces between heat reservoirs in the system that can affect the accumulation of energy within it.

            IOW, you cannot just assume that must be the explanation for any observed warming. You have to confirm it through observation. The evidence to date is at best ambiguous, and at worst, contradictory.

          • RealOldOne2 says:

            Entropic man says Feb.6,2019 at 6:39AM: “The natural variations are measurable and measured. They are either constant or changing in a way that would produce a slow cooling trend.”
            That is not correct. Peer reviewed science shows that the amount of solar radiation reaching the earth’s surface increased by 2.7W/m^2 to 6.8W/m^2 during the late 20th century warming. That was ~10 times greater than the alleged increase in CO2 forcing. Clear empirical evidence of natural climate forcing, not AGW.

      • Mark B says:

        “The assumption is, of course, that anthropogenic global warming is to blame.”

        “The IPCC assume that natural forcings and natural variability have been virtually non-existent since 1950, . . .”

        The relative values of the natural and anthropogenic contributions to global warming are a product of attribution studies, not an a priori assumption.

        • Mike Flynn says:

          MB,

          Unfortunately, the term “forcings” is climatological pseudoscientific jargon. It does not appear elsewhere in physics.

          In addition, the pseudoscientists babble about the “climate system”. Climate is an average of weather. Climate is a result, not a cause.

          Pseudoscientists calling themselves “climatologists” promote something they call the GHE, which apparently heats the planet in some unspecified manner. This GHE apparently only functions in direct sunlight. It refuses to be measured indoors or at night, turns itself off during solar eclipses, and cannot be demonstrated in the laboratory, or in the presence of disbelievers.

          The GHE apparently lay dormant as the Earth cooled for four and a half billion years, only to be resurrected by the self proclaimed saviour of the world, James Hansen, and his acolytes, working their magic in concert.

          As with any doomsday cult, as the true believers die off, so will the FUD associated with their endless declarations that unbelievers will suffer eternal torment by being roasted, boiled, fried or toasted.

          As long as nobody can produce a logical description of the GHE which accords with observed fact, and then form a testable GHE hypothesis, then climatology remains pseudoscience, or Cargo Cult science (using Richard Feynman’s criteria).

          There is no GHE. No CO2 heating.

          Climatology is not nearly as old, nor as well respected as astrology. At least astrology served as the basis for the scientific pursuit of astronomy, whereas climatology serves as the basis for nothing at all.

          Cheers.

        • Chris Hanley says:

          The linked diagram above refers to temperature not “forcings” and the attribution studies are based on model simulations that are in turn based on assumptions.

  30. .
    ❶①❶①❶①❶①❶①❶①❶①❶①❶①❶①❶
    ❶①❶①
    ❶①❶① . . . The Science and Mathematics . . .
    ❶①❶①
    ❶①❶① . . . . of Earth’s Temperatures . . . .
    ❶①❶①
    ❶①❶①❶①❶①❶①❶①❶①❶①❶①❶①❶
    .

    Imagine a temperature model of the Earth, that can explain:

    – 94% of the variation in the average temperature, of every country on Earth

    – 90% of the variation in the temperature of the coldest month, of every country on Earth

    – about 59% of the variation in the temperature of the hottest month, of every country on Earth

    That would have to be a big, complex temperature model, wouldn’t it?

    What if I told you, that the temperature model of the Earth was based on only 4 factors:

    – the average latitude of the country

    – the average longitude of the country

    – the average elevation of the country

    – the area of the country

    Would you believe me?

    I am sure that many people will expect my temperature model of the Earth to be very inaccurate.

    You are welcome to have a look at the results of my temperature model of the Earth.

    https://agree-to-disagree.com/the-science-and-mathematics-of-earths-temperatures

  31. John Michelmore says:

    Dr Roy, Glad you picked up this subject. For Adelaide South Australia in the recent “heat wave” 46.6 degrees Celsius became the BOM “record” temperature. However on 12th January 1939 the record was 47.6 degrees Celsius. See here http://www.sahistorians.org.au/175/chronology/january/12-january-1939-heatwave.shtml

    In Australia BOM records I believe are small snap shots (ie the temperature on the electronic gauges only need to be there momentarily) to achieve a new maximum. This practice is not the same elsewhere in the world.

    Incidentally the urban heat island effect must be much more significantly for Adelaide now than in 1939.
    So a recorded “record” temperature has now become what BOM think is a record. How can anyone have any faith in these government institutions now!

  32. Geoff Sherrington says:

    In my extensive travels around Australia, fish kills in remote places were visible enough to regard them as normal and not a sign of much more than changes to the local water chemistry. Why should you seek to tell me to be alarmed by them? Have you ever seen this type of event?

  33. Nate says:

    ‘This is why nobody can actually explain how the GHE is supposed to operate,’

    Mike-bot, with your short term selective memory, you missed it being explained to you at least 47 times.

    Stop making shit up and trolling.

  34. Stephen P Anderson says:

    “This drought may never break!” was the headlines of the Sydney Morning Herald, January 4, 2008. “Perhaps we should call it our new climate,” said David Jones, Head of Climate Analysis at the Australian Bureau of Meteorology. How do you leftists wipe your memories so clean? Or is it just from a lack of conscience?

  35. JDHuffman says:

    Upthread, Mike Flynn referred to the word “forcing” as “climatological pseudoscientific jargon”. Probably very few of the clowns understood what he was referring to.

    The so-called “forcing” comes from the bogus Arrhenius CO2 equation:

    ΔF=5.35ln(C/Co), where ΔF is the “forcing”, C is the current atmospheric CO2, and Co was the atmospheric CO2 before industrialization.

    The first problem is the equation is NOT valid. It originated from someone’s imagination. The equation has no mathematical derivation, or empirical validation. It’s something you must BELIEVE in.

    The next problem is that the equation creates energy out of nothing–a clear violation of the Laws of Thermodynamics. The “forcing” has units of “Watts/m^2”, which is the same as solar flux. Convenient, huh?

    So the equation is representing, for current CO2 levels:

    ΔF = 5.35ln(410/280) = 5.35(0.381) = 2.04 Watts/m^2

    Since that 2.04 is supposed to add to solar flux (another HUGE violation of laws of physics), then the total area would be the same as for solar flux, πr^2 = 128(10)^12 square meters.

    The end result is 260,000,000,000,000 Watts, which then calculates to 8.2(10)^21 Joules.

    Those who would appreciate even more humor should compare the end result with world’s total electrical energy production….

    • Entropic man says:

      JDHuffman

      One small correction.

      You say “2.04 is supposed to add to solar flux (another HUGE violation of laws of physics),”

      This would indeed violate the 2nd Law of thermodynamics.

      In fact that 2.04W/M^2 is a reduction in the outgoing radiation. An energy imbalance is still generated, with outgoing LW radiation 2.04W/M^2 less than incoming SW radiation.

      This has the same warming effect, in a way which is allowed by the laws of physics.

      • Mike Flynn says:

        Em,

        Pseudoscientific nonsense.

        For a start, the Earth has cooled over the last four and a half billion years. No energy accumulation, or even balance. Four and a half billion years of continuous sunshine (add up all the watts if you like), still resulted in cooling.

        You mention incoming SW radiation (whatever that is supposed to be!). That seems unlikely at night, as the temperature falls in the absence of sunlight. If your statement was correct, the surface temperature would necessarily increase, would it not?

        You cannot actually state this mysterious GHE of yours, in any way which includes reality, can you?

        If you can’t, that makes you just another pseudoscientific cultist of the foolish Warmist variety.

        You can’t debate a fantasy into fact. Your attempts to do so provide a bit of light relief, and so are not totally without value.

        Cheers.

      • JDHuffman says:

        That’s funny, E-man.

        You ignore the fact that the equaion is bogus.

        You ignore the fact that solving the equation calculates to more energy than the entire World’s electrical energy production.

        And then you attempt the usual twists and turns to get around LoTs.

        All in the name of Institutionalized Pseudoscience!

        “Not cooling” is “not cooling”. It does not imply “warming”. To increase the temperature of a system at equilibrium requires NEW energy into the system.

        I always like to recommend studying thermodynamics, if you’re confused.

        • Entropic man says:

          “You ignore the fact that the equaion is bogus.”

          I think not. It has predictive power. If you use it to calculate the temperature rise since 1880 you match observation with a 25 year lag.

          “You ignore the fact that solving the equation calculates to more energy than the entire Worlds electrical energy production.”

          Why are you incredulous? There is no reason why the amount of energy involved in AGW should be limited to the amount we generate.

          “To increase the temperature of a system at equilibrium requires NEW energy into the system.”

          The “new energy” you mention is not new. It entered the atmosphere as sunlight and is accumulating because it has been prevented from leaving.

          Think of your bank account. At equilibrium you put in 1000 a month and spend 1000. In the long term your bank balance stays constant. If you reduce your spending to 999 your bank account then gains 1 a month. This is not spontaneously created money, it is just money which has entered the account and not left.

          • Mike Flynn says:

            Em,

            Why lurch off into pointless and irrelevant analogies?

            You wrote –

            “The “new energy” you mention is not new. It entered the atmosphere as sunlight and is accumulating because it has been prevented from leaving.”

            Absolute nonsense. No wonder you have to blather about bank accounts!

            You might have noticed, at night, the temperature drops. The sunlight is leaving – not accumulating. Your assertion is complete rubbish!

            And that little physical fact just happens to explain why the Earths surface has cooled over the last four and a half billion years, in spite of the Sun shining continuously.

            No new energy. Just more climatological pseudoscience, trying to delude the gullible into believing in a GHE that you cannot even describe!

            No GHE. No CO2 heating. No heat accumulation or trapping. Just silliness piled on delusion.

            Think of some physics – stupid analogies don’t come close.

            Cheers.

          • JDHuffman says:

            E-man, grasping for straws: “…you match observation with a 25 year lag.”

            No E-man. That’s just “curve-fitting”. You will always find some way to further your belief in your beliefs. It’s called “zealotry”.

            E-man says: “There is no reason why the amount of energy involved in AGW should be limited to the amount we generate.”z

            E-man creates a straw man, with all his newly grasped straw.

            E-man says: “It (calculated new energy from bogus equation) entered the atmosphere as sunlight and is accumulating because it has been prevented from leaving.”

            It is “new”, because it was the calculation from the bogus equation, E-man. It does NOT exist in reality.

            E-man, grasping at straws again: “Think of your bank account.”

            E-man, your bank account analogy fools you because bank accounting is real, but your GHE is not. Try going to your bank with a bogus calculation for your balance. For example, you have a 1000 in your account for 30 days. So tell them you should have 30,000 in your account. Tell them your equation indicates a current balance is equal to the original balance times the number of days in the account. See what happens, in reality.

          • Nate says:

            Dumb and dumberer.

            ‘You might have noticed, at night, the temperature drops. The sunlight is leaving – not accumulating. Your assertion is complete rubbish!’

            I know you live in the tropics, Mike, where you have equal day and night. If the suns heat doesnt accumulate, then at dawn why arent you as cold as Antarctica?

          • Mike Flynn says:

            N,

            You wrote –

            “If the suns heat doesnt accumulate, then at dawn why arent you as cold as Antarctica?”

            Another stupid gotcha. You fools never learn.

            My equally pointless response (if I was as delusional as you), could be “if the Sun’s heat does accumulate, why isn’t the South Pole as hot as the Libyan desert after six months of continuous sunlight?”

            The Sun’s heat doesn’t accumulate. Over the last four and a half billion years, the Earth has cooled. Four and a half billion years of continuous sunlight failed to stop it.

            How’s that GHE definition going, anyway? Not so well? Keep at it. Do you think you might need to consult a pseudoscientific climatological true believer for assistance with another stupid and irrelevant gotcha?

            Cheers.

          • Nate says:

            And, as expected you have no answer.

            Seriously you dont know why the tropics are hotter than Antarctica?

            I knew you were dumb, but not that dumb.

            Of course the suns heat accumulates, even with night, until a warmer equilibrium is reached.

          • Mike Flynn says:

            N,

            What a stupid response! You pose a gotcha which you realise is pointless and irrelevant, and follow it up with an even more pointless statement, telling me that I don’t know why the tropics are hotter than Antarctica.

            What has your pathetic gotcha to do with your failed attempt at mindreading?

            I presume (possibly incorrectly) that you have a delusional with the rather odd proposition that CO2 makes thermometers hotter, combined with an even more bizarre idea that sunlight somehow accumulates!

            You must be a fool who is convinced that Gavin Schmidt is a scientist, and that Michael Mann’s claims to Nobel Laureateship are factual, rather than fantasy.

            With a little more effort, you could probably aspire to the pinnacle – complete and utter foolishness.

            Give it your best shot. You have my full support.

            Cheers

          • Nate says:

            Mike,

            My point is that parts of the Earth receiving lots of sunlight have been warmed, obviously, relative to the parts that are not receiving lots of sunlight.

            And with interglacial periods, the Earth has warmed in the past.

            I remind that you keep stating that the Earth CANT be warmed, because its been cooling for so long!

            Your premise does not agree with the available facts. Nor does your statement obey any known logic.

            It is a red herring and non-sequitur.

            Your logic fails provide excellent examples for students.

          • Mike Flynn says:

            Nate,

            Your “point” is spectacularly pointless. You have abandoned all references to the non-existent GHE. I don’t blame you.

            Maybe you are unable to explain why a thermometer reacts to absorbing increased energy by becoming hotter, but I believe I can.

            If you cannot understand why the decrease in temperature occurring as molten rock becomes non molten is called “cooling”, then I cannot help you. You are obviously far too stupid and ignorant to realise that a lowering of temperature is not “warming”. The Earth has cooled, in spite of four and a half billion years of sunlight.

            You cannot increase the energy output of the Sun. You can certainly lessen the amount of energy reaching a thermometer on the surface. Clouds, hummingbirds, body parts, trees – or anything casting a shadow. A shadow is Nature’s way of pointing to where it is cooler.

            How’s your definition of the GHE going? Not too well? I thought I’d give a gentle nudge, in case you had forgotten about the non-existent GHE, so beloved of pseudoscientific bumbling buffoons.

            Maybe you could try the tactic of deny, divert and confuse. Or resort to trolling.

            Cheers.

          • Svante says:

            “You can certainly lessen the amount of energy reaching a thermometer” … at the top of the atmosphere by adding more GHGs.

            Whatever is inside the atmosphere will then warm until equilibrium is restored.

          • Nate says:

            Mike, I have already pointed you to the path of GHE enlightenment, just like the other 47 times. http://www.drroyspencer.com/2019/02/australias-record-hot-january-mostly-weather-not-climate-change/#comment-340872

            But I see that you ignored the path as usual. And chose once again the path igorance, ad homs, and diversions.

          • Chic Bowdrie says:

            Nate,

            “Now add the fact that CO2 attenuates selectively in IR. Most strongly, in fact near the peak of out-going flows.”

            I fail to see how that is anything close to a definition of GHE. But let’s assume it is. Where is the data that shows CO2 attenuation will have any affect on the average global temperatures?

            BTW, are you pleased that your fellow liberal Rep. Ocasio-Cortez and Democratic presidential candidates are featuring AGW in their proposals?

          • Nate says:

            Chic,

            The ‘selective attenuation of IR near the peak of outgoing radiation by CO2’ is a key ingredient in the GHE.

            But it is not the whole story. I know you and Mike have heard real descriptions of the GHE.

            Whats the point of creating more strawmen versions of it, like Mike does?

          • Mike Flynn says:

            Nate,

            Your mind reading course didn’t work. Have you tried asking for a refund?

            Instead of telling people what you think they know (you presumably think you can read minds), maybe you could provide a useful definition of the GHE.

            Or maybe you can’t, so you pretend a GHE description actually exists. Like Trenberth’s missing heat, it is obviously a travesty that you can’t actually find it.

            Have you considered adopting a foolish Warmist tactic? When anyone points out the singular lack of a GHE definition, just attempt to deny, divert and confuse. That might work, eh?

            You don’t need to thank me.

            Cheers.

          • Nate says:

            Mike,

            I gave you a sinple fact about about co2 properties, and you have yet to process it, acknowledge it, or reject it.

            Deal with that, then we’ll see if you can process more.

          • Nate says:

            Chic,

            It works for you guys to pretend that all dems agree with the far left wing. OCA is a celebrity, but not sensible.

            Are you pleased that Rep King is pushing the Repubs toward white supremacist views?

          • Chic Bowdrie says:

            Nate,

            What is your plan for dealing with global warming and how does it differ from AOC’s green new deal?

            What do you know about Rep King’s views on anything? You read it in the paper? Oh.

            Well, apparently King regrets what he said. Probably won’t do him any good and he won’t survive another election.

            AOC, on the other hand, hasn’t walked back anything to my knowledge. She may not be sensible, but she’s quite entertaining.

          • Nate says:

            AOC, not OCA, whatever. Her plan of 100% renewable in 11 years is silly, not feasible nor wise. Pelosi is correctly not bringing it up for a vote.

            You guys will still try to say this is what all DEMs are for, because its all about propaganda.

            I would incentivise renewables and a smart grid over 30 y, which is about how long it took to ramp up new energy sources in the past.

          • Chic Bowdrie says:

            Incentivising renewables means that tax payers who can’t afford the renewables pay for the benefits of the richer tax payers who buy them. It’s regressive taxation.

            BTW, how did investments in solar panel companies work out during the last administration?

          • Nate says:

            How we tax people is a whole other discussion…

            All of our energy sources, nuclear, hydro, FF, have had govt support at one time or another. Plus the R & D behind them.

            Apparently, it was considered to be in the public interest to do so.

          • Nate says:

            ‘how did investments in solar panel companies work out during the last administration?’

            I would favor support that doesnt pick winners and losers.

            In New England, we have a group of states who require electric utilities to produce some renewable energy, or buy Renwable Energy Credits (RECS) from someone who does, like a homeowner with solar panels. A homeowner can sell RECS for 10 y.

            There is a market for these RECS. Whoever can generate renewable energy most cheaply will do it.

            The % renewable is slowly increasing. A side benefit is cleaner air.

            It seems to work more or less. The cost is partly passed on to customers, but it is a tiny amount. Low income customers get price breaks.

          • Chic Bowdrie says:

            “How we tax people is a whole other discussion”

            Yes, it generally revolves around socialism and free markets. The green new deal is definately socialism and amounts to wealth redistribution. “From each according to his ability, to each according to his needs.”

            All(?) government programs do it to some extent. Their tax deductions and subsidies, etc. pick winners and losers.

            “It seems to work more or less. The cost is partly passed on to customers, but it is a tiny amount.”

            A tiny amount here, a tiny amount there, pretty soon you are talking about a $20 trillion debt. Yeah, it’s working real well. /sark off

          • Nate says:

            “A tiny amount here, a tiny amount there, pretty soon you are talking about a $20 trillion debt. Yeah, its working real well. /sark off”

            My state has a big budget surplus.

            But, yes, a few $B for a wall here, A few hundred $B for bombers we dont need there, a few $T for unpaid-for tax cuts there, and before you know its $22 T, and growing fast.

            I didnt think Trump supporters cared anymore about debt?

          • Chic Bowdrie says:

            The constitution calls for the federal government to protect against foreign and domestic enemies. It doesn’t call for subsidies and entitlement programs. Your state being financially responsible doesn’t mean they aren’t overtaxing the rich to keep the poor dependent on government programs.

            Tax cuts don’t have to be paid for. It is our money confiscated by the government. Spending has to be justified based on GDP. The answer is curtailing federal government entitlement spending and sending not mandated by the constitution.

            Trump supporters care about debt, but safety and economic growth can’t be sacrificed on the alter of government largess.

          • Svante says:

            You’re funny Chick.

          • Nate says:

            “Tax cuts don’t have to be paid for. It is our money confiscated by the government.”

            Ha!

            Conservatives always believe they made their money all on their own, without any assistance from govt.

            Just try to have an income and keep it and keep your health, with govt to fund

            roads, airports, trains, ports, police, courts, consumers to buy your stuff, education, lack of roving bands raping and pillaging, food and drug inspectors, a stable dollar, a central bank, stable agriculture, the internet, GPS, satellites, and yes, national defense, intelligence agencies, and last but not least, support for fundamental science and R and D that made many of these things possible.

          • Chic Bowdrie says:

            “Conservatives always believe they made their money all on their own, without any assistance from govt.”

            Is this a paraphrase of Obama’s “you didn’t build that” speech?

            The federal government has gone way beyond life, liberty, and the pursuit of happiness. Constitutionally mandated transportation, commerce, and national defense comprise the majority of your list. Education and support for science are not constitutionally mandated.

            I’m not saying taxes aren’t necessary, just dangerous in the wrong hands.

          • Nate says:

            The Constitution, except when inconvenient to you guys.

            It gives Congress the power of the purse. TDT is trying to take that away.

          • Nate says:

            Stop funding science? Then flush our lead in tech down the drain.

          • bilybob says:

            Chic Bowdrie says: “Spending has to be justified based on GDP.”

            I would modify that to say spending should be related to population earnings. Otherwise your service products/services rather than we the people. From the earliest federal budget (USA) to just before the new deal, the cost of services could be reasonably related to wages. This government cost, with the exception of a few peaks due to war, could be satisfied with 5 days of average wages or less.

            During that time USA went from one of the smallest economies to number 1 in about 80 years (plus/minus). Free market capitalism was maximized, and eventually the USA would developed into a superpower. After the FDR new deal and world war II, our country has had a spending problem both militarily and socially.

            IMO we do not need to be the world police and the masses are fairly smart and can take care of themselves for the most part. For those who do slip through the cracks, local governments and charities are more suited to meet their needs then the federal government. In fact, the federal government is very inefficient because their programs have to span every potential situation for all 50 states, whereas local government and private charities can focus on the regional/local issues at hand.

            Probably the worst program is Social Security Retirement. The bureaucratic overhead is so costly the average rate of return is under 2%/yr. I think the latest average payout is at $1700/month. If the feds really cared about retirement, letting you put the 10% of your salary tax deferred that the feds take into a S&P 500 index fund instead would result in over $1.8M (in today’s dollars) in 40 years for the worst 40 years on record and for those earning the 40th percentile in wages.

          • Chic Bowdrie says:

            bilybob,

            You are absolutely correct. My only reservation is not understanding how population earnings and GDP are different. All I’m calling for is no government spending beyond expenditures. Deficit spending has become the rule rather than the exception. It will take us down eventually. I’m ambivalent about wanting to live long enough to experience it.

            Until the federal government gets out of the entitlement business, there will be no diverting the trend toward going over a financial cliff. Ignorant liberal social engineers like Nate will never agree that government cannot fix social ills without creating others. I guess their beating their chests over denying us border protection while contributing to massive government overspending.

          • Svante says:

            Fiscal responsibility, that sounds better than “Tax cuts don’t have to be paid for” and spending based on GDP.

          • bilybob says:

            Chic says “My only reservation is not understanding how population earnings and GDP are different.”

            My bad, I should have said population wages. GDP is the total output of services and products, but wages are basically the employees cut of that.

            I should have also added that the average wage worker currently needs to work close to 15-20 weeks to fund the federal government now. Though tax rates are such that Uncle Sam takes a bit less, thus the deficit. I get tired of hearing that we have a revenue problem when we clearly have a spending problem.

            The problem with liberals is that they don’t understand that even though the rich pay the bulk of federal income taxes, the poor still pay through higher cost of goods and services.

          • Chic Bowdrie says:

            bilybob,

            OK, thanks. And I need to clarify what I mean by government spending tied to the GDP. We need a constitutional amendment that the government can’t spend more than a certain percentage of the GDP. This would be similar to linking spending to average wages.

            Most liberals don’t even know the rich pay the bulk of income taxes.

          • Nate says:

            The last 2 y the Rs had all 3 branches of govt. Yet the growth of deficit and Debt has only accelerated.

            The last time we had a balanced budget was after tax increases in early 90s.

            It seem that on all the issues we’ve been discssuing, the border ‘crisis’, the Debt, the Constitution, and climate change, you guys are driven more by ideology than facts.

          • Chic Bowdrie says:

            Nate, the answer isn’t Republican or Democrat. The swamp, big government politicians, and liberal/progressives have to go. The fact is we have been implementing liberal and socialist ideology and we need to reign it in quick.

            Start a new thread if you want any more comment from me. I’m done here.

          • Nate says:

            As a percentage of GDP, fed revenue this year was 16.5%.

            The average post WWII has been 18%.

            This tells you that a big reason for the deficit is on the revenue side right now.

          • bilybob says:

            Nate says, “As a percentage of GDP, fed revenue this year was 16.5%.”

            In using percentage of GDP, makes the statement that the federal government serves the economy. When you look at in terms wages, you make the statement that the federal government serves the people, or at least the worker. I prefer the latter.

            Up until New Deal, an average wage worker could pay for their fair share of government with a weeks pay. Leaving the remainder for state/local which depending where you live would be another couple of weeks at most. Leaving approximately 49 weeks of pay for your own needs, charity, investment. This was fairly stable with the exception of small periods of war.

            After the new deal, the great society programs, the expansion of the Military role, and the Unaffordable Care Act, the average wage worker would have to work 15 to 20 weeks just to cover their fair share of the federal government cost. The good news though is places like Greece, Portugal, Ireland failed only after exceeding 25 weeks. France is about there, if they do not clean up their act, they may be the next Country to need a German bailout.

            That tells us there is a spending problem.

          • Nate says:

            Again, making the case that facts dont matter, if they dont agree with your ideology.

            If you have to go back to 1920s to find when govt last worked for you…kind of ignores the fact that our biggest gains in standard of living were in post WWII decades.

          • bilybob says:

            Nate says “Again, making the case that facts dont matter, if they dont agree with your ideology.”

            Could you clarify which facts do not matter? And what is my ideology?

            Nate says “If you have to go back to 1920s to find when govt last worked for you…kind of ignores the fact that our biggest gains in standard of living were in post WWII decades.”

            Post WWII gains in the standard of living were brought about by advances in medicine and the post war boom. Not from a bloated government. Besides, I said it has been the cumulative result of these programs over the past 80 years. Post WWII, though worse than pre WWII in terms of fed government cost per person was still reasonable compared to today.

          • Nate says:

            ‘Post WWII gains in the standard of living were brought about’

            by many things, including GI Bill, govt spending on science, health, military and space that led to numerous industries, free trade, the Marshall plan, and it could be argued, the family income stability that New Deal programs facilitated.

            Its difficult to disentangle all its economic effects, but clearly SS has a societal benefit of keeping large numbers of seniors from being homeless.

            And clearly it didnt hinder the post WWII gains in standard of living.

          • Nate says:

            ‘Could you clarify which facts do not matter’

            The fact that I showed you a fact about tax revenue. It is currently LOWER than average for last 60 y, which means this lack of revenue is a big part of the deficit.

            It is currently 16.5% of GDP. The last time the budget balanced, 1990s, it was 19% of GDP.

            Since then of course, health care costs have increased dramatically, more than in other countries with national health ins.

          • bilybob says:

            Nate says, “Its difficult to disentangle all its economic effects, but clearly SS has a societal benefit of keeping large numbers of seniors from being homeless.
            And clearly it didnt hinder the post WWII gains in standard of living.”

            Good point on disentangling all the economic effects Nate, but I could argue it did hinder post WWII gains. This type of argument is difficult to prove either way. But I can go on data and past results as a clue.

            During normal business cycles it is common to have recessions, there have been many. But when recessions/depression are shown to be longer with government intervention than without, is that causation? You can argue it both ways and never get agreement on it. The Republicans probably caused the market crash and FDR probably extended the recession to the great depression. The Long Depression may have been caused by Fed Governments interference with the banking system. Did Bill Clintons 1999 housing incentives related to bad mortgages create the bubble in the Early 2000’s that Bush warned and Democrats said was imagined. Result housing 2007/08 crisis, did the Unfordable Care Act result in the great recession under Obama? You see, no one can prove causation, but intelligent people can see a pattern. Government interference is not always efficient. Open minded people can see that.

            Does that mean I believe the federal government has no role in our lives, of course not, the Marshall Plan, the GI bill, probably good, I heard some arguments against. I don’t have a strong feeling for them, but they were temporary and aimed to fix rare occurrences. Obviously reasonable environmental regulations, banking, postal service, are good things better suited for federal oversight.

            As far as SS, even FDR said it was suppose to be temporary. Not much census data on elderly homelessness, but studies by New York and Boston were done during that time period, not much of a problem. But hey, SS was only going to be 1% to 2% of your salary, why would anyone complain about that. Now fast forward to now, 10% to retirement plan that you forfeit upon death, 3% Medicaid/Medicare and 2% disability. The interesting thing is that the 3% and 2% are actually competitive in the private market for similar insurance. But that may explain why they may run out of funds and will eventually have to raise the tax rates. The 10% of retirement is a joke, I can get a better return in a money market. And without yet another tax increase, benefits will most likely be cut. As if the current benefit was much to begin with.

          • bilybob says:

            Nate Says “The fact that I showed you a fact about tax revenue. It is currently LOWER than average for last 60 y, which means this lack of revenue is a big part of the deficit.”

            Actually Nate, I did acknowledge that fact and addressed it directly. So not sure why you say I ignored it. Just because it is a fact, does not make it necessary a good metric to use. To repeat, basing the federal budget on GDP puts focus on serving the economy and not necessarily to the needs of the people. Basing the budget on personal income/wages or even per capita, is people focused.

            Tell me the logical nexus to use GDP. Is not the fed government all about protecting the rights of people? Settling disputes among states, treaties, national security? How is that related to GDP, other than trying to maximize the federal government. I will give you this bone, the military could use GDP since it not only protects the people of the nation but its wealth, maybe a stretch though.

          • Svante says:

            GDP vs. wages:

            1) GDP = Private Consumption + Investment Expenditure + Government Expenditures + Net Exports
            2) GNP = GDP + Net Income from Abroad
            3) GNP = Wages + Interest Income + Rental Income + Profit

            So you want to exclude return on capital and income from abroad. That’s very roughly half the total, and trending down.

          • bilybob says:

            Svante says “So you want to exclude return on capital and income from abroad. That’s very roughly half the total, and trending down.”

            In determining budgets a metric needs to be selected that has a rational nexus to the services/products delivered. Thus your question should not be why exclude… but why include… Governments should serve people and not corporate interests or special interest groups. The Federal Budget should be a function of population size and/or the populations ability to pay (their wages) for these services. Ultimately, it is the people who have to pay for government, either directly from various forms of taxation or indirectly in the cost/products they purchase which include a tax component cost in their price.

          • Svante says:

            Deciding on the budget involves a thousand trade offs.
            Tying the size to wages is rather simplistic.

            Why not cut it further when everyone can support themselves, criminals have come to their senses, and there is peace on earth. Or double it in the opposite case, like in WWII.

          • bilybob says:

            Those are very good points Svante.

            My point is related to the rational nexus in determining the appropriate level of a budget to serve people. Using percent of wages is very simple, as simple as using percent of GDP. But given federal government is there to protect our civil rights, provide banking, postal service and military to protect us, why would the budget be a function of GDP and not population? And better yet, make it a function of wages, because you now include inflation (assuming wages/inflation are similar). Now I have a government who is interested in setting policy that will raises wages rather a government interested in raising GDP.

          • Svante says:

            Yes, politics is too much about spending, not enough about creating wealth.

        • Nate says:

          Bilybob,

          Unless you have the data to show, using something other than GDP in the denominator is a distraction, a red herring.

          Do you have data to show?

          If not, GDP will have to do.

          • bilybob says:

            I see you are confused on this discussion. You are probably someone who determines his grocery budget for your home based on the homes value instead of the number of people who live in it. So be it.

            Do I have data the shows using GDP make sense. If I find it, you will be the first I show, and I will admit I was wrong.

          • Nate says:

            Do you offer data for revenue divided by your preferred parameter?

          • bilybob says:

            I did this analysis on expenses, not revenues. That is why there are peaks during war periods. These were generally debt financed and paid back over time. I did the study a few years back and will unarchive it. Probably sometime tomorrow. I may have the revenue data as well, if memory serves, I put together both so I could look at historic deficits.

            What you will see, if you upload the data into Excel and chart it, is number of days the average wage worker would need to work to pay for the federal budget. It is fairly consistent at about 5 days with the exception of the wars up until the “New Deal”.

            Afterward, the federal budget grew faster than wages, thus you will see it go up to several weeks by today.

      • Nate says:

        Bilybob

        SS witholding is 6.2% not 10%. It went up, in part because people are living longer after retirement.

        It apparently hasnt gone up lately though life expectancy has.

        In 1935, life expectancy was 65, now it is 79. And the median age at death is 86.

        • bilybob says:

          Actually Nate, SS withholding is 12.4% of your salary, I was simply rounding down. 6.2% of deducted from your gross salary and 6.2% of your salary comes directly from your employer. There is an annual maximum. If you are self-employed you pay the full 12.4%. Either way, the employer performs the actual 12.4% transaction to the SS Administration.

          The amount in 1935 was in the 1% to 2% range. The rate of return given current benefits is below 2%/yr if you live to 86. Your benefit is a function of the contributions you made and if you die I believe you estate will get $500. There is survivor benefits for your spouse if still alive, which is adjusted based on their own benefit. Children over a certain age don’t get anything.

          Its a lousy program, unfortunately we are in debt to those who are about to retire or have retired. It would probably take 40 years to undo the damage the democrats have done the past 80 years. A better program would have been to have employers pay the 12.4% into a 401k equivalent and allow a pool of government selected investments. The interest/dividend earning alone would be higher the SS benefit, and what you did not use could be given to your heir or to your choice of charities.

        • Nate says:

          BB, what you seem to be talking about now is how SS is managed. Ok. I dont have a problem with tinkering with that.

    • gallopingcamel says:

      @JDH,
      That Arrhenius equation is false yet it is still widely quoted by people who should know better.
      https://diggingintheclay.wordpress.com/2013/03/07/arrhenius-revisited/

      For example our respected host and Richard Lindzen both talk about “Climate Sensitivity” in terms of degrees per doubling of CO2. Yet it should be obvious to all that the Arrhenius equation can’t be fixed by replacing 5.35 degrees/doubling with some other number.

      What about the effect of 115 “Halvings” that would drop Earth’s temperature below absolute zero?

      • Bart says:

        Interesting discussion. One of these days, I should look into the Arrhenius equations, but there is so little time, and I have other portents that tell me it is not applicable to the Earth’s climate in its present state.

        I note in your back and forth with Appell, he often resorts to the old “you can’t explain this without…”. He seems to think that offering an explanation means he has offered the explanation.

      • Mike Flynn says:

        gc,

        Nobody can even define the GHE. It is a bit silly for people claiming a testable GHE hypothesis for something that is unspecified.

        There is no such thing as “climate sensitivity”. Climate is the average of weather, no more no less.

        Pseudoscience is often characterised by confusing jargon. This is amply demonstrated by the pseudoscience of climatology. Nothing testable, just fanatics and their strident assertions.

        Your point about “halving” is a good one. Should removing all CO2 from a roomful of ordinary air at 20 C, reduce the temperature? It seems not to, but the foolish Warmists claim that increasing the amount will miraculously raise the temperature!

        Maybe the definition of the GHE requires the presence of direct sunlight, but nobody can find the definition, so who would know?

        The GHE is complete and utter nonsense. So is climate sensitivity. Just more pseudoscientific misdirection.

        Cheers.

  36. ren says:

    The temperature in Australia with a clear sky in January can be very high.
    https://www.ospo.noaa.gov/data/atmosphere/radbud/ase19_prd.gif

  37. ren says:

    The area of the ocean south of Australia was cool in January, causing no precipitation in the south, also in Tasmania.
    https://www.ospo.noaa.gov/Products/ocean/sst/anomaly/anim_2mfull.html

  38. Mike Flynn says:

    Bart wrote –

    “Nobody disputes that temperatures have warmed around the globe in the past half century, Ross. The question is, why?”

    An excellent question. The following paper might provide an answer. As far as I know, the researchers set out to confirm the consensus that CO2 caused heating, but, in essence, found that heat causes heating.

    This seems to be more likely, to me.

    “From urban to national heat island: The effect of anthropogenic heat output on climate change in high population industrial countries

    The project presented here sought to determine whether changes in anthropogenic thermal emission can have a measurable effect on temperature at the national level, taking Japan and Great Britain as type examples. Using energy consumption as a proxy for thermal emission, strong correlations (mean r2 = 0.90 and 0.89, respectively) are found between national equivalent heat output (HO) and temperature above background levels Δt averaged over 5‐ to 8‐yr periods between 1965 and 2013, as opposed to weaker correlations for CMIP5 model temperatures above background levels Δmt (mean r2 = 0.52 and 0.10). It is clear that the fluctuations in Δt are better explained by energy consumption than by present climate models, and that energy consumption can contribute to climate change at the national level on these timescales.”

    Sorry, it took me a little while to find the paper.

    Cheers.

    • Stephen P Anderson says:

      Dan Pangburn’s view makes the most sense-increased level of water vapor. But, the better question is what has made temperatures cyclic around the globe for the last several million years? Probably mostly the same thing that is making it cyclic today.

      • Mike Flynn says:

        Stephen P Anderson,

        Given the overall cooling of the Earth for four and a half billion years, I wonder if there is any way of establishing whether any sustained global heating has taken place.

        The whole Earth system appears to be chaotic, which might cause periods of much higher global cloud cover, as an example. It is easy to demonstrate that blocking the sunlight results in lower temperature. However, if the clouds subsequently go away, then the returning to the normal global cooling regime will actually be seen as increasing global temperatures.

        True, but eminently misleading.

        Even as the natural cooling of the Earth takes place, there is nothing to stop heat rearrangement in various parts of the globe. Antarctica is presently frozen, but as the continent moves, and the chaotic system operates, might it warm a bit, as heat is relocated?

        Not sure about other cycles.

        This sort of rearrangement seems to take place beneath the crust – hot spots come and go in the mantle, continents move here and there, mountains rise and fall, and so on.

        If it looks as though it’s about to rain, take an umbrella. That is about as good a way of predicting the future as any.

        Oh well – to each his own

        Cheers.

        • Stephen P Anderson says:

          Let’s not forget the Milankovitch Cycle. Can’t leave that one out.

          • Mike Flynn says:

            SPA,

            What leads you to think I am unaware of Milankovitch cycles (amongst others), or have forgotten them?

            Are you disagreeing with something I wrote?

            Maybe you could quote me, and tell me why you believe I am in error?

            Cheers.

          • Stephen P Anderson says:

            No, it’s just that I thought I’d throw in the ole Milankovitch Cycle. Alarmists like to bring that up if they don’t have an answer. Like when you ask them why did CO2 follow temperature for 4 billion years but now it doesn’t? Oh, I don’t know, the Milankovitch Cycle.

          • Stephen P Anderson says:

            P.S.-It was rhetorical.

          • Mike Flynn says:

            SPA,

            Apologies. My rhetoricalism detector obviously needed realignment.

            Must have been affected by the Milankovitch cycle. What can I say?

            Cheers.

  39. Kirk Ford says:

    Boy, that Summer of 1213 was a hot one! We only have 1 second of data. Every one settle down and we’ll reconvene in 10000 years and sift through all the info. See you then.

  40. Dan Pangburn says:

    The area of Australia is only 1.5% of the area of the planet so its temperature change would need to be averaged with the temperature changes of the 66 other equal areas to determine the global average climate change which, for January is about 0.01 K. The fluctuation of reported average global temperatures has an effective standard deviation of about 0.09 K.

  41. Myki says:

    Time for a real expert’s comments:
    2018 is yet again an extremely warm year on top of a long-term global warming trend, said Gavin Schmidt, director of Nasas Goddard Institute for Space Studies.

    The impacts of long-term global warming are already being felt in coastal flooding, heatwaves, intense precipitation and ecosystem change.

    Schmidt said that 2018 was quite clearly the fourth warmest year on record and it was probably warmer than many hundreds of years before that.

    He added he was very concerned with what is going on in the Arctic, which is heating up at around double the rate of the global average. Average extent of sea ice in the Arctic was the second smallest on record in 2018.”

    Let me guess the (usual) responses to this
    – NASA fudged the data
    – Schmidt is not an expert
    – it was due to the heat island effect
    – it is due to natural variability
    – it is due to (mysterious) solar cycles
    – CO2 is good for us
    – warming is good for us
    – yada yada

    • Mike Flynn says:

      Myki,

      This would be the Gavin Schmidt who is an undistinguished mathematician, but who claims to be a climate scientist, I presume?

      The same one who declared 2014 to be the “hottest year EVAH!”, albeit with a probability of 0.38 (38%), – almost twice as likely NOT to be the hottest year ever?

      An actual Nobel Prize winning scientist, Richard Feynman, said “Science is the belief in the ignorance of experts. When someone says ‘science teaches such and such’, he is using the word incorrectly.”

      In any case, if 2014 was the fourth warmest year, then it is cooler than at least three years which were hotter! How much longer will this cooling trend continue, do you think?

      If your intent is to appeal to the authority of a bearded balding bumbling buffoon, you may have succeeded, although I cannot understand why you go to such lengths to appear ludicrously stupid and ignorant.

      I presume “yada yada” is Trollish for “Gee I’m stupid”, or some other troll declaration of personal foolishness.

      Carry on. You may recover, given time.

      Cheers.

      • Myki says:

        Hook line and sinker !!!

        • Mike Flynn says:

          Begone, foolish troll!

          • bobdroege says:

            Too bad you don’t understand what Schmidt meant with the 38%.

            Just too bad.

          • Mike Flynn says:

            Begone, stupid troll.

          • Gordon Robertson says:

            bob d …”Too bad you dont understand what Schmidt meant with the 38%.”

            We understand him very clearly, he claimed there is a 62% chance he is lying.

          • bobdroege says:

            Let me explain it for you Gordon.

            It means there were other years where the uncertainty in the measurement meant there was a possibility that other years were warmer.

            Since there was more than one of those, it turns out that the 38% chance for 2014 was the most probable, as the probability for other years was less than 38%.

          • Mike Flynn says:

            bobdroege,

            38% probability of hottest year, means 62% probability it wasn’t.

            Another pseudoscientific climatological redefinition in order, perhaps?

            From the IPCC working group, technical summary –

            “About as likely as not” means 33 to 66 percent”

            Maybe Gavin Schmidt hasn’t heard of the IPCC? Or maybe thinks they don’t possess the understanding that you claim to.

            You seem to be part of a consensus of one, unless you can demonstrate otherwise.

            Cheers.

          • Gordon Robertson says:

            bobd…”Since there was more than one of those, it turns out that the 38% chance for 2014 was the most probable, as the probability for other years was less than 38%”.

            What you are saying in effect is that alarmist climate science is totally unreliable.

          • bobdroege says:

            It’s not just climate science, all science has to deal with uncertainty in their measurements.

            It just means that in this instance there were several years that were close to the warmest.

            And that these scientists were being more truthful in acknowledging that the value of the uncertainty in their measurements can affect the ranking of the most warmest years.

            Three temperature measurements

            92.3 +/- 0.5
            92.7 +/- 0.6
            92.4 +/- 0.4

            Which one is the highest

          • Mike Flynn says:

            b,

            Use a thermometer which provides a temperature to the accuracy you require, and you won’t need to pose stupid gotchas, will you?

            Why do you want to measure temperature?

            Do you need accuracy for a particular reason?

            Why are you asking a pointless and irrelevant gotcha?

            Cheers.

          • bobdroege says:

            Mike it’s not a gothca if you could answer the question correctly.

            Apparently you failed the simple test.

            The correct answer being that each measurement has a specific probability of being the highest.

            Ask Gavin to clarify if you still persist in misunderstanding.

          • Mike Flynn says:

            bobdroege,

            Don’t be stupid. You wrote –

            “Which one is the highest”. A clear attempt at a gotcha. Now you say the correct answer involves probability. Who knew?

            A gotcha. You asked a question to which you claimed to know the answer in advance, but had to redefine the wuestion after it was asked.

            What a fool you are!

            Telling me to ask a fool who declared 0.38 probability as representing “near certainty” to back you up, makes me wonder whether you are more stupid than he, or vice versa.

            If you wish to look wise and knowledgeable, rather than stupid and ignorant, choose your Warmist gotchas with more care. If you must appeal to authority, choose a real authority, rather than a demonstrably incompetent one.

            Cheers.

    • Chris Hanley says:

      “Schmidt said that 2018 was quite clearly the fourth warmest year on record and it was probably warmer than many hundreds of years before that …”.
      Good news indeed, after a threatened continuation of the LIA, about the coldest period in the past 8,000 years, the GAT may return to at least the long-term Holocene average.

    • Mike Flynn says:

      Hard to believe, but would the media report incorrectly?

      “Schmidt said that 2018 was quite clearly the fourth warmest year on record and it was probably warmer than many hundreds of years before that.”

      Presumably he means the “record” since 1910, since Australia affected the figures, and bearing in mind that the BOM does not warrant the accuracy of its records except to say that pre – 1938 temperature records are 10 times less reliable in any case.

      The “probably warmer” than “many hundreds of years” sounds like pseudoscientific waffle, sounding sciency, but completely devoid of useful information.

      This guy actually gets paid to spout this sort of pointless nonsense?

      No doubt the climatological pseudoscientific universe is unfolding as it should.

      Cheers.

    • Bart says:

      “When someone points to this & says this is the warmest temp. on record. What are they talking about? It’s just nonsense..This is a very tiny change period. And they are arguing over 100ths of a degree when it is uncertain in 10ths of a degree”
      – Dr. Richard Lindzen

      • Mike Flynn says:

        B,

        Or in the case of the Australian BOM, plus or minus 0.5 C, hopefully, but no guarantees!

        Cheers.

      • Gordon Robertson says:

        Bart…a comment from Schrodinger in the same vein I thought you might enjoy…

        “We never experiment with just one electron or atom or (small) molecule. In thought experiments we sometimes assume that we do, this invariably entails ridiculous consequences In the first place it is fair to state that we are not experimenting with single particles any more that we can raise Ich.thy.osa.uria in the zoo

        Sorry about the dots in Ichy…the WordPress censor did not like something.

      • Mike Flynn says:

        Gordon,

        Amongst other things, a Geiger counter counts single photons.

        Practical, useful, available.

        Not particularly sensitive. There are much more versatile single photon detectors and counters around.

        If it works, I believe it.

        Cheers.

    • Gordon Robertson says:

      mickey…”Schmidt said that 2018 was quite clearly the fourth warmest year on record”

      Schmidt is a mathematician who programs climate models and a wannabee atmospheric physicist.

      Among his claims to fame are:

      1)He avoided a one to one debate with Richard Lindzen, a real atmospheric physicist.

      2)He runs, on the side, one of the main climate alarmist sites on the Net, realclimate, with his good buddy Michael Mann. Anyone who does not preach the party alarmist line is banned from their site.

      3)When Mann was revealed on Climategate as author of The Trick, a statistical device to hide declining temperatures in a series, his good buddy, Schmidt, came to his defense on realclimate, claiming the trick was a harmless schoolboy prank.

      4)Engineer Jeffrey Glassman exposed Schmidt’s understanding of positive feedback. In fact, he revealed that Schmidt has no idea what it is. That does not stop Schmidt programming his climate models with a non-existent positive feedback, without which, models would be projecting little or no future warming.

  42. ren says:

    Did not the drought destroy the Mayan civilization? During the course of La Nina, California suffers from drought. Weather is governed by air circulation. Air circulation depends on geomagnetic activity, which changes over longer periods.

  43. ren says:

    This year, drought is not threatening in a larger area of Australia.
    https://files.tinypic.pl/i/00979/l96sownurrps.png

  44. ren says:

    In January, large cooling is visible over the Mediterranean.
    https://www.nsstc.uah.edu/climate/2019/201901_map.png

  45. Entropic man says:

    Mike Flynn

    Summary data on the graph here.

    “I wonder if you would mind specifying the source of the additional heat causing temperatures to rise?”

    Certainly. It is coming from the Sun. It enters the atmosphere as sunlight ( shortwave radiation ).

    Increasing forcing decreases the amount of energy radiating to space.The difference between incoming and outgoing energy accumulates, warming the planet.

    • JDHuffman says:

      “Increasing forcing decreases the amount of energy radiating to space.”

      E-man, there is NO “forcing”. You have deceived yourself. Consequently, there is NO reduction in the amount of energy radiated to space. The only way to reduce emission to space would be to cool the planet.

      “The difference between incoming and outgoing energy accumulates, warming the planet.”

      E-man, you have no clue. You don’t even know what the outgoing energy is. The current “energy budget” is terribly flawed.

    • Mike Flynn says:

      Em,

      Don’t be silly.

      The planet managed to cool for four and a half billion years. No energy accumulation there.

      The surface cools at night. No energy accumulation there.

      During a total solar eclipse, the temperature drops very quickly. No energy accumulation there.

      If you are gullible enough to believe fantasy rather than fact, you would make a perfect candidate for the pseudoscientific climatological cult.

      It helps if you are a bearded balding bumbling buffoon, particularly if you are delusional.

      No GHE. No CO2 heating.

      Cheers.

  46. Bindidon says:

    I’m really wondering about these very high anomalies computed by the BoM over Southwestern Australia.

    If we look at Nick Stokes’ integration of his GHCN V3 processing with the sea surface record ERSST:

    https://s3-us-west-1.amazonaws.com/www.moyhu.org/2019/02/map.png

    we see higher anomalies (above the mean of 1951-1980) for example in Eastern Siberia or Central Asia than in Australia.

    *
    And when we look at GHCN daily’s 30 highest absolute temperatures in Australia since 1880, we see this:

    ASN00054038 2019 01 19 56.1
    ASN00076077 1906 01 07 50.7
    ASN00017043 1960 01 02 50.7
    ASN00005008 1998 02 19 50.5
    ASN00017043 1960 01 03 50.3
    ASN00076077 1906 01 06 50.1
    ASN00078077 2018 01 19 50.0
    ASN00011008 1979 01 03 49.8
    ASN00011004 1979 01 13 49.8
    ASN00006072 1998 02 21 49.8
    ASN00048013 1903 01 04 49.7
    ASN00048013 1878 01 13 49.7
    ASN00074128 1878 01 12 49.6
    ASN00017123 2013 01 12 49.6
    ASN00038002 1972 12 24 49.5
    ASN00076077 1906 01 24 49.4
    ASN00076077 1904 12 31 49.4
    ASN00074128 1863 01 05 49.4
    ASN00018103 1960 01 02 49.4
    ASN00017031 1960 01 02 49.4
    ASN00011016 1971 01 07 49.4
    ASN00006072 1998 02 16 49.4
    ASN00004035 2011 12 21 49.4
    ASN00018044 1939 01 09 49.3
    ASN00017123 2014 01 02 49.3
    ASN00004106 2018 12 27 49.3
    ASN00052026 1903 01 03 49.2
    ASN00048013 1878 01 19 49.2
    ASN00017043 1960 01 01 49.2
    ASN00006072 2014 01 10 49.2

    Only one of the 30 belongs to Jan 2019, and only 7 to the years after 2000.

    Thus, even if they have harsh consequences (drought, fires, death, diseases), these absolute values for 2019 cannot be so unusual compared with those collected since 1880.

    *
    But if we new have a closer look at GHCN daily’s monthly anomaly means for some 300 stations – with a good repartition all over Australia – and sort them, we obtain the following top 30 (until 2018):

    2015 10 1.62
    2009 11 1.47
    2013 09 1.44
    2005 04 1.44
    2016 04 1.41
    2007 05 1.41
    1883 12 1.40
    2018 04 1.39
    2018 12 1.39
    2009 08 1.38
    2016 03 1.35
    1983 02 1.34
    2016 05 1.33
    1991 06 1.30
    1915 02 1.30
    1957 06 1.29
    2017 03 1.28
    1888 11 1.27
    1915 07 1.23
    2015 11 1.22
    1914 11 1.22
    1988 10 1.20
    1962 06 1.20
    1996 06 1.16
    2016 06 1.12
    1921 06 1.12
    1958 05 1.10
    2013 01 1.08
    1883 06 1.07
    1914 12 1.05

    and the 30 lowest anomalies are as follows:

    1880 06 -1.98
    1901 07 -2.00
    1891 02 -2.00
    1888 03 -2.00
    1896 06 -2.01
    1881 10 -2.01
    1904 06 -2.05
    1894 07 -2.05
    1969 09 -2.09
    1917 05 -2.09
    1892 04 -2.10
    1913 05 -2.11
    1917 02 -2.13
    1880 10 -2.15
    1880 07 -2.19
    1960 05 -2.20
    1896 08 -2.23
    1887 05 -2.30
    1896 07 -2.32
    1881 06 -2.33
    1908 06 -2.37
    1892 09 -2.41
    1899 07 -2.42
    1894 05 -2.47
    1892 12 -2.52
    1894 09 -2.65
    1895 07 -2.70
    1905 09 -2.74
    1905 10 -2.92
    1898 05 -3.07

    What we might deduce out of that is what many commenters say: the warming we experience is less a consequence of an increase of the maxima than of an increase of the minima.

    • bilybob says:

      Good Afternoon/Evening Bindindon,
      Is GCHN ASN00054038 for Narrabri Airport?. BOM lists Narrabri as 54038, I think they are the same, but I could be wrong. BOM lists that day at 42.5C. Could be a data entry error or the ID’s for GCHN are different. I tried searching the news for the all-time high for Australia and came up with Oodnadatta, which you do have listed at 50.7 (tied for second on your list). I have my doubts on the 56.1C, that should have made headlines.

    • bilybob says:

      Bindindon,
      Regardless, as I am one of those who say the average temperature increase is driven by increases in the minima, I do appreciate your analysis. The 56.1C seems a bit high given the tight cluster of high temperatures around 50C plus/minus.

      • Bindidon says:

        Welcome bilybob!

        I did not add the station names, as the focus was on temperatures.

        You are right: it is

        ASN00054038 -30.3154 149.8302 229.0 NARRABRI AIRPORT AWS

        You easily find them with a download of

        https://tinyurl.com/ydbymtp6

        Indeed, the 56.1C are quite high compared with the other stations. Narrabi had a peak at 42.5 C three days before, visible in its ‘dly’ file.

        GHCN daily is no really official dataset! But such errors in the daily records have no influence on the monthly averages, they account for at best +- 0.001 C for the Globe.

        The increase of minima as ‘warming motor’ is worldwide known inbetween, a nice pic was made by Clive Best in one of his head posts about GHCN daily:

        http://clivebest.com/blog/?p=8464

        • Mike Flynn says:

          B,

          I hadn’t come across “warming motor” before. Is the motor driven by CO2, or just another example of the jargon used by pseudoscientific climatologists to avoid facing reality?

          Cheers.

        • bilybob says:

          Thanks Bindindon,

          That last graph for Clive probably shows best how I view how temperature has changed over time.

          An interesting study would be to compare hourly temperatures for a sample of sites (that had hourly temperatures) over time. Do you know if the data goes back 50 years? A lot of data crunching but I would expect the daily curve would shift to a negative skew and negative kurtosis. However, in higher latitudes, the kurtosis may actually go positive. Not sure though. Might make a great paper Dr. Spencer.

          If true, it would reinforce the impacts of GHG’s, at least from my perspective/understanding of how they work.

          • Bindidon says:

            bilybob

            “An interesting study would be to compare hourly temperatures for a sample of sites (that had hourly temperatures) over time. Do you know if the data goes back 50 years?”

            I’m sorry, bilybob… I do not know of such hourly data.

            Anyway, to process it, you would need a supercomputer.

            Processing all 36000 GHCN daily stations (about 15 GB) takes 20 mins on a 6GB/3GHz guy.

            Imagine that data multiplied by 24…

          • bilybob says:

            I think a sample size of 100 would be sufficient. My thought was more to see if the temperature curve changed over time. That would be 24X365X10 (decadal average) for 5 decades or about 500k data points per site if they existed or about 50Million overall. I think my I7 could handle that. Get 10 sites per 10 degrees of latitude, drop it down as you get into the higher latitudes. Anyway, I do prefer looking at changes for particular sites of time rather than analyzing global anomaly averages.

          • bilybob says:

            Bindindon,

            The USA started a program in 2000. Only Ashville North Carolina goes back that far, but they added sites each year. Overall, there are now over 100 sites. Not sure if 18 years of data an one site would be sufficient to draw any conclusions, but still think it would be interested.

            If I get time, will try to do something with it.

    • Gordon Robertson says:

      bilybob….”Im really wondering about these very high anomalies computed by the BoM over Southwestern Australia.”

      Take a look at the baseline, it’s now 1950 – 1980 whereas it used to be 1950 – 1990. They are using two of the coldest recent decades, 1950 and 1960 and they used to offset it somewhat using the warmer decades of 1970 – 1990. Having dropped the 1980 – 1990 decade the anomalies are bound to be greater.

      It’s blatant cheating through statistical manipulation.

      • bilybob says:

        Yes, the anomaly can be modified by changing the baseline. But that would also mean older data would be using the lower baseline, so the line/curve would look the same, just higher. The resulting increases/decreases over time should be the same.

        I am not a big fan of use of anomalies. I understand the strengths in able to compare different sites, but not sure if they consider the deviation of the data. So a 10 degree anomaly in Canada would probably fall within a normal curve of its temperature history, whereas at the equator that anomaly might fall outside 2 standard deviations. Just an example, don’t know what the deviations are, but I do know temperature is more variable as you move to the higher latitudes.

        As far as temperature data sets, I prefer to work with the min and max data. But even with those, I see obvious errors from time to time. Don’t have a lot of experience with BOM, played with Alice Springs to try to figure out why GISS adjusted historic data lower by 2C. The BOM data does not support that adjustment and it wipes out the 1890 temperature extremes.

        • Bindidon says:

          bilybob

          “Yes, the anomaly can be modified by changing the baseline. But that would also mean older data would be using the lower baseline, so the line/curve would look the same, just higher. The resulting increases/decreases over time should be the same.”

          Exactly. There are small differences dur to the fact that not all stations have data for an entiire reference period. Thus the station sets used to construct anomalies out of absolute data for different reference periods (e.g. 1951-1980, 1971-2000, 1981-2010…) may differ slightly.

          *
          “I am not a big fan of use of anomalies. I understand the strengths in able to compare different sites, but not sure if they consider the deviation of the data. So a 10 degree anomaly in Canada would probably fall within a normal curve of its temperature history, whereas at the equator that anomaly might fall outside 2 standard deviations. Just an example, dont know what the deviations are, but I do know temperature is more variable as you move to the higher latitudes.”

          That is the reason why anomalies are computed station by station, grid cell by grid cell, and last not least latitude band by latitude band (because you must perform latitude weighting before averaging into a day, a month or a year).

          Nobody would mix today stations located at different altitudes, or having rural vs. urban character, before constructing anomalies out of their absolute temperatures, let alone would anybody mix station data from Canada with that coming from the Tropics!

          Jesus… Only people like Robertson deliberately ignore that.
          You shouldn’t.

          • bilybob says:

            Bindindon,

            If you could link me to a document that shows they look at the statistic variation of temperature in determining a global anomaly that would be great. My understanding is that latitude banding is not adjusted for variation, but rather just on area differences. But then again, I don’t like using anomaly data, so I don’t do much research on the methodology. To me, a global average has very little value.

            My preference to use station to station analysis on absolute temperature data. It gives a better apples to apples analysis over time, though it is limited to that site.

          • Gordon Robertson says:

            binny….”Only people like Robertson deliberately ignore that.
            You shouldn’t”.

            Anomalies give the cheaters at NOAA and GISS a means of manipulating the data to show warming where no warming exists.

            In science, we use real data and weighting is not normally a requirement. In the case of UAH data acquired from AMSU units, weighting is required to compare the reception of different receivers centred at different frequencies (AMSU receiver channels).

            That is, adjacent channels receive different degrees of the same microwave frequency emitted by oxygen molecules. Since the frequency is related to the temperature and the altitude, weighting is required to ascertain how much of the same frequency is in each channel.

            With surface thermometers there is an entirely different problem. There are not enough thermometers to cover the entire planet at a low enough resolution to be meaningful. Therefore, NOAA and GISS synthesize temperatures from adjacent thermometer stations that may be up to 1200 kilometres apart.

            Here is BC, Canada, where temperatures can vary over a 40 degree range within 150 miles, that is hardly an efficient means of collecting temperatures. So, NOAA and GISS do even more fudging.

            The basic problem with anomalies is determining the baseline. If the baselines are nor representative, the anomalies are so much garbage, as is being proved in this article by BOM and GISS.

            IF NOAA has a century of data, why is it using such a narrow baseline that is not representative of all the data? At least, UAH’s baseline is well represented within the range of the data. There’s only one reason NOAA does that, to emphasize warming.

            Then you have clowns like binny. who works with fudged data while denying it is fudged. When both NOAA and GISS admit to dropping confidence levels to 38% and 48%, altering baselines to favour warming, chopping surface stations by 75% then fudging the missing temperatures in a climate model, and he believes them, then I feel justified in calling him a clown and an idiot, especially when his results show UAH and NOAA neck in neck in comparison.

            Only a myopic alarmist could possibly produce such drivel.

          • Bindidon says:

            bilybob

            “If you could link me to a document that shows they look at the statistic variation of temperature in determining a global anomaly that would be great. ”

            Could you expand this somewhat? What exactly do you mean with “look at the statistic variation of temperature” ?

            It is somewhat cryptic…

            ” My understanding is that latitude banding is not adjusted for variation, but rather just on area differences.”

            Latitude weighting is of course an area based correction.

            “My preference to use station to station analysis on absolute temperature data. It gives a better apples to apples analysis over time, though it is limited to that site.”

            Of course!

            And by not accepting anomalies, you automatically miss the possiblility to compare highly differing absolute data, e.g. surface vs. troposphere, or troposphere vs. stratosphere, etc etc.

            Look at the grap below

            https://drive.google.com/file/d/1_ecu50TZYPYfr57XIWZ_rcu9p2trm2hy/view

            and try to imagine yourself comparing the two time series using absolute data!

            Good night from Germany at UTC+1 i.e. 03 AM, time to go to bed.

          • Bindidon says:

            Robertson

            “IF NOAA has a century of data, why is it using such a narrow baseline that is not representative of all the data?”

            It is no more than a tiny detail, but it perfectly shows the level of your mix of ignorance and arrogance.

            Simply because NOAA’s former reference period was…

            1901-2000

            It cost them a lot of work to move to WMO’s previous recommendation (1971-2000).

            And like all others, Robertson genius, they will move toward… 1981-2010. Because it is WMO’s actual recommendation…

            Your ignorance is so terrifiying.

          • bilybob says:

            Bindindon says “And by not accepting anomalies, you automatically miss the possiblility to compare highly differing absolute data, e.g. surface vs. troposphere, or troposphere vs. stratosphere, etc etc.”

            This is a very good point. But to clarify, it is not that I don’t accept anomaly analysis, it has it strengths. It also has its weaknesses. I simply do not find it useful. As an example, back in December you provided some graphs for Norway.

            1. 1900-2018, absolute

            https://drive.google.com/file/d/1xX7y5w52v4oS83CESOC8Yls5NXbHYGOl/view

            2. 1900-2018, anomalies

            https://drive.google.com/file/d/1dbu5MrQqDkhFg1LHzN6Qnrof2Nxdurbi/view

            Tell me your impression of the temperature change from 1900 to present in Norway using absolute vs. anomalies and you will begin to understand. The absolute data shows maybe a 0.5C difference but using anomaly you would think Norway is 3C warmer.

    • An Inquirer says:

      Yes. I think folks on both the skeptical and the alarmist side are saying that increased minima is responsible for the bulk of warming that we have observed. Alarmists maintain that such an observation can be explained by GHE theory, and skeptics maintain that such an observation can be explained by urban heat island effect. The skeptics explanation is more intuitive, but that fact does not mean that the alarmists are wrong.
      While both camps are saying that winters are more mild now (compared to 40 to 50 years ago), skeptics also point out that summers are more mild. Alarmists disagree, but in my neck of the woods, summers are definitely more mild. The number of days above 100 are way down, and days over above 90 have also had a considerable drop in numbers.

      • bilybob says:

        An Inquirer says “Alarmists maintain that such an observation can be explained by GHE theory, and skeptics maintain that such an observation can be explained by urban heat island effect.”

        It may also be possible that both are correct, or at least partially. The urban heat island effect may impact data that to show a higher increase in average temperatures. But that would not explain rural areas.

        But to expand on the minima vs. maxima temperature data, Mike Flynn says downstream…

        “As an example, maximum surface temperature on the Moon, after the same exposure time, is around 127 C. On the Earth, no more than 90 C. It seems that the atmosphere results in lower maximum temperatures.”

        I would expand on Mikes comment that on Earth the hottest temperatures are found with the lowest GHG,s. I have read that the maximum air temperature possible is in the 50 – 60C range (Sorry no link to source, but know it was a geographer). This would have to be a low GHG area, dry/no clouds, no auto emissions, summer day. Adding GHG’s lowers this number and moving to higher latitudes lowers this maximum number due to the sunlight angle.

        We are now near conditions similar to 115,000 years ago where the Sea Level was significantly higher. We should be asking if that extra CO2 in the atmosphere has kept the Antarctic Ice from melting and raising the sea level or if there are other factors involved.

  47. ren says:

    Soon, the stratospheric intrusion will hit over the Great Lakes again.
    https://pics.tinypic.pl/i/00979/dbdvuavzbgtf.png

    • Gordon Robertson says:

      ren…”Soon, the stratospheric intrusion will hit over the Great Lakes again”.

      ren…it seems the stratosphere is not a nice place to live.

  48. Bindidon says:

    For bilybob, just for fun

    A little pic comparing anomaly time series for Australia, out of

    – UAH 6.0 AUS
    – GHCN V3
    – GHCN daily

    https://tinyurl.com/y7doezps

    (this d…ed Google Drive really managed to create a file name sequence containing ‘d c’)

    Sources as always.

    • Mike Flynn says:

      B,

      Are you seriously depending on temperatures supplied by the BOM?

      Have you read and understood the BOM disclaimer as to the accuracy, reliability, or quality of the records?

      Acceptable for pseudoscientific climatological types, I suppose. These people would even accept maxima and minima from thermometers which are uncalibrated, and whose accuracy is assumed, not checked.

      Carry on. Maybe you are convinced you can predict the unknowable future by relentlessly reanalysing the uncertain past. Good luck with that – I believe it to be impossible, but feel free to prove me wrong.

      What prediction about the future can you make, that I cannot make myself? None? What is the point of your furious pencil twiddling then?

      You might as well use your time doing word puzzles. You will probably learn more.

      Cheers.

    • Gordon Robertson says:

      binny…A little pic comparing anomaly time series for Australia, out of….”

      You are not only a layman, as admitted, you have absolutely no idea of how to analyze data.

      • Bindidon says:

        “You are not only a layman, as admitted, you have absolutely no idea of how to analyze data.”

        Ha ha ha ha!

        I try to imagine what spurious nonsense you would produce instead, but that bypasses my fantasy by dimensions.

        Poor Robertson: confuse, divert, discredit, denigrate and lie.
        That’s all you were ever able to do… and you will never stop doing.

  49. Gordon Robertson says:

    Roy…”The BOM announcement mentions record no less than 28 times but nowhere (that I can find) in the report does it say just how long the historical record is. My understanding is that it is since 1910. So, of course, we have no idea what previous centuries might have shown for unusually hot summers”.

    Great point, Roy. I watched a video recently in which the author pointed out that many alarmists claims are based from 1960 onward. He claimed 1934 and 1936 were the hottest years in the US by far. The 30s era had the longest stretch of heat waves in US history, by far.

    He went so far as to claim the temperature peaks were 10 degrees hotter in the 1930s than today.

    https://www.youtube.com/watch?v=Gh-DNNIUjKU

    Long, but worth the viewing…by an expert in data analysis and quality control.

  50. gallopingcamel says:

    @Mike Flynn,
    “Nobody can even define the GHE.”

    You may be right but my understanding is that the GHE is the temperature change that can be attributed to a world’s atmosphere.

    If you accept that idea, one needs to compare the temperature of a body with the same body “sans atmosphere”.

    In the case of Earth most people agree that the average global temperature is 288K. The average temperature of the Moon is 197K so it appears that the GHE for this planet is 91K.

    OK, that is Ned Nikolov’s number……other people may differ, for example my estimate is 79K. However the “Consensus” GHE of 33K is not even close.

    • Mike Flynn says:

      gc,

      I appreciate the attempt.

      You wrote –

      “. . . the GHE is the temperature change that can be attributed to a worlds atmosphere.”

      Obviously, anything can be attributed to anything else. Who can disprove it?

      A problem immediately arises, in that you immediately change your definition from “temperature” to “average global temperature”, which is another indefinite term. Certainly not the surface, and incapable of valid calculation, in any case.

      Obviously, I prefer real measurements, backed up by science rather than pseudoscience. As an example, maximum surface temperature on the Moon, after the same exposure time, is around 127 C. On the Earth, no more than 90 C. It seems that the atmosphere results in lower maximum temperatures. This accords with scientific observations, (even NASA agrees), that much of the Sun’s radiation does not even reach the surface.

      If you want to insist that exposing a thermometer to less heat makes the thermometer hotter, then you are led to the conclusion that maximum temperature must occur when the thermometer receives no heat at all!

      So your definition of the GHE is of no utility, and it doesn’t accord with the fact that the surface has cooled for four and a half billion years or so.

      So, you cannot formulate a testable GHE hypothesis. You are stuck with pseudoscientific wishful thinking for the present.

      You will find you cannot come up with a GHE definition that can withstand obvious scientific observations and questions. I know it’s tough, but that’s science for you. It progresses one mistake at a time, punctuated by occasional and unforeseeable flashes of genius.

      Cheers.

      • gallopingcamel says:

        “So your definition of the GHE is of no utility…..”

        IMHO the concept of GHE has great utility especially in relation to man’s desire to visit other worlds. Before one sets off on a trip to Kepler 62B or Proxima Centauri B it would be good to have information about the surface temperature and atmospheric composition.

        Here is a paper that addresses these issues:
        https://arxiv.org/pdf/1608.08620.pdf

        • Mike Flynn says:

          gc,

          The concept of a GHE is useless, if you want to know the pressure, temperature or composition of an atmosphere.

          For example, given a pressure of 1 bar, what would you expect the temperature to be on Earth – +90 C, -90 C, or something in between?

          I’d be inclined to use some sort of remote temperature sensing device, myself.

          As to pressure, a barometer is more useful than a thermometer, GHE notwithstanding.

          Your supposed GHE is of precisely no utility, as far as I can see. To each his own, I suppose.

          Cheers.

          • Gordon Robertson says:

            mike…”For example, given a pressure of 1 bar, what would you expect the temperature to be on Earth +90 C, -90 C, or something in between?”

            I have been working on this for a couple of hours and the numbers are so large I am getting a headache. I had been trying to apply the Ideal gas Law to the volume of a layer around the Earth 100 metres thick and calculating the number of litres in that to get the number of moles.

            Then it occurred to me to just measure 1 litre of air at 1 atm. since a larger volume with the same ratio of moles of gas to volume should produce a similar result.

            As the number of litres increase at 1 atmosphere, the number of moles should increase proportionately, offsetting the increase in volume provided the pressure remains constant. I was using a couple of online calculators and they were giving temperatures of 20,000 C, or so.

            Consider the Ideal Gas Law:

            PV = nRT

            T = PV/nR

            You can take R to be around 0.082 (Litre.Atm)/(mole.K)

            Found something interesting. If you take 1 litre of air at 1 atm, as you specified, you can convert to the number of moles by presuming 1 mole of air has 22.4 litres.

            Since we have chosen 1 litre, then the number of moles has to be 1/22.4 = 0.04464 moles. Since the moles and R are in the denominator, multiply moles by 0.082 L.atm/mole.K

            I am going to do it another way to get rid of some garbage by first dividing by R.

            T = {(1L.1A) (12.2 mole.K/L.A)}/0.04464 moles

            Ok…that cancels the Ls and the As leaving me with mole.K in the numerator and mole in the denominator.

            So I have T = (12.2 mole.k)/0.04464 mole = 273.3 K

            Recognize that temperature???

            That should presumably apply for any volume of air at 1 atmosphere.

            I think there is something missing. Just as density is measured at slightly above 0C for water, I think maybe the gas constant, R, applies at a certain temperature as well.

            It seems that a gas atmosphere like air mitigates the temperature of a planet. On Earth, the air at 1 atmosphere SHOULD regulate the air temperature to 273 K.

            I stand to be corrected, but not by trolls who have no science to offer and only ad homs.

          • Gordon Robertson says:

            Mike…thinking out the reasoning of the Ideal Gas Law and the relationship of 1 atmosphere to volume, temperature, and the number of moles (gas atoms in air).

            You can only have 1 atmosphere pressure with air if there are enough atoms with enough energy to put that pressure on the walls of a container. Therefore, the pressure require atoms with kinetic energy corresponding to 273 K in sufficient quantity in a certain volume.

            I’m sure that’s where we get Standard Temperature and Pressure. With a standard pressure of an atmosphere in any volume, we require a certain number of atoms of gas and a temperature of 273 K.

            Alternately, a volume with gas at 1 atmosphere pressure will have a temperature of 273 K.

            It makes sense as well, that as we climb a significant mountain, the air pressure will reduce and with it the air temperature.

          • Mike Flynn says:

            Gordon,

            I look at it a little differently. Gas pressure has no influence on temperature at the ranges encountered in meteorology.

            Shaded air temperature measurements using mercury in glass thermometers range between around 56 C and – 38 C. Anyone trying to figure the barometric pressure at the time will not do well.

            Ground temperatures vary between around 90 C and – 90 C. Pressure, likewise, is irrelevant. Even more so on the Moon, where atmosphere is severely lacking, yet the temperature range exceeds anything on Earth, both hotter and colder.

            Air at 0.1 bar may be at exactly the same temperature as that 100 bar. Everything in a freezer at -18 C is at the same temperature – meat, ice, plastic, steel racks, the mercury, glass, brass clips, wooden backing board, paint, in a thermometer, even a cylinder containing gas at 100 bar, or an empty cylinder at 1 bar. It doesn’t matter whether things are shiny, dull, opaque or transparent – they are all at the same temperature!

            Or at 20 C, or 50 C.

            As to standard temperature and pressure, they are specified to be 0 C, and 1 bar. Temperature and pressure may be adjusted independently from those of the current environment. The volume of a mole of gas will vary depending on pressure and temperature, of course.

            A fun factoid –

            “In July 1989, at Vostok, a difference of 34 °C (61 °F) were recorded between the ground, where the temperature was -78 °C (-108 °F) and 600 meters (2,000 feet) above, where it was -44 °C (-47 °F): still at 8,000 meters (2,600 feet) the temperature was -73 °C (-99 °F), so it was higher than at ground level.”

            Unfortunately, measurement showed temperature increasing with altitude. No particular correlation between pressure and temperature.

            No gravitothermal GHE. No CO2 GHE. Actually, no sign of a GHE of any description! Oh, what fun we had!

            Cheers.

          • Gordon Robertson says:

            Mike..Shaded air temperature measurements using mercury in glass thermometers range between around 56 C and – 38 C. Anyone trying to figure the barometric pressure at the time will not do well”.

            I agree, but we’re not talking solar heating in the Ideal Gas Equation, we are simply talking about the relationship between temperature, pressure, volume, and the number of atoms involved.

            With one of those thermometer shelters there are slats on the sides to prevent the elements getting at the thermometer and influencing it. The openings will prevent the pressure changing much.

            I am presuming a steady-state condition with solar heating on top of it. Of course, without solar heating, we’d be doomed.

            The pressure in the atmosphere has to set the average temperature. I realize there are more complex factors involved, however, temperature is the average kinetic energy of air molecules and pressure is related to the kinetic energy as well.

            Temperature, pressure, and the number of atoms/molecules go hand in hand. The are inseparable.

    • Gordon Robertson says:

      cam…”You may be right but my understanding is that the GHE is the temperature change that can be attributed to a world’s atmosphere”.

      In a more specific way.

      The theory goes that GHGs in the atmosphere act like glass in a greenhouse to trap heat or in some interpretations, to slow the loss of heat while allowing the atmosphere to warm.

      Initially it was thought that the glass in a greenhouse trapped infrared radiation but that makes little sense. It presumes IR is heat and it is not. IR is converted to heat by electrons in atoms. Therefore, the theory suggests a recycling of heat which contradicts the 2nd law and perpetual motion.

      R. W. Wood, an expert on CO2 radiation, claimed a greenhouse does not warm by trapping IR but by trapping molecules of air with higher energy levels due to them being trapped by the glass. Wood claimed greenhouse warming is a convection issue, a lack thereof.

      There is nothing in the atmosphere to trap molecules of air, therefore the atmosphere cannot act like the glass in a greenhouse.

      With regard to the slowing of radiation from the surface, GHGs have nothing to do with that in essence. According to Stefan-Boltzmann, it is the temperature differential between the surface and the layer of atmosphere immediately above it that controls the rate of heat dissipation at the surface.

      That surface layer of air is comprised of 99% nitrogen and oxygen and GHGs don’t add significant warming to that layer according to the Ideal Gas Equation.

      That same layer does absorb heat from the surface directly and transports the heat high into the atmosphere. According to Wood, once the heat is absorbed and convected, the nitrogen and oxygen are slow to release it.

      There’s your GHE sans greenhouse.

  51. PhilJ says:

    gc,

    “In the case of Earth most people agree that the average global temperature is 288K. The average temperature of the Moon is 197K so it appears that the GHE for this planet is 91K.”

    Or perhaps the Earth is 91K warmer and has an atmosphere because it has not yet had enough time to lose all its atmosphere and cool to the state the moon is in….

    The atmosphere does not warm the surface… The surface warms the atmosphere.

    Or to say it another way heat will always naturally move from a hotter object to a colder object… Just as water will always naturally flow downhill…

    • Mike Flynn says:

      Yes.

      Here’s the WMO, about air temperature measurement –

      “Thus, temperature represents the thermodynamic state of a body, and its value is determined by the direction of the net flow of heat between two bodies.”

      Nothing about adding fluxes, cold warming hot, or any of the other nonsense beloved of the pseudoscientific community. It is possible the World Meteorological Organization is not privy to the closely guarded secrets of the Climate Cult.

      It’ll do me for the moment.

      Cheers.

    • Gordon Robertson says:

      philj …”The atmosphere does not warm the surface The surface warms the atmosphere.

      Or to say it another way heat will always naturally move from a hotter object to a colder object Just as water will always naturally flow downhill”

      And according to R. W. Wood, an expert on CO2 radiation with whom Bohr consulted re radiation from sodium vapour, the atmosphere, once warmed by the surface, cannot cool easily since gases like N2 and O2 tend to retain heat. That explains the so-called greenhouse effect, which has nothing to do with greenhouses, or radiation, and everything to do with the inability of N2/O2 to cool easily.

      The notion that 0.04% CO2 in the atmosphere can cause more than a few hundredths C warming is just plain silly.

      • PhilJ says:

        GR,
        “the atmosphere, once warmed by the surface, cannot cool easily since gases like N2 and O2 tend to retain heat. ”

        Indeed. And h20 at the tropopause and co2 at the mesopause facilitate the cooling of insulators like n2 and o2…

        burning fossil fuels removes an insulator (O2) and replaces it with the very good radiator h20 and the lousy radiator co2 (still better than o2) thus burning fossil fuel increases the efficiency at which the atmosphere cools to space…

        observed reduced drag on satelites is evidence that the TOA is contracting which is consistent with a cooling atmosphere…

    • Bindidon says:

      PhilJ

      “Or perhaps the Earth is 91K warmer and has an atmosphere because it has not yet had enough time to lose all its atmosphere and cool to the state the moon is in.”

      Earth daily atmospheric leakage is 90 tons/day, due to weaknesses in its magnetic field.

      Atmosphere’s weight is 5 * 10^15 tons.

      Thus, other things keeping equal, Earth will have lost its atmosphere in about 150 billion years.

      • Mike Flynn says:

        B,

        Recent research points to sequestration being the major cause of loss of atmosphere.

        On the other hand, where did the atmosphere come from in the first place?

        There seem to be a variety of guesses.

        Cheers.

      • PhilJ says:

        Bin,

        “Thus, other things keeping equal, Earth will have lost its atmosphere in about 150 billion years.”

        The chances of all things being equal for 100 billion years are pretty much nil…
        but yes the Earth is unlikely to lose much of its atmosphere anytime soon…
        unlike Venus, which I suspect will lose its atmosphere relatively quickly once it finishes cooking off its water…

  52. Ross says:

    The cartoon graphic provided of Australia’s continent in this article by Roy Spencer is a prime case of typical climate change denial.

    The posts have as usual on pseudoscience that Roy Spencer trouble making had started. The last few comments are utter nonsense. Roy Spencer knows this rather sadly yet keeps quiet after the stirring the pot as usual.

    He had achieved absolutely with these kinds of articles he posts as unusual. The thing only worth seeing and sighting is the monthly UAH temperature graphs of temperature anomalies.

    • ren says:

      “The monthly map for January 2019 shows the usual situation of alternating hot and cold
      regions in the subtropical and higher latitudes. This time, the cold regions are found in
      eastern Canada, Europe (from the Barents Sea southward to the Mediterranean Sea),
      India, western Pacific Ocean and broad regions around Antarctica northward. The warm
      spots are roughly in between these, landing in western North America, the North Atlantic
      Ocean, the Middle East, Eastern China, and several areas over the Pacific and South
      Atlantic oceans with a particularly significant hot spot over southeastern Australia
      (summertime) for the second month in a row.”
      https://www.nsstc.uah.edu/climate/2019/201901_map.png
      Anomaly in the tropics is +0.37 C.

    • ren says:

      Another cool front will cause a drop in temperature in the south east of Australia.
      https://pics.tinypic.pl/i/00979/njqvmcs7grqx.png

    • Mike Flynn says:

      Ross,

      You are a dimwitted trolling fool, unless you can name one person who is of sound mind, who denies that that the climate has been changing ever since the emergence of the first atmosphere.

      You are delusional.

      Begone, troll.

    • Gordon Robertson says:

      ross…”Roy Spencer trouble making had started. The last few comments are utter nonsense. Roy Spencer knows this rather sadly yet keeps quiet after the stirring the pot as usual. ”

      Roy’s main point, and well taken, is that the BOM has cherry-picked warming from a certain time onward while ignoring equally warm years in the past. It’s a common trick of alarmists to begin their temperature series at 1960 to draw attention away from extremely hot temperatures in the 1930s.

      The 1930s, particularly 1934 and 1936, were far warmer than any years since in North America. Since the collection of temperature data was spotty globally in that era we have no way of knowing to what extent the warming occurred globally.

      NOAA, after whom the BOM model themselves, has gone back and adjusted the 1930s warming downward, which is nothing short of scientific misconduct.

  53. ren says:

    The temperature is dropping sharply on Lake Michigan.
    https://images.tinypic.pl/i/00979/ur4u9j5lqnnt.png

  54. gallopingcamel says:

    @Gordon Robinson,
    “The notion that 0.04% CO2 in the atmosphere can cause more than a few hundredths C warming is just plain silly.”

    Well said. In the troposphere of Venus the temperature at any given pressure matches that on Earth if you multiply by 1.176.
    https://tallbloke.wordpress.com/2019/01/17/nikolov-zeller-reply-to-dr-roy-spencers-blog-article/comment-page-1/#comment-146358

    So what is the significance of 1.176? Raise that number to the fourth power and you get 1.9126. The TSI for Venus is ~2,613 W/m^2 while the corresponding figure for Earth is 1,362 so divide one into the other and you get 1.9185.

    According to Stefan-Boltzmann, other things being equal, temperature should be proportional to the fourth root of the incident power and the above facts conform to theory with stunning accuracy.

    One may object that other things are not equal. One planet has 0.04% CO2 while the other has >97%. That may be true but it does not seem to matter.

    • Bindidon says:

      gallopingcamel

      Thanks for this intelligent comment, above all based on facts rather than on ‘plain silly thoughts’.

      Ma foi, on dirait qu’il y a des chameaux galopants qui sont beaucoup plus intelligents que certains êtres humains…

    • Svante says:

      And those numbers match the giza pyramids, which contain a chronology of events embedded in the structure itself that prophesied events far into the future.

    • Myki says:

      Nice try but you have not explained why the temperatures (kelvin) are 18% higher to begin with!
      i.e.where does the 1.176 factor come from?
      The answer is GHE !
      Please do a course in basic atmospheric physics before you comment.

    • Mike Flynn says:

      gc,

      You wrote –

      “According to Stefan-Boltzmann, other things being equal, temperature should be proportional to the fourth root of the incident power . . .”

      I believe you have it back to front. The following is the correct statement –

      “Stefan-Boltzmann law, statement that the total radiant heat energy emitted from a surface is proportional to the fourth power of its absolute temperature.”

      This is a camel of a completely different kind.

      In any case, the law applies to black bodies only.

      If you are getting stunningly accurate results from non-black bodies, maybe something is wrong somewhere.

      Cheers.

      • gallopingcamel says:

        The Stefan-Boltzmann equation can be applied to “non-black” bodies by adding the the function Albedo for incident energy and the function epsilon to represent the emissivity for outgoing energy.

        Tgb = {So(1-α)/4εσ}^0.25

        Where So is TSI = 1,371 W m-2, α is albedo = 0.3, ε is emissivity = 0.96, and σ is the Stefan-Boltzmann constant = 5.6704 x 10⁻⁸ kg/s^3/K^4

        This is how “Consensus Climate Scientists conclude (wrongly) that the temperature of an airless Earth would be 255 K.

        • Mike Flynn says:

          gc,

          In the interim, I believe I will continue to use a thermometer to measure temperatures.

          The barometer will be reserved for pressure.

          At present, if speculation and reality differ, I’ll keep relying on reality for practical purposes.

          Have fun.

          Cheers.

        • Myki says:

          ” This is how “Consensus Climate Scientists conclude (wrongly) that the temperature of an airless Earth would be 255 K.”
          Yet, surprise, surprise, this is quite close to the average temperature for the moon
          (250K). The small difference is without doubt due to uncertainty in the albedo.

          So, what is the problem ?

        • Myki says:

          BTW, a small point, the SB equation applies to black or “non-black” bodies via the emissivity value.
          Secondly, the albedo has nothing to do with black or “non-black” bodies since it simply accounts for the reflectance of short-wave radiation (and is unrelated to long-wave radiation).

          • Mike Flynn says:

            Myki,

            BTW, a small point.

            Real scientists tend to use something like the following –

            “Specifically, the StefanBoltzmann law states that the total energy radiated per unit surface area of a black body across all wavelengths per unit time (also known as the black-body radiant emittance) is directly proportional to the fourth power of the black body’s thermodynamic temperature T:”

            You are obviously confused, and using the pseudoscientific climatological fake version.

            Stupidity and ignorance are no excuse, but I realise that’s all you’ve got.

            Cheers.

          • Myki says:

            MF you have missed the point entirely (again)

          • Mike Flynn says:

            M,

            I could ask you what your point was, but that would be pointless, wouldn’t it?

            Keep waffling and making stuff up as you go. Maybe someone will believe you.

            Have you given thought to actually providing a description of the GHE, which you seem to believe exists?

            Carry on laddie. Maybe you can debate or consensify fantasy into fact, but I doubt it.

            Or you could just keep trolling by making nonsensical cryptic comments.

            Cheers.

    • Chic Bowdrie says:

      gallopingcamel,

      This reminds me of the gravito-thermal hypothesis that planetary temperature profiles are determined by gravity and the heat capacity of the atmosphere. Where did you find the temperature data correlating Venus and Earth? I would like to compare the planets using the ideal gas law to convert temperatures to densities at equal pressures. You probably know if this has been done somewhere else and that would be good to see as well.

  55. .
    ❶①❶①❶①❶①❶①❶①❶①❶①❶①❶①❶
    ❶①❶①
    ❶①❶① . . . Is Tamino stupid? . . .
    ❶①❶①
    ❶①❶①❶①❶①❶①❶①❶①❶①❶①❶①❶
    .

    Tamino is a funny little man.

    He likes to produce graphs which show how stupid Deniers are.

    But what are we meant to think, when Tamino produces graphs like the following ones?

    Is Tamino trying to show that Alarmists are just as stupid, or possibly more stupid, than Deniers are?

    My advice to Mr Tamino (which he will probably ignore), is that when you want to prove that somebody is stupid, don’t do something that is even stupider.

    Mr Tamino seems to belong to that group of people, who believe that any warming is “global warming”, but that any cooling is just weather.

    Mr Tamino, you may now take your foot out of your mouth. And you should get those self-inflicted bullet holes in your feet looked at.

    https://agree-to-disagree.com/is-tamino-stupid

    • Norman says:

      Sheldon Walker

      I agree with your assessment of Tamino. I think he is a closed minded fanatic.

      • Svante says:

        Why do you think that Norman?

        • Norman says:

          Svante

          I was posting ideas on his blog that he did not like and then he edited a post I made about smoking and it made me look bad. I told him he had no integrity. He also banned me at that same time. He reminds me of the polar opposite of the fanatic Joseph Postma.

          Both these two are radicals that cannot tolerate any ideas that question their positions. I consider them to be like a proton and an anti-proton. If they meet they would annihilate each other.

          If you want to find out post some opposing ideas on Tamino’s blog.

          I think this might be one of the better blogs on climate change as Dr. Spencer seems to allow all types of thoughts to go on. Nothing much changes.

          Svante, my skin in this game is about science. Empirical evidence, supporting data. The GHE is valid science, the Moon rotation is very logical and can be demonstrated at home with a multitude of objects.

          I would accept some warming from AGW. I do not like the unsupported declarations of Climate Scientists on NPR or other MSM that claim, without proof or evidence, that extreme weather is increasing and can be attributed to global warming. No mechanisms are given for the claims. I would suggest that to be a valid science the Climate Scientists making such claims need to predict future events to close proximity. Where will the floods be next year? How many hurricanes will make landfall in the USA next year and what intensity and where. How many square miles of the USA will burn next year? They only make claims of climate change after some severe weather event but never before. If they are certain global warming is producing the events after the fact, the models must be good enough to forecast future events. Will Australia have record breaking heat next year? How much hotter than previous?

          I think people like Joseph Postma and Tamino are just cult leaders and ban anyone who disrupts their sycophant followers. They are enemies of science and the quest for Truth.

          • Svante says:

            Attribution is difficult, exact predictions do not exist, all we can ask for is statistics and probabilities. I think Tamino is good at that, but editing your post and banning you sounds terrible.

            I agree media anecdotes are pretty useless, as well as media interpretation of science.

          • Chic Bowdrie says:

            Norman,

            You’re beginning to sound like a skeptic. Keep it up.

            Just one thing, you wrote,

            “The GHE is valid science….”

            Valid science, if there is such a thing, should be capable of hypothesis test by empirical measurements. Most of us have heard the GHE described in one way or another, but how can it be tested?

          • Norman says:

            Chic Bowdrie

            I did some calculations on this blog a while back to demonstrate a GHE with real world empirical data.

            You can look at the logic and see if you agree or disagree with my calculations.

            http://www.drroyspencer.com/2016/02/uah-v6-global-temperature-update-for-january-2016-0-54-deg-c/#comment-209000

          • Chic Bowdrie says:

            Norman,

            The problem with your calculations/logic is here:

            “If Singapore was a blackbody (not sure of its emissivity) its temperature from available solar flux [213.75 W/m^2] would be -26 C. In February the average temp of Singapore is 27 C.”

            Before the daily supply of 214 W/m^2 solar input, the surface temperature would be something less than 27 C, but probably never anywhere close to 247K. Temperatures would rise above 27 C and return to around 27 C every day in an average February month in Singapore. The daily solar flux is added to an already warm surface.

            In other words, the surface doesn’t start out at 247K, which solar alone could only maintain, requiring that DWIR bring it up to the average 300K. The surface already averages 300K and just needs the atmosphere to keep the surface from getting too warm during the day and too cool at night. It’s a HVAC system, not a greenhouse.

          • Norman says:

            Chic Bowdrie

            I am not following your logic. I do not know why you believe the surface would start at a warmer temperature and the solar just maintains it?

            Why does the surface already average 300 K? I am not sure what physics you are using to make these determinations.

            I do believe that GHE easily explains the actual world empirical data (that you requested). You are making some assumptions that do not make any rational sense to me. If you could go into deeper explanation on how you come up with this idea I think that would be good.

          • Chic Bowdrie says:

            Norman,

            Singapore never was a blackbody. It didn’t have to warm up to any particular temperature, although it could change from the current 300K average depending on a change in solar insolation. An atmosphere provides insulation that makes Singapore warmer than it would be without the atmosphere. This would be the case regardless of the concentration of any IR absorbing gases in the atmosphere. They reduce the extreme temperatures even further by enhancing daytime cooling and nighttime warming.

            You asked what physics I use. Three years ago I created a crude model to illustrate my view of how the atmosphere works. Scroll down to “Update 2/29/2016 – Chic’s Opening Statement” here: https://climateconsensarian.blogspot.com/2016/02/on-competing-mechanisms-for-observed.html

            In that post, I use equations to estimate the energy flux profiles in the atmosphere. While they are only approximations, energy is conserved throughout using the constraint that Solar = UWIR – DWIR + convection. I see now that my diagram is confusing, but I attempted to illustrate roughly how energy comes in through solar and out via convection and outgoing IR. The lapse rate determines the DWIR and is always less than the UWIR at any altitude.

            My logic is based on atmospheric physics that produces a lapse rate which determines DWIR. Your physics is based on a model where the atmosphere is a big piece of glass letting in solar and bouncing back half the energy as DWIR producing the warmer surface. It is a possible explanation for empirical data, but does the underlying physics actually apply to the atmosphere?

            There are competing hypotheses on what causes the lapse rate and consequently why Singapore starts out at 300K, not 247K. I would recommend answering that question rather than spend your time justifying the greenhouse cartoon model.

  56. ren says:

    Current stratospheric intrusion in North America.
    https://images.tinypic.pl/i/00979/bfvr16bz1b2x.png

    • ren says:

      Seattle to get buried by biggest snowstorm in 2 years this weekend.

      • Svante says:

        Where is all that evaporation coming from ren?
        Warmer water anywhere?

      • Gordon Robertson says:

        ren…”Seattle to get buried by biggest snowstorm in 2 years this weekend”.

        We’re about 200 miles north of Seattle and so far I see nothing unbecoming. It’s cold, and could snow, but the sky is clear. Maybe the Arctic air is pushing the storm south.

  57. .
    ❶①❶①❶①❶①❶①❶①❶①❶①❶①❶①❶
    ❶①❶①
    ❶①❶① . . . The Science and Mathematics . . .
    ❶①❶①
    ❶①❶① . . . . of Earth’s Temperatures . . . .
    ❶①❶①
    ❶①❶①❶①❶①❶①❶①❶①❶①❶①❶①❶
    .

    PART 2 has just been published.
    ==============================

    In Part 2 of this article, I will show some graphs which show how accurate my temperature model of the Earth is.

    I will then reveal the secret of why my temperature model of the Earth is so accurate, but also very simple.

    The reason is, that I have separated the temperature estimates from the actual latitude of a country, and based the temperature estimates on the “effective” latitude.

    See the article for a practical example, and a detailed graphical explanation.

    General information about the series of articles.
    ================================================

    Imagine a temperature model of the Earth, that can explain:

    – 94% of the variation in the average temperature, of every country on Earth

    – 90% of the variation in the temperature of the coldest month, of every country on Earth

    – about 59% of the variation in the temperature of the hottest month, of every country on Earth

    That would have to be a big, complex temperature model, wouldn’t it?

    What if I told you, that the temperature model of the Earth was based on only 4 factors:

    – the average latitude of the country

    – the average longitude of the country

    – the average elevation of the country

    – the area of the country

    Would you believe me?

    I am sure that many people will expect my temperature model of the Earth to be very inaccurate.

    You are welcome to have a look at the results of my temperature model of the Earth.

    Part 1
    ======
    https://agree-to-disagree.com/the-science-and-mathematics-of-earths-temperatures-part-1

    Part 2
    ======
    https://agree-to-disagree.com/the-science-and-mathematics-of-earths-temperatures-part-2

    • Myki says:

      Had a quick look.
      Found no science and no mathematics.
      Simply a simple statistical fit to the temperature data which a geography student could do in their spare time.
      Looks fancy, but is worthless otherwise.
      You have tried hard to convince us that a 1 or 2 or 3 etc degree warming is not worth worrying about because of the scale of your graphs. Pretty stupid in my opinion.
      What a waste of time.

    • Dr Roys Emergency Moderation Team says:

      Myki, please stop trolling.

  58. JCalvertN(UK) says:

    I also wonder if the “broken records” were genuine “as published in the newspaper at the time” records – or whether they have been “BOMadjusted(TM)”.

    BOM’s adjustment algorithim is remarkably effective at cooling the past. As time moves on, the past just keeps on getting cooler!.

    • Myki says:

      Speaking of “broken records”, look at the repetitive nonsense that gets posted by MF and GR.

    • Gordon Robertson says:

      JCalvert….”BOMs adjustment algorithim is remarkably effective at cooling the past. As time moves on, the past just keeps on getting cooler!”.

      Not related to Mad Mike Calvert of WWII fame are you?

      BOM, NOAA, GISS, and Had-crut are all about political correctness these days. We saw that exemplified in the Climategate emails when the aforementioned and their friends were caught red-handed interfering with peer review and fudging the record.

      Two of those involved Phil Jones and Kevin Trenberth are Coordinating Lead Authors at IPCC reviews. They are in charge of the other lead authors, all political appointees.

      The Lead Authors write the Summary for Policymakers and it is issued BEFORE the main report. When the main report comes out, it has been amended to suit the views of the 50 lead authors who wrote the Summary.

      That’s where all the nonsense comes from like the myth that humans are causing 90% of the warming.

      The load of them are corrupt and the sheeple here who support them are morally corrupt.

  59. CO2isLife says:

    Dr Spencer, the CAGW theory is based upon the belief that CO2 “traps” heat in the atmosphere. If that is the case, Average Temperature isn’t the metric that should be tracked, high temperatures should be tracked, or the spread between the high and the low temperature of the day. Average temperatures can be impacted by clear days, clouds, solar activity, Urban Heat Island Effect, etc etc. If if fact CO2 is the cause of the warming, and CO2’s mechanism is a compounding effect of stacking heat upon heat, then record high temperatures should be increasing, and the trend of daily high temperatures should be increasing. Do you have a data set of just the daily high temperatures that you could publish?

    • Bindidon says:

      CO2isLife

      “Dr Spencer, the CAGW theory is based upon the belief that CO2 traps heat in the atmosphere.”

      No.

      CO2 doesn’t trap any heat, let alone would H2O do.

      If these trace gases were absent, nearly all the IR radiation emitted by Earth’s surface would directly reach outer space, and the planet would be cooler.

      The tiny extra effect of CO2 is that as opposed to H2O, it does not precipitate above 8-10 km, and thus absorbs IR and reemits it in all directions where H2O can’t anymore.

      The altitude at which IR reaches outer space is increased tiny bit by tiny bit. The higher this altitude, the lower the reemission energy.

      Please read e.g.

      http://documents.irevues.inist.fr/bitstream/handle/2042/39839/meteo_2011_72_31.pdf

      Unfortunately in French; using

      https://translate.google.com/?hl=en#fr/en

      might help.

      • CO2isLife says:

        “The tiny extra effect of CO2 is that as opposed to H2O, it does not precipitate above 8-10 km, and thus absorbs IR and reemits it in all directions where H2O cant anymore.”

        That won’t melt glaciers, and my understanding is that the stratosphere is cooling, not warming. My understanding is that as the air thins, radiation moves the energy out of the atmosphere far more efficiently than it moves it back to the surface. Anyway, the IR temperature is a lot different from the actual temperature. Astronauts would freeze to death in the “hot” thermosphere.

    • Bindidon says:

      CO2isLife

      “If if fact CO2 is the cause of the warming, and CO2’s mechanism is a compounding effect of stacking heat upon heat, then record high temperatures should be increasing, and the trend of daily high temperatures should be increasing. ”

      No.

      The effect of IR catch is the inverse: it is an increase of minimal temperatures. Maximal absolute temperatures don’t change much in the Globe’s average.

      This is visible below:

      http://clivebest.com/blog/wp-content/uploads/2018/05/Monthly-anoms.png

      It is a comparison of the TMAX/TMIN records in the GHCN daily dataset, made by blogger Clive Best.

      • CO2isLife says:

        Bindidon, I think you made my point. How can you have catastrophic run away warming if high temperatures aren’t increasing? I can understand the low temperatures increasing in urban areas because asphalt takes longer to cool than grass. To identify is the lows are actually increasing, you would need to show a narrowing of temperatures in a dry desert. The data I’ve examined shows no such narrowing.

        Dr. Spencer, can you isolate data sets for 1) Daily High Temperatures and 2) High and Low Temperatures over desert regions?

        If we can do that we can actually try to do a controlled experiment. What amazes me about the field of climate science is that they act as if they have never studied the scientific method and the need for controlling exogenous factors.

      • CO2isLife says:

        Bindidon, that chart is some of the best evidence that CO2 doesn’t cause warming.
        1) The Heteroschediasticity demonstrated pretty much proves these data sets are pure garbage and are highly unreliable.
        2)The spread between high and low has been constant for over 140 years
        3) What trend did exists existed before 1850
        4) Average daily temperatures are below those levels set in the 1800s and early 1900s
        5) The only real trend started in 1990, long after CO2 increased
        6) Prior to 1980, there looks to have been a downtrend in place
        7) Current levels are just getting back to where they were in the late 1940s, and way below the levels in the 1800s
        8) If CO2 is the cause of anything, it appears to MODERATE temperature swings, and NOT drive temperatures to new highs
        9) Given the location of temperature measurements, the Urban Heat Island effect most likely can explain the majority of any warming

        Bottom line, that graphic largely debunks CO2 as the cause of any warming

      • CO2isLife says:

        “Tmin warms faster than Tmax after 1970. There is other evidence that nights warm faster than days”

        Bindidon, the above quote is from the CliveBest Blog. No way in hell can CO2 cause nights to “Warm.” CO2 slows cooling, it can not “create” energy. I don’t think he is actually claiming that the nights are actually warming, I think he means the temperature is increasing over time, not that nights actually show warming.

        Here are some other comments:
        Tav warms faster than both Tmin and Tmax after 1980.
        —CO2 didn’t show a sharp increase post 1980, how could CO2 cause the Tav to change but neither Tmin or Tmax?

        Tmin warms faster than Tmax after 1970. There is other evidence that nights warm faster than days
        —Once again, how could CO2 cause these differentials? One period it does this, and the next period it does that. Do the laws of Physics cease to exist in Climate Science? Are the physics of the CO2 molecule variable?

        Oceanic temperatures were warmer than global temperatures before 1910 and then again between 1930 to 1972, but have since lagged behind land temperatures. This appears to be a cyclic phenomenon.
        —This is convincing evidence of the Urban Heat Island Effect, not CO2 caused warming. Once again, the physics of the CO2 molecule are constant. Oceans cool slower than grass, so the more grass there is, the more likely it is that the oceans will be warmer than the land temperatures. Replace grass with asphalt and place the temperature gauge near the asphalt and suddenly the land is warmer than the oceans. CO2 CAN’T BE THE CAUSE. CO2 is CONSTANT over both the land and sea. CO2 CAN’T cause that differential.

      • CO2isLife says:

        Imagine that, temperatures and humidity are closely related and explain the warming post-1980. No CO2 needed. If CO2 is the cause, it isn’t through the GHG effect, it is through increasing more vegetation which is increasing humidity in the air…and that ain’t a bad thang.

        http://clivebest.com/blog/wp-content/uploads/2018/06/Compare-rain-temp.png

      • Bindidon says:

        CO2isLife

        Why are you so horribly fixated on this da..ed CO2? Will you never be able to escape out of it? Sorry: that is really boring.

        When I speak about IR catch, I primarily mean water vapor.

        Jesus.

        *
        Moreover:

        “That wont melt glaciers, and my understanding is that the stratosphere is cooling, not warming.”

        I never pretended that I would know of CO2 being able to melt glaciers, let alone ice sheets.

        Unlike you, I prefer to leave that debate to specialists. Neither you let alone I myself could ever pretend to be.

        *
        The stratosphere is of course cooling! Look at Roy Spencer’s data:

        https://drive.google.com/file/d/1_ecu50TZYPYfr57XIWZ_rcu9p2trm2hy/view

        And why should it be warming??? Maybe due to this stupid idea of “CO2 trapping heat” ?

        Oh Noes. Read the Frenchies’ paper, my dear CO2TrapsHeat!

        • CO2isLife says:

          “Unlike you, I prefer to leave that debate to specialists. Neither you let alone I myself could ever pretend to be.”

          As I’ve demonstrated by my analysis of the actual data, the real way science is done, it is very very very dangerous to accept the opinion of “experts” in the field of climate science. As I demonstrated in the previous posts, their data simply doesn’t support their conclusion, and in fact, the data supports the exact opposite of their conclusions. That isn’t real science, that is politics.

          CO2 doesn’t “trap heat” it converts IR radiation to thermal radiation. It changes energy from 1 form to another. LWIR travels through the vacuum of space without doing anything. Only when the LWIR runs into a molecule and causes an excited vibrational state does that EM radiation convert to thermal radiation. Those excited states are measured with a spectrum from the molecule, and how we know what wavelengths the excite the molecule. For CO2 case, it is largely 13 to 18 micron LWIR.

    • CO2isLife says:

      Dr. Spencer, look at the chart Bindidon published. Those are the kinds of charts that best explain CO2’s contribution to warming. Warming can be due to a whole lot of things, so you have to isolate datasets that control for everything else but CO2. If the all daily highs aren’t increasing, CO2 isn’t causing warming, and heat isn’t being “trapped” in the atmosphere.

    • Gordon Robertson says:

      CO2…”Dr Spencer, the CAGW theory is based upon the belief that CO2 traps heat in the atmosphere”.

      The alarmists continually confuse heat with infrared. As you know, heat is a property of atoms in motion, it is the energy referred to as kinetic energy.

      The alarmists don’t even know that kinetic means ‘in motion’ they think kinetic describes the particular energy in motion, like some kind of generic energy. There is a name for the energy of atoms in motion described by the descriptor ‘kinetic’, the energy is thermal energy, or heat.

      In order to trap heat, you need to trap the atoms in motion. The glass in a greenhouse can do that but there is nothing in the atmosphere can do it.

      Norman hates Joe Postma with a passion but Joe made a brilliant observation about greenhouses. He claimed we build greenhouses to do what the atmosphere cannot do. That would be ‘trap’ heat. The glass in the greenhouse traps the moving atoms and traps heat.

      That should put an end to the GHE theory right there but paradigms have a way of hanging on.

      • CO2isLife says:

        Gordon, I love the comment about we build greenhouses to do what the atmosphere won’t do, that being trap heat. I love it.

        I always explain the GHG effect as energy being changed from 1 form to another. EM radiation to thermal or kinetic energy. The on part of the explanation I could use some help on is explaining what happens to the energy once the molecule is excited:

        1) The Molecule re-radiates the energy as 13 to 18-micron LWIR. (easy to explain)
        2) The molecule collides with another molecule that isn’t CO2 and excites it. (What happens then?) Energy gets transferred and the CO2 molecule can no longer re-emit the 13 to 18-micron LWIR.

        Any help explaining step #2 would be appreciated.

        • RealOldOne2 says:

          CO2isLife says on Feb. 11, 2019 at 11:55AM: “Any help explaining step #2 would be appreciated.”
          Your point 2) is correct. That is what happens in almost all cases with the incremental absorbed energy from surface LWIR. That’s because a collision with N2, O2 & Ar transfers the incremental absorbed energy to the surrounding bulk atmosphere long before the incremental absorbed energy can be re-emitted. This is explained by this physics professor emeritus: http://www.sealevel.info/Happer_UNC_2014-09-08/Another_question.html

          Hope that helps.

          That brings up another point that is misunderstood by promoters of CAGW-by-CO2 climate alarmism, ie., that the temperature of the bulk atmosphere is what reduces the unidirectional heat loss from the surface, per the heat transfer equation, q=sigma epsilon (Th^4-Tc^4). Tc, the temperature of the atmosphere, is much higher than the the temperature of space, so q is less than if the atmosphere weren’t present.

          So it is the internal energy of the the 99+% of the atmosphere that is N2, O2 & Ar, that produces the radiant emittance of the atmosphere, which causes the so-called ‘greenhouse effect’. There is simply not enough internal energy in the 0.04% of the atmosphere that is CO2.

          I’ve seen that Kristian has explained this over and over to the climate alarmist trolls here, and they just deny it. The climate alarmist trolls have failed to refute any of the science that Kristian has presented.

          Here is a website that explains this and the science of the atmosphere: http://www.calqlata.com/Maths/Formulas_Atmosphere.html

          Hope that helps too.
          Cheers.

          • CO2isLife says:

            Thanks a million. That filled in the one hole I was having difficulty defining. Once again, I can’t thank you enough.

          • CO2isLife says:

            RealOldOne2, those links are Goldmines for information. The more and more people know that information and more and more CAGW becomes a joke. I would pass those around to as many people as possible. Thanks again. Dr. Spencer, you would work some of that science into some of your points. It kind of makes my concern about CO2 not being able to warm water moot.

  60. I have been quiet because it is now a wait and see game and thus far I like what I see which is the global temperature trend that started down in year 2016 is alive and well.

  61. gallopingcamel says:

    @Bart,
    You mentioned David Appell. Where is our resident troll? Did he get banned?

    I hope he is not sick.

    • Svante says:

      I think he is OK, criticising Ocasio-Cortez new Green Deal on his blog two days ago, agreeing with Judith Curry no less.

      https://davidappell.blogspot.com/

      • Chic Bowdrie says:

        Are you pleased AOC has become the new face of AGW?

        • Svante says:

          Maybe not, I usually agree with David Appell.

          • Mike Flynn says:

            Why is that?

          • Svante says:

            He provides scientific references.

          • Mike Flynn says:

            S,

            You mean references to pseudoscientific climatological nonsense, don’t you?

            Wild fantasy. Only the truly gullible or brain dead would believe the sorts of rubbish he provides links to.

            Thousands of published papers are retracted every year. How would you know the difference between science and pseudoscience, or a worthless paper?

            There’s one born every minute – just like you.

            Cheers.

        • Gordon Robertson says:

          chic…”Are you pleased AOC has become the new face of AGW?”

          I am. They could not not have chosen a more stupid, myopic representative had they tried. Her equivalent here in Canada is being referred to as a Climate Barbie.

      • Gordon Robertson says:

        svante…”I think he is OK, criticising Ocasio-Cortez new Green Deal….”

        I predict…no wait a minute, I project….this new Green Deal will cost the Democrats big time once the US public gets what it will mean to their pocket books. O-C is a raving lunatic and one of her supporters claims the deal ranks with the defeat of the Nazis.

  62. ren says:

    The Arctic air will continue to flow into the US.
    https://pics.tinypic.pl/i/00979/8kb10wuo1r4k.jpg

  63. ren says:

    Thousands of Sydney homes were left without power on February 9th after severe storms hit Australia’s largest city, causing transport hold-ups, inundating vehicles with floodwater and delaying a national football match. AFP reported that heavy rains and lightning storms lashed parts of Sydney late on February 8th, with close to 60 millimetres (nearly two and a half inches) of rain falling in some areas.

    • Gordon Robertson says:

      ren…”Thousands of Sydney homes were left without power on February 9th after severe storms hit Australias largest city…”

      What’s that? Your telling me they have electricity in Australia now??

  64. ren says:

    Heavy snowfall in California.

  65. Mike Flynn says:

    Svante has a bizarre idea that energy can be magically created.

    I suggested that lowering the amount of energy reaching a thermometer would make it colder, not hotter. Placing more CO2 between the Sun and a thermometer results in less energy reaching the thermometer.

    This is a physical fact, even accepted by NASA.

    Svante wrote –

    “”You can certainly lessen the amount of energy reaching a thermometer” at the top of the atmosphere by adding more GHGs.

    Whatever is inside the atmosphere will then warm until equilibrium is restored.”

    Svante labours under the usual foolish Warmist delusion that there exists a magical “equilibrium”, which ensures that a thermometer which has been allowed to cool, will obtain heat (no doubt due to the magic of CO2), until it reaches its previous temperature!

    What a fool! No wonder he cannot define the GHE! It would require the creation of energy, and as far as I know, the law that energy can neither be created nor destroyed, still applies.

    Never mind the fact that the Earth is demonstrably no longer molten at the surface (no equilibrium to be found), Svante’s delusional justifications for the undefined GHE, energy created by CO2, and so on, are on a par with the symptoms of delusional psychosis demonstrated by Schmidt and Mann.

    The one believes he is a climate scientist, and the other claimed to have won a Nobel Prize!

    Maybe Svante believes he understands physics? He hasnt said so, which might explain his bizarre assertions. Who knows?

    Cheers.

    • Svante says:

      Let’s do one paragraph at a time.

      “Svante has a bizarre idea that energy can be magically created.”

      I disagree, why do you think that?

      • Mike Flynn says:

        Svante,

        Disagree away. What are you disagreeing about?

        Cheers.

        • Svante says:

          I never said energy could be magically created.

          • Mike Flynn says:

            Svante,

            Of course you did, you witless fool.

            You just don’t realise you did.

            Try defining your impossible GHE, if you don’t believe me.

            Disagree with whatever you like. Why would you possibly think that I would care?

            Read what I wrote, if you can – I wouldnt be surprised if others can get past the first sentence, unlike yourself. Opinions are worth precisely what somebody is prepared to pay for them. In your case, nothing at all.

            Cheers.

          • Svante says:

            Mike Flynn says:
            “Try defining your impossible GHE…”

            OK, but please do not add more issues before resolving the previous one.

            1) Stable temperature requires equal input and output power,right?

          • JDHuffman says:

            Svante, are you now denying the Arrhenius CO2 equation?

          • Svante says:

            Please do not add more questions before answering 1).

          • JDHuffman says:

            Well, the bogus equation adds energy to Earth’s system. So you can’t be dealing with real science if you are clinging to your pseudoscience.

          • Svante says:

            One step a time please.

            1) Stable temperature requires equal input and output power, do you agree?

          • JDHuffman says:

            “Power” is not conserved, Svante.

            Your head is filled with pseudoscience, so you can’t learn.

            Clear your head. Then learn some physics.

            One step at a time.

          • Mike Flynn says:

            Svante,

            You agreed to define the impossible GHE.

            Now you refuse to. Why is this?

            Instead, you fly off into Gotcha World, in some bizarre attempt to avoid defining the impossible. I don’t blame you.

            Keep on with the desperate attempts to deny, divert, and confuse.

            No GHE. No CO2 heating. No change to your levels of stupidity and ignorance.

            Carry on, as usual.

            Cheers.

          • Svante says:

            Which of these symptoms do you have:
            – Have difficulty maintaining focus on one task.
            – Often interrupt conversations or others’ activities.
            – Blurt out inappropriate comments, show their emotions without restraint, and act without regard for consequences.
            – Be easily distracted, miss details, forget things, and frequently switch from one activity to another.
            – Struggle to follow instructions.
            – Have difficulty focusing attention on organizing or completing a task.
            – Have trouble sitting still during dinner, school, and while doing homework.
            – Have difficulty waiting for things they want or waiting their turn in games.
            – Become bored with a task after only a few minutes, unless doing something they find enjoyable.
            – Be impatient.
            – Have trouble completing or turning in homework assignments, often losing things (e.g., pencils, toys, assignments) needed to complete tasks or activities.
            – Appear not to be listening when spoken to.
            – Daydream, become easily confused, and move slowly.
            – Have difficulty processing information as quickly and accurately as others.
            – Have trouble understanding details; overlooks details.
            – Fidget or squirm a great deal.
            – Talk nonstop.
            – Dash around, touching or playing with anything and everything in sight.
            – Be constantly in motion.
            – Have difficulty performing quiet tasks or activities.

          • JDHuffman says:

            Very good, Svante.

            Listing your issues is a healthy first step. It’s like they say, you can’t solve your problems unless you admit you have them.

          • Mike Flynn says:

            Svante,

            Are you giving a list of reasons for being unable to provide the definition of the GHE?

            You need to stick to pseudoscience. The sort of nonsense that allows Gavin Schmidt to be thought of as a climate scientist, or has Michael Mann thinking he won a Nobel Prize.

            Join the rest of the fools, and share their delusional fantasy.

            I wish you well. Good luck.

            Cheers.

  66. gallopingcamel says:

    @Svante,

    Thanks for that link to Quark Soup. It enabled me to find the Green New Deal document.

    It will take me a while to explore the glorious stupidity of Alexandria Ocasio-Cortez and her bubonic mind. She may become president of the USA or she may destroy the Democrat party for a generation. Third option…..Nancy Pelosi and the Media will destroy her.

    https://chiefio.wordpress.com/2019/02/08/the-soros-globalists-vs-nationalist-populist-split-hits-france-italy/#comment-107546

    https://chiefio.wordpress.com/2019/02/08/the-soros-globalists-vs-nationalist-populist-split-hits-france-italy/#comment-107550

    • Mike Flynn says:

      gc,

      As Hillary Clinton said recently “It often takes a woman to get the job done”

      Cheers.

    • Svante says:

      gallopingcamel says:

      “It will take me a while to explore the glorious stupidity of Alexandria Ocasio-Cortez and her bubonic mind.”

      Good to hear you will approach it without prejudice.

      • Mike Flynn says:

        Svante,

        I am encouraged to see you are supporting the rights of people to express their opinions.

        Keep it up.

        Cheers.

      • Bart says:

        Prejudice is, literally, prejudgement. Post-judgement is not the same thing.

        • Svante says:

          Yeah, prejudice since he said he hadn’t found it until now.

          • Mike Flynn says:

            Svante,

            Who gives a toss? Why should anybody care if you are prejudiced or not?

            Sounds like just more stupid politically correct attempts at emotional blackmail.

            How’s your GHE definition coming along? Does it include four and a half billion years of cooling?

            What about surface cooling at night? Maybe you think cooling is really heating?

            Keep at it.

            Cheers.

          • Svante says:

            Prejudice can cause detrimental decisions.

          • Dr Roys Emergency Moderation Team says:

            Svante, please stop trolling.

  67. Bindidon says:

    bilybob

    It woulde be better if we could manage to start new comments each time we correspond and we see that the thread has moved far away.

    You wrote upthread:

    As an example, back in December you provided some graphs for Norway.

    1. 1900-2018, absolute

    https://drive.google.com/file/d/1xX7y5w52v4oS83CESOC8Yls5NXbHYGOl/view

    2. 1900-2018, anomalies

    https://drive.google.com/file/d/1dbu5MrQqDkhFg1LHzN6Qnrof2Nxdurbi/view

    Tell me your impression of the temperature change from 1900 to present in Norway using absolute vs. anomalies and you will begin to understand. The absolute data shows maybe a 0.5C difference but using anomaly you would think Norway is 3C warmer.

    *
    Yes of course, I agree. But the goal of anomalies for me is not to show more or less warming.

    As Roy Spencer so often explained, their primary goal is to remove the annual cycle out of time series by subtracting, from all time units you consider (days, months, years etc), the corresponding unit mean calculated over an appropriate period.

    The result is that an anomaly based chart will show you where the time unit differences are the highest. That’s evident…

    Here is the top ten list of anomalies between Jan 1900 and Dec 2018:

    1990 2 4.86
    2006 12 4.54
    2014 2 4.39
    1972 12 3.90
    1989 1 3.67
    2018 5 3.66
    2016 12 3.56
    2011 11 3.54
    2012 3 3.44
    2015 12 3.35

    What you see again is that the departures from the mean are the highest in the winter month… nothing new for us. But that 7 of the 10 positions are from years above 2000: that is interesting a bit.

    And only the dumbest dumbies will pretend that it is a warmist trick to make the world hotter.

    If you now look at the sorted absolute values during the same period, the top ten looks like this:

    2014 7 16.91
    2018 7 16.65
    1941 7 15.98
    2002 8 15.66
    2003 7 15.64
    1997 8 15.41
    1937 7 15.33
    1937 8 15.19
    2006 8 14.92
    1969 8 14.92

    This was a big surprise. If you do that on the US station set, you don’t see even one year after 1999 in the top 50.

    • Bindidon says:

      … and I forgot to add a little detail: while the top 10 difference for anomalies is 1.5 C, that for absolute values is… 2C. Ha ha.

    • barry says:

      I’m curious to know what the trend values would be for the absolute and anomalised Norway data. If they were very different I’d have to start thinking about it!

      • Bindidon says:

        barry

        “If they were very different Id have to start thinking about it!”

        So please start!

        Anoms 1900-2018: 0.37 C / decade
        Absols 1900-2018: 0.22 C / decade

        In most cases anomalies have a higher trend than their absolute origin because extracting the annual cycles amplifies the difference between highest and lowest values.

        UAH’s LT time series is a rare exception to that. No idea why.

  68. Dan Murray says:

    There exists no temperature record of the last 125 years that shows any variations in range greater than those variations in range science tells us have occurred during the last 5000 years.

  69. bilybob says:

    Thanks for the reply Bindindon, you say

    “As Roy Spencer so often explained, their primary goal is to remove the annual cycle out of time series by subtracting, from all time units you consider (days, months, years etc), the corresponding unit mean calculated over an appropriate period.”

    Yes, Dr. Spencer provided a great article on the use of anomalies several years back. Very good read. Anomalies not only take out seasonal but also latitudinal (spatial) effects. Again, I understand the strengths of the use of the anomalies, but I also understand the weakness.

    You say “And only the dumbest dumbies will pretend that it is a warmist trick to make the world hotter.”

    Not sure who you are referring to here. My criticisms on anomaly’s is associated with trying to make a global average from such diverse areas of the globe in both spatially and seasonally terms. It fails to show the impacts at regional levels. At best, the 0.4C over a baseline can only tell me that the average of the data points used for that month is 0.4C higher than the average of the baseline. I can get to 0.4C an infinite amount of ways.

    Again referring back to Norway. Anyone looking at the absolute graph will see no significant temperature change in Norway when comparing 1900’s to 2000’s. Look at the anomaly graph and one may conclude something else. So care needs to be taken when using anomaly data.

    Does that mean we should switch to absolute data? No, care needs to be taken that the data is homogenous. That you are comparing apples to apples. Summer to Summer, elevation/latitude with elevation latitude. An average absolute global average is just as useless.

    However, I do offer this to improve the use of anomaly data. Use the standard deviation of the data rather than the absolute value in the analysis. Thus instead of showing the global temperature anomaly in terms of x.y Celsius, show it in terms of average of the temperature in terms of standard deviations of each grid. Just a thought.

    Please be assured, I am not trying to get you to stop using anomaly data. I am only explaining why I have no use for it. I compare similar areas, seasons, tmin and tmax. And so far, tmin is up but tmax is either the same or down (unless you use stations that have only be recording data since the 1960’s).

    Quigley Down Under Quote referring to handguns.

    “I said I didn’t have much use for one. Didn’t say I didn’t know how to use it.”

    I feel the same with anomaly data.

    Enjoy, have a deadline today, so will be replying sporadically.

    • Bindidon says:

      biliybob

      I’m busy too, and will reply to

      “Anomalies not only take out seasonal but also latitudinal (spatial) effects.”

      I don’t agree. This is a thoroughly different corner.

      cu, J.-P.

      • bilybob says:

        Bindindon says “Anomalies not only take out seasonal but also latitudinal (spatial) effects.”
        I don’t agree. This is a thoroughly different corner.

        I would be very interested in your thoughts on this. I was of the understanding that is how they did the global anomaly. How do you compare Berlin to Brasilia without using anomaly data for each? I am not saying your are wrong, I never put much thought into it, but accepted that is what was being done.

        Thanks

        • Bindidon says:

          bilybob

          Sorry, I was somewhat irritated by ‘latitudinal’, and skipped the far more relevant word ‘spatial’.

          Of course we agree here.

          After all I calculate anomalies wrt the mean of a period separately for all stations having necessary data in the period, and then build averages into grid cells, then into latitude bands which finally are averaged into a global value after having been applied latitude weighting.

          For these lacking that data, most people – me included – use as backdoor the anomaly calculated for the grid cell surrounding these stations. I’ll try in the future an alternative consisting of calculating several baselines where applicable and shifting up and down where necessary; the induced error mostly is about 0.05 C / decade. We are lay(wo)men here, and shouldn’t care too much about such deviations.

          Though it wasn’t a goal anyway, I have often played with such comparisons, e.g. Sydney vs. Berlin, or a place in Siberia and the tropospheric grid cell above it. Simply nice…

          Many might ask: what the hell is the sense of computing global temperatures and anomalies? I can only answer: if even Roy Spencer calculates them for all his atmospheric layers, it can’t be that wrong.

          And it is amazing to see that the global average absolute temperature for UAH6.0 is about 265 K, what gives a good fit to the 289 K computed by Berkeley Earth at surface.

          • bilybob says:

            Thanks for that Bindindon, I thought maybe I completely misunderstood how anomalies were calculated and used. But that helps and that is how I thought it was being done.

            You also say “I can only answer: if even Roy Spencer calculates them for all his atmospheric layers, it can’t be that wrong.”

            I can’t speak for Dr. Spencer on his reasons other than referring back to the blog entry on anomaly data he did several years ago.I find it useful as a gut check on the methodology using instrument data to determine a global average. Maybe he does the same. But again, what is the value of a global anomaly in terms of Celsius? I would prefer to know if the change is statistically significant.

            I did some work in my youth analyzing remotely sensed multispectral data in determining land use. The benefits are you can get a lot of area covered, the negatives are after ground truthing it may take a while to get an accurate enough model. Thus the many versions of UAH. Still, even with correction, there will be errors, can’t avoid them.

            I actually prefer instrument data, more detail. I seriously doubt UAH can show me hourly temperature for a specific location. By the way, did not know if you saw my comment on the hourly data. Apparently the USA started a program in 2000. There are a bit over 100 sites now, will be interesting to analyze the data if I get the time.

            Guess it is late there, so good night for now.

          • Bindidon says:

            bilybob

            “But again, what is the value of a global anomaly in terms of Celsius?”

            Not much! But vereybody calculates it, and everybody publishes it: it’s like a collective compulsion.

            I’m mostly more interested in regional aspects. With some exceptions like e.g. UAH’s global grid data:

            https://drive.google.com/file/d/1YjFLnql_uzZrXY_Hff5TYY9bTBxO38lO/view

            When you look at such a graph comparing UAH’s full grid data with 5 resp. 10 % out of it, you think: how is that possible?

            And the two subsets above all are disjunct…

            That reminds me somebody who wrote years ago at WUWT: “The world is oversampled”.

            Buona notte
            J.-P.

  70. ren says:

    Strong snowfall in the French and Swiss Alps, at night in the Northern Alps.
    https://pics.tinypic.pl/i/00979/xe7mqr0vmuo4.png

  71. ren says:

    Forecast of stratospheric intrusion over northern California.
    https://files.tinypic.pl/i/00979/1ozlb4uxhe51.png

    • Eben says:

      Dood , this place is not an hour by hour weather report blog

      connect some dormant braincells before next post

      • JDHuffman says:

        Eben, ren has an amazing way of alarming the Alarmists with his reports of colder than average weather reports.

        So, enjoy.

      • Bindidon says:

        Eben

        To be honest, ren’s weather reports are by far more interesting than the polemic mostly below the belt coming out of your ‘brain’ cells.

      • Mike Flynn says:

        Eben,

        And if he doesn’t accede to your demand, what then?

        Dood, connect some dormant brain cells before next post.

        Do you have some secret super power that forces people to bend to your will? If not, what ignorant and stupid sense of self importance leads you to think that anybody cares for your opinion?

        You could threaten to hold your breath until you turn blue, I suppose. I don’t care. Go ahead, I’ll just laugh.

        Give it a try.

        Cheers.

      • Gordon Robertson says:

        eben…”Dood , this place is not an hour by hour weather report blog

        connect some dormant braincells before next post”

        The owner of the blog has a degree in meteorology and I don’t see him complaining. Neither am I.

        • Eben says:

          This is why rational people don’t take you seriously , you look like a bunch of lunaticks. arguing if moon rotates and god knows what else

          • Mike Flynn says:

            Eben,

            Why would you believe that rational people would accept your opinion about what rational people take or don’t take?

            Who cares what you think? Certainly not me – why should I?

            Are you rational? Can you prove it?

            Cheers.

          • Gordon Robertson says:

            eben…”you look like a bunch of lunaticks. arguing if moon rotates and god knows what else”

            You missed the point, it’s between climate alarmists and skeptics. Once again, the skeptics prevailed due to their scientific common sense.

            We had Nicola Tesla on our side.

          • Svante says:

            You mean true skeptics like barry?

          • SkepticGoneWild says:

            Gordon says:

            “You missed the point, its between climate alarmists and skeptics. Once again, the skeptics prevailed due to their scientific common sense.”

            The moon rotation issue is not between alarmists and skeptics. It’s between those who have a clue and the clueless. I am a GHE skeptic. Joseph Postma is a GHE skeptic who clearly stated the moon does rotate on its own axis, and he’s a published astro-physicist. Postma threw you clowns under the bus.

            Tesla may have been smart in some areas, but he was a total moron regarding the moon rotation business.

            You still have not even figured out the simple concept of curvilinear translation. How can anyone expect you to understand more complex movements.

          • Dr Roys Emergency Moderation Team says:

            Svante, SGW, please stop trolling.

    • Svante says:

      That means a great person in your inverted frame.
      He says:
      “Stop Giving Power To People Who Don’t Believe In Science.”
      “They know who they are. We know who they are!”

      • Mike Flynn says:

        Svante,

        You foolish Warmist.

        Who cares whether people believe in “science” or not? Nature doesn’t give a toss!

        You can believe anything you like. You can believe in an invisible and non-existent GHE. You can believe Michael Mann won a Noble Prize.

        The facts don’t change. The Earth has cooled for four and a half billion years, the temperature falls at night, and Winter is colder than Summer. CO2 heats nothing.

        I don’t care what stupid pseudoscientists think, and I certainly don’t see why they should be given any power at all. Some people believe in democracy. You appear not to support democracy, and that is your right. I wish you well.

        Cheers.

      • Stephen P Anderson says:

        Or course people believe in science. They don’t believe in junk science. Do all the scientists who disagree from the global warming consensus believe in science? Stop being a dolt.

        • Gordon Robertson says:

          stephen…”Or course people believe in science. They dont believe in junk science”.

          Global warming consensus is not science nor is it based on science. It’s based on belief and consensus. Real science tells us AGW cannot work as described.

    • Gordon Robertson says:

      JD…”Ford was a good actor. Now, hes just another climate clown.”

      Another one bites the dust. Goes to show that acting is not related to intelligence.

  72. Mike Flynn says:

    Nate wrote –

    “Mike,

    I gave you a sinple fact about about co2 properties, and you have yet to process it, acknowledge it, or reject it.

    Deal with that, then well see if you can process more.”

    Nate is stupid enough to believe that stating simple facts about the properties of CO2, magically creates the non-existent GHE.

    Bananas absorb and emit IR, and are more opaque to the same frequencies that Nate foolishly assumes gives CO2 magical heating properties. Maybe bananas have magical heating properties too?

    Nate is an eminently stupid and ignorant member of the pseudoscientific climatological cult. Good for him. If he could actually find a copy of the inconveniently missing GHE description, he would be held in awe by all the foolish Warmists, who currently have to believe in faith, debate, and consensus to make their fantasies real.

    Nate and his ilk carry on regardless. A perfect example of mindless fanatics avoiding reality at all costs.

    Oh well.

    Cheers.

    • Nate says:

      As I suspected. Mike cant process nor retain a single relevant scientific fact. Going further would be as fruitfull as teaching heat transfer to a Ger*an.

      MF, if are truly interested in moving beyond ignorance and trolling as a career, take a physics course, then Google greenhouse effect. Then come back and ask relevant questions.

    • Mike Flynn says:

      Nate,

      In what fantasy do you believe I should dance to your mad and discordant tune?

      Don’t be even more stupid. Why would you imagine I would ask a fanatic for an explanation of the undefinable GHE?

      If you could provide a scientific description of the GHE, you probably would. But you can’t, of course. Producing something that doesn’t exist is not easy.

      I invite other readers to find a useful description of the GHE. Hopefully, it will describe how and where the effect may be observed. It will accord with observed facts, such as the Earth having cooled for four and a half billion years, and temperatures dropping in the absence of sunlight. And so on, and so on.

      Nate, you are still a fool. A delusional fanatic, worshipping a GHE which you can’t even describe!

      Carry on demanding. I’ll keep saying “no”, and laughing.

      Cheers.

      • Svante says:

        Mike Flynn says:

        “I invite other readers to find a useful description of the GHE”.

        Here you are:
        https://tinyurl.com/y6sfq7ye

        • Mike Flynn says:

          Svante,

          Nonsense.

          What is this pointless piece of nonsense? Another foolish attempt to rewrite the laws of physics?

          You are as stupid and ignorant as Nate. I guess you have tried to find a GHE description which looks even partly scientific, and have failed. If you claim you have such an impossible thing, why keep it hidden?

          Go off and worship some more pseudoscience, foolish Warmist.

          Still no GHE. No magical CO2 heating. The Earth has cooled for four and a half billion years – no equilibrium to be seen.

          Time for you to provide another pointless and irrelevant link? How about a pointless and irrelevant analogy?

          Cheers.

        • Norman says:

          Svante

          That was a good discussion. Good science. He is able to explain the GHE in such a way that most should be able to grasp the concept.

          • Mike Flynn says:

            Norman,

            Pity it is physically nonsensical then, isn’t it?

            The nutty Professor doesn’t seem to realise the Earth has cooled. This makes all his blather worthless, no matter how sciencey it seems.

            Just more delusional infatuation with something that does not exist.

            No GHE. No CO2 heating. Keep worshipping. Cargo Cult Science ain’t real science!

            Cheers.

          • Norman says:

            Mike Flynn

            You may not have a bit of memory but we have already discussed you point about the Earth cooling. I believe it has been several times.

            Let us specify the Earth Surface. That has not warmed or cooled by but a few degrees in billions of years. Its temperature is maintained by solar flux. I am not sure what your point would be about the whole Earth. Not sure what it matters, at this time, if the Core were a few degrees warmer a billion years ago.

            You certainly seem to want to totally ignore the GHE. It does not state that CO2 is heating the surface as if by magic. That is your burning straw-man argument.

            The claim is that the heated surface will reach a higher temperature with an atmosphere of GHG than it would if these gases were not in the atmosphere.

            If you missed it, E. Swanson did a valid experiment to demonstrate the basic effect. A heated blue plate transmits IR to a nonheated green plate. This energy warms the green plate, the green plate returns some of this energy back to the blue plate increasing its temperature. Pretty straight forward.

            Now use you own Feynman quote: “If it disagrees with experiment, its wrong. In that simple statement is the key to science. It doesnt make any difference how beautiful your guess is, it doesnt matter how smart you are who made the guess, or what his name is If it disagrees with experiment, its wrong. Thats all there is to it.

            You guess that there is no GHE maintaining a higher equilibrium temperature for the Earth’s surface.

            Well here is the experiment which disagrees with you guess.
            https://app.box.com/s/5wxidf87li5bo588q2xhcfxhtfy52oba

            Use your own philosophy. You have your guess, “No GHE” the experiment disagrees with you guess. Your guess is wrong. Time to adapt and change.

          • Mike Flynn says:

            Norman,

            Don’t blame me for your lack of mental acuity.

            You still cannot provide a description of the GHE, can you?

            As to the Earths surface, it is fairly simple, so you should be able to understand. The surface is no longer molten – it has cooled. No GHE heating, no CO2 warming – it has cooled.

            Swanson’s experiment is nonsense. “These demonstrations refute claims that Infrared “BackRadiation” violates the Second Law of Thermodynamics because energy flowing from a hot body can result in warming of that body when there is another body situated between the hot body and the colder surroundings.” Try and figure out what that means – particularly the claim that “energy flowing from a hot body can result in warming of that body”. What rubbish!

            I suppose his excuse is that he cannot express himself in English very well. He is right in that respect, that is for sure!

            You go on with more misdirection –

            “The claim is that the heated surface will reach a higher temperature with an atmosphere of GHG than it would if these gases were not in the atmosphere.”

            Once again, this is nonsense. The surface of the Moon reaches far higher temperatures, simply because it has no atmosphere. On Earth, the highest temperatures are obtained on surfaces which have the least amount of mythical GHGs – the arid tropical deserts. These places lack the most important GHG (H2O) by definition. They are arid.

            If you could describe the GHE (you cannot), then you could propose a testable GHE hypothesis (chortle, chortle), at which point Feynman’s quote would apply.

            No guess. No GHE. No unicorns. No Nobel Prize for Michael Mann, and Gavin Schmidt is an undistinguished mathematician. Physical facts are not decided by consensus, or debate.

            Nature doesn’t give a toss about foolish Warmist opinions, and nor do I. Bad luck, boo hoo.

            Pray harder, Norman.

            Cheers.

          • Svante says:

            Note that the GHE works on geothermal cooling too.

            Surface heat loss must match loss to space.
            Surface temperature must vary to achieve this.

          • Mike Flynn says:

            S,

            You wrote –

            “Surface heat loss must match loss to space.” Well, duh! Considering the surface is hotter than space, where do you expect the heat to go? That’s where it has gone for four and a half billion years, why change now?

            You have never managed to actually describe the GHE, so your statement about what it can work on is completely meaningless.

            You should be aware that temperatures actually drop at night. Cooling is not heating. That’s a stupid pseudoscientific fable. Some people are gullible enough to believe almost anything. Does that sound like you?

            Gullible foolish Warmist!

            Cheers.

          • JDHuffman says:

            Poor Norman continues to be confused: “The claim is that the heated surface will reach a higher temperature with an atmosphere of GHG than it would if these gases were not in the atmosphere.”

            Norman’s “claim” is the new, revised AGW/GHE pseudoscience. It is designed to get around the 2LoT. But, as usual, Norman avoids the relevant physics.

            The atmosphere will limit both how hot and how cold the surface gets. It does this by regulating heat transfer to space. The heat energy being supplied by the Sun. The atmosphere can NOT raise the surface temperature.

          • Norman says:

            JDHuffman

            Why do you find it necessary to jump in my posts with your awful Joseph Postma made up physics. You don’t have a clue about real physics. I already know your phony made up version of unsupported declarations. I really have nothing to say to you. You are devoid of logic, reason or any scientific knowledge. You are full of taunts and empty posts. I don’t want to waste my time with you. I like rational intelligent debate. This is not possible with you.

            Yes the atmosphere certainly does cause a higher surface temperature. Just like the green plate causes the heated blue plate to reach a higher temperature. All good physics all sound logic. All wasted on you.

            Experiments prove you wrong. You are deluded and will continue in this state. Learn some real physics. At this time you only know the Postma made up version.

          • Norman says:

            Mike Flynn

            Why don’t you ignore E. Swanson’s explanation of his experiment (since you are not able to follow it) and just look at the results.

            The heated blue plate reaches a steady state temperature with its surrounding (the yellow line temperature). Move the green plate up and it absorbs energy from the blue plate and heats up. Now the blue plate reaches a higher steady state temperature.

            Also you are dense with the molten surface. It cooled very rapidly and then it quit cooling and reached a steady state temperature with the Sun. You have been informed, the lava in Hawaii is very hot. It cools very fast and in a few days in at ambient temperature but it does not keep cooling. It reaches a steady state temperature with the solar input.

            Now again with your very stupid Moon point. You choose only the hottest measurement for the Moon. Well I will choose just the coldest. What is the point of that? You need to average the high and the low to find the surface temperature. If the Earth had just an atmosphere of CO2 (same density as now) with no cooling ocean’s its surface would be much hotter than now.

            The experiment proves you wrong. Accept Feynman and adapt.

          • JDHuffman says:

            Poor Norman can only respond in his usual immature and uneducated ways. He can’t refute the actual physics, so he resorts to insults, false accusations, and misrepresentations.

            Nothing new.

          • Dr Roys Emergency Moderation Team says:

            The “green plate”, being a real object and thus possessing thermal resistance (unlike the unreal, perfectly conducting, ultra-thin, blackbody green plate in the thought experiment), insulates the “blue plate”. People wishing to interpret this unsurprising result as “back-radiation heating” mistakenly do so, and their confirmation bias is appeased.

          • Svante says:

            Mike Flynn says: “No CO2 heating”.

            That’s right Mike, no CO2 heating, only reduced cooling.
            Heat flows from hot to cold but the rate depends on the temperature difference.
            If heat input exceeds output you get warming.

          • JDHuffman says:

            Svante, you must be in the same typing class as Norman. You get one fact correct, but then come to the wrong conclusion.

            The Earth has a nearly constant heat source, the Sun. But, Earth’s heat energy output is based on temperature. The higher the temperature, the greater the output. CO2 is NOT an insulator. It is a radiative heat transfer medium.

            Maybe when you complete your course in typing, you both can take aa class in physics.

          • Norman says:

            Dr Roys Emergency Moderation Team says:

            YOU: “The “green plate”, being a real object and thus possessing thermal resistance (unlike the unreal, perfectly conducting, ultra-thin, blackbody green plate in the thought experiment), insulates the “blue plate”.”

            What do you exactly mean by “insulates” the blue plate? How is this insulating property working? What is the green plate doing to the blue plate (they are both in a strong vacuum)? How is it slowing the rate of energy loss by the blue plate?

          • Norman says:

            JDHuffman

            If you whine about my posts why do you need to jump in when not invited?

            Your empty and irrational pseudoscientific opinions really do not interest me at all. I really just like to ignore your comments completely. You have nothing of value to contribute.

          • Dr Roys Emergency Moderation Team says:

            Here you go Norman:

            https://en.m.wikipedia.org/wiki/Thermal_insulation

          • JDHuffman says:

            Norman, YOU are the one whining. I just report reality.

            You keep getting things wrong, and it’s my duty to correct you.

            And, I especially enjoy when you claim you like to ignore my comments! You can’t even do what you claim.

            It’s like you were born to be wrong.

          • Gordon Robertson says:

            svante…”Surface heat loss must match loss to space.
            Surface temperature must vary to achieve this”.

            You do understand, I hope, that radiation is not the only means of dissipating heat at the surface. In fact, at terrestrial temperatures, it’s a highly inefficient way of dissipating heat.

            Lindzen pointed out that heat is transferred high into the atmosphere by convection then radiated to space. CO2 radiation expert, R. W. Wood, claimed CO2 radiation is not the means by which heat is dissipated but due to conduction to the atmopshere, which is 99% N2/O2.

            And who said surface heat loss had to match heat loss to space? Denser, heated air at the surface will cool naturally through expansion at higher altitudes as it’s density lowers.

            If the Sun heated the surface 24/7, that would likely be the case but half the planet has a chance to cool at night. That cooling can be due to simple expansion of the air and not require radiation.

          • Norman says:

            Dr Roys Emergency Moderation Team says:

            Maybe it would help if you read your own links.

            From your link: “or thermal radiation is reflected rather than absorbed by the lower-temperature body.”

            In order to have a radiative insulator it must be made of a highly reflective material. The green plate is not such a material. It is absorbing the energy from the blue plate and heating up. When it heats up that is when the blue plate temperature begins to rise to a higher temperature.

          • Dr Roys Emergency Moderation Team says:

            Thank you for your assistance in making my point for me, Norman. The “green plate” cannot radiatively insulate the “blue plate”, at least not by very much, assuming the “green plate” has low reflectivity.

            But, the only way the “blue plate” can warm the “green plate” is if it is either insulating the blue, or is acting as a heat source to the blue. Since we all agree the “green plate” isn’t a heat source, and you have now agreed that it cannot radiatively insulate the blue, then that only leaves one other property of the “green plate” which can be causing the warming of the blue.

            This is where you google “thermal resistance”.

          • Nate says:

            “thermal resistance (unlike the unreal, perfectly conducting, ultra-thin, blackbody green plate in the thought experiment).”

            Correct, in the thought experiment, there is no need for thermal resistance.

            And yet its solution is similar to the real world results.

            In both the Green plate warms, and the Blue plate warms. This is why there is no need to invoke thermal resistance as the cause of the effect in the experiment.

          • Norman says:

            Dr Roys Emergency Moderation Team says:

            There is another possible answer for why the green plate will cause the heated blue plate to reach a higher temperature. The green plate is not a “heat” source but it is an energy source, it is an IR emitter that is emitting IR to the blue plate, which the blue plate absorbs and is added to the internal energy. This is what all established physics states what happens.

            You do not like this explanation but it is most valid and can easily explain the results of the experiment. Your “thin ice” explanation can easily be shown to be incorrect. If you cool the green plate to the temperature of the surroundings the blue plate temperature will not change. This disqualifies your attempt at a counter explanation to the accepted physics.

            This is what actual science says: “It is important to note that when it is stated that energy will not spontaneously flow from a cold object to a hot object, that statement is referring to net transfer of energy. Energy can transfer from the cold object to the hot object either by transfer of energetic particles or electromagnetic radiation, but the net transfer will be from the hot object to the cold object in any spontaneous process. Work is required to transfer net energy to the hot object.”

            From:
            http://hyperphysics.phy-astr.gsu.edu/hbase/thermo/seclaw.html#c1

            You can find this same concept in any textbook on heat transfer, all the same.

            So just consider that the scientists are not wrong (if that is possible for you to do) and that you are mistaken. Let us say that currently engineers use the accepted science (quoted above) to design heat transfer items (especially in space where radiant energy is the dominant form of heat transfer).

            What would happen if you accepted actual science. The actual science states that the heated blue plate emits IR from its surfaces. It emits IR toward the green plate. The green plate absorbs the IR and warms up. As the green plate warms it emits more IR than the surroundings (that established the first blue plate steady state temperature). This IR reaches the blue plate and is absorbed by that surface adding to the total incoming energy of the blue plate. It is receiving input energy from the lamp and IR from the green plate. It is receiving more total energy than when only the surroundings were present so its temperature goes up until it now emits as much as it is receiving. This is what the physics state. You can make up your own versions, it won’t make them correct or convince anyone that you are right.

          • Mike Flynn says:

            Norman,

            You wrote –

            The green plate is not a heat source but it is an energy source, it is an IR emitter that is emitting IR to the blue plate, which the blue plate absorbs and is added to the internal energy.

            Only if it has a higher temperature, of course.

            If its temperature is lower, the hotter object will absorb precisely no energy from the colder plate. An example is expecting water to warm by absorbing energy from ice emitting 300 W/m2. Nope, no amount of ice can be used to make water warmer, no matter how you try to concentrate or focus the IR from the ice!

            It doesn’t matter how many multicoloured diagrams you have, how many arrows you have facing in interesting directions, or even the qualifications of the graphic designer – it is still nonsense.

            As to Swanson’s experiment, it doesn’t demonstrate what he thinks it does. If you read it, you will notice he cannot even clearly state what it is that he is demonstrating, that is not explicable without resorting to nonsensical terms like “back radiation”.

            Just more pseudoscientific climatological foolishness. Still no GHE.

            Cheers

          • Dr Roys Emergency Moderation Team says:

            Sorry Norman, if the “green plate” doesn’t act as either a heat source or an insulator to the “blue plate”, it isn’t warming it. Since it does warm it slightly, and since it isn’t a heat source and it’s not radiatively insulating it to any great extent (low reflectivity), then thermal resistance is your answer.

          • JDHuffman says:

            Norman, you still don’t get it.

            If the plates are identical, and in full contact, they will achieve the same equilibrium temperature. If they are then pulled slightly apart, they will maintain the same temperature, with no losses. If they are pulled further apart, the green plate will drop in temperature. At no time, will the green plate cause the blue plate to warm above it’s initial equilibrium temperature.

            You just have a learning disability when it comes to technical issues.

            But, at least you can type.

          • JDHuffman says:

            Again, here is how it works, for very slight separations:

            https://postimg.cc/image/jcotys8e3/

          • Norman says:

            JDHuffman

            I tire of your endless unsupported opinions (not that you will ever stop giving them).

            Do an actual experiment and prove to the physics world they are wrong and you are correct. Take two plates in a vacuum with an energy source on one side that are touching. Now move them apart a bit. You will see that the non heated plate will begin to cool. That is what will happen in the real world. You can conjure up any idea you want, as long as you do no experiment you behavior is that of a child that wants to interrupt adult conversations with their childish opinions.

            Man up and experiment, I have zero interest in your endless unsupported pseudoscience opinions.

          • Norman says:

            Dr Roys Emergency Moderation Team says:

          • Norman says:

            Dr Roys Emergency Moderation Team says:

            YOU: “Sorry Norman, if the green plate doesnt act as either a heat source or an insulator to the blue plate, it isnt warming it. Since it does warm it slightly, and since it isnt a heat source and its not radiatively insulating it to any great extent (low reflectivity), then thermal resistance is your answer.”

            No it is not a “heat” source but it is an energy source. The combination of energy from the green plate and the light reaching the blue plate cause it to reach a higher temperature necessary for it to emit the same energy as it is receiving. Simple basic physics.

            Explain how you could test your thermal resistance as the cause for what the green plate is doing. Give some calculations. I can give you valid heat transfer equations that will work out to what is observed. The green plate emits IR to the blue plate based upon its temperature, the blue plate receives outside energy input. I can add this energy together to find the final steady state temperature of the blue plate. What equations do you use to describe you thermal resistance? Set up some calculations using thermal resistance equations that will show that the blue plate will reach a higher temperature.

          • Norman says:

            Mike Flynn

            You are totally failing the Feynman test that you advocate. You keep putting out your unsupported notions and ideas but you have yet to perform even one experiment to prove any of them.

            I already said I don’t care if you don’t understand E. Swanson’s explanation (I understand it and it is very valid physics). The test demonstrates the blue plate gets hotter when a non-heated green plate is moved up next to it. Those are the facts you are not addressing or ignoring.

            The green plate is colder than the blue plate. It has no energy source other than what the blue plate is sending it. Yet when moved into position the blue plate temperature goes up.

            YOU: “If its temperature is lower, the hotter object will absorb precisely no energy from the colder plate. An example is expecting water to warm by absorbing energy from ice emitting 300 W/m2. Nope, no amount of ice can be used to make water warmer, no matter how you try to concentrate or focus the IR from the ice!?

            Your first sentence is an unsupported conjecture with no basis in real physics. Then you go on with a poor analogy to try to justify your statement.

            If your water is heated than the ice will cause the water to reach a higher temperature for the same heat input energy than if the heated water was surrounded by dry ice.

            E. Swanson’s experiment clearly shows this to be true. You just will not accept you are wrong but continue to justify your error.

            Before the green plate is moved up the blue plate reaches a steady state temperature with the colder surroundings (temperature is the yellow trend line). When the green plate is moved up, still colder than the blue plate, the blue plate temperature goes up. Totally showing your points are not valid. Again go back to the Feynman quote. You have your ideas, experiment proves them all wrong!!

          • Dr Roys Emergency Moderation Team says:

            “No it is not a “heat” source but it is an energy source.”

            Incorrect, Thickman. You have a “green plate” being introduced which warms Emotional Swansong’s “blue plate” by a few degrees. You have only two possible options. “Energy” doesn’t cut it I’m afraid.

            1) the “green plate” supplies heat to the “blue plate”.
            2) the “green plate” insulates the “blue plate”.

            So, what do you choose, 1) or 2)?

          • Nate says:

            DREMT, JD, Mike,

            The GPE problem is a textbook homework problem. It has been solved with standard heat transfer physics by many students over the years.

            Its solution has been shown to you by several of us. And the solution of the ideal case is similar to the experimental results. Its always good to check theory with experiments.

            But you guys have NEITHER theory nor experiment, just declarations, hand waving, and guesses.

            I challenge any of you to show how the GPE can be SOLVED. Not guessed, actually solved.

            What equations are used? Where did they come from? And how do you use them to arrive at your solution?

            JD, DREMT, Mike… Gordon?

            If none of you can do that, then you are not really doing science are you?

            And why then should anyone believe your ‘solution’ is correct?

          • JDHuffman says:

            Norman must have figured out he was wrong, again. Now he’s admitting what I discribed: “Take two plates in a vacuum with an energy source on one side that are touching. Now move them apart a bit. You will see that the non heated plate will begin to cool.”

            He was actually able to understand my comment!

            (But poor Nate is still lost in his pseudoscience.)

          • JDHuffman says:

            No Norman, the green plate is not an energy source, either. A “source” adds new energy to a system.

            Your deficit in thermodynamics is revealed again.

            And working equations mean nothing if the equation is improperly applied. For example, suppose I claimed you owed me a billion dollars. The equation is “amount owed” = A^3, where A = $1000.

            How soon can you pay up?

          • Norman says:

            JDHuffman

            You are wrong: “If they are pulled further apart, the green plate will drop in temperature. At no time, will the green plate cause the blue plate to warm above it’s initial equilibrium temperature.”

            Yes the blue plate will start to increase in temperature when you move the green plate away and it no longer touches the blue plate.

            Again do an actual experiment. Set it up like E. Swanson’s test except start with the two plates touching. Now move the green plate away and the green plate temperature drops and the blue plate temperature goes up. The blue plate was able to lose energy on the green plate side by conduction. That mechanism has been broken and now only radiant energy will remove energy from the blue plate. However the green plate is sending energy back to the blue plate and it loses less energy than it did by conduction so its temperature rises. Do the experiment. Your declarations mean nothing!!

          • Chic Bowdrie says:

            Nate,

            I love problems. Can you transcribe the GPE problem for me?

          • JDHuffman says:

            Norman, you don’t have the background or logical ability to understand experiments. You gravitate to “experiments” that align with your beliefs. Here, your “experiment” is invalid because you don’t have the energy flows. You just imagine them.

            Beliefs, opinions, and imaginations are NOT science, but you can’t even understand that.

          • Chic Bowdrie says:

            Norman,

            I agree that Mike is using a bad analogy, but you stop using statements that imply a cold object adds energy to a warm one. Give it up. You are trying to win a semantic argument.

            It is a fact that the blue plate warms up and I hope everyone can agree that it warms because it cannot cool as fast when the green plate moves in. All energy comes from the heat source through the blue plate to the green plate. As long as it is colder, none of its heat content goes to the warmer blue plate. All of its additional heat content came from the blue plate. The green plate adds zero extra energy to the system anywhere.

            If you are trying to use the blue/green plate analogy to illustrate the effect of IR absorbing gases on surface temperature, it’s a major fail. Can you explain why?

          • Svante says:

            Chic Bowdrie says:

            If you are trying to use the blue/green plate analogy to illustrate the effect of IR absorbing gases on surface temperature, its a major fail. Can you explain why?

            The surface budget fallacy?

          • Norman says:

            Chic Bowdrie

            I wrote a response to your post but it did not post. I will try to break it up to see what parts caused the fail.

            Chic Bowdrie, I am still working on the link you posted above that connects your ideas on another blog. I am trying to understand you perspective on heat transfer.

            As far as my statement you object to: “I agree that Mike is using a bad analogy, but you stop using statements that imply a cold object adds energy to a warm one. Give it up. You are trying to win a semantic argument.:

            It is not a semantic argument, it is what established physics has determined takes place by several decades of experimental evidence.

          • Norman says:

            Chic Bowdrie

            Here:
            http://tinyurl.com/yyxevvg4

            scroll down to equation 4 and read the words under it.
            This is what they say: “This expression provides the difference between thermal energy that is released due to radiation emission and that which is gained due to radiation a.b.s.o.r.p.t.i.o.n.”

          • Norman says:

            Chic Bowdrie

            Do you see the word choice gained? that means the colder surroundings are actually adding energy to the surface being examined. They don’t add heat which is defined as the NET energy transfer but they add energy. The difference between this determines how much heat the surface is losing.

            I am not offering my opinions on the matter, I am using valid established physics that works very well and has not been found to be flawed.

            I do think E. Swanson test is a valid analogy showing how the GHE does work. Solar visible energy is transparent to the atmosphere and moves through it to reach the surface where it is absorbed. The surface does not reach a temperature capable of emitting visible light but emits in IR bands. The GHG present will absorb all but a fraction of the IR emitted by the surface. Some of this energy is then directed back to the surface which adds energy (not heat) to the surface. Along with solar input the temperature of the surface will reach a higher steady state. Like the blue plate in E. Swanson experiment. The blue plate emits IR that warms the green plate, it starts emitting more IR than the surroundings (being at a higher temperature) toward the blue plate. The added energy drives the blue plate to a higher steady state temperature.

            If you don’t agree please support your debate with valid established physics or provide a valid experiment showing that the current understanding is not correct. Otherwise I see no reason to think it is not quite valid.

          • JDHuffman says:

            Norman links to an equation he cannot understand.

            Nothing new.

            It’s about time for him to start his usual insults, false accusations, and misrepresentations. That always happens when he runs out of ways to fool people.

          • Chic Bowdrie says:

            Norman,

            I see the word gained and the author is using language you are comfortable with. I can see from past discussions that others are not comfortable with “gained, added, etc.” These are semantic disagreements, IMO, because no net energy ever got added to the warm surface from the cold one. If I owe you $2 and you give me back $3 in change from my $5 bill, you didn’t add any money to my net worth. Semantics, man, semantics.

            I’ve read the counter arguments about cold photons not working against warm surfaces or warm waves cancelling them out and maybe there is something to that. I don’t know. I’m just suggesting that you will not convince anyone who has repeatedly rejected your explanations. Let’s move on.

            See the new thread below for the rest of the story (a little Paul Harvey lingo there).

          • Nate says:

            Chic,

            ‘Can you transcribe the GPE problem’

            It’s the one being discussed in this thread. Except with thin black body plates.

          • Nate says:

            OK, so as expected, JD cannot solve the problem. Yet, inexplicably, he declares a ‘solution’.

            That leaves DREMT. Or Mike. Or Gordon.

          • Chic Bowdrie says:

            Nate,

            I’m looking for one of the textbook problems you refer to. I want to try to see how the question is posed and try to come up with the answer the textbook gives. But don’t give me the answer.

            This is not a gotcha question. I trust you have seen a textbook with this type of problem. A link or citation will do.

          • Nate says:

            Chic,

            This specific one is 400 W/m^2 input from sun normal to large Blue Plate (a BB) in space.

            What is temperature of plate?

            Green plate (a large BB) added in parallel behind BLUE.

            What is temperature of GREEN and BLUE after a long time.

            Please do solve it and show these guys.

            For other problems, I’ll have to hunt for them.

          • Nate says:

            Mike, DREMT, you cannot offer a solution of GPE either?

            Then how do you know your ‘solution’ is correct? Very odd.

            Here’s a hint, the well known technology multi-layer-insulation uses this very principle.

            In fact the example they show is almost exactly our GPE problem. See Function and Design.

            https://en.wikipedia.org/wiki/Multi-layer_insulation

            Chic, I recall a HW problem to derive their equation for the heat transfer coefficient.

          • Dr Roys Emergency Moderation Team says:

            Ah, MLI. Multiple layers of reflective material.

          • Nate says:

            No. Apparently you missed the very first example, which is non-reflective material. It works for that too.

            Did you read it?

          • Chic Bowdrie says:

            Nate,

            The link provides a solution for a problem where the temperature of the side facing the source is kept constant. This is not the same problem as the blue/green plate experiment. Good thing, because it also gave the solution which I didn’t want until finished the assignment.

            I formulated my own homework problem and remembered posting on this sometime back. Does anyone know an easy way to search this blog for it?

          • Svante says:

            Add this to your google search string:
            site:www.drroyspencer.com

            Filter by time.

            Or tell me what search for, I have downloaded text files.

          • Nate says:

            ‘Not the GPE’ ‘one side held at constant temperature’.

            True, but I trust that you agree that this difference is not a way out for DREMT, and JD.

            The geometry is the same. And the effect of the Green plate is the same. It insulates the blue plate purely via radiation.

            The result is that the net flow of heat in one direction is cut in half (even more with reflective surfaces).

            Just what one desires from insulation, and why MLI is used for that purpose.

            In my work, MLI is used to keep heat from room temp from penetrating a cryostat and boiling away a cryogenic liquid.

          • Dr Roys Emergency Moderation Team says:

            Nate, please stop trolling.

        • Nate says:

          Ha! Ha!

          Mike gets what he repeatedly asks for. Can’t deal.

          • Nate says:

            Mike your charade of repeatedly asking for a GHE explanation is exposed.

            You are only programmed to respond with catch-phrases like ‘Still no GHE’ etc.

            Svante’s video is an opportunity for you.

            Here’s your chance to poke real holes in GHE science. Let’s see what you got?

          • Mike Flynn says:

            Nate,

            The nutty professor provides no GHE science.

            Neither does anybody else.

            Maybe if someone could provide a copy of the GHE couched in scientific terms, supported by a testable GHE hypothesis, then at least the matter could be assessed.

            But of course, nobody can. No science. No GHE.

            Obviously, nobody even attempts to suggest a GHE description. The laughter at such an attempt would be deafening. Give it a try. Be prepared for a question or two, before I start laughing. How hard can it be? Probably about as hard as Gavin Schmidt becoming a real scientist.

            Cheers.

          • Nate says:

            “But of course, nobody can. No science. No GHE.”

            Mike, Svante showed you what you asked for, a perfectly adequate explanation of the GHE for blog purposes.

            You have no scientific response.

            It shows that you are a fraud, who really has no idea what’s wrong with GHE science. All you offer is a bunch of hot air (Ha!).

            “if someone could provide a copy of the GHE couched in scientific terms”

            No. No one here should do your busy work when it’s guaranteed to be ignored.

            I would respectfully suggest that you Google it yourself, you lazy piece of crap!

            Cheers.

          • Mike Flynn says:

            Nate,

            Claiming that an amateurish YouTube presentation by a nuttty professor is GHE science, is just crazy.

            Neither the GHE nor unicorns exist, notwithstanding any claims you may make to the contrary.

            Produce either in reality, rather than in your delusional fantasies, and others might believe you.

            Of course you can’t. All you can do is wriggle and jiggle on your own hook, like the Warmist worm you are.

            Carry on with claiming that cooling is heating, that pseudoscientific climatology is valid science, or even that you have a valid GHE explanation hidden away somewhere!

            So sad, too bad. Increasing the amount of CO2 between the sun and a thermometer does not make the thermometer hotter. Quite ridiculous (unless you are a delusional and gullible GHE true believer, of course).

            Keep blathering – it’s diverting, at least.

            Cheers.

          • Svante says:

            It’s funny how everything you say describes yourself.

          • Nate says:

            ‘Claiming that an amateurish YouTube presentation by a nuttty professor is GHE science, is just crazy.’

            Nice try, Mike.

            Easy enough to say its nutty and crazy, Mike. But apparently you cannot articulate what about it is nutty.

            Without using any of your usual catch-phrases, what specifically, scientifically, is nutty about it?

            What physics does it violate?

          • Nate says:

            And Mike’s got nothing.

            Weird that he keeps asking for a thing that he has no interest in, and is over his head in any case.

          • Dr Roys Emergency Moderation Team says:

            Nate, baiting is trolling. Please stop trolling.

          • Nate says:

            Trolling is what Mike does regularly. Making ad-hom and declarative statements that cant be supported.

            Questioning such statements is not baiting. It is holding people accountable.

          • Dr Roys Emergency Moderation Team says:

            Nate, please stop trolling.

  73. gbaikie says:

    Some are saying that in 12 years global warming will be dangerous.
    Who thinks this is true?
    In 12 years what will the global average temperature be?

    So currently global average temperature is about 15 C.
    In 12 years will it be about 15 C or some other number?

    Could it be about 15.5 C or more, such as about 16 C ??

    If it was 16 C in 12 years, will we see increase which would indicate such warming will happen in 12 years. Or will the warming occur suddenly as get close to the 12 year mark?

    If it was 16 C in 12 years, what would the noticeable effect of average global temperature of 16 C?

    Will entire world warm equally, or would southern hemisphere warm more or less than northern hemisphere?

    Or will winter become warmer. Or will winter remain as cold (or even get colder) but summers get much warmer.

    Or will warming be mostly in a region, such as polar region, which get so warm that all polar ice will melt in 12 years.

    In 12 year do you imagine global warming will a lot more than 1 C – how much more?

    • JDHuffman says:

      gbaikie, it should concern you that none of your “ors” allow for a cooler future.

      • gbaikie says:

        –Or will winter remain as cold (or even get colder) but summers get much warmer.–

        –gbaikie, it should concern you that none of your ors allow for a cooler future.–

        Oh, should there be a concern about cooler, Springs, Summers, and Falls?

        Normally people are not too concerned about cooler summers. Though there should be some concern about shorter growing seasons. Or one could say they come to expect better growing seasons, which could worsen in the coming decades, causing some to miss the good times of “global warming” (that was claimed to be our utter doom).

    • Bindidon says:

      gbaikie

      “Some are saying that in 12 years global warming will be dangerous.”

      In 12 years? Who tells that nonsense?

      In 120 I would understand. But it might become dangerous due to cooling as well.

      If exceeding warming globally melts huge amounts of ice: does this process not result in subsequent cooling locally at all the melting places? No idea…

      Anyway: in 20 years I won’t be alive anymore.

      • barry says:

        A huge amount of ice has melted away from the summer Arctic ice pack over time, but the temps up there have risen faster than any other large region on Earth.

        As the ice is on water, and water is darker than ice, the revealed surface absorbs more sunlight, adding to the warming.

        So maybe local cooling would occur with the melting of lots of land ice – but I doubt it.

        • barry says:

          Interestingly, the fastest warming in the Arctic has occured during the Winter months, when there has been slower melt of the ice pack over time for that season. But all seasons in the Arctic have warmed – with the exception of the high Arctic in Summer (North of 80), which is ice-bound all year, and the skin temp of the ice sets the surface temperature.

          • Gordon Robertson says:

            barry…” the fastest warming in the Arctic has occured during the Winter months, when there has been slower melt of the ice pack over time for that season”.

            Barry, are you right off your gourd? Melting of the ice pack in the Arctic winter?????

            There is absolutely no solar energy for a couple of months at least and during that period frigid air descends from the stratosphere. The average ice thickness increases to 10 feet.

            There is no ice pack. There are ice floes and they are moved around by winds, the Beaufort gyre, and the Transpolar Drift. What you call warming is a change in temperature from -50C to -45C, and only in continually moving locales. Only a raving masochistic optimist would call that warming.

            Have you ever experienced -35C? It’s so cold that all you can think about if you’re outdoors at night, even with normal winter clothing, is to get indoors. During the day, if the Sun is shining, it’s rays provide enough warmth to endure such cold provided you are adequately dressed.

            Ice does not melt in those conditions, so I have no idea what you’re on about with regard to dark water heating up the joint and melting ice.

          • barry says:

            Learn to read. I’m talking about long-term melting. At least you quoted the right part:

            “The fastest warming in the Arctic has occured during the Winter months, when there has been slower melt of the ice pack over time for that season

            The amount of Arctic sea ice cover in every season is less than it was 40 years ago. Over the last several decades reduction of the area of sea ice in the Winter season has been less than the reduction of area in the Summer season.

            Here’s a time series of March sea ice cover in the Arctic from 1979, when sea ice is usually at its maximum extent.

            ftp://sidads.colorado.edu/DATASETS/NOAA/G02135/north/monthly/images/03_Mar/N_03_extent_anomaly_plot_v3.0.png

            Geddit?

          • Dr Roys Emergency Moderation Team says:

            barry, please stop trolling.

        • bobdroege says:

          Why doubt it, it’s real

          Forgive the link to realclimate, but it was where I knew I could fine a nice picture that shows the regional cooling that is probably due to the melting ice.

          http://www.realclimate.org/index.php/archives/2019/01/what-the-2018-climate-assessments-say-about-the-gulf-stream-system-slowdown/

          • barry says:

            I draw your attention to what was contended:

            Bindidno: “does this process not result in subsequent cooling locally at all the melting places? No idea…”

            Not really corroborated by the realclimate article.

      • gbaikie says:

        –Bindidon says:
        February 11, 2019 at 6:09 AM
        gbaikie

        Some are saying that in 12 years global warming will be dangerous.

        In 12 years? Who tells that nonsense?–

        Dem presidential candidates trying to be more to the left as compared to their competitors of their primary process, which is beginning currently (it’s said there could be over 30 of them, though so far (very early in process) it’s only about dozen “which appear to be *serious*” ).

        –If exceeding warming globally melts huge amounts of ice: does this process not result in subsequent cooling locally at all the melting places? No idea–

        I think this could be a possible problem, if or when average ocean temperature is about 5 C.
        Or major volcanic activity under any of the two ice sheets.

  74. gbaikie says:

    In comparison, I wonder if anyone thinks it is likely that anyone will be standing on the Moon within 12 years?

    • Entropic man says:

      Anyone on the Moon inthe next twelve years will probably be Chinese.

      https://www.foxnews.com/opinion/why-chinas-spectacular-moon-landing-is-so-significant

      • gbaikie says:

        That would be good. Though still waiting for Chinese spacestation. And Maybe it will first be an Indian.

        Going to lunar surface is a lot easier, now, then 50 years ago. And anyone could go to the Moon in terms of orbiting or landing and then returning from lunar surface.

        But in terms of landing on lunar surface, I would say what important is landing in one of the polar regions, though I would not say whether the North or South polar region more important. Both poles are not explored. Both poles are quite different than rest of lunar surface. And it is thought the lunar poles might have possible potential of commercially mining lunar water.
        And also could have other surprising aspects, or the poles are almost “another world” which needs to be explored.

  75. barry says:

    The BoM pointed out the weather conditions that have held for the last couple of months that permitted such high extremes, so I don’t know why it is implied here that weather conditions were ignored by BoM.

    There were no record-breaking cold events for January (for that month), and that is unsurprising, as Australia has generally warmed since the beginning of the better quality instrumental record (from 1910).

    Yep, record-breaking heat got lots of mention. Is this a problem? It is, after all, of a piece with AGW. The usual caveat applies – one month’s data says nothing about climate change, but the fact that there were heaps of hot record breakers and no cold ones is indicative.

    • barry says:

      Here’s the chart of national January mean temps for Australia since 1910.

      https://tinyurl.com/y3vcth32

      Here is minimum temps for Jan.

      https://tinyurl.com/y4aezd7v

      And maximum.

      https://tinyurl.com/yxm2qyjr

      Jan 2019 was the hottest nationally. The regional variation (cooler than av. in some parts) is mentioned by BoM.

    • barry says:

      December 2018 was also the warmest December on record. Here’s the summary for people to get riled up about.

      http://www.bom.gov.au/climate/current/month/aus/archive/201812.summary.shtml

      • Stephen P Anderson says:

        Tony Heller’s new video on temperature data.

        https://www.youtube.com/watch?v=pgk3xFHvWLE

      • barry says:

        Heller is a serial spreader of misinformation.

        • Stephen P Anderson says:

          No he isn’t. Everything he does is spot on and I was wondering how long it would take one of you leftists to attack him-4 hours and 7 minutes.

        • barry says:

          At the outset he provides a data set from 1997 (GHCN) which is now much larger.

          He does not describe why adjustments were made, despite there being a wealth of literature on that subject, and instead refers to adjustment as if they were invented purely at the whim of the data compilers.

          Any rigorous attempt to criticise on adjustments has to deal with the reasons given for adjustments and deconstruct those. Heller doesn’t even mention them. This is the fundamental problem with almost all his blather. He ignores the literature, preferring conspiracy theories.

          Even Anthony Watts peer reviewed paper adjusted for the time of observation bias – the largest adjustment for USHCN – because he realized that the observation time changes really do introduce a bias over time. Watts actually attempted a reconstruction of US temps. Heller has done no original work. Typically, when a skeptic starts to do serious, granular work on the temp records, they end up corroborating the official records. C.f. Muller, Mosher, Watts, Condon, Roman M. Those who do no original work keep swatting blindly. Heller is the worst for this.

          Anthony Watts stopped hosting “Steve Goddard” posts at his blog years ago because even Watts knows what a BS artist Heller is.

          • David Jung says:

            barry,

            You just don’t like what Tony Heller has uncovered here. All the temperature data being hidden by BOM, all the data fraud at NOAA and NASA, how the bogus “time of observation” adjustments increase linearly so the end result tracks perfectly with the increasing concentration of CO2. You can blather on all you want about it, but Tony has nailed these junk scientists. Here’s some more historical Australian temperature data the distant past that ruins the global warming scam. Thanks Tony!

            https://realclimatescience.com/wp-content/uploads/2019/02/2019-02-11043010_shadow.jpg

          • Stephen P Anderson says:

            Barry,
            How can the GHCN data set be much larger when the number of weather stations reporting to GHCN have fallen substantially? Also, the warming bias due to urbanization has never been addressed. And, there is a conspiracy or collusion. Conspiracy or collusion are words in the English language. They actually do exist. Aren’t you leftists accusing Trump of conspiring or colluding with Russia? Many scientists who are leftists or have jumped into bed with the leftists and perpetrated this junk to help further the leftist agenda-The Green New Deal. One hand washes the other in the hopes that both get something out of it.

          • Stephen P Anderson says:

            Barry,
            Is there any inaccuracy in his reporting of James Hansen’s prediction of June 1986 that by 2020 the temperature would warm betwen 3-4F? This was before Hansen started adjusting the data. Wonder if he saw that his prediction wasn’t coming true. Too bad for all you alarmists that real scientists started looking at all this.

          • Bindidon says:

            Stephen P Anderson

            “How can the GHCN data set be much larger when the number of weather stations reporting to GHCN have fallen substantially? ”

            *
            Where do you have that nonsense from, Stephen P Anderson?

            GHCN V3 has 7280 stations, and GHCN daily has nearly 36000.
            I have both datasets in my computer.

            DO YOU ??? Certainly you don’t !!!

            Show me your source of this misinformation.

            It’s nearly 3 AM now, and time to go to bed.

          • Mike Flynn says:

            “In the case of GHCN-Daily, however, the densest historical station networks come from the United States, Canada, and Australia–a reflection of the comprehensive contributions from these countries.l

            Are the standards the same across these datasets?

            Maybe Australia leads the way, as far as quality, reliability, and accuracy go. Pity the BOM refuses to warrant accuracy, reliability or quality.

            Cheers.

          • Stephen P Anderson says:

            Bindidon,

            Here is one source. Maybe you have BS on your computer.

            https://www.skepticalscience.com/Why-are-there-less-weather-stations-and-whats-the-effect.html

          • Stephen P Anderson says:

            Bunch of falsifiers and junk scientists collecting temperature data. I wouldn’t trust any of it.

          • barry says:

            Stephen,

            How can the GHCN data set be much larger when the number of weather stations reporting to GHCN have fallen substantially?

            The GHCN data set comprises 7280 stations for their monthly global data set, and 36,000 for their daily set, as Bindidon said. They are 2 separate data sets, and the monthly one is used for global climate data.

            For the globalmonthly set, less than half the stations are able to be updated once a month on the 8th of the month. The rest either have been added retrospectively as a one-time addition from now-defunct stations:

            https://tinyurl.com/gp6z3qp

            or are updated more slowly and sporadically than the about 2500 that are part of the automated CLIMAT stream.

            To be clear, the station drop-off in recent times comes from historical data being added retrospectively, not from any data being deleted. That’sexplained in the methods paper above.

            Heller shows you data from a 1997 paper. The one I linked just above. The station count near the end is about 1500, with a peak at any one time of 6000. In 2019, 1000 more stations than 20 years ago are updated regularly, and there has been sporadic addition of historical data to GHCN in the last 20 years.

            There are the same amount of stations for global monthly, but the data pool is much larger.

            Rather than talk about Trump (who gives a F about him in this discussion?), read the paper and get back to me. This is what Heller should be doing, so he does more than raise conspiracy theories.

          • barry says:

            You just dont like what Tony Heller has uncovered here.

            Hahaha. No, I’m saying Heller invents conspiracy theories and misleads his minions (and other wayfarers who like his BS).

            I’m replying here with methods papers to the data sets. I’m going to bet my soul that neither you nor Stephen have ever read them carefully, if at all. And that is the least you have to do to rise above being a regurgitator of rubbish.

          • barry says:

            “Is there any inaccuracy in his reporting of James Hansen’s prediction of June 1986 that by 2020 the temperature would warm betwen 3-4F?”

            Nope, that seems legit, but I didn’t bother checking.

            “This was before Hansen started adjusting the data. Wonder if he saw that his prediction wasn’t coming true.”

            What if I told you that the temp of the US had risen 1.4F in that time?

            https://tinyurl.com/y3vxxeyg

            Would you then say that maybe Hansen and the others running GISS maybe aren’t trying to make the data match predictions?

            Or would you shift gear to a new criticism?

          • JDHuffman says:

            Barrister barry defends the guilty AGW hoax with all the zealotry of a kamikaze.

            Dodging the flak, provided by the relevant physics, he plunges full speed into his target, hoping to cause some damage to reality.

            A failed mission from the start.

          • Stephen P Anderson says:

            Barry,

            You asked me where I got this crap. I told you. From your leftist alarmist website. Also, I think because a lot more real scientists are looking at it now they can’t cook the books so to speak. I think they cherry pick as much weather station data as they can to try to make the temperature rise fit CO2 rise. But, you just can’t make real data fit your theory if your theory is wrong. One day we’re going to have these large CO2 generators (much bigger than the ones we have now) putting CO2 into the atmosphere because we’re going to need it to help feed people. When the next big temperature downturn comes it’s going to be a catastrophy for the planet and people.

          • barry says:

            Another skeptic who can’t understand a conversation. Nothing you said responds to what I said. And the source paper is there for you to read but you blabbed on about “leftist websites.” There is much more data in GHCN. That was what you queried, that’s the ball you just dropped.

            Ask for science, get politics. So much for scientific ‘skepticism.’

          • bobdroege says:

            I remember this

            “Anthony Watts stopped hosting Steve Goddard posts at his blog years ago because even Watts knows what a BS artist Heller is.”

            I started a food fight with Goddard over the triple point of water.

            It revealed the nature of the Goddard.

            It wasn’t pretty.

          • Dr Roys Emergency Moderation Team says:

            barry, bobdroege, please stop trolling.

    • JDHuffman says:

      barry, here’s some more weather for you.

      The next snowstorm is forecast to hit Sunday night, bringing 1-2 inches of snow, AccuWeather said, and another would pile on 3-6 inches Monday afternoon into Tuesday.

      The snow will ride a wave of record cold: High temperatures were expected in the upper 20s to low 30s, with wind chills from 17 to 22 degrees.

      https://www.usatoday.com/story/news/nation/2019/02/10/seattle-snowiest-february-70-years-more-coming/2830164002/

  76. Thank you Dr. Roy Spencer

    We are working on a real solution to solve unevenly distributed freshwater and heat/coldness among other things: hydroloop.org/solution.

    Another issue to consider is the freshwater footprint:
    Australia and California for example, use a massive amount of freshwater to export goods, food and even services far more than the amount coming in.

    This constitutes freshwater drain, making Australia and California dry faster if compared to the fact that if no fresh water was used to export food/goods, and services.

    The other issue is the temperature comparison between extreme cold and extreme from the ideal temperature. To bring the temperature down in Australia from heat will be much cheaper than to increase Siberian landmass.

    The point is to maximize different type of food, good or service production, the temperature for each type is different. And if we can bring colder freshwater to Australia and Africa, it will be much cheaper than bringing warm freshwater to Siberia.

  77. ren says:

    Dangerous freezing rain in Missouri and snowstorm in Iowa.
    https://pics.tinypic.pl/i/00979/ixs9xunr5jdy.png

  78. Mike Flynn says:

    Svante, presumably in an attempt to appear intelligent, wrote a comment which comprised –

    “Prejudice can cause detrimental decisions.”

    This is about as stupid as saying “Water can cause death.”

    True, but completely irrelevant.

    Foolish Warmists often resort to pointless one line comments when they have no cogent responses.

    A sad case of fanatics believing that science is settled by debate, and that consensus creates fact! Just look at Svante’s meaningless response to an opinion with which he did not agree.

    Still no GHE. No CO2 heating. So sad, too bad, Svante.

    Cheers.

    • Svante says:

      It is important to understand reality.
      You can be happy in a fantasy world for a while, but in the long run it can kill you.

      Here’s the GHE explained. No CO2 heating.
      https://tinyurl.com/y6sfq7ye

      • Mike Flynn says:

        Svante,

        The same repetitive link to the same nutty professor. If you want to try an appeal to authority, choose an authority, not someone as deluded as yourself.

        Oh dear. Have you considered learning some science? If you do, you might point out to the nutty professor the silly nature of his video. Another clueless amateur, pretending brightly coloured graphics will disguise his lack of knowledge.

        I see you are having trouble finding an actual description of the GHE, clear enough to allow a scientist to propose a testable GHE hypothesis. Maybe you could widen your search to include unicorns, or Trenberth’s missing heat.

        Keep searching, oh foolish Warmist!

        Cheers.

        • Svante says:

          You’re good at hand waving!

          • JDHuffman says:

            No Svante, it is you that is good at avoiding the relevant physics.

            (Did you miss Mike’s hint, “nutty professor”?)

            That video was just another rehash of the same old, worn out, pseudoscience. It relies on the bogus 255 K and confuses radiative flux with energy.

            But, I really laughed out loud when he applied the 1.2 factor to 255 K to arrive at a surface temperature of 306 K! You likely don’t realize that corresponds to 33 C, 91 F. I guess he believes Earth will keep warming until the surface average gets that high.

            “Nutty professor” is right.

          • Svante says:

            I do realize that because it was written in the diagram.
            He said “we over cooked it a bit”, did you miss that?

            Then he said some people thinks it breaks the 2nd law of thermodynamics, even though heat flows from hot to cold in the diagram. Do you think such people exist?

          • Mike Flynn says:

            Svante,

            Why do you ask questions if you are not seeking knowledge? Are you making stupid attempts at gotchas?

            Diagrams are not reality. NASA shows the Sun shining on all the continents at once. NOAA shows warm less dense water sinking and displacing denser colder water.

            Energy budget diagrams show assumed energy flows in W/m2 adding, regardless of the physical impossibilty of adding temperatures in this fashion.

            Nonsense, no matter how brightly coloured, remains nonsense.

            Maybe you could provide some useful facts – a description of the GHE, accompanied by a testable GHE hypothesis, would be a good start.

            Amateurish YouTube videos posted by nutty professors, or brightly coloured animated computer games produced by Gavin Schmidt, are based on pseudoscience, and not to be relied upon, of course.

            Cheers.

          • JDHuffman says:

            That’s why he’s a “nutty professor”.

            Got any more funny videos?

          • Svante says:

            Reminds me of another professor:

            “Dr. Lindzen accepts the elementary tenets of climate science. He agrees that carbon dioxide is a greenhouse gas, calling people who dispute that point ‘nutty.'”

          • Mike Flynn says:

            S,

            Intelligence is no protection against delusion.

            Lindzen can’t produce a GHE description any more than you can.

            What is your point? Are you trying to make some bizarre appeal to non-existent authority?

            Still no GHE. No CO2 heating.

            Cheers.

  79. Mike Flynn says:

    “Australian scientists at the Bureau of Meteorology (BOM) ordered a review of temperature recording instruments after the government agency was caught tampering with temperature logs in several locations.”

    This was a couple of years after this peer reviewed research –

    “Observations Reference Network (ACORN) data set is artificially created by the arbitrary correction of the truly measured temperatures making cooler the temperatures of the past [1-4]. Gillham [5] has freshly brought to the attention of the scientific community two old data sets that further support our claim, proving once more how the ACORN corrections are wrongly set up to magnify the warming trend where actually they should rather cancel the urban heat island effect reducing the trend.
    We previously discussed as the warming of Australia evidenced by the Australian Climate”

    Believe official Government records if you wish. They still won’t predict the future.

    Cheers.

    • barry says:

      Oh no, I prefer to believe in tabloid stories, blogs and authors of scientific papers who regularly change their names.

      It could possibly be interesting to unpack the allegations and find out what really is going on. But unfortunately you’re only capable of headlines and rhetoric, Flynn.

      • Mike Flynn says:

        barry,

        You can believe what you wish. It still won’t help you to predict the future. Or to magic the undefined GHE into existence.

        Do you still believe that increasing the amount of CO2 between the Sun and a thermometer, makes the thermometer hotter?

        The pretend climate scientist Gavin Schmidt apparently does. Maybe you are not as stupid and ignorant as him, but I doubt it. Keep avoiding, if makes you feel better.

        Cheers.

      • Stephen P Anderson says:

        Tabloids? Are you referring to all the climate science journals? Anyway, back to Heller, he mostly refers to the homogenized older data, not the new data. Like when the NOAA took the 1930’s warming period away. Couldn’t have a cooling trend from the 1930’s to the 1970’s. Couldn’t be warmer back then than it is now. Wouldn’t fit the narrative.

        • Stephen P Anderson says:

          Isn’t it amazing how all these homogenizations just keep making it warmer?

          https://wattsupwiththat.com/2019/02/11/another-bureau-rewrite-warms-australias-climate-history/

        • barry says:

          The trend in raw global temps is higher than the adjusted for the whole record.

          https://www.carbonbrief.org/explainer-how-data-adjustments-affect-global-temperature-records

          The latest NOAA SST revision (ERSSTv5) cooled recent temps from the previous version.

          UAH v6 has a much cooler trend than UAH v5.6 after 2000AD.

          No, not all adjustments warm the record.

          As for Australia, there are roughly an equal number of stations that had their trend adjusted to cooling as warming.

          https://moyhu.blogspot.com/2014/08/adjustments-sometimes-warm-sometimes.html

          The overall effect is a slight warming of the entire record. But they homogenization techniques are put to stringent tests, which themselves make for interesting reading.

          But you have to take an interest in understanding stuff instead of just regurgitating the cherry-picked rhetoric on certain blogs.

          • David Jung says:

            Climate science, which isn’t science at all, but pseudoscience, where data is always “adjusted”, “homogenized”, ignored, hidden, altered, made-up, faked, cheery-picked, and lied about, all in a desperate effort to make common folk believe that this diabolical trace gas CO2, which is essential for life on earth, is dangerous and will somehow ruin the earth’s climate, always 20 years in the future, this time, really, the calamity will strike. Meanwhile, in the world of sane people, we are seeing arctic ice increasing by enormous amounts, the Greenland Ice sheet increasing, fewer hurricanes, fewer tornadoes, fewer droughts, less acreage burned, better standards of living for humans, longer life spans, no change in the rate of sea level rise, and decreasing temperatures.

            Barry, the scam is over. We are all on to the Climate Gate fraudster’s pushing the CAGW scam.

          • David Jung says:

            barry,

            The link you posted that supposedly explains how measured temperature adjustments affect global temperatures even cherry picks the time period of the adjustments they discuss:

            “adjustments have relatively little impact on global temperatures, particularly over the past 50 years.”

            The big scam are the adjustments they make prior to 1960, more than 50 years ago, all in an effort to remove the 1930’s warm period.

            Even your links are full of cherry picked fraud.

          • barry says:

            No David – YOU are cherry-picking. From the same article:

            The adjustments that have a big impact on the surface temperature record all occur before 1950.

            Or did you not read the whole thing?

            The sum of adjustments for the whole period is to cool the record, not warm it, contrary to Stephen’s blog-fuelled opinion.

            Here is a link to raw and adjusted data for you to knuckle down and do some comparing.

            https://tinyurl.com/y2syyk3a

            The raw data is labeled “Without Corrections”

          • JDHuffman says:

            Exactly barry, they cool the past, to make the present appear warmer.

            You’re starting to get it.

          • barry says:

            No, you idiot. The opposite is true.

            https://www.carbonbrief.org/explainer-how-data-adjustments-affect-global-temperature-records

            The raw data has a much cooler past. Adjustments (mainly to sea surface records) warm the pre-1950 record and makes the whole data set have a cooler trend as a result.

            If skeptics want the global record with raw data they’re going to get a warmer centennial record, which means the globe has been warming faster since 1900, which indicates that sensitivity is higher than we thought, which means more warming coming….

            Stupid skeptics don’t know the consequences of their fatuous arguments.

          • barry says:

            If David Jung returns he may eventually learn that he was not referring to the global temperature record. ‘Skeptics’ can’t read or think straight. The stupidity is interminable.

          • Mike Flynn says:

            barry,

            You are a fool if you believe you can predict future temperatures any better than I.

            Want to bet?

            There is no global temperature record. If you believe there is, tell me what the most recent global temperature is, taken from the record of global temperatures? If you choose to, of course. I don’t believe such a thing exists. Maybe it’s on the shelf beside the GHE description, do you think?

            Still no GHE.

            Cheers.

          • JDHuffman says:

            barry, you’re the one that is claiming there are no adjustments, but the adjustments result in warming, but they don’t result in warming.

            It must be hard keeping all that straight….

          • barry says:

            What is this insanity in skeptics that they have to wholesale invent things other people have said?

            They’re mad. Can’t even hold the thread of a conversation in their mind, but create phantom conversations out of thin air.

            Mad and sad. I don’t encounter such intellectual depravity, such terminal miscommunication in real life, so why here? Who are these people?

          • Svante says:

            Some mothers do have them?

          • Dr Roys Emergency Moderation Team says:

            barry, Svante, please stop trolling.

  80. gallopingcamel says:

    @Svante,
    The “Green New Deal” looks pretty lame and it will wreak havoc on the prospects of the 70 plus elected Democrats who have embraced it.

    As an amateur it was not too hard to pick on a couple of absurdities but the real fun will start when Dr. Roy dismantles the GND edifice brick by brick.

    I look forward to your feeble efforts to defend the indefensible.

  81. Mike Flynn says:

    Nate wrote –

    “Climate change has in the past changed weather PATTERNS, eg causing desertification in previously fertile regions.”

    How foolish can a foolish Warmist be?

    Does he really expect anybody who lives in the real world to believe that the changing statistics of weather records can affect anything except a foolish Warmist’s delusions.

    Climate is the average of numbers derived from historical weather observations. No more, no less.

    Nate is obviously trapped in his own fantasy.

    Cheers.

    • Nate says:

      yada yada foolish yada yada warmist yada yada delusions yada yada warmist yada yada fantasy yada yada yada pseudoscience..

      More ad-hom noise, no signal from Mike-bot.

      Bot-filters applied.

    • Dr Roys Emergency Moderation Team says:

      Nate, please stop trolling.

  82. ren says:

    The temperature in the Central Pacific has fallen sharply.
    https://images.tinypic.pl/i/00979/dk24ivznhemz.png

  83. Bindidon says:

    Stephen P Anderson

    You wrote upthread:

    “Here is one source. Maybe you have BS on your computer.

    https://www.skepticalscience.com/Why-are-there-less-weather-stations-and-whats-the-effect.html

    First of all: thanks for your nice, intelligent suppostion. As all ‘skeptic’s, you seem to keep in guessing, suspecting, claiming instead in searching for facts.

    And the best is here that ‘skeptic’s never have any problem to refer to the web site ‘skepticalscience’ whenever its alarmist blah blah fits to their narrative. Ha ha ha. Wonderful!

    *
    Here is a bit BS out of my computer, Anderson. It was extracted out of the GHCN daily data set:

    https://tinyurl.com/mlsy22x

    where we all can find and process data out of over 100,000 stations, about 36,000 of which are specialised in temperature data.

    1. in a first graph you see two plots of global temperature anomaly averaging:

    – one in blue made out of data coming from all stations having sufficient records in the chosen reference period (1981-2010) to build a baseline for anomalies; that results in nearly all stations with early contribution being excluded;

    – one in red made out of data in (1) plus that coming from a baselining with all 2.5 degree grid cells in which station data has been averaged, btw integrating lots of data absent in the blue plot:

    https://drive.google.com/file/d/1pJVej3lVzcq-rZrQxztcrmFQ9WjY0Kt6/view

    The plots are the result of a final average of all grid cells along latitude bands into a monthly time series for 1880-2018.

    2. In the second graph you see a record of all stations having participated in each year in the corresponding time series.

    https://drive.google.com/file/d/174RSYB87MwMqk0xTRcy0AlcmcMIUGLAn/view

    You see how dramatically the stations disappear!
    Horrible.

    You see also, when comparing the first and the second graph, how little the influence of additional stations has been after around 1948.

    And last not least, you see that while the number of stations goes up and down, the number of grid cells, and hence the global station coverage, keeps nearly constant since 50 years.

    Why this grid? Simply because if you directly average all stations into a monthly time series, it will look like the backyard of the USA: 50 % of all stations namely are located there.

    By gridding you move from a situation where 18000 US stations compete with 18000 stations outside of the US (i.e. over 90 % of the land surfaces) to one where 200 US grid cells compete with 2000 non-US grid cells.

    You still do consider that be BS, Anderson? Your problem.

    I like facts.

    • Bindidon says:

      I forgot to link the plots’ color to the corresponding data.

      Blue is the time series with all stations lacking data suffcient for a baseline during 1981-2010.

      Red is the time series where nearly all stations lacking that baselining data obtained it out of their surrounding 2.5 deg grid cell.

      Only 184 of actually 35,537 stations were excluded (those having no neighbour on their cell).

      It is clearly visible that allowing this backdoor for stations having contributed in earlier times made the record ‘warmer’.

    • barry says:

      Not sure if I understand, Bin, but the red line is a cooler trend than the blue one. So allowing ‘backdoor’ stations without the data for the official baseline makes the record cooler, doesn’t it?

  84. Bindidon says:

    Yeah!

    While Hawaii experiences its first snow evah, we have in Northeastern Germany, for the second time in sequence, a wonderful, mild ‘winter’ (quotes needed). Zero snow, zero ice…

    Here minusses, there plusses. That’s life.

  85. Bindidon says:

    The eternal discussion about the 1930’s

    Here are the top 25 years in the US maximum absolute temperature record collected out of the GHCN daily data set:

    1934 18.20
    1905 18.17
    1914 18.13
    1900 17.99
    1907 17.98
    2016 17.98
    1906 17.94
    1915 17.93
    1908 17.92
    1897 17.89
    1910 17.86
    1913 17.83
    1931 17.82
    1921 17.70
    2017 17.63
    2015 17.59
    1926 17.57
    1901 17.55
    1998 17.55
    1912 17.49
    1909 17.48
    2005 17.46
    2002 17.46
    1895 17.42
    1936 17.40

    And here are the top 25 years in the US minimum absolute temperature record collected out of the same GHCN daily data set:

    2016 7.97
    2015 7.70
    2018 7.47
    2017 7.45
    1998 7.25
    2005 7.08
    2004 7.05
    2002 7.04
    2014 7.00
    2003 6.97
    2007 6.91
    2006 6.88
    2001 6.84
    2012 6.81
    2013 6.72
    2000 6.69
    1957 6.68
    1981 6.66
    2011 6.64
    2010 6.57
    1914 6.56
    1905 6.56
    1915 6.53
    1991 6.53
    1986 6.52

    Fourty years ago, the lists would have shown different: because

    -the number of US stations together with their spatial distribution
    and
    – the different processing of the data

    obviously gave different results at that time.

    Sure: there is the slight warming since then. But I don’t think it is the major aspect when considering the USA.

    • barry says:

      Even in the latest US data, the mid-30s saw the highest average temps IN SUMMERTIME.

      https://tinyurl.com/yxu9f2ub

      That hot Summer in the mid-30s has not been erased from the data. It’s still the hottest Summer.

      So what happens if we run a linear regression from the hottest Summer in the US record to the latest summer?

      https://tinyurl.com/y234wxuq

      We find that on average US Summers have been getting warmer since the peak one in 1936.

      Added bonus, maximum and minimum US Summer temps + trend line from 1936.

      https://tinyurl.com/yxpbc2on

      Maximum Summer temps have hardly changed since 1936.

      https://tinyurl.com/y3n9q9vs

      Minimum Summer temps are hotter lately than in the 1930s.

      • Bindidon says:

        Thanks barry!

      • Svante says:

        What about the cause then?

        Same as for the reduced diurnal range (although you said that trend had stopped in later years)?

        Contrails or the T^4 difference?

      • barry says:

        Reduced diurnal range is a problematic ‘prediction’ of AGW.

        Globally the av diurnal range has diminished for the last 100 and also for the last 60 years.

        But it’s not so clear for the last 30 years.

        And it’s quite variable regionally. Eg, The diurnal range for Australia has not changed much since 1910 (-0.01 C/decade).

        https://tinyurl.com/y4r2wc2z

    • bilybob says:

      Bindindon,

      Can you do the 25 bottom minimum’s? My guess, it should show a very cool early 20th century.

      The top 25 maximum seem consistent with what I have been seeing.

      • Bindidon says:

        Ooops, unfortunately I missed this message!

        I’ll do that, bilybob. But it will be exactly the complement to the maxima listed above.

        The interesting point is rather the mimima’s top list.

      • Bindidon says:

        Here is the stuff

        1896 4.48
        1924 4.64
        1904 4.82
        1917 4.93
        1903 4.93
        1895 5.21
        1916 5.32
        1920 5.36
        1976 5.37
        1902 5.38
        1898 5.38
        1943 5.39
        1897 5.44
        1971 5.45
        1918 5.46
        1944 5.48
        1927 5.52
        1901 5.54
        1975 5.57
        1942 5.60
        1966 5.61
        1972 5.61
        1919 5.62
        1925 5.62
        1910 5.64
        1964 5.64

        • bilybob says:

          Thanks Bindindon,

          It is what I expected.

          The highest minimum range 6.5C to 8.0C are falling more recently then the lowest minimum with range of 4.5C to 5.0C (plus minus).

  86. Mike Flynn says:

    Nate wrote –

    “yada yada foolish yada yada warmist yada yada delusions yada yada warmist yada yada fantasy yada yada yada pseudoscience..

    More ad-hom noise, no signal from Mike-bot.

    Bot-filters applied.”

    If Nate put his fingers in his ears, closed his eyes firmly, and repeated “yada yada yada” over and over, he wouldn’t have to waste his time posting meaningless responses to comments he supposedly doesn’t read.

    I certainly wouldn’t object.

    Cheers.

  87. Mike Flynn says:

    I point out that Svante has not managed to provide a copy of the usable GHE which he said he could.

    Svante responded –

    “Youre good at hand waving!”

    Others may or may not agree that foolish Warmists tend to fly off into deny, divert, accuse tactics of avoidance when challenged about their steadfast belief in pseudoscience.

    Still no GHE, apparently. No CO2 heating. Just more claims of impending doom, due to the sinful activities of those in favour of avoiding starving and freezing in the dark!

    Removing CO2 from the atmosphere would remove all animal life (including humans) from the face of the Earth. I believe that supporting this action would be considered a crime against humanity in some quarters.

    Cheers.

    • barry says:

      Ah yes, the blogsite with the main purpose of dismissing the BoM data into question.

      I’ve found it completely untrustworthy in the past. Any reason to think that these articles are competently researched? What background work did you do to check it out, Gordon?

      • Mike Flynn says:

        barry,

        Maybe you prefer a World Meteorological Organisation publication –

        “The report generally shows that:

        The basic Stevenson screen design has been in use already for a century.

        Over this time there have been many attempts to modify the design of screens with the intention of improving their performance and to determine their influence on the temperature measurement.
        The differences in measurements caused by the condition of the surface of a good design of screen can be as important as the differences between different screen designs. Changes to screen designs may change climatological records.

        Different screen designs suit different climatological regions.”

        Briefly, reproducible useful accuracy cannot be achieved over any practical timespan.

        Any number of peer reviewed research papers show that attempting to measure air temperature is fraught with difficulty, regardless of the technology employed. Of course, pseudoscience doesn’t need to concern itself with reality.

        Mad assumptions carry the day. We’re all doomed! It’s worse than we thought! Repent, the end is nigh! What tosh. What’s the current delusion? 12 years before the world ends? Yeah, right.

        Cheers.

      • crakar24 says:

        LOL Barry,

        According to the BOM Oodnadatta has recorded the hottest temp, however in ACORN 1 Albany got a 7C boost and became the hottest town. Unfortunately the BOM where none the wiser so Oodnatta maintained its legendary status.

        Acorn 2 has unceromoniously stripped Albany of its hottest but not the hottest town title by removing 2.7C thus reestablishing Oodnatta as the title holder, however Carnarvon got a 3.3C boost to now leap frog Oodnatta in the non official hottest town title race.

        As there has been no fanfare screaming from the roof tops declaration by the BOM it would seem they are still none the wiser.

        As a stats man Barry i would expect you would be up in arms over this abuse of numbers but alas your profound need to conform to the herd and believe in something non tangible has over ridden your ability to think logically.

        Instead of viewing the information provided by Jo Nova you simply dismiss here with Ad Homs………………Oh how the mighty have fallen

      • barry says:

        I do indeed prefer authoritative sources, Mike. And that 1998 report was an interesting read. However, this is mainly an issue on local scale. On a global scale the law of large numbers and averaging manage to yield fairly accurate results, as is plain when comparing data sets, including satellite.

        https://tinyurl.com/yyt32pen

        Look at the annual averages. Why do satellites and surface results correlate almost 100% in sign year by year (ups and downs match direction) if the thermo record is so bad? Coincidence, you reckon?

        • Mike Flynn says:

          barry,

          In response to your pointless gotcha, I don’t know the answer. I assume you will provide one.

          Which data set do you claim is the most accurate? They all appear to be different.

          If they all purport to be measuring the same physical quantity, and the atmosphere behaves chaotically, would you not expect possibly a little more variation in the differences? Or is overwhelming gullibility and lack of skepticism a pseudoscience requirement?

          Generating mindless and pointless graphs produces no hints as to what the future may hold. It might be cheaper, faster, and more satisfying to divine the future from left over chicken bones or tea leaves.

          What, after all, is the point of endlessly reanalysing the past? Do you believe you can reheat the globe by debating the matter, or stridently declaring the existence of an indescribable GHE?

          Go your hardest. You can’t even warm up a teaspoon of water with a billion Watts of power from a small glacier! So much for pseudoscientific climatological misdirection and stupidity.

          Let me know when you have some GHE science to propose. I won’t be holding my breath while I wait.

          Cheers.

          • crakar24 says:

            “The law of averages” what a toss. There is no law that allows you to average numbers of one decimal place and get a result to 3 decimal places and call them accurate.

            You cannot have 3 temp stations covering 100’s of square kilomters and then state with absolute certainty the temp in any small grid box is accurate to 3 decimal places by invoking some obscure law.

            You certainly cannot drive economies into the dust by legislating crippling policies based on a law made up by failed mathematicians.

          • barry says:

            And yet, crakar, the satellite data, which covers 95% of the globe, is consistent with the annual variation in the surface data.

            And though the amplitudes don’t make exactly,they are similar,as the chart shows.If it’s a big el Nino year n the satellite record, the same large spike occurs in the surface. Only the exact magnitude is different.

            Do you know what happens if you pick a subset of 100 stations evenly spread across the globe, and then a different subset, and then a different one and so on? The temperature profiles are very similar.

            If it looks like the same profile with different sets of 100 stations around the globe, then that is a strong indication that averaging works, and that the law of large numbers holds.

            This is only one of many tests undertaken to assess the accuracy of the global temp data sets.

            This is only one of many tests and quality control procedures that the institutes go through that you are utterly ignorant of, because skeptics like you don’t want to learn about it, you only want to peddle the message you like and promote the blogs who feed it.

            They do another test to see if the correction algorithms have a warming bias. It’s unbelievably elegant and obvious.

            They invert every single temperature anomaly, so that the positive anomalies become minus anomalies and so on. They end up with a mirror-reverse image time series – one that cools over the whole period.

            Then they run the correction algorithm. If the result is a mirror image of the result with normal anomalies, then the algorithm does not have a warming bias (or a cooling one). It changes all the anomalies the same way, just in the negative direction.

            Now you know of 2 tests they do. They run suites of tests. About which you know nothing, and without the knowledge of which you spread misinformation.

          • barry says:

            crakar throws some quotes around this phrase, as if I actually said it:

            “The law of averages”

            What is wrong with these so-called skeptics? Why do they continually fabricate what other people say? It’s demented!

          • Dr Roys Emergency Moderation Team says:

            barry, if you could just try to keep the trolling down a bit, that would be great.

        • barry says:

          In response to your pointless gotcha, I dont know the answer. I assume you will provide one.

          It was already in the short post you are replying to.

          Seems you’re as senile as Robertson. Bye bye.

          • Mike Flynn says:

            barry,

            I suppose you think posting an irrelevant link is as good as an answer. Typical foolish
            Warmist behaviour. Your question included the word why”, and of course your link provides no answer at all.

            What a wonderful approach! Ask a pointless gotcha, and then boast about it. It is generally regarded as trolling, but you are probably too stupid and ignorant to realise that.

            But hey, maybe you can actually do what you claim you can – stop reading, (and more importantly, stop responding to), my comments. I doubt you have that much self control, but I could be wrong.

            I live in hope that you will ignore me.

            Cheers.

    • barry says:

      Hahaha. In the first link they champion ye olde temps at a site where the thermos are next to a brick wall, and in the second link they denigrate modern temps at a site that has had urbanization occur 50 meters from the thermos.

      No consistency, just whatever sounds like the BoM are a bunch of liars.

      Heh. The conspiracy theorizing in context… they do it in Australia, they do it in America, they do it in the UK, they do it in Japan. Every institute cooking the books for the global warming scam!

      Fer Pete’s sake.

      What’s the difference between these climate ‘skeptics’ and cranks? Nothing.

      • Gordon Robertson says:

        barry…”In the first link they champion ye olde temp….”

        ‘They’ is Jo Nova, who presents a far more convincing skeptical POV than you do as a climate alarmist.

        You always manage to dance around the issue. She made the point that the temperatures in a certain Australian locale were far higher in 1939 than in this recent so called record breaking heat wave.

        That’s proof, in part, that the 1930s set not only records in the US, but in Australia as well.

        “Whats the difference between these climate skeptics and cranks?”

        By cranks, you do mean climate alarmists. The difference in intelligence of the skeptics over the alarmists should be obvious to anyone with any intelligence.

      • Mike Flynn says:

        barry,

        I suppose you wouldn’t accept a BOM document – Report 4 for the independent peer review . . . – which contains the following –

        “One aspect of the system unchanged over the past 100 years is that the Bureau does not calibrate SAT thermometers. Instead their outputs are assumed to be in the relevant temperature scale (Fahrenheit or Celsius) within prescribed tolerance limits.” – plus or minus 0.5 C!

        It doesn’t matter, anyway. Nobody can see into the future by dint of furious and intense examination of the past. That’s fortune telling – just like pseudoscientific climatology.

        Carry on with your conspiracy theories – it’s well documented that 100% of pseudoscientific GHE believers cannot actually define this GHE. No conspiracy, just mass delusional psychosis. Just like Lysenkoism. At least Lysenko was a real scientist, unlike the fake climatological pretenders.

        Cheers.

      • barry says:

        The satellite temp record of Australia yields a warmer trend than the BoM.

        Do you think BoM should adjust their figures to match the warmer UAH trend for Australia?

        • crakar24 says:

          For the love of God Barry you really are staunch believer arent you?

          Here is the problem, if the BOM want to claim “hottest JAN evah” type thngs i want to know if it is an accurate claim. I dont care what the temp is as long as it is accurate.

          Based on what we know it would be fair to say that not even the BOM know what the true temp/trend is. You cannot have a monthly square wave adjustment on Perth temps and call them accurate.

          How is it possible for Albany to have recorded the hottest temp in Australia way back in 1933 and no suddenly be usurped by Canarvon which recorded a cooler temp in 1953?

          How is it possible to drop a temp by 2.7C which was measured 82 years ago?

          You of all people should understand and agree with this Barry.

          When people wave this stuff away they think they are being clever but in reality they look like fools……………you look like a fool Barry right now Barry so i will give you one last chance to resurrect your credibility or forever be condemed as an Appell clone.

        • Chris Hanley says:

          “The satellite temp record of Australia yields a warmer trend than the BoM”.
          It’s marginal, the troubling adjustments are to raw surface data before 1980, after that date the adjustments are minimal:
          https://kenskingdom.wordpress.com/2014/07/16/the-australian-temperature-record-revisited-part-4-outliers/
          Hardly surprising, the BOM adjusters are not stupid, the satellite series are an independent check on the surface record.

        • barry says:

          crakar,

          I have many times in the past dug into the issues JoNova brings up, and most of the time there’s nothing there but someone who stopped fishing for answers once they got enough info to raise a hue and cry. A bit more digging and you see what they ‘overlooked’.

          So, no, I don;t agree with her and Ken about the Australian temp data. I saw this exact same BS play out with Anthony Watts and the US record. It only took Anthony 6 years to finally construct his own US temp record, instead of forever sniping about individual stations, and to discover that his mean US temp record matched the official ones.

          It took skeptics Jeff Condon and Roman M to build their own global temp record from raw data. Guess what? They ended up with higher trends for the globe than the Met Office.

          At this point I’m content to wait until Ken and Jo develop their Australian temp record using what they think are best practises. Or get their criticisms published in a journal. Otherwise, they have been a wasteful time sink for me, and I do not credit them.

          If you wish to pick a specific topic to investigate, then I’ll play, but if you’re just going to regurgitate their stuff, forget it. Been there, done that.

          • Crakar24 says:

            Really barry,

            Two datasets arekind of but not quite roughly the same so you declare them both accurate.

            You have no idea how the bom produce their numbers because they wont tell you and no idea with uah because you dont understand.

            You are a wonderful replacement for appell

          • barry says:

            Two datasets arekind of but not quite roughly the same so you declare them both accurate.

            You made that last bit up.

            Why do skeptics have to invent what other people say? Come on, crakar, be better than the schmucks here!

          • barry says:

            And not only did you invent my words, you didn’t respond to anything in my post! Stop behaving like a typical crankish skeptic. Please!

          • Dr Roys Emergency Moderation Team says:

            Gonna have to ask you to just, once again, maybe think about dialling back some of the trolling, if you wouldn’t mind. Sorry to bother you.

        • barry says:

          For the love of God Barry you really are staunch believer arent you?

          In what?

          • Mike Flynn says:

            b,

            In the belief that fantasy trumps fact, obviously. Or maybe in the belief that physical fact is decided by consensus among pseudoscientists. Or maybe . . .

            Still no GHE, is there?

            Cheers.

      • Mike Flynn says:

        barry asks a gotcha of himself –

        “Do you think BoM should adjust their figures to match the warmer UAH trend for Australia?”

        barry finds himself unable to reply. Silly barry, asking himself a question which he cannot answer without appearing foolish.

        Historical temperatures are a curiosity, and generally without practical use. People apparently love adjusting, averaging, kriging, interpolating, and generally indulging in all the bizarre practices of the conformed measurebators. The past does not enable reliable assertions about the future.

        Go off and furiously play with your pencil, barry. Maybe you will experience an epiphany. Or maybe not.

        Still no GHE, is there?

        Cheers.

        • barry says:

          Mike, you made a point about the whole of “the past 100 years” of practise at the BoM. In response to my point about the last 40 years of global temperature you change the subject.

          As usual, you are nothing but hot air and contrariness. As I said, a decent conversation on point is not possible with you. Back to the ignore bin for you.

          • Mike Flynn says:

            barry,

            You asked yourself a silly gotcha. What has 40 years of global temperature got to do with your gotcha?

            You can’t even tell anyone at all what the global temperature is right now, let alone at any other time.

            That is no doubt that you are a pretentious fool – both stupid and ignorant.

            I would welcome the opportunity to be ignored by such as yourself, but I doubt you have the self-control to comply with your own instructions. I can but hope.

            Cheers.

  88. Gordon Robertson says:

    The Democrats in the US are proposing to replace air travel with high speed rail. Apparently, California is abandoning their high speed rail project because it has proved too costly.

    https://www.breitbart.com/politics/2019/02/12/california-governor-gavin-newsom-cancels-high-speed-rail-would-cost-too-much-and-take-too-long/

    There is a common thread running among climate alarmists, they are dreamers who fail to grasp the reality of their proposals to replace fossil fuels.

    • gallopingcamel says:

      That 500 mile rail project in Californoa cost estimate has almost doubled to $77 billion. Here at the heart of “Climate Science” we love “Doublings”.

      The bullet train will take double the transit time compared to Southwest Airlines and will charge double per ticket.

      The bullet train project can be made viable if all competing transportation alternatives are banned. Another way to go would be to increase fuel prices. Four “Doublings” would get the price of gasoline or “Jet “A” to $50 per gallon.

      One part of the “New Green Deal” plans to eliminate air travel throughout the USA. Imagine how many doublings of the $77 billion for that California bullet train would be required.

  89. .
    ❶①❶①❶①❶①❶①❶①❶①❶①❶①❶①❶
    ❶①❶①
    ❶①❶① . . . Temperature and Population by Country . . .
    ❶①❶①
    ❶①❶①❶①❶①❶①❶①❶①❶①❶①❶①❶
    .

    How many people will die, if we reach the +2.0 degrees Celsius temperature limit?

    Does anybody know?

    Even an approximate number?

    It is difficult to give an accurate number, because it is a totally new situation.

    But I have found a way to estimate the number of deaths.

    It took quite a bit of work. But in the end, the answer was obvious.

    The answer is so obvious, that I am not going to tell you the answer.

    I have done all of the work so far. It is about time that you pulled your weight.

    Don’t worry. I am only asking you to look at a graph. Do you think that you could manage that?

    ====================

    This is the only graph that you need to look at, to fully understand global warming.

    It even comes with a money back guarantee.

    So what are you waiting for, click the following link:

    https://agree-to-disagree.com/temperature-and-population-by-country

    • Mike Flynn says:

      Sheldon,

      Before I look (promise), the answer is 7.53 billion, the current population of the world.

      They will all die, regardless of temperature.

      I’ll click your link. I hope you didn’t come to the same conclusion.

      Cheers.

      • Mike Flynn says:

        Bugger. I still think I’m right.

        The question of how many extra people will die due to increased temperatures of 2 C, is of course impossible to answer. Some people who would otherwise have frozen to death, may well not die, instead.

        Additional land made useful for growing crops by increased temperatures may save some from starvation, but result in other early deaths due to people killed while growing or transporting crops, or while manufacturing things needed for the added production.

        On the other hand, if the economy benefits, people may not die quite so early from lifestyle diseases, which they wouldn’t have contracted had they not been so well off, due to medical advances, which have have caused early deaths in researchers owing to the stress of their mental efforts, or workers getting mangled in machinery, which might result in . . .

        Bugger. Too confusing for me. I have to turn on the AC, which of course means burning more stuff. which results in . . .

        Cheers.

    • gbaikie says:

      –How many people will die, if we reach the +2.0 degrees Celsius temperature limit?

      Does anybody know?

      Even an approximate number?–

      Do you mean 1 C added to present average global temperature?
      So Earth having average temperature of about 16 C

      Or do you mean Earth average temperature of about 17 C?

      I don’t think we will reach a global average temperature of 17 C within couple centuries.
      And I think it’s possible that within 100 years, it’s possible [but not likely] to reach an average temperature of about 16 C.

      If talking about northern Hemisphere, it’s more likely to get to average temperature of northern Hemisphere of around 16 C within century.

      But if somehow the religious CAGWers are correct and global temperature becomes about 17 C.
      Part of answer could depend on how quickly global average temperature reach 17 C.
      And CAGWers who not just crazy dumb and completely uneducated, probably don’t imagine, Earth average temperature could reach 17 C within a few decades.
      And I would guess, the most plausible idea about unrealistic global warming would related to tropics developing the long awaited Hot Spot. Or the idea is the tropics or the tropical ocean heat engine gets supercharged. Or Tropics gets much warmer than it is, and/or has ever been.
      So could have tropics getting much more water vapor.
      And the tropics of about average temperature of 26 C becomes about 30 C [ 86 F ].
      Combined with Urban Heat island effect, the cities in tropics could become unbearable at times and cause deaths.

      Of course with supercharged tropical engine, more ocean heat could be transported pole ward. The gulf stream warms Europe by about 10 C which makes Europe have average temperature of about 9 C, and in addition to having warmer tropics, the transport of heat to Europe could increase in speed, so instead warming by 10 C the gulf stream might warm by 20 C, and raising Europe average temperature by 20 C rather than 10 C. So, Europe gets average temperature of about 20 C. And Europe doesn’t get snowfall near sea level, ever. And UK never gets any snow. And UK has tropical climate, or one easily grow orange trees anywhere in the UK [you don’t get close to freezing].
      And of course don’t have arctic polar sea ice, though a little bit of forming in winter. [Though Greenland is still mostly frozen, but in coastal areas would easily grow crops].

      As far as deaths, it seems one would get less people who would die from colder conditions.

      • Lewis guignard says:

        The easy answer is: we don’t know.
        The biggest obstacle to avoiding deaths is government and the radical AGW leftists. ie. When New Orleans suffered Katrina, Dick Cheney suggested not building it back. A reasonable response to a city which is below sea level etc. The uproar from the left and MSM was unbearable. It was built back. So how long before the next storm does worse?
        The same will be true in Miami, NYC and world wide. People will try to avoid contending with the normal changes of climate and force the world into a mold where it won’t fit. ie. People build on the barrier islands of the east coast. They are sand dunes, yet the people expect them to last forever and to be compensated to be able to rebuild after the expected storm – towards which the politically astute have caused government to cause the insurance companies to charge higher rates to people who live inland to subsidize the rates of those who can afford to live at the beach.

        The point is, millions will die, as always, from stupidity.
        But this is the nature of man. So what is the question?

        • gbaikie says:

          “…A reasonable response to a city which is below sea level etc. The uproar from the left and MSM was unbearable. It was built back. So how long before the next storm does worse?”

          It might be fairly reasonable choice, but government have always cost the most loss of lives in the past and will do this in future.
          One has wars and lack government preventing wars as an example
          Currently we have some in government, not willing to secure our southern border. And basically that is the only reason to have federal government.
          The lack of governments doing their jobs in various aspects [including national security] has caused and will cause many deaths and hardships for the public that they charged with governing. Though it seems biggest cause of death, is missed opportunity which is related to governments reducing liberty of it’s people and government being stupid.

          Anyhow, it would be up to the city of New Orleans but think rebuilding the city in different ways could also be an option, though probably it is likely there numerous Federal laws which restrict various ways of doing this.
          It seems not rebuilding city would due the reality of a non functioning federal government and incompetent local governance.

          One thing New Orleans could decide is that they we never in the future depend upon the federal government to keep there city safe from flooding. And Fed and State laws will be ignored in regards to the rebuilding of the city. And that have rebuild the city so there will not be similar future disasters.

      • Nate says:

        Lewis seems to think major cities like New Orleans, NY and Miami will need to be abandoned if 2 deg climate change happens?

        Dunes, yes, but major cities?

        Fairly alarmist scenario. I guess we should try to avert climate change then.

        • Svante says:

          Two degrees C is enough to wipe out most of the Greenland ice sheet, that’s seven meters of sea level rise.

          • JDHuffman says:

            Svante, the Greenland ice sheet only gets close to the freezing point a few times a year. A couple of years ago, the temperature set a new record low, in July, of -33 C. The current temperature is -46C.

            If you want something to be terrified about, check out the demons in your head.

          • Svante says:

            That’s right, it will keep adding in the middle, but lose more around the edges.

            There is a positive feedback too, because a lot of that coldness is due to the altitude. As it drops it gets warmer.

            Don’t panic, the process takes thousands of years.

          • Dr Roys Emergency Moderation Team says:

            Svante, please stop trolling.

  90. ren says:

    A large drop in temperature in southern Australia.
    https://images.tinypic.pl/i/00979/eovri3tun5hi.png

  91. Bindidon says:

    Here is the top 50 in the sorted list of GHCN daily maxima from Australian stations (in C of course):

    NARRABRI_AIRPORT_AWS_______ 2019 01 19: 56.1
    MILDURA_POST_OFFICE________ 1906 01 07: 50.7
    OODNADATTA_AIRPORT_________ 1960 01 02: 50.7
    MARDIE_____________________ 1998 02 19: 50.5
    OODNADATTA_AIRPORT_________ 1960 01 03: 50.3
    MILDURA_POST_OFFICE________ 1906 01 06: 50.1
    WARRACKNABEAL_MUSEUM_______ 2018 01 19: 50.0
    MUNDRABILLA_STATION________ 1979 01 03: 49.8
    FORREST_AERO_______________ 1979 01 13: 49.8
    EMU_CREEK_STATION__________ 1998 02 21: 49.8
    BOURKE_POST_OFFICE_________ 1903 01 04: 49.7
    BOURKE_POST_OFFICE_________ 1878 01 13: 49.7
    DENILIQUIN_(WILKINSON_ST)__ 1878 01 12: 49.6
    MOOMBA_AIRPORT_____________ 2013 01 12: 49.6
    BIRDSVILLE_POLICE_STATION__ 1972 12 24: 49.5
    MILDURA_POST_OFFICE________ 1906 01 24: 49.4
    MILDURA_POST_OFFICE________ 1904 12 31: 49.4
    DENILIQUIN_(WILKINSON_ST)__ 1863 01 05: 49.4
    WHYALLA_(NORRIE)___________ 1960 01 02: 49.4
    MARREE_COMPARISON__________ 1960 01 02: 49.4
    MADURA_STATION_____________ 1971 01 07: 49.4
    EMU_CREEK_STATION__________ 1998 02 16: 49.4
    ROEBOURNE__________________ 2011 12 21: 49.4
    KYANCUTTA__________________ 1939 01 09: 49.3
    MOOMBA_AIRPORT_____________ 2014 01 02: 49.3
    MARBLE_BAR_________________ 2018 12 27: 49.3
    WALGETT_COUNCIL_DEPOT______ 1903 01 03: 49.2
    BOURKE_POST_OFFICE_________ 1878 01 19: 49.2
    OODNADATTA_AIRPORT_________ 1960 01 01: 49.2
    EMU_CREEK_STATION__________ 2014 01 10: 49.2
    ONSLOW_AIRPORT_____________ 2011 12 22: 49.2
    ONSLOW_____________________ 2010 01 01: 49.2
    ONSLOW_____________________ 2008 01 11: 49.2
    MARDIE_____________________ 1977 02 09: 49.2
    ROEBOURNE_AERO_____________ 2015 02 21: 49.2
    MARBLE_BAR_COMPARISON______ 1922 01 03: 49.2
    MARBLE_BAR_COMPARISON______ 1905 01 11: 49.2
    WALGETT_AIRPORT_AWS________ 2014 01 03: 49.1
    MOOMBA_____________________ 1972 12 23: 49.1
    EMU_CREEK_STATION__________ 2010 01 02: 49.1
    ONSLOW_AIRPORT_____________ 2018 12 27: 49.1
    MARBLE_BAR_________________ 2019 01 13: 49.1
    ROEBOURNE__________________ 1998 02 18: 49.1
    BIRDSVILLE_AIRPORT_________ 2013 01 13: 49.0
    BIRDSVILLE_POLICE_STATION__ 1981 12 06: 49.0
    MARREE_COMPARISON__________ 1972 12 22: 49.0
    TARCOOLA_AERO______________ 2019 01 15: 49.0
    MARLA_POLICE_STATION_______ 1988 01 12: 49.0
    LEONORA____________________ 2013 01 09: 49.0
    EMU_CREEK_STATION__________ 2009 01 10: 49.0

    All these paranoid people who think BoM would have adjusted anything don’t have half a clue of what they tell about.

    And they ALL should read this:

    http://www.bom.gov.au/climate/change/acorn-sat/documents/BRR-032.pdf

    So they would learn a bit about BoM’s work… and possibly begin to understand what such people really do.

    *
    According to the data found in the GHCN daily record, Australia didn’t warm even a little bit since 1880 (0.03 C / decade, flat trend).

    And its warming since december 1978 is even less than that measured 4-5 km above it by UAH: 0.12 C / decade where UAH shows 0.18 C).

    But nevertheless, Australia’s top 25 monthly anomalies wrt 1981-2010 since 1880 look like this:

    1881 12 2.26
    1888 11 1.95
    2015 10 1.70
    1888 12 1.44
    2018 12 1.39
    1983 2 1.38
    2013 9 1.37
    2009 11 1.37
    2005 4 1.37
    1957 6 1.37
    2015 11 1.34
    2016 5 1.33
    2016 4 1.33
    2009 8 1.33
    1882 1 1.33
    2007 5 1.32
    2018 4 1.30
    1921 6 1.28
    2017 3 1.26
    2016 3 1.26
    1991 6 1.25
    1914 11 1.25
    1885 10 1.25
    1988 10 1.22
    1883 12 1.21

    While the warming trend for Australia’s UAH record since the year 2000 moved down from 0.18 to 0.13 C per decade, that for the surface went up from 0.12 to 0.32 C per decade.

    Interesting.

  92. bilybob says:

    Good Morning Bindindon,

    Either GHCN is wrong or BOM is wrong. The listing for Narrabri Airport is a high of 42.7 in January 2019.

    http://www.bom.gov.au/jsp/ncc/cdio/weatherData/av?p_nccObsCode=122&p_display_type=dailyDataFile&p_startYear=&p_c=&p_stn_num=054038

    Thanks

    • Bindidon says:

      bilybob

      You are of course right, we exchanged about that last week, sorry.

      I generated a new complete daily list and forgot to trop this strange record off the list. The 42.7 is in the GHCN record too (Jan 13).

      All data following Jan 19 with its 56.1 were marked invalid, probably because the temperatures went above GREENLAND RCH’s hottest evah in 1913.

      But it seems that this anomaly (here the word really makes sense) is the only one you detected, you are very good in such verifications.

      Its rather me who should say here “Thank you“.

      • Bindidon says:

        I had a look at the Narrabri list you provided the link to: only the Jan 19 record is absent there.

        • bilybob says:

          Bindindon,

          I thought that interesting also.

          The Greenland Ranch record is questionable. I have heard theories that a dust storm kicked hot sand up to the sensor. Though it still stands as the official world record, I do have my doubts. I have read ( I wish I remembered the source) that 55C is a theoretic upper limit for surface air temperature on Earth. I have seen some suggest that Greenland Ranch was probably closer to 53 to 54 and not the 56.7 recorded. The conditions would have to be in the desert regions with low ghg’s to allow maximum solar radiation penetration to the surface.

          • Bindidon says:

            Thanks bilybob…

            I’m not so very much interested in extreme maxima or minima. My focus is rather on averages than on single values.

            But I just found this:

            https://en.wikipedia.org/wiki/Highest_temperature_recorded_on_Earth

            The stats concerning Lut desert in Iran are interesting because these temps were measured many times.

          • bilybob says:

            Bindindon,

            The Lut desert is satellite based which is described as skin surface temperature. It would be interesting though if they would put a station there to see what air temperatures would be.

            I do need to track down where I read where the air temperature maximum would be 55C though. I realize that when you move to forest or urban areas, this maximum value drops due to the added ghg’s. It would be interesting if the source provided the math so I could confirm. I’ll keep looking.

    • barry says:

      Either GHCN is wrong or BOM is wrong

      They have different methods. They’re both ‘wrong’. They’re both estimates.

      BoM have 2 different records. The Bureau’s historical data, and the ACORN data set. The data are not always the same for the same station. ACORN is (re)constructed with long-term climate in mind. Station data can, for example, be altered after comparing with neighbouring sites (one step in the homogenization process).

      And there are millions of bits of data. Some are going to be wrong. The relevant question is “does this matter?” And the answer will depend somewhat on the purpose. Formal answers involve statistical testing, of which much has been done.

  93. Stephen P Anderson says:

    Just wanted to let you guys know I’m doing my part. I barbecued some steaks last night and decided to let the grill burn for an hour longer last night just to put some more CO2 into the atmosphere. Can some of you guy