
 Home/Blog
SUMMARY: Evidence is presented that an over-correction of satellite altimeter data for increasing water vapor might be at least partly responsible for the claimed “acceleration” of recent sea level rise.
UPDATE: A day after posting this, I did a rough calculation of how large the error in altimeter-based sea level rise could possibly be. The altimeter correction made for water vapor is about 6 mm in sea level height for every 1 mm increase in tropospheric water vapor. The trend in oceanic water vapor over 1993-2018 has been 0.48 mm/decade, which would require about [6.1 x 0.48=] ~3 mm/decade adjustment from increasing vapor. This can be compared to the total sea level rise over this period of 33 mm/decade. So it appears that even if the entire water vapor correction were removed, its impact on the sea level trend would reduce it by only about 10%.
I have been thinking about an issue for years that might have an impact on what many consider to be a standing disagreement between satellite altimeter estimates of sea level versus tide gauges.
Since 1993 when satellite altimeter data began to be included in sea level measurements, there has been some evidence that the satellites are measuring a more rapid rise than the in situ tide gauges are. This has led to the widespread belief that global-average sea level rise — which has existed since before humans could be blamed — is accelerating.
I have been the U.S. Science Team Leader for the Advanced Microwave Scanning Radiometer (AMSR-E) flying on NASA’s Aqua satellite. The water vapor retrievals from that instrument use algorithms similar to those used by the altimeter people.
I have a good understanding of the water vapor retrievals and the assumptions that go into them. But I have only a cursory understanding of how the altimeter measurements are affected by water vapor. I think it goes like this: as tropospheric water vapor increases, it increases the apparent path distance to the ocean surface as measured by the altimeter, which would cause a low bias in sea level if not corrected for.
What this potentially means is that *if* the oceanic water vapor trends since 1993 have been overestimated, too large of a correction would have been applied to the altimeter data, artificially exaggerating sea level trends during the satellite era.
What follows probably raises more questions that it answers. I am not an expert in satellite altimeters, I don’t know all of the altimeter publications, and this issue might have already been examined and found to be not an issue. I am merely raising a question that I still haven’t seen addressed in a few of the altimeter papers I’ve looked at.
Why Would Satellite Water Vapor Measurements be Biased?
The retrieval of total precipitable water vapor (TPW) over the oceans is generally considered to be one of the most accurate retrievals from satellite passive microwave radiometers.
Water vapor over the ocean presents a large radiometric signal at certain microwave frequencies. Basically, against a partially reflective ocean background (which is then radiometrically cold), water vapor produces brightness temperature (Tb) warming near the 22.235 GHz water vapor absorption line. When differenced with the brightness temperatures at a nearby frequency (say, 18 GHz), ocean surface roughness and cloud water effects on both frequencies roughly cancel out, leaving a pretty good signal of the total water vapor in the atmosphere.
What isn’t generally discussed, though, is that the accuracy of the water vapor retrieval depends upon the temperature, and thus vertical distribution, of the water vapor. Because the Tb measurements represent thermal emission by the water vapor, and the temperature of the water vapor can vary several tens of degrees C from the warm atmospheric boundary layer (where most vapor resides) to the cold upper troposphere (where little vapor resides), this means you could have two slightly different vertical profiles of water vapor producing different water vapor retrievals, even when the TPW in both cases was exactly the same.
The vapor retrievals, either explicitly or implicitly, assume a vertical profile of water vapor by using radiosonde (weather balloon) data from various geographic regions to provide climatological average estimates for that vertical distribution. The result is that the satellite retrievals, at least in the climatological mean over some period of time, produce very accurate water vapor estimates for warm tropical air masses and cold, high latitude air masses.
But what happens when both the tropics and the high latitudes warm? How do the vertical profiles of humidity change? To my knowledge, this is largely unknown. The retrievals used in the altimeter sea level estimates, as far as I know, assume a constant profile shape of water vapor content as the oceans have slowly warmed over recent decades.
Evidence of Spurious Trends in Satellite TPW and Sea Level Retrievals
For many years I have been concerned that the trends in TPW over the oceans have been rising faster than sea surface temperatures suggest they should be based upon an assumption of constant relative humidity (RH). I emailed my friend Frank Wentz and Remote Sensing Systems (RSS) a couple years ago asking about this, but he never responded (to be fair, sometimes I don’t respond to emails, either.)
For example, note the markedly different trends implied by the RSS water vapor retrievals versus the ERA Reanalysis in a paper published in 2018:
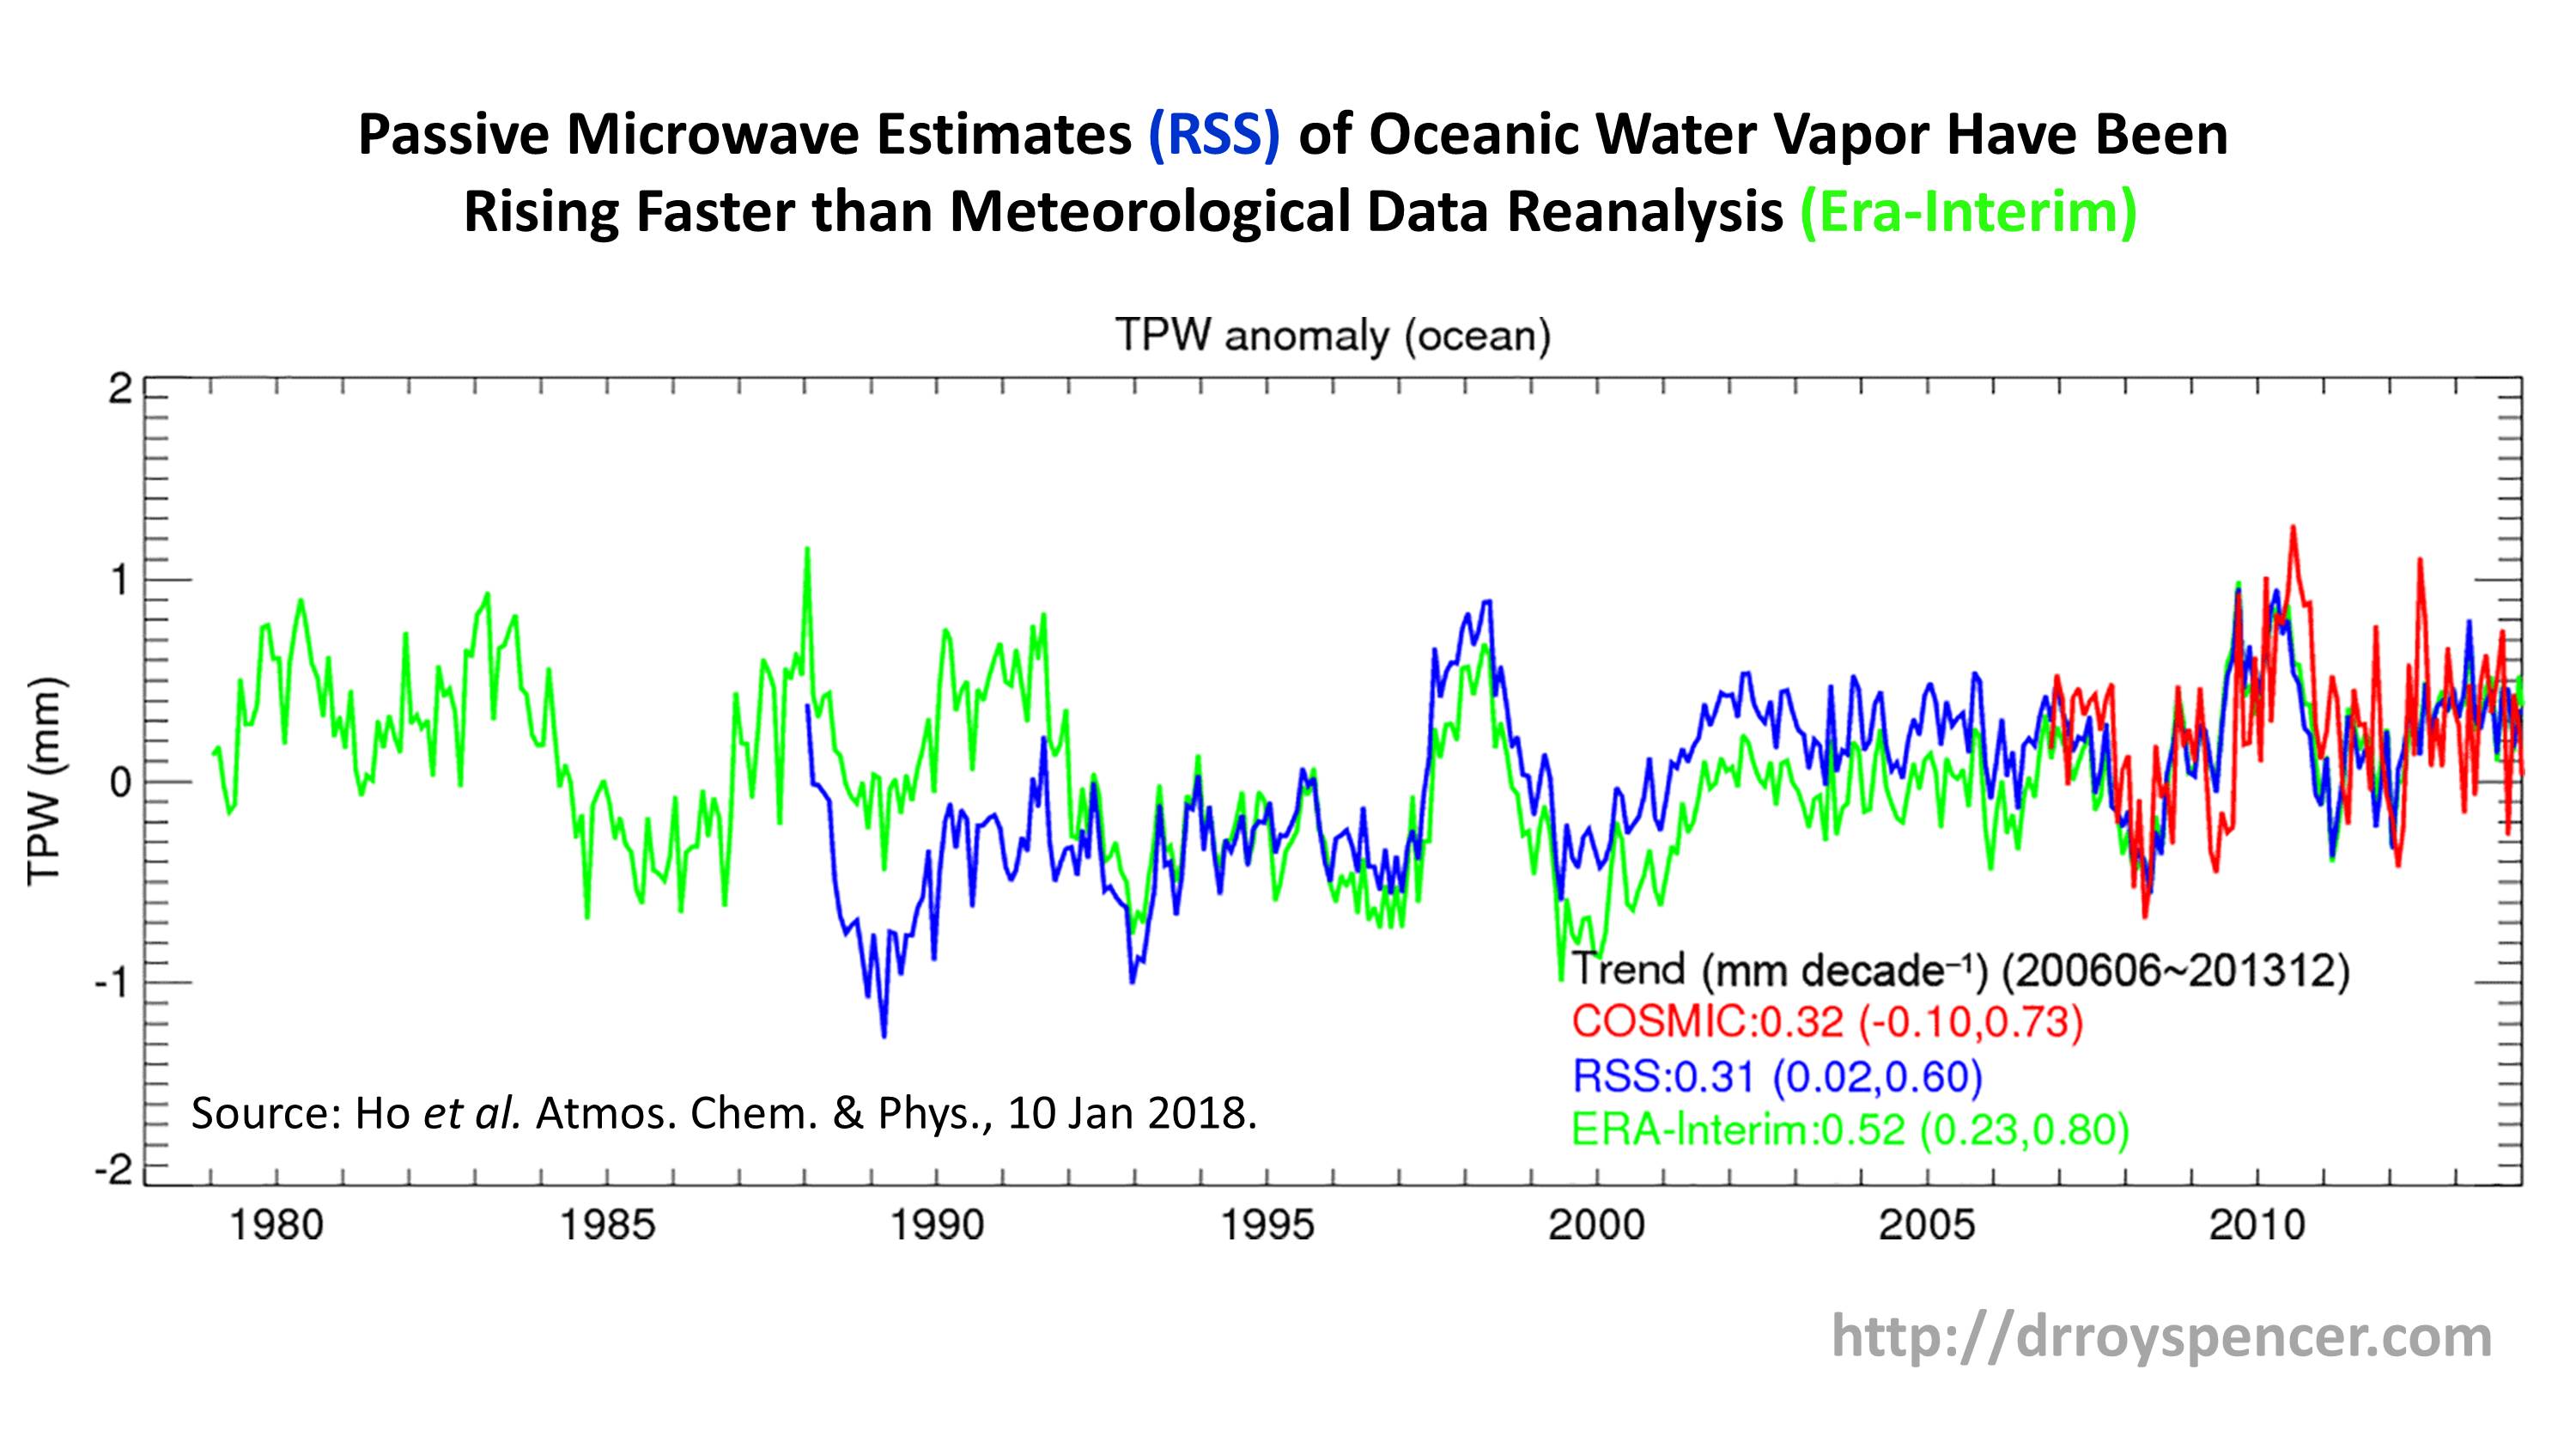
The upward trend in the satellite water vapor retrieval (RSS) is considerably larger than in the ERA reanalysis of all global meteorological data. If there is a spurious component of the RSS upward trend, it suggests there will also be a spurious component to the sea level rise from altimeters due to over-correction for water vapor.
Now look at the geographical distribution of sea level trends from the satellite altimeters from 1993 through 2015 (published in 2018) compared to the retrieved water vapor amounts for exactly the same period I computed from RSS Version 7 TPW data:
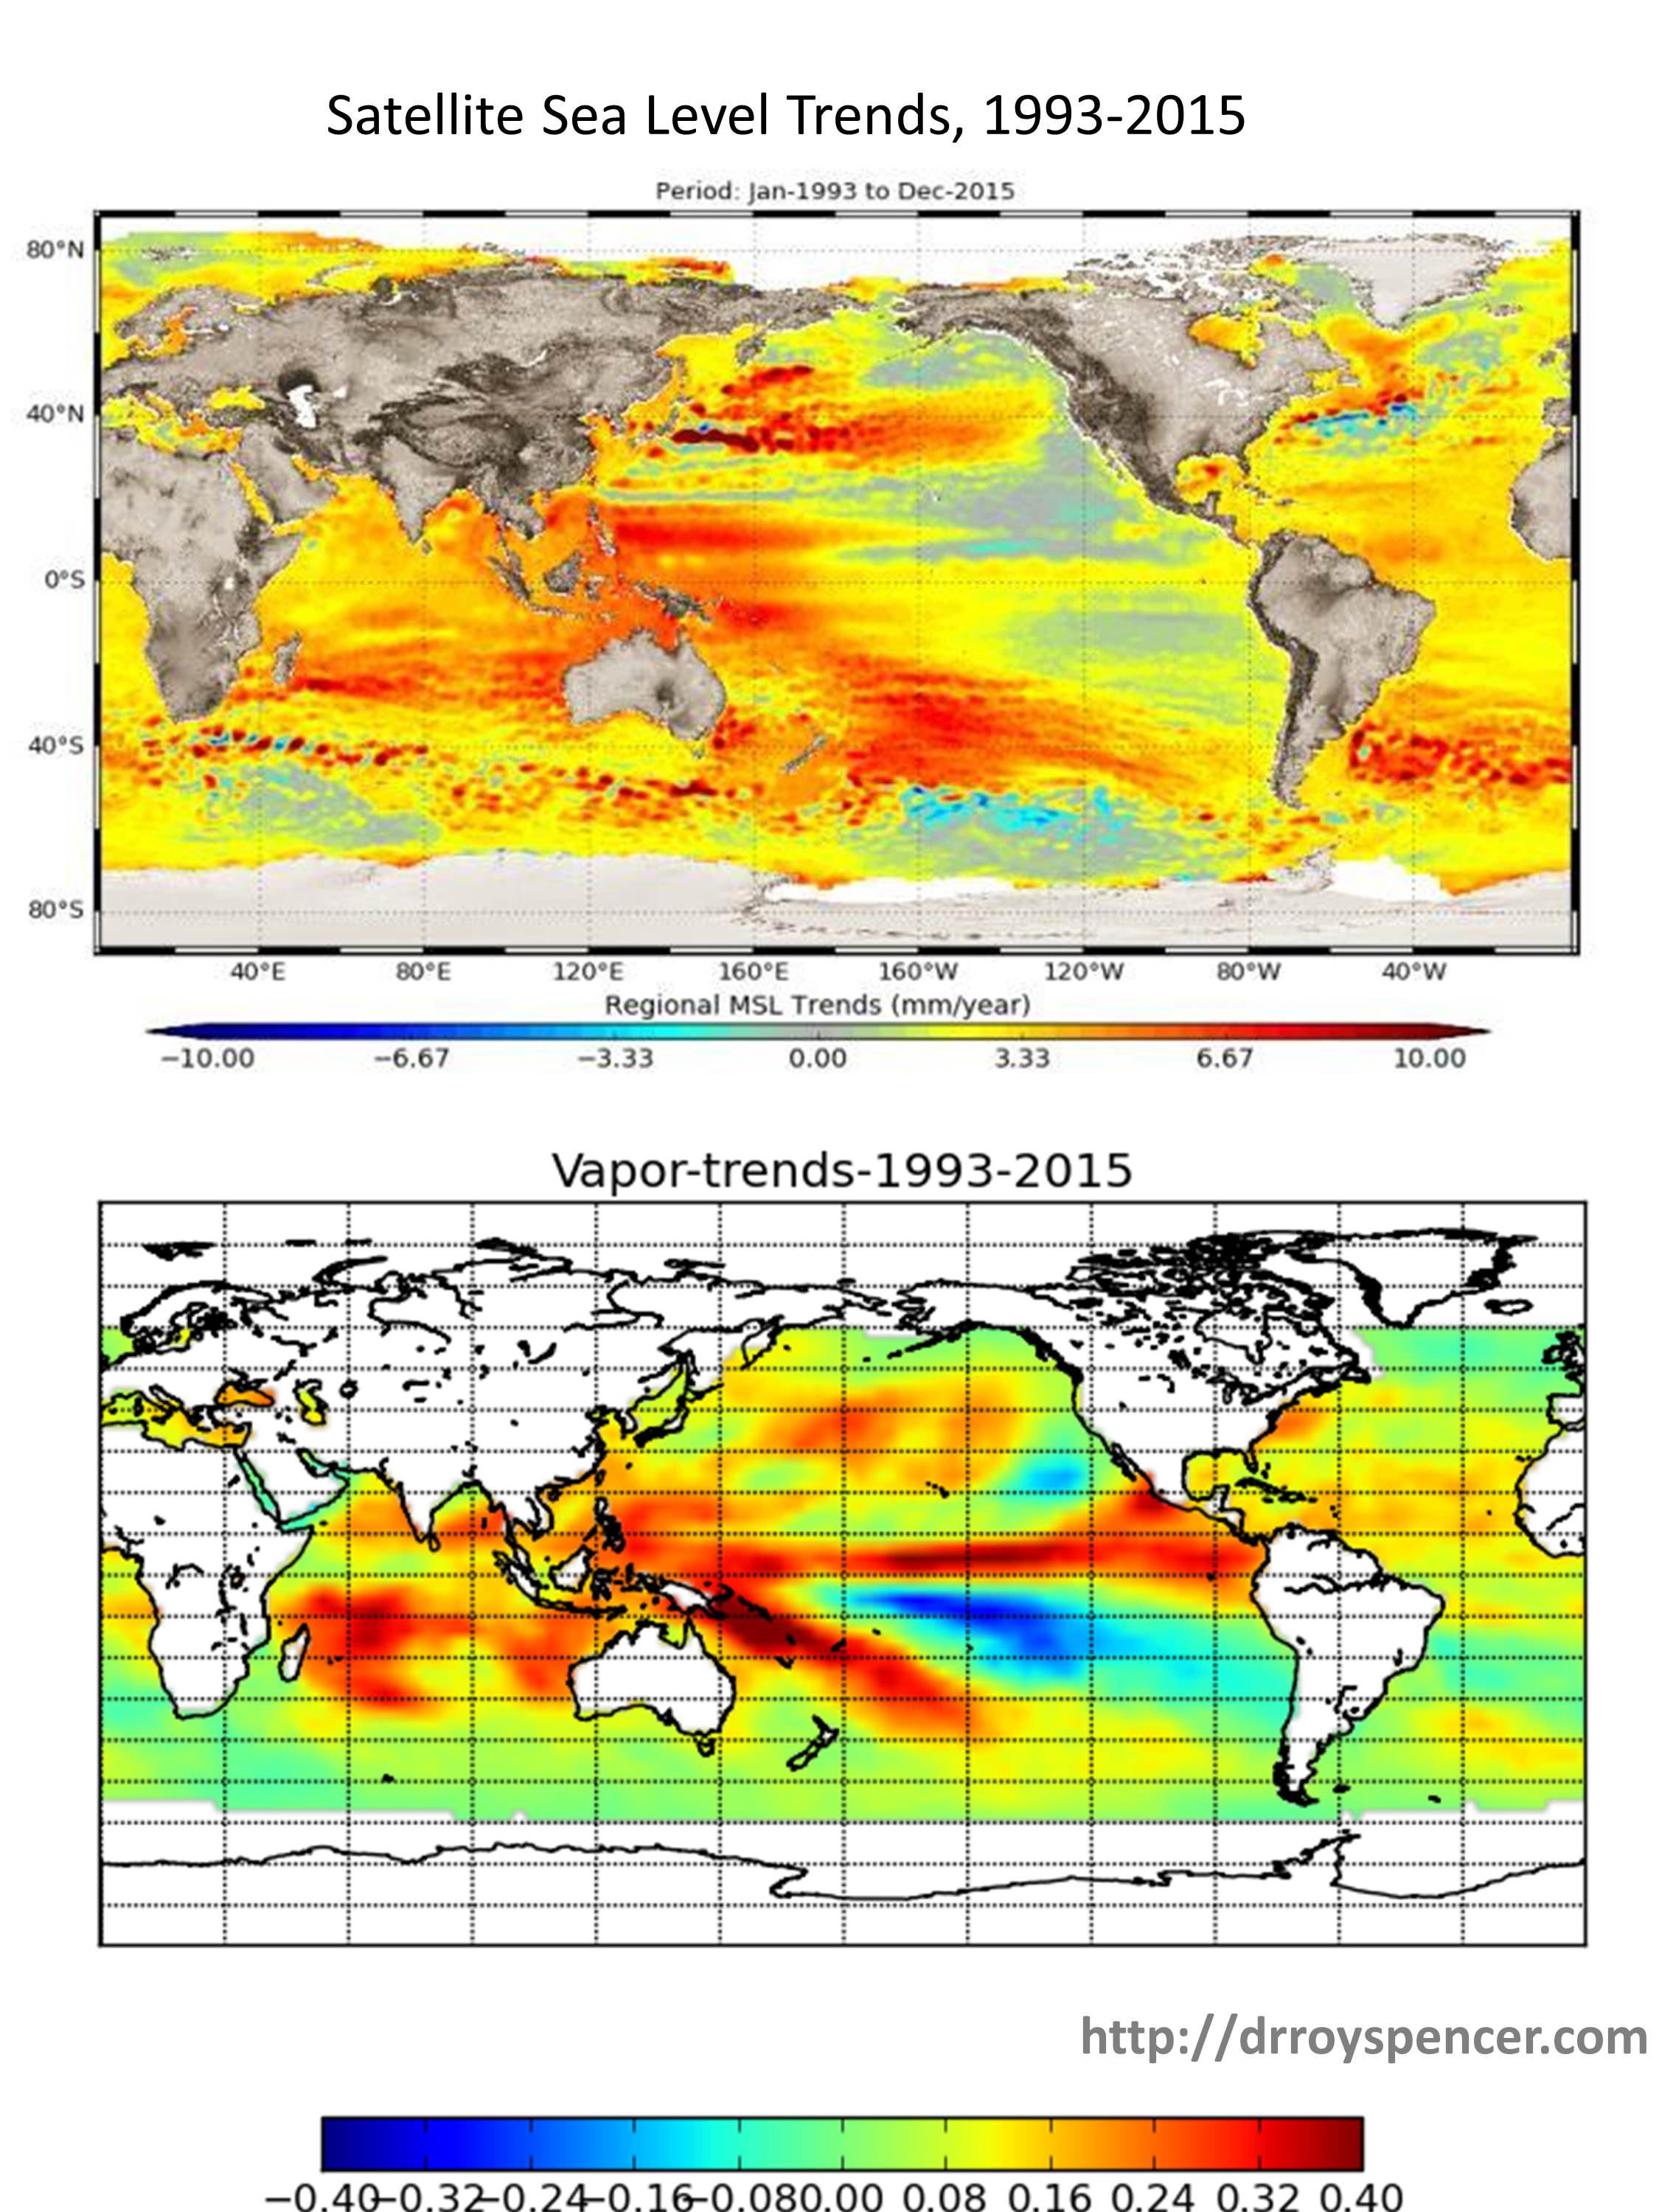
There is considerably similarity to the patterns, which is evidence (though not conclusive) for remaining cross-talk between water vapor and the retrieval of sea level. (I would expect such a pattern if the upper plot was sea surface temperature, but not for the total, deep-layer warming of the oceans, which is what primarily drives the steric component of sea level rise).
Further evidence that something might be amiss in the altimeter retrievals of sea level is the fact that global-average sea level goes down during La Nina (when vapor amounts also go down) and rise during El Nino (when water vapor also rises). While some portion of this could be real, it seems unrealistic to me that as much as ~15 mm of globally-averaged sea level rise could occur in only 2 years going from La Nina to El Nino conditions (figure adapted from here) :
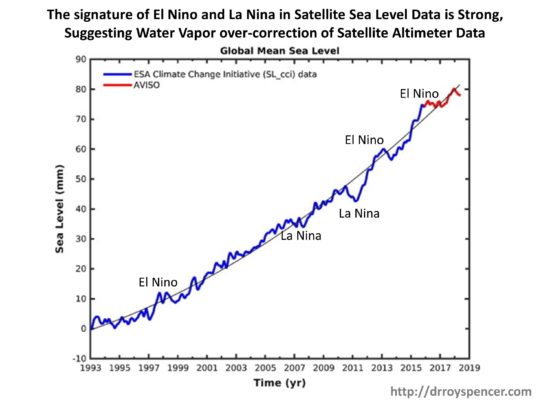
Especially since we know that increased atmospheric water vapor occurs during El Nino, and that extra water must come mostly from the ocean…yet the satellite altimeters suggest the oceans rise rather than fall during El Nino?
The altimeter-diagnosed rise during El Nino can’t be steric, either. As I recall (e.g. Fig. 3b here), the vertically integrated deep-ocean average temperature remains essentially unchanged during El Nino (warming in the top 100 m is matched by cooling in the next 200 m layer, globally-averaged), so the effect can’t be driven by thermal expansion.
Finally, I’d like to point out that the change in the shape of the vertical profile of water vapor that would cause this to happen is consistent with our finding of little to no tropical “hot-spot” in the tropical mid-troposphere: most of the increase in water vapor would be near the surface (and thus at a higher temperature), but less of an increase in vapor as you progress upward through the troposphere. (The hotspot in climate models is known to be correlated with more water vapor increase in the free-troposphere).
Again, I want to emphasize this is just something I’ve been mulling over for a few years. I don’t have the time to dig into it. But I hope someone else will look into the issue more fully and determine whether spurious trends in satellite water vapor retrievals might be causing spurious trends in altimeter-based sea level retrievals.


