
 Home/Blog
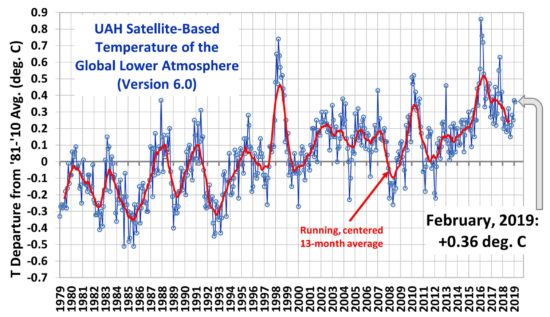
The Version 6.0 global average lower tropospheric temperature (LT) anomaly for February, 2019 was +0.36 deg. C, essentially unchanged from the January, 2019 value of +0.37 deg. C:
Various regional LT departures from the 30-year (1981-2010) average for the last 14 months are:
YEAR MO GLOBE NHEM. SHEM. TROPIC USA48 ARCTIC AUST
 2018 01 +0.26 +0.46 +0.06 -0.11 +0.59 +1.36 +0.43
 2018 02 +0.20 +0.25 +0.16 +0.04 +0.92 +1.19 +0.18
 2018 03 +0.25 +0.40 +0.10 +0.07 -0.32 -0.33 +0.60
 2018 04 +0.21 +0.32 +0.11 -0.12 -0.00 +1.02 +0.69
 2018 05 +0.18 +0.41 -0.05 +0.03 +1.93 +0.18 -0.39
 2018 06 +0.21 +0.38 +0.04 +0.12 +1.20 +0.83 -0.55
 2018 07 +0.32 +0.43 +0.22 +0.29 +0.51 +0.29 +1.37
 2018 08 +0.19 +0.22 +0.17 +0.13 +0.07 +0.09 +0.26
 2018 09 +0.15 +0.15 +0.14 +0.24 +0.88 +0.21 +0.19
 2018 10 +0.22 +0.31 +0.13 +0.34 +0.25 +1.11 +0.39
 2018 11 +0.28 +0.27 +0.30 +0.50 -1.13 +0.69 +0.53
 2018 12 +0.25 +0.32 +0.19 +0.32 +0.20 +0.65 +1.19
 2019 01 +0.37 +0.32 +0.42 +0.37 +0.48 -0.18 +1.10
 2019 02 +0.36 +0.46 +0.26 +0.43 -0.03 +1.03 -0.07
The linear temperature trend of the global average lower tropospheric temperature anomalies from January 1979 through February 2019 remains at +0.13 C/decade.
The UAH LT global anomaly image for February, 2019 should be available in the next few days here.
The new Version 6 files should also be updated at that time, and are located here:
Lower Troposphere: http://vortex.nsstc.uah.edu/data/msu/v6.0/tlt/uahncdc_lt_6.0.txt
Mid-Troposphere: http://vortex.nsstc.uah.edu/data/msu/v6.0/tmt/uahncdc_mt_6.0.txt
Tropopause: http://vortex.nsstc.uah.edu/data/msu/v6.0/ttp/uahncdc_tp_6.0.txt
Lower Stratosphere: http://vortex.nsstc.uah.edu/data/msu/v6.0/tls/uahncdc_ls_6.0.txt


