It is a truism that any observed change in nature will be blamed by some experts on global warming (aka “climate change”, “climate crisis”, “climate emergency”).
When the Great Lakes water levels were unusually low from approximately 2000 through 2012 or so, this was pointed to as evidence that global warming was causing the Great Lakes to dry up.
Take for example this 2012 article from National Geographic, which was accompanied by this startling photo:

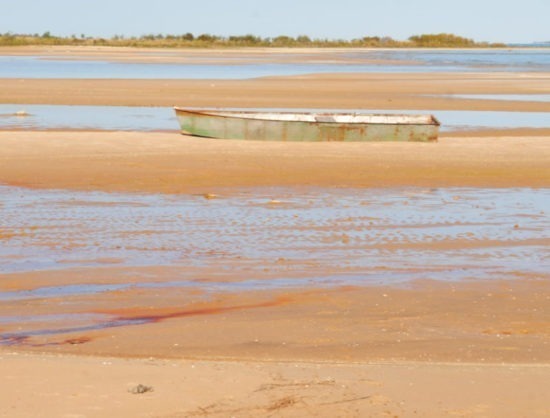
The accompanying text called this the “lake bottom”, as if Lake Michigan (which averages 279 feet deep) had somehow dried up.
Then in a matter of two years, low lake levels were replaced with high lake levels. The cause (analysis here) was a combination of unusually high precipitation (contrary to global warming theory) and an unusually cold winter that caused the lakes to mostly freeze over, reducing evaporation.
Now, as of this month (June, 2019), ALL of the Great Lakes have reached record high levels.
Time To Change The Story
So, how shall global warming alarmists explain this observational defiance of their predictions?
Simple! They just invoke “climate weirding”, and claim that the climate emergency has caused water levels to become more erratic, to see-saw, to become more variable!
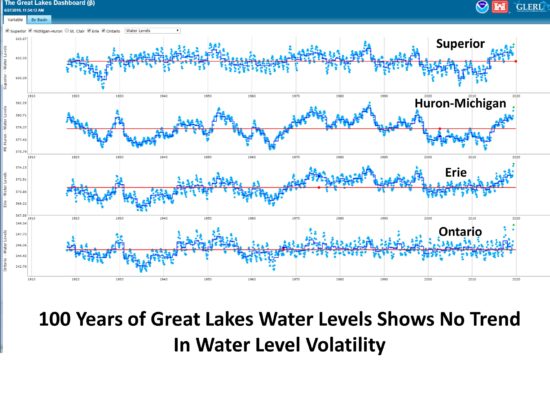
The trouble is that there is that there is no good evidence in the last 100 years that this is happening. This plot of the four major lake systems (Huron and Michigan are at the same level, connected at the Straits of Mackinac) shows no increased variability since levels have been accurately monitored (data from NOAA Great Lakes Environmental Research Laboratory):

This is just one more example of how unscientific many global warming claims have become. Both weather and climate are nonlinear dynamical systems, capable of producing changes without any ‘forcing’ from increasing CO2 or the Sun. Change is normal.
What is abnormal is blaming every change in nature we don’t like on human activities. That’s what happened in medieval times, when witches were blamed for storms, droughts, etc.
One would hope we progressed beyond that mentality.
witches may be causing the lakes variability , do we know if they are casing spells on them . i think an international team of witch-doctors should be dispatched immediately and be given a billion dollar budget to look into this.
I was talking to some of my daughters friends (16 years old) and the told me there was no point on planning for the future as the world would be unlivable before they grew up.
This is a disgusting death cult and these kids are there victims.
Quote from the NAt Geo article:
“With nearly 20% of the world’s surface freshwater at play and millions invested in restoration efforts, the stakes are incredibly high for understanding how natural climate variability and human-induced climate change affect the Great Lakes.
The IUGLS evaluated the impacts of climate change on lake levels in the Great Lakes region with state-of-the-art climate research. Projections suggest that “lake levels are likely to continue to fluctuate, but still remain within a relatively narrow historical range – while lower levels are likely, the possibility of higher levels cannot be dismissed.” Nevin explained it another way. “Low lake levels are not a new normal,” he said. “We expect to see lake levels fluctuate as we have in the past.”
Doesnt seem to match the theme of Dr Roys article, the idea that the CLIMATE CHANFGE PREDICTIONS were way off.
‘So, how shall global warming alarmists explain this observational defiance of their predictions?’
They’re trying to have it both ways. Any change at all is attributed to man-made warming. Do you propagandists really think most people are that gullible?
The children who are convinced the world is going to end by there teachers are that gullible. There can be nothing more evil than stealing all hope for the future from children.
Normal adults see a problem , discuss it and try to come to a solution. Global warming Death cultists scare kids and get them to cry about it on TV.
No child should be taught this.
Bri says:
“Normal adults see a problem … ”
That is not correct.
Normal people observe a wonderful climate (except for the unusually cold winter of 2018 2019 in the US) and celebrate warmer winter nights in Alaska.
There is no climate problem that needs solving.
Climate science has been hijacked for political purposes and turned into junk science.
Abnormal people (leftists) try to scare people with wild guess, always wrong, computer game predictions of a coming climate catastrophe (that will never show up), that can only be solved (allegedly) by electing Dumbocrats, and doing everything they say, without question. … to save the planet for the children (complete nonsense, but very persuasive_.
The leftist goal is a powerful U.S. socialist government.
That’s obvious in the recent “debates”.
Leftists sell socialism using climate scaremongering.
If capitalists point out the slower economic growth under socialism, the leftists claim slower growth means less “carbon pollution” (to save the planet for the children), and is good news.
The Alexandria Occasionally Coherent “Green Ordeal” reads somewhat like the Communist Manifesto.
On the subject of climate science, the leftists are fools — wrong, wild guesses of the future climate, and repeated historical temperature data manipulation, are not real science.
On the subject of gaining political power, the leftists are experts … who in the U.S. temporarily had trouble with master salesman Donald Trump, but they are working hard to demonize him before the 2020 election.
the correct response to climate change cultist’s
https://youtu.be/fmou0OZMTEw
“Declining Water Levels In The Great Lakes May Signal Global Warming”
https://www.sciencedaily.com/releases/2007/12/071230093533.htm
“Concerns Mount Over Declining Water Levels in Great Lakes”
https://www.accuweather.com/en/weather-news/concerns-mount-as-great-lake-l/14834545
“Global Warming: It Can Do Anything!”
https://www.powerlineblog.com/archives/2019/05/global-warming-it-can-do-anything.php
Just a few of many! It is never ending.
rah, what are the long term trends in the levels of the Great Lakes?
Here seem some worthy data, from the US EPA:
“Climate Change Indicators: Great Lakes Water Levels and Temperatures, 1860-2015”
https://www.epa.gov/climate-indicators/great-lakes
You can post “long term” records all you want. The hype was there about low water levels being caused by “climate change” and that and other alarmist drivel about the lakes can’t be erased. https://www.cleveland.com/weather/blog/2017/08/how_is_climate_change_affectin.html
Back when the lake levels were low that was a bad thing.
https://www.lakesuperior.com/the-lake/lake-superior/242-feature/
Now that the lake levels are high, it’s a bad thing also.
https://weather.com/news/news/2019-06-03-great-lakes-highest-levels-flooding-may
It is insanity to believe there is some mystical and as yet undefined ideal water level or range that can be maintained because man can learn to control the weather/climate if we only put out enough cash to do so. And that is exactly what is being implied can be achieved.
The lakes have some problems for sure, but they are the result of man made factors not so much related to climate like invasive species, fertilizer run off, etc.
“You can post ‘long term’ records all you want. The hype was…”
The former is science, the latter is media sensationalism. The difference is so obvious and hackneyed that it barely deserves a mention, and yet people remain fascinated as if they just discovered it. Every time they discover it.
What I see here is a misrepresentation of what climate science actually said.
Alarmism about ‘alarmism’
Red meat being tossed out and getting gobbled right up.
A colleague who worked in the Great Lakes Shoreland program told me nearly 50 years ago that water levels in Great Lakes were cyclical. Nothing that has happened since makes me think otherwise.
What causes the cycle(s)?
DA,
Do you know? If not, why not? Have you tried Google – it is your friend, you know.
Cheers.
It doesn’t matter what Roy posts, DA is just here to be negative. It’s almost as if he were paid troll. If we assume he is not paid, then we can agree that he is just a troll.
Quasi-cyclic behavior is ubiquitous in weather and climate. It is a natural feature of nonlinear dynamical systems. Just because we don’t understand the reason for something doesn’t mean it doesn’t exist.
Of course. But nor does it mean there isn’t an explanation.
Well make one up like you usually do.
Eat the right mushrooms, who knows what you might invent this time.
Randomness. Doesn’t science love that explanation?
Confirming what the Mikes and Dr Spenser said, cyclical (or any other) behavior doesn’t need a cause. It can just be quasi-random walks or maybe a combination of other cycles – some of which aren’t known about.
If someone wants to postulate a hypothesis on the cause, they need to show both correlation and causation, without fiddling the data. So that means all the “climate change causes lake levels to drop” as shown by rah links are wrong.
Now go away, DA.
All movement has a cause, including cyclic movement.
For example, we know what causes the Earth’s cycle around the Sun.
Maybe you don’t know what causes a certain cycle — if so, just say so — but saying “I don’t know” isn’t a scientific answer, it’s a statement of ignorance. Which is fine (for now), but distinguish the difference.
Glad to see you agree that the cyclic nature is TOTALLY NATURAL.
Just like the warming out of the coldest period in 10,000 years is TOTALLY NATURAL.
You always argue from ignorance, DA.
50 years ago, the cyclic nature may have been merely an observation. Michael Mann hadn’t even named the AMO (Atlantic Multidecal Oscillation yet.
The AMO is a possibility, as is the NAO.
Did Mann actually name the AMO?
Pretty good, if so. However
“The Atlantic Multidecadal Oscillation (AMO) was identified by Schlesinger and Ramankutty in 1994.”
https://en.wikipedia.org/wiki/Atlantic_multidecadal_oscillation#Definition
The Great Lakes water levels have been affected by innumerable man made alterations over the last 200 years. From diversions into Lake Superior to regulation of Lake Superiors lake level to the Chicago diversion into the Mississippi River watershed to St Clair River dredging to canals between Erie and Ontario to water usage for power, municipal and industrial purposes to hardening of the watersheds, they all have some influence on the water levels to make the entire system react differently from the 18th Century.
The lowest levels were during the adjusted away high temperatures of the 1930s and the record high was 1986 until recently.
Just a few years ago when they were lower it was because of AGW. Now that they are higher it is because of AGW. Everything is because of AGW.
How did so many predictions turn out so wrong? Manhattan isnt underwater. The 1969 prediction of no Arctic Ice in 20 years didnt turn out correctly. The 10 feet of oceans rising in several decades predictions by EPA in 1983 didnt turn out.
It seems that the fetal position platoon should become embarrassed at all the wrong predictions and make like the Detroit Lions fans and start wearing paper sacks over their heads.
> Did Mann actually name the AMO?
Well, maybe not. I missed this post at the time.
https://wattsupwiththat.com/2012/03/08/mann-and-coining-the-amo-and-claims-of-credit/
I missed that WUWT story, too, and see no reason to have regretted it. There’s nothing there.
They say humans are responsible for all the bad things that happens because of “climate change”.
But then we must also be responsible for all the good things that happens. And there many more places with good and normal weather than places with extremes. In average i believe the result is positive.
Who is “they?” Names?
You
S,
And his invisible friend, of course.
Cheers.
I didn’t think you could provide names.
Ruins the whole argument.
You haven’t put forward any argument to ruin.
Just mindless trolling
As I go down the thread, David is so far the only one to provide data on lake levels and temperature.
When I moved to Michigan from New York in 1977,the people here were already sick and tired about the Great Lakes water level scaremongering, which I was told consisted of:
When the water level was higher than usual:
Some local scientist would get in the newspapers by waving his arms like Democrat candidate Robert Francis O’Rourke does when he talks, and extrapolating the flooding of the state, and maybe the entire mid-west
When the water level was lower than usual:
Some local scientist would get in the newspapers by waving his arms like Democrat candidate Robert Francis O’Rourke does when he talks, and extrapolating the drying up of the lakes into huge piles of dead fish.
Richard: your imagery is perfect! And your text could be adapted to all of the weather events, from either extreme, that seem to be cited in ‘news’ stories as further evidence of undeniable evidence of humanity messing up the weather which is now going to result in utter catastrophe.
US EPA: “Climate Change Indicators: Great Lakes Water Levels and Temperatures, 1860-2015”
https://www.epa.gov/climate-indicators/great-lakes
Richard, you are brilliant. You captured the insanity so well that I LMLO (Laughed My Leg Off).
Keep up the good work.
Bit confused about the graphic showing slightly different levels in the Great Lakes. My understanding is that all the lakes are interconnected by waterways.
https://www.history.com/news/are-the-great-lakes-connected
Maybe my error was in presuming the lakes are all at sea level whereas the case may be that Superior is higher than Huron and that Superior water flows downhill to Huron.
Don’t know.
I do know there are canal gates on Ontario and Erie.
Why not Google them?
Here are the surface elevations:
Superior – 182 metres (600 feet)
Michigan – 176 metres
Huron – 176 metres
Erie – 173 metres
Ontario – 74 metres
Here’s an interesting video showing how shipping drops the 100 metres from Lake Erie to Lake Ontario via the Welland Canal.
https://www.youtube.com/watch?v=U15Fwo9tbJ4
The 74 metre drop from Lake Ontario to the St. Lawrence River is via the St. Lawrence Seaway, using locks.
Gordon Robertson says:
June 27, 2019 at 3:06 PM
so if levels are controlled by lock gates then why would there be a variability in maximum height.
I levels drop then surely lock throughput is limited. In UK canals use little water and where there is insufficient water to fill locks at the top of a hill water is actually pumped from a lower level – eg. Crofton Pumping Station
https://en.wikipedia.org/wiki/Crofton_Pumping_Station.
Levels surely must be manually controlled?
stavro…”so if levels are controlled by lock gates then why would there be a variability in maximum height”.
Good point.
It’s the lower two lakes, Erie and Ontario, that have the lock gates. I don’t know the hydraulics of the lakes but it seems reasonable that the flow from some lakes down to the St.Lawrence must be affected somewhat by human interference.
If Superior gets high, it seems obvious that water flows down the St. Mary’s River into Huron. It seems reasonable that water flows from Huron and Michigan into Erie since there is a 3 metre difference in altitudes and it’s uncontrolled.
From Erie to Ontario and on to the St. Lawrence there are human controls and what you say seems reasonable with regard to topping up low water levels.
Here’s your proof. Lake Ontario levels are adjusted manually.
https://ijc.org/en/loslrb/lake-ontario-outflows-continue-be-adjusted-balance-high-water-levels
Here’s another article explaining the change in levels between Michigan-Huron and Lake Erie. They put it down in part to dredging of the connecting St. Clair River which changed the depth and width of the river. Also natural corrosion of the river banks.
https://legacyfiles.ijc.org/publications/IUGLS%20St%20Clair%20Report%20Summary.pdf
St Lawrence Seaway has locks … but water levels are controlled by dams. Most of the water from Ontario to St Lawrence River goes over the dam.
Same goes for Welland Canal. Most of the water goes over Niagara Falls.
The water from Huron to Eire goes through a narrow waterway as does water from Superior and Michigan to Huron.
Water levels in the lakes rise when water goes in faster than goes out.
Ken…”Water levels in the lakes rise when water goes in faster than goes out”.
Thanks for info. We know that a trace gas like CO2 cannot affect the rate at which water flows into the lakes, or out of them.
CO2 causes warming which increases evaporation rates and leaves more water vapor in the atmosphere.
This has been observed.
DA…”CO2 causes warming which increases evaporation rates and leaves more water vapor in the atmosphere.
This has been observed.”
More propaganda from eco-weenie troll David Appell.
The only proof that CO2 causes warming was done in a lab by Tyndall in the mid-19th century. There has been no proof since that CO2 in the atmosphere causes warming in the atmosphere.
“Increases in greenhouse forcing inferred from the outgoing longwave radiation spectra of the Earth in 1970 and 1997,” J.E. Harries et al, Nature 410, 355-357 (15 March 2001).
http://www.nature.com/nature/journal/v410/n6826/abs/410355a0.html
Radiative forcing measured at Earths surface corroborate the increasing greenhouse effect, R. Philipona et al, Geo Res Letters, v31 L03202 (2004).
http://onlinelibrary.wiley.com/doi/10.1029/2003GL018765/abstract
“Observational determination of surface radiative forcing by CO2 from 2000 to 2010,” D. R. Feldman et al, Nature 519, 339343 (19 March 2015).
http://www.nature.com/nature/journal/v519/n7543/full/nature14240.html
More papers on this subject are listed here:
http://agwobserver.wordpress.com/2009/08/02/papers-on-changes-in-olr-due-to-ghgs/
Gordon, as Tyndall proved that CO2 absorbs infrared radiation, and we definitely know that the Earth emits it, why WOULDN’T there be some degree of global warming?
Funny that the actual amount of moisture in the atmosphere has been declining. Could it be that when one influence (CO2) increases, another adjusts to counter the effect?
DA…”we definitely know that the Earth emits it, why WOULDN’T there be some degree of global warming?”
I have acknowledged there must be some warming from CO2, about 0.04% of atmospheric warming in line with its mass percent. That means for every 1C warming, about 0.04C comes from CO2.
The fake energy budget presumes all surface emissions are captured by the 0.04% CO2 and the 1% on average WV content near the surface. That’s ridiculous. GHGs capture no more than 5% of surface radiation.
Take it down to an atom-to-atom basis. The atmosphere is a fraction of the density of the surface yet every atom on the surface is radiating IR. The entire atmosphere could only capture a fraction of the surface radiation if all air molecules could capture surface IR. As it stands, only about 1% near the surface of gases are IR-active so how much of the surface radiation can they capture?
Then there’s the issue of direct conduction to the 99% of the atmosphere that is nitrogen and oxygen. The energy budget fiction has reduced that effect to a small percent and given no reason for the fiction.
Radiation is a poor heat transfer mechanism at terrestrial temperatures due to the inverse square law. According to an expert on CO2 radiation, R.W. Wood, it is far more likely that heat is transferred from the surface directly by nitrogen and oxygen where the heat is retained temporarily due to air being a poor conductor and emitter of heat.
There’s your GHE right there. The atmosphere scavenges heat from the surface and stores it for a while. The oceans enable the storage by storing heat themselves. CO2 is not required, nor water vapour.
Clouds are another matter, they are modeled as lakes of water. Clouds could be compared to the oceans with their ability to store heat in water. I would venture that the water in clouds can be heated by incoming solar radiation, even though they reflect solar as well. Black or grey clouds like soak solar up like a sponge.
Gordon Robertson says:
“I have acknowledged there must be some warming from CO2, about 0.04% of atmospheric warming in line with its mass percent. That means for every 1C warming, about 0.04C comes from CO2.”
Gordon continues to assert that electromagnetic waves dont exist.
Gordon, do you know about the light waves we see from the Sun?
Dan Paulson says:
Funny that the actual amount of moisture in the atmosphere has been declining.
What’s your evidence supporting this claim?
Because the evidence I know of says the moisture content of the atmosphere is increasing, such as
IPCC 5AR WG1 Ch2 Figs 2.30 & 2.31 documents positive trends in water vapor in multiple datasets.
http://www.ipcc.ch/pdf/assessment-report/ar5/wg1/WG1AR5_Chapter02_FINAL.pdf
“Attribution of observed surface humidity changes to human influence,”
Katharine M. Willett et al, Nature Vol 449| 11 October 2007| doi:10.1038/nature06207.
http://www.nature.com/nature/journal/v449/n7163/abs/nature06207.html
“Identification of human-induced changes in atmospheric moisture content,” B. D. Santer et al, PNAS 2013.
http://www.pnas.org/content/104/39/15248.abstract
“This has been observed.”
LIAR.
Harries was eventually retracted
Feldman made not relation to the El Nino over the 10 years of his study of warmer air radiating more.
Philipona is based on climate models .. not evidence
None of the other papers show any relationship to warming. All they show is that CO2 absorbs in a very thin weak band. Proof of the thermalisation to the atmosphere is given by the fact that total OLWR is proportional to atmospheric temperature.
You have NOTHING, little appell.
If there were a change in total outgoing energy, then the CERES data would start to divert from UAH atmospheric data as CO2 increases.
It doesn’t.
https://i.postimg.cc/QdXnDknT/CERESvUAH.png
spike55,
How much is the CERES OLR trend expected by AGW to depart from the LT trend?
Can you tell if that predicted departure is outside the error bar on it, which is quite large.
If you replace UAH with RSS in the plot, is there then a departure in trends? I think so.
Spike55,
Also if you get data closer to the present, more of a ‘departure’ in the trends is seen.
https://okulaer.files.wordpress.com/2018/11/olr-vs-tlt.png?w=352&h=200
Observed but not mwasured.
RE:DA
***Gordon, as Tyndall proved that CO2 absorbs infrared radiation, and we definitely know that the Earth emits it, why WOULDNT there be some degree of global warming?***
Here is why:
1. David Archibald shows how the effect of increasing CO2 decreases logarithmically as CO2 increases in the following:
http://wattsupwiththat.com/2013/05/08/the-effectiveness-of-co2-as-a-greenhouse-gas-becomes-ever-more-marginal-with-greater-concentration/
There is also another article on the Logarithmic heating effect of CO2:
http://wattsupwiththat.com/2010/03/08/the-logarithmic-effect-of-carbon-dioxide/
An important item to note is that the first 20 ppm accounts for over half of the heating effect to the pre-industrial level of 280 ppm, by which time carbon dioxide is tuckered out as a greenhouse gas.
That’s right, CO2 impact is logarithmic.
Emissions have grown exponentially. The thick black line shows the result:
http://tinyurl.com/y4z7sqkz
It affects water out through evaporation, particularly in arid conditions.
Hello Gordon,
I have come observe that your comments, over several web sites, have the hallmarks of a scientific set mind.
Regarding lake Ontario levels check out Toronto Star/Nat post explaining the mega $$$ consequences of increased out flows.wrence.
Regards,
D.J MacCrimmon
Associate Clinical Professor (retired)
MC Master University
Gordon, You should visit Niagra Falls someday. It’s one of the keepers of the Lake Erie vs. Lake Ontario levels.
Wasn’t it just a few years ago there was still ice on Superior into July?
Here’s what that looks like in Sister Bay, WI
https://i.postimg.cc/L6sd0pGT/image.png
I’m convinced it has something to do with H20 levels in the atmosphere. That H20 concentration is due to jet stream. Jet stream is steered by solar magnetic field.
ken…”Im convinced it has something to do with H20 levels in the atmosphere. That H20 concentration is due to jet stream. Jet stream is steered by solar magnetic field”.
I think ren might agree since he seems to feel the jet stream is the driving force behind warming/cooling, which should affect precipitation.
Are you there, ren?
I think ren might agree since he seems to feel the jet stream is the driving force behind warming/cooling
By what physical mechanism?
DA…”By what physical mechanism?”
https://www.livescience.com/27825-jet-stream.html
Do I have to answer all your questions?
Yes, you do have to answer all of them. That’s what science is about.
If you can’t, it means your idea(s) is(are) crap.
“If you cant, it means your idea(s) is(are) crap.”
Hence, DA’s ideas, by his own description.. are CRAP.
The jet stream is more an effect than a cause. It follows wherever air masses of differing temperature take it.
Roy…”The jet stream is more an effect than a cause. It follows wherever air masses of differing temperature take it”.
Thanks, Roy, makes sense. I don’t know anything about the jet stream other than what ren has posted and what I read in the article at the link I posted.
GR, this obsequious reply to Roy directly contradicts what you wrote just below:
http://www.drroyspencer.com/2019/06/contrary-to-global-warming-predictions-great-lakes-water-levels-now-at-record-highs/#comment-360250
Nothing in Gordon’s article says how changes in the jet stream would cause warming or cooling.
DA…”Nothing in Gordons article says how changes in the jet stream would cause warming or cooling.”
I should have stated my post better. I was not referring to warming/cooling over the past century referred to as global warming. I was referring to the distribution of heat throughout the planet which could be affected by the movement of the air massed to which Roy referred.
According to ren’s posts, the jet stream has been all over the place recently suggesting the air masses are playing a part in seasonal warming/cooling.
How do changes in the jet stream cause a net increase in the global heat in the troposphere and ocean?
“cause a net increase in the global heat in the troposphere and ocean”
What increase?
Atmosphere is cooling after the big El Nino transient.
spike said…”Atmosphere is cooling after the big El Nino transient.”
Typical. What’s also typical, at least since WWII, is that the global mean temperature keeps increasing despite ENSO variations.
http://berkeleyearth.lbl.gov/auto/Global/Land_and_Ocean_complete.txt
Roy, the Great Lakes are an easy target. Want to comment on the declines in Lakes Powell and (especially) Lead Mead, where water supplies are declining long-term and much more crucial?
DA…”Want to comment on the declines in Lakes Powell and (especially) Lead Mead”
You don’t need Roy for this, use your head. There is a drought and there is more water leaving the lakes than there are going in.
California with its multitude of swimming pools, car washes, and so on, is among the biggest culprits draining the lakes.
There is no proof that the drought is related to anthropogenic warming. Only eco-weenies push that propaganda.
According to this article, the low level is nothing new. Back in 1956 the lake was as low and they did not have the water guzzling states like California.
Lake Mead is not a natural lake, it is a reservoir. Made to catch water, like a rain barrel. By the building of the Hoober Dam.
When it don’t rain, the level in the rain barrel goes down.
When it does rain, the level in the rain barrel goes up.
There is a ton of information about it on the internet. Lots of articles. Lots of information.
https://www.google.com/maps/place/Lake+Mead/@35.9948198,-114.7525425,1000a,35y,34.42h,71.96t/data=!3m1!1e3!4m5!3m4!1s0x80c95286ddd43a6f:0xb514b9cb7a1cb0ca!8m2!3d36.1435231!4d-114.4144415
Alistair…”Lake Mead is not a natural lake, it is a reservoir. Made to catch water, like a rain barrel. By the building of the Hoober Dam”.
Thanks for info Alistair. We have the same issue in one area of Vancouver, Canada area where we use a dammed lake where the levels are controlled by a local utility. They often underestimate the precipitation levels allowing the dam level to get far too low.
Even though we are in a rain-forest, we are often left short of water in summer due to bad forecasts.
Bad forecasts? Never from over consumption?
DA, I’m a little surprised you asked such a question.
Roy, global warming always makes droughts worse, by increasing the atmosphere’s saturation pressure and increasing evaporation rates.
WRONG !!
Worst droughts were during the LIA.
Roy, declining snowpacks play a role too.
Gordon, CA, NM and AZ are all working hard on water conservation.
DA…”Roy, declining snowpacks play a role too”.
Local precipitation patterns don’t have to be related to global warming. This could be a phenomenon of local weather.
When polar expert Duncan Wingham, who is an AGW advocate, was asked if shrinking glaciers in Antarctica were a sign of global warming he claimed they were not. He claimed its far too cold in Antarctica for glaciers to melt and that the loss of ice mass was due to a lack of precipitation at higher elevations.
Glaciers need to be fed snow at higher elevations. Without the snow, the glacier loses mass.
The Colorado River that feeds Lake Mead starts in the Colorado Rockies near Denver. It won’t be the first time Colorado has experienced droughts and Colorado is essentially a dry state. It’s not like the Rockies several hundred miles north in Canada.
Water conservation is critical when planning was based upon rosy data and population is ever increasing demand for a limited resource.
Here’s the real data for Lake Powell water inflow (upstream from Mead) — the ONLY part relevant to a AGW discussion.
http://graphs.water-data.com/lakepowell/
This data is completely random within its bounds and shows no trend. “Wet” or “Dry” years do not corelate to overall global temperature — the recent wettest years being global temperature “highs” and the past wettest years being temperature “lows”.
As stated in my post below, Super Droughts unlike anything in recorded history are NORMAL for that area with or without AGW.
In 2000 Lake Mead’s elevation was about 1215 ft above sea level. It’s currently about 1080 ft — a decline of 15 Maf, or almost 60%.
https://www.usbr.gov/lc/region/g4000/hourly/mead-elv.html
http://www.usbr.gov/lc/region/g2000/2009MeadLIDARsurvey.pdf
“declining snowpacks play a role too.”
Snowfall have been increasing in the NH.
This year is particular high.
I’ll comment on that having spent at least a week at Lake Powell for the last 45 years and having more than a passing interest in its use.
Lakes Mead and Powell are part of the Colorado River Watershed. The levels of these reservoirs (mis-named lakes) are dependent upon two factors: the highly variable snowpack in desert mountain west of the US and increasing demand from users — the largest of which is Southern California Agriculture. Others are municipalities like Las Vegas for water and power.
Let’s start with the demand side of the equation. In the last 50 years the demand for the same water supply has exploded. The population in the desert southwest is 5x its 1970 level.
Moreover, California agricultural draw has increased dramatically due to both expansion, in my view, poor crop decisions (almonds being the most obvious example).
On the supply side, there are studies suggesting we settled the desert southwest during the wettest 100 years in the last 2000. Drier weather than what we call “normal” based on recorded data, is in fact, the more likely normal condition.
Super droughts, much more severe than anything witnessed in recorded history, are evidenced in the recent past. Concluding the geographically MINOR droughts in recorded history are the result of AGW is alarmism at its most ignorant.
Global warming modeling for the area fortunately indicates an increase in overall precipitation as storms should be laden with more evaporation coming in from the pacific ocean. More lake effect snow in Utah from the Great Salt Lake and Utah lakes should also increase high elevation snow pack.
Overall snowpack may decline modestly as low elevation losses outstrip high elevation gains. But the only local models I’ve seen, and I’ve seen MANY, show increased precipitation expectations for the Colorado watershed region.
For you snow skiers, the snowpack is NOT in jeopardy at 7000+ feet from Global Warming. If anything, high elevation snowpack should increase.
Bottom line: the level of these reservoirs is affected by far more dominant variables than AGW at this point.
This has been a happy year for the area. I believe most the Colorado Watershed was 125-150% of normal. But since that doesn’t fit the current narrative, I return you to your debate of other topics.
GW always makes droughts worse, because it increases evaporation rates and the saturation pressure of air.
WRONG.
Worst drought were during the LIA.
Changes in precipitation cause drought.
Colder air hold less water to precipitate.
Is there data for this claim, spike?
Also, changes in drought and rainfall are different depending on location. As a general rule, more arid regions get drier as the climate warms, and wetter regions get wetter. But that’s a very generalized rule.
Well, there’s a new one now: “Climate apartheid”
As they say, you just can’t make this stuff up.
https://www.fredericksburg.com/news/national/govt-and-politics/climate-apartheid-to-push-million-into-poverty-by-un-warns/article_fbd3c751-6403-5c54-948f-96c9f1d43572.html
tpkeller…”Well, theres a new one now: Climate apartheid”
The UN is about the most stupid, useless organization humans have ever created.
There are more lakes than just those in Northern America. Look at the trends for these before you generalise.
Here are the levels in my neck of the woods: Rivers and Lakes. As you can see they are all approaching flood level.
Warmunists will still blame this on climate change. It’s convenient to do so.
http://www.mysuwanneeriver.org/realtime/river-levels.php
Now here’s a thing.
Somehow all that water has to get into the atmosphere for it to fall as rain. More rain = more water in atmosphere.
Can you tell me if it is carried aloft by humidity pixies in silver buckets, or is it perhaps that it evaporates off oceans. More evaporation is caused by more heat not more cold.
stavro…”Can you tell me if it is carried aloft by humidity pixies in silver buckets, or is it perhaps that it evaporates off oceans. More evaporation is caused by more heat not more cold.”
It’s a bit of a double-edged sword. We are not just talking about water getting aloft we’re talking about how the heat gets into the atmosphere.
Obviously heat can get into the atmosphere due to conduction from the surface, which includes lakes, rivers, and oceans. The claim of the AGW theory is that the atmosphere has warmed due to GHGs but they are ignoring the effect of re-warming from the Little Ice Age.
I was watching a show on TV the other night in which they were pushing the theory that Greenland is losing ice due to anthropogenic warming. The expert claimed that glaciers began losing mass around 1900.
Well, du-u-u-h!!! The Little Ice Age ended circa 1850 and with global temps 1C to 2C lower, those same glaciers expanded immensely over the previous 400 years prior to 1850. The Mer de Glace near Chamonix, France expanded significantly as revealed in this article about the Mer de Glace and the Little Ice Age.
sorry…forgot the link
https://www.unige.ch/forel/files/1514/1691/5961/Chamonix_Eng0.pdf
The claim of the AGW theory is that the atmosphere has warmed due to GHGs but they are ignoring the effect of re-warming from the Little Ice Age.
What caused this “re-warming?”
DA…”What caused this re-warming?”
The opposite of what caused the cooling over 400 years. Some think the solar activity was to blame since there were major sunspot minima during that era. Others point to aerosols from vulcanism although its hard to imagine volcanic aerosols persisting for 400 years.
Gordon, do you (as ever) have any proof of your claims?
stavro,
I read somewhere that ice cover has diminished long-term over the lakes, which means there is more surface area for evaporation to occur. Just one factor among many.
I’m glad Roy brought this up. I’m 1 hour west of Detroit. The great lake surface levels are not all the same elevation. Huron and Michigan are the only ones connected together like that. Others are connected by rivers so there is elevation change there.
Erie, Ontario, St. Clair are at all time historic highs. Huron, Michigan, and Superior are at all time highs for the month of June, but are still slightly under the all time high. This has been very hard on family. I have an aunt right on the St Clair river. The water is going over the sea wall when a ship passes by. Many docks are under water.
That said, this IS a cycle. If this was caused by CO2, you would not have alternating high / low water marks. You would only go in 1 direction. I laugh every time I hear somebody try to blame the lake levels on climate change. You have people doing that when the lakes are high and low and yet nobody sees the hypocrisy in that.
So what is causing all the rain? Easy. We had the STRONGEST el nino in 2016 out of the past 40 years. That warmed up the atmosphere and allowed it to be saturated with moisture. Now the air is cooling as we come out of it, and we get rain. Cold air holds less moisture. It really is that simple. You may have seen my post that El Nino has ended. We are below baseline as of today. I expect this will decrease the rain fall we have been seeing to provide some relief to our area. My forecast is we will go into la nina like we always do on a delay after we enter an 11 year minimum. This will eventually push us into cold / dry conditions. I believe we will head down to -0.2 deg c global temperature soon.
Scott R said:
You have people doing that when the lakes are high and low and yet nobody sees the hypocrisy in that.
And in the ’70s it was “Global Cooling”
“The Myth of the 1970s Global Cooling Scientific Consensus,” W. Peterson et al, Bull. Amer. Meteor. Soc., 89, 13251337, 2008
http://journals.ametsoc.org/doi/abs/10.1175/2008BAMS2370.1
Keep trying to avoid reality, DA.
There are many of us that lived through the 1970s. The “cooling scare” was prevalent.
“The cooling scare was prevalent.”
Prove it.
Besides that eminent scientist’s Leonard Nimoy’s TV episode.
David Appell
Climate change DENIER… extraordinaire !!
https://i.postimg.cc/d0Md9Tts/Arctic-1922.gif
https://i.postimg.cc/TYqK4dQw/Arctic-1976.gif
https://i.postimg.cc/5tFbRXhN/Brown_Uni_to_Nixon_1.png
https://i.postimg.cc/QtQsjRN2/Brown_Uni_to_Nixon_2.png
https://i.postimg.cc/brJF6t8n/cooling-9.png
https://i.postimg.cc/8zWXnD8Z/cooling-8.png
https://i.postimg.cc/QtN6tTFz/cooling-7.gif
https://i.postimg.cc/7YJKfDLq/cooling-6.png
https://i.postimg.cc/cLNPW6Bp/cooling-5.png
The media took some scientists talking about global cooling and had a field day. But that was the press. And the disconnect between the news media and the scientific literature was quite large on that matter.
http://journals.ametsoc.org/doi/abs/10.1175/2008BAMS2370.1
Is news sensationalised? Yep. Learned that in life 101.
Should you go to the media for what the science community thinks?
Only if you’re a fool.
DA, You can post that and I can post article that describes the myth of the global warming consensus (authored by our host) So What? We didn’t speak in 1975 in terms of consensus when describing science. We shouldn’t today either.
You know that there were actual TV documentaries and Time magazine headlines describing and invoking fear about the coming Ice age. You will at least admit that, correct?
Swampgator says:
We didnt speak in 1975 in terms of consensus when describing science. We shouldnt today either.
Scientists in other fields don’t need to speak of consensus — everyone knows it’s there, and they aren’t pestered by hordes of deniers.
Poor DA, your desperation at the knowledge of the coming cooling period, probably deeper than the 1940-1970s new ice age scare, is quite funny
You KNOW you are going to end up looking like a total ass, don’t you. 🙂
“everyone knows its there”
And yet it only exists in fanciful, anti-validated models.
Like the bogey-man under the bed. Pure imagination.
JD and swapgator, I think what differentiates you guys from DA and I so that we get our information from scientists while you get it from the media. And yes, we know there were TV documentaries, Time magazine articles, and the like. Did you know almost all of these were regurgitations of ideas from the same two or three people. Read the link DA posted above. The scientific consensus never though global cooling was going to happen. And although global warming predictions had been occurring since the 1890’s it was actually during the 70’s when broad based support finally overcame the skepticism.
No bdgwx, what differentiates us is your avoidance of reality. You try to fake a knowledge of physics, but when I have corrected you, you leave. That’s why I determined the first 3 letters of your code name stand for “backdoor guy”. You always leave by the backdoor when your nonsense is exposed.
DA’s physics is just as bad, but at least he uses his real name.
Disproving the science I cite would be a place to start for you.
bdg…”JD and swapgator, I think what differentiates you guys from DA and I so that we get our information from scientists while you get it from the media.”
There’s some humour. All the links posted by DA come from known uber-alarmists who have a vested interest in AGW being right.
For his blog, DA interviewed Kevin Trenberth, an uber-alarmist, but he has declined to interview Roy or John Christy of UAH, or any other skeptic.
Remember Trenberth? In private, via emails, he admitted to his alarmist cronies that global warming had stopped. After the emails were hacked and released he back-tracked, claiming the warming signal was being hidden and they lacked the instrumentation to find it.
Later still, he dreamed up a cockamamey theory that the ‘missing’ heat was being hidden in the oceans.
Gordon:
Simple question: when did I interview Kevin Trenberth?
When has Roy ever replied to an email from me?
GR wrote:
Remember Trenberth? In private, via emails, he admitted to his alarmist cronies that global warming had stopped
This is a fuc%ing lie. And Gordon can’t prove it isn’t.
Disproving the science I cite
You didn’t post any “science”, DA.
You posted a deceitful lying propaganda junk diatribe from the Wiki scam artist Connelly.
Your idea of what “science” is, is woefully lacking.
David Appell says:
June 28, 2019 at 10:27 AM
The Myth of the 1970s Global Cooling Scientific Consensus, W. Peterson et al, Bull. Amer. Meteor. Soc., 89, 13251337, 2008
http://journals.ametsoc.org/doi/abs/10.1175/2008BAMS2370.1
It wasn’t a myth nor was it a big deal, but it was in the popular press, reporters in the ’70s didn’t make stuff up out of whole cloth, they had to be getting their information from somewhere.
You and whoever W. Peterson is can claim myth all you want, but it flies in the face of reality.
People have been gleaning “Global Cooling” stuff from the internet and posting lists for some time. Here’s an example:
1970s Global Cooling Alarmism
Besides that, I have a 1944 DOB and I remember the “Global Cooling” scare, it did actually happen.
You and whoever W. Peterson is can claim myth all you want, but it flies in the face of reality.
It’s not me, it’s the authors who did a literature search of the scientific literature of the time. (Read the paper.)
“The survey identified only 7 [scientific] articles indicating cooling compared to 44 indicating warming. Those seven cooling articles garnered just 12% of the citations.”
See the paper’s Figure 1.
“The Myth of the 1970s Global Cooling Scientific Consensus” W. Peterson et al, Bull. Amer. Meteor. Soc., 89, 13251337, 2008
http://journals.ametsoc.org/doi/abs/10.1175/2008BAMS2370.1
Memories aren’t reliable.
By the 1950s plenty of scientists were already warning about warming from GHGs; here’s a partial list:
http://www.davidappell.com/EarlyClimateScience.html
And many of the cited global cooling manuscripts were related to what-if scenarios that even the authors thought were improbable. Others were variations of Reid Bryson’s “human volcano” theory which was overwhelmingly rejected by his peers. And the irony here is that Bryson totally understood the warming effect of GHGs (even testifying to congress as much); he just thought aerosols would have a greater impact.
The point…the media is not a proxy or a substitute for actual scientific research. When you want a good story go to the media. When you want real science go to the journals.
David Appell says:
June 28, 2019 at 10:13 PM
Memories aren’t reliable.
By the 1950s plenty of scientists were already warning about warming from GHGs; here’s a partial list:
http://www.davidappell.com/EarlyClimateScience.html
Most people, you know – voters, don’t read scientific papers, they read what the popular press says about those papers. I provided you a list of articles in the press during the ’70s.
You provided a list from your blog so one blog deserves another here’s a link to the NoTricksZone article on ’70s Cooling and their list of 285 papers on the topic.
But it doesn’t matter, the buzz in the press at the time was “Global Cooling” You can claim whatever you want to the contrary, but it won’t make it so.
“Facts don’t cease to exist because they are ignored.”— Aldous Huxley
How many legs does a dog have if you call his tail a leg? Four. Saying that a tail is a leg doesn’t make it a leg. Abraham Lincoln
“its the authors who did a literature search of the scientific literature of the time”
Were 3 of the most basic liars and con-artists and RABID activistmembers of the AGW cult/hoax. Connelly of wiki infamy being one of them.
Petersen reputation isn’t much better, either.
The whole paper is a cherry-picked load of propaganda pap that would only fool a fool like you.
No reputable skeptics ever said there was a global cooling consensus in the 1970s.
At the time a “consensus” was not considered real science — now a “consensus” is considered to be very important (propaganda) by climate junk science zealots like you, Mr. Apple.
What was most important about the 1970’s “coming ice age loudmouths” is how much attention they got in the mainstream media.
They ruined climate science forever after — now all government bureaucrats with science degrees make scary predictions to get attention and funding.
And real climate science has morphed into science fraud, where there are amazing repeated “adjustments” to historical temperature data, such as gradually changing the numbers so the the 1940 to 1975 global cooling “goes away”.
I wrote an article about that leftist lying, and published it today:
https://elonionbloggle.blogspot.com/2019/06/in-1980-1940s-to-1970s-had-global.html
Richard Greene says:
June 29, 2019 at 3:00 PM
Nice post and link. Thanks for posting (-:
R Greene, Your references don’t disprove the impacts of global aerosol emissions. After the Clean Air Act in the US and similar actions in other developed nations, the so-called “human volcano” was reduced. In more recent times, the rapid increase in coal burning by developing nations, particularly China and India, may have offset the warming from the additions of Greenhouse gasses. If so, we may see a return to stronger warming, as the people of China and India demand cleaner air.
Scott R,
From that Nat Geo article:
“Experts blame the recent low water on the unusually warm and dry weather over the past year.”
https://blog.nationalgeographic.org/2012/11/20/warming-lakes-climate-change-and-variability-drive-low-water-levels-on-the-great-lakes/
“We had the STRONGEST el nino in 2016 out of the past 40 years.”
Why?
“Why?”
Well it certainly wasn’t anything to do with human released CO2, now was it. Not even you are dumb enough to cling to that fantasy.
A lot of solar energy circulation in the oceans from the series strong solar maxima in the latter half of last century.
Cooling cycle beginning soon, DA..
don’t be too embarrassed, just skulk back into your troll-hole.
Climate scientists say there is a high probability that there will be a problem with AGW in the next decade or two.
Politicians say there is no problem now or in the future.
Who do you believe?? And why
Straw man argument. I can give you a list of literally thousands of politicians that say climate change is killing us as I type this.
I’d like to see that list.
For starters David, every democrat in the US House and most of them in the Senate. That’s 250 right there. Then let’s say a third of the state reps would be on board with CAGW theory. That’s 2000+. So j=with just a US view I’ve already given you 2250+ backing up my claim.
I don’t have time to actually compile the list by name, but you already know this is true David. AOC, Nancy Pelosi, Bernie Sanders, EVERY democrat running for President right now. Then we could go to Europe where the green party in Germany has about 67 seats today. The greens party in state and EU chambers is another 600 or so. We are already up to 3000+ and haven’t even hit Australia.
Why do you waste time denying basic stuff like this? Deniers like you are sad. 🙂
“or starters David, every democrat in the US House and most of them in the Senate. That’s 250 right there. ”
All of them are saying it is killing us as you type this??
DEMS are all just carbon copies of AOC? Then I wonder why her Green New Deal Bill didnt pass the House? I dont think it even got a vote.
Sheesh, no wonder the country is so polarized.
“Climate scientists say there is a high probability that there will be a problem with AGW in the next decade or two.”
REAL scientists say there is a high probability that there will be a problem with COOLING in the next decade or two.
Seeing as there is no actual proof of human-caused “global” warming, I think we can all be pretty sure that the current hullaballoo in the media, with ridiculous terms like “climate emergency”, “climate extremes” and whatever other grandiose wording they feel that have to use, is because they expected to have their socialist totalitarian control agenda in place well before the predicted cooling trend of the AMO, solar downturn etc kicked in.
Anyone can see there is no real climate emergency.
Their UTTER DESPERATION is palpable, and getting to the highly bizarre stage. !
On a question of physics, should I believe scientists or politicians?
Wait: is this a trick question?
Did you know that it is a mark of having attained a degree knowledge to recognize that what is unknown is just that ; unknown. So do you know exactly what causes cycles in a liquid water non linear chaotic open thermodynamic system that sits below a gaseous non linear chaotic open thermodynamic system?
Never said I knew what caused some cycles. But said I doubted that that was knowable…. See the difference?
GC…”Did you know that it is a mark of having attained a degree knowledge to recognize that what is unknown is just that ; unknown. So do you know exactly what causes cycles in a liquid water non linear chaotic open thermodynamic system that sits below a gaseous non linear chaotic open thermodynamic system?”
Have no idea but geophysicist Syun Akasofu wrote a good book on the solar wind in which he pointed out related matters of interest.
He claimed that when the solar plasma, aka solar wind, made up of raw electrons and protons, is intercepted by Earth’s magnetic field, it produces a high electrical potential. That EMF drives electrical currents through the atmosphere, the surface, and the oceans.
I can visualize those electrical disturbances producing effects wherever they flow.
Gordon Robertson says:
He claimed that when the solar plasma, aka solar wind, made up of raw electrons and protons, is intercepted by Earths magnetic field, it produces a high electrical potential. That EMF drives electrical currents through the atmosphere, the surface, and the oceans.
Gordon, what were the net and regional charges in the atmosphere, on the surface and the oceans that interact with this “high electrical potential?”
And what is the magnitude of this “high electrical potential? (in SI units)?
What are the regional charges, in Coulombs?
Cite your data sources (of course).
DA…”Gordon, what were the net and regional charges in the atmosphere, on the surface and the oceans that interact with this high electrical potential?
And what is the magnitude of this high electrical potential? (in SI units)?
What are the regional charges, in Coulombs?”
*******
Who uses Coulombs? What’s wrong with amps?
Why don’t you read the book?
Here’s a paper by Akasofu explaining the electrical current:
there’s a link to download as a pdf…
https://www.researchgate.net/publication/319218653_The_electric_current_approach_in_the_solar-terrestrial_relationship
Here’s another article in which Akasofu explain the natural warming since 1800 – 1850 due to re-warming from the Little Ice Age.
https://www.researchgate.net/publication/273546039_On_the_Present_Halting_of_Global_Warming
Here’s an entire page of links to articles by Akasofu on the solar wind and natural global warming.
https://www.researchgate.net/scientific-contributions/2034377638_Syun-Ichi_Akasofu
A link to a medal awarded to Akasofu for outstanding scientific research in solar-terrestrial physics. Since Akasofu is a geophysicist, who deals with the atmosphere, that qualifies him as a climate scientist who thinks global warming is natural.
https://www.egu.eu/awards-medals/hannes-alfven/2011/syun-ichi-akasofu/
@ DA
what causes the cycle(s)?
Did you know that it is a mark of having attained a degree of knowledge to recognize that what is unknown is just that ; unknown. So do you know exactly what causes cycles in a liquid water non linear chaotic open thermodynamic system that sits below a gaseous non linear chaotic open thermodynamic system?
GC,
DA actually knows very little, by all appearances. He asks interminable pointless gotchas, hoping people even more stupid and ignorant than himself will think him wise and knowledgable.
It seems to work from time to time, which shows there is at least one born every minute.
Maybe he has assumed someone else’s identity, maybe not. If not, he appears to have forgotten how to spell his name for a while, or enrolled at a university which incorrectly recorded his name, and awarded a degree to someone named David Appel (close but not identical to David Appell).
I certainly don’t know, of course. In any case David Appell might suffer from OCD or delusional psychosis, although delusional psychotics are often high achievers, which does not appear to apply to David Appell.
Who knows? No doubt the universe is unfolding as it should.
Cheers.
GC: “We don’t know” is not a scientific answer.
“We will never know” even less so.
DA, you’re no scientist. You’re anti-science. So quit trying to fake it.
You only fools the fools.
So start proving me wrong.
“So start proving me wrong.”
You prove it with your every comment DA..
You are too thick to realise it.
Well, well, well, Mr.Apple is back.
Put on your tall boots.
The GC comment makes no sense to me, but Mr. Apple’s reply is proof that he is in the first grade of science, and will probably be left back for a year, or two.
Unknown to Mr. Apple, the MOST IMPORTANT scientific answer is “We don’t know” .
That’s why scientists exist — there are many things we don’t know, and things we think we know, that are wrong.
Science is never settled, except in the smarmy imaginations of leftists, who declare that 4.5 billion years of natural climate change suddenly became unimportant “noise” during the 20th century, and man made CO2 took over as the “climate controller”.
When asked how that happened, and why, the leftist “scientists” (climate astrologers) — all government bureaucrats — declare BECAUSE WE ARE BIG SHOT GOVERNMENT SCIENTISTS, AND WE SAY SO !
Of course man made CO2 had a shaky start — it was allegedly overwhelmed by atmospheric aerosols from 1940 to 1975 — they “controlled the climate” for those 35 years of global cooling.
And then a miracle allegedly happened, all the aerosols (pollution) allegedly fell out of the air in 1976, and CO2 finally took over as “climate controller”.
Of course all the aerosols did NOT fall out of the sky in 1976 … or 1986 … or 2006, but leftists climate change fairy tales don’t have to match reality.
.
.
.
The science fraud supporting the “climate change religion” is based on false claims of knowing exactly what CO2 does in the atmosphere, and therefore knowing what the future climate will be.
The correct answers, that Mr. Apple would not recognize if they fell on his foot attached to a 10 pound dumbbell are: “We don’t know”.
Exact effect of CO2 in the atmosphere = We don’t know.
All the warming since 1975 could have had natural causes, or all could have been caused by CO2, or some combination of causes, one or more of which may not even be known at this time.
The IPCC claim that “over 50%’ of the warming after 1950 is man made, is science fraud — that’s just a wild guess with no compelling proof, other than saying it must be between 0% and 100%, so over 50% seems like a good guess.
Sometimes the smartest man, or woman, in the room, has to say “We don’t know”, to correctly answer a scientific question.
That’s something you could not do if someone paid you, Mr. Apple — the self appointed know it all of leftist climate astrology … who thinks if a pal-reviewed study says something that he wants to hear, that automatically creates truth.
richard…”The IPCC claim that over 50% of the warming after 1950 is man made…”
The statistics applied by the IPCC, uniquely their own brand, has baffled more than one scientist. When they claimed it was 90% likely humans are causing global warming, even the reviewers writing the main report did not agree. The 90% figure came from 50 politically appointed lead authors who write the Summary for Policymakers then use the Summary to re-write the main report.
That comes from Richard Lindzen who was involved with that review in some capacity.
Gordon Robertson says:
The statistics applied by the IPCC, uniquely their own brand, has baffled more than one scientist. When they claimed it was 90% likely humans are causing global warming, even the reviewers writing the main report did not agree.
Prove this, Gordon, or it didn’t happen.
Links are necessary, of course.
From someone who was there, DA
DENIAL seems to be all you have left..
Poor rotten appell.
Nothing but a shrivelled-up core.
Here is what the IPCC says specifically…
“It is extremely likely that more than half of the observed increase in global average surface temperature from 1951 to 2010 was caused by the anthropogenic increase in GHG concentrations and other anthropogenic forcings together. The best estimate of the human-induced contribution to warming is similar to the observed warming over this period”
…and to summarize.
There is >95% confidence that at least 50% of the warming since 1950 can be assigned to anthroprogenic cause with the best guess being closer to 100%.
https://ar5-syr.ipcc.ch/topic_summary.php
bdg, there is >99% confidence that no more than 1% of the warming since 1950 can be assigned to anthroprogenic cause with the best guess being closer to 0%.
Learn some physics.
If confidence is truly that high for what you claim then it should be really easy to present a mountain of evidence that lists the natural processes that explain 99% of the warming in the lithosphere, hydrosphere, cyrosphere, and troposhere while also explaining the cooling of the stratosphere, the decrease in the diurnal temperature range, the homogenization of latitudinal temperatures, the homogenization of seasonal temperatures, etc. Since the IPCC cited some 30,000 lines of evidence reviewed by nearly 5,000 experts I guessing you can present an equivalent publication that refutes that?
Sorry bdg, but all your “papers” should be burned, so that the released CO2 can be of some use to the trees. (Except, keep samples for future generations. They won’t believe people fell for such crap, otherwise.)
Understanding Earth’s energy balance involves a knowledge of the relevant physics, which no GHE advocate posesses.
If you want evidence of the “natural processes”, just go outside. Or are you afraid of reality?
I agree that higher concentrations of CO2 would benefit trees seeing as most use C3 carbon fixation. C4 plants like corn might not benefit a whole lot.
So if I went outside looking for evidence that explains the warming hydrosphere, cryosphere, troposphere and the cooling stratosphere what should I look for exactly?
bdg, if you are looking for evidence, you must open your eyes.
Science is about reality. You have learned pseudoscience, which perverts reality. Truth is right front of your face, but you reject it.
Ken Shaw asked James Dann about “Plan 2014.” A plan implemented by the St Lawrence Board to reduce outflows from Lake Ontario through the St Lawrence River at the Moses-Saunders hydro-electric dam, at Cornwall, Ontario. James Dann avoided answering. Hmm?
https://twitter.com/NecktopP/status/1141527763574243333
https://toronto.ctvnews.ca/city-trying-to-clear-pond-of-water-from-woodbine-beach-shoreline-by-canada-day-1.4473337#_gus&_gucid=&_gup=twitter&_gsc=EQtz07G
The 1958DD plan was scrapped by the IJC and replaced by Plan 2014. PLAN 2014 allows for Lake Ontario to have more than a metre more water in it, than the previous plan.
https://globalnews.ca/news/5361511/brighton-water-levels-lake-ontario/
St Lawrence Board reduced outflows from Lake Ontario in accordance with Plan 2014. Flood hydrographs for the years 2006, 2011 and 2012 showed that the flows were perfectly controlled in the Ottawa River system in the past.
https://www.mcgill.ca/h2oinnovation/files/h2oinnovation/2017floods_analysis.pdf
https://twitter.com/NecktopP/status/1136403607312617472
The US needs the Great Lakes to be filled so we can pipe some of it down to the ever growing US southwest, right….
Climate Weirding!!!
Love it. The Leftists Scientific community has swerved into the best description yet of their cult. They are a bunch of weirdos for sure.
It’s hard lesson that predictions will always be less than perfect. But in terms of subpar predictions I think the Arctic sea ice predictions from the 1990’s and 2000’s have proven to be even worse.
Stroeve, J. et al, (2007), “Arctic sea ice
decline: Faster than forecast,” Geophys. Res. Lett., 34, L09501,
doi: 10.1029/2007GL029703, 2007
And check out the section on Arctic sea ice in IPCC AR3 from 2001. They predicted the first occurrence of an annual extent of 10.5 km^2 wouldn’t occur until 2040 at the earliest. It actually occurred in 2007 a mere 6 years later.
Or how about the predictions from the 90’s that were suggesting the first ice free Arctic sea ice year wouldn’t occur until after 2100. It’ll be a miracle if it doesn’t happen prior to 2050.
My point…predictions aren’t perfect and the imperfections are a double edge sword with skeptics totally ignoring the other edge which happens to cut deeper than the one they’re focused on. Afterall, the Great Lake water levels have little feedback effect, but Arctic sea ice has a HUGE feedback effect. So why are we focused on the Great Lakes anyway?
OK, I see your point now, sorry.
Yes, uncertainty cuts both ways. You’re right, many people (ahem…) forget this.
Current Arctic sea ice levels are HIGHER than they have been for all but about 500 years of the last 10,000 years.
bdg…”But in terms of subpar predictions I think the Arctic sea ice predictions from the 1990s and 2000s have proven to be even worse”.
Each winter, when the Sun disappears from the Arctic, the Arctic Ocean develops 10 feet of ice from the North Pole to the Canadian north shore. The stats to which you refer apply to a very brief Arctic summer, and at that, we have to take the word of modelers and eco-weenies. No one has ever gone out of the oce and actually measured it.
Sats can’t tell during winter because the ice builds up bazillions of pressure ridges where the ice build vertically to 40 feet or more. Ocean current and wind currents drive the ice all over the place and dump a lot of the melted and broken ice into the warmer Atlantic.
Gordon Robertson says:
Each winter, when the Sun disappears from the Arctic, the Arctic Ocean develops 10 feet of ice from the North Pole to the Canadian north shore. The stats to which you refer apply to a very brief Arctic summer
This is another lie from Gordon.
Arctic SIE is declining for all 12 months of the year.
Gordon won’t cite that, because he doens’t know how to calculate trends.
Download the data and calculate for yourself. Then tell Gordon he is wrong.
Current Arctic sea ice levels are still in the top 5-10% of the last 10,000 years.
The late 1970s was the anomaly, being up there with the extreme levels of the LIA, which was not that long ago, and was the coldest period in 10,000 years.
We are very fortunate for the slight rise in temperature since that coldest of times.
GR said…”The stats to which you refer apply to a very brief Arctic summer,”
An annual mean is a composite of all 12 months in a year. It’s not just the summer minimum.
GR said…”and at that, we have to take the word of modelers and eco-weenies. No one has ever gone out of the oce and actually measured it.”
Yes, sea ice extents are actually measured. Satellites even take visible light images of the ice on a daily basis.
GR said…”Sats cant tell during winter because the ice builds up bazillions of pressure ridges where the ice build vertically to 40 feet or more.”
Well, actually there are ways to measure volume, but what I’m talking is extent which is relatively easy to measure.
GR said…”Ocean current and wind currents drive the ice all over the place and dump a lot of the melted and broken ice into the warmer Atlantic.”
Yep. Such is the case with the Arctic dipole anomaly going on now.
And just to show that I’m not cherry-picking predictions that favor the established consensus I’ll point out that the mid troposphere tropical hotspot is another subpar prediction. But instead of lamenting about how bad these predictions are as a means for undermining the whole field we should instead frame criticism as constructive so that there is a concerted effort to make them better. I think we can all agree that there is opportunity for improvement and that improving the science is better than abandoning it.
bdg, “improving the science” will NOT happen until clowns like you give up your false religion and start embracing reality.
Debating Appell can result in only one possible outcome
https://i.postimg.cc/brsTScRP/think-tank.png
Yes, if you try to debate me.
Bring it on, Eben. Let’s see your science, instead of your insults.
Insults are easy…. (Ask Ger*an)
You have no science, just propaganda pap.
Roy wrote:
The cause (analysis here) was a combination of unusually high precipitation (contrary to global warming theory)
Come on, Roy, you should know better than this.
“Extreme precipitation events over most of the mid-latitude land masses and over wet tropical regions will very likely
become more intense and more frequent by the end of this century, as global mean surface temperature increases (see
Table SPM.1).”
– IPCC 5AR WG1 SPM E.2 “Atmosphere: Water Cycle” pg 23
DA…”will very likely become more intense…”
Anything scientific based on the scientific method?
This comes from the same IPCC who claimed in TAR that it is not possible to predict future climate states.
Anything scientific based on the scientific method?
I cited it.
This comes from the same IPCC who claimed in TAR that it is not possible to predict future climate states.
Cite them in context, for a change.
For once….
“I cited it.”
You cite a political propaganda load of junk science.
Seems you do not know what real science is , or have a clue about the scientific method.
That is probably because you have never really learnt any real science in your whole existence.
Lots of yabber and blustering, but we never seen much else in the way of real science from you.
“will very likely become more intense and more frequent by the end of this century, as global mean surface temperature increases”
That is NOT science…
that is non-evidence, ASSumption-based, agenda-driven crystal ball gazing.
The two hypothesis in this statement are that extreme precipitation events in tropical and mid latitudes will become more intense and more frequent by 2100 and that the global mean temperatures will increase. Both of these are testable. That makes it legit science even if they do end up being falsified.
bdg, a hypothesis is that you are addicted to pseudoscience. Consequently, the prediction is that you will comment many times, spewing nonsense and avoiding reality.
The test is on.
Water levels in lakes.
Meh.
Deny this:
“It has never been so hot in France — at least since humans have kept reliable records. On Friday, many cities near the Mediterranean exceeded 111 degrees Fahrenheit, shattering the former all-time year-round record of 111 degrees set back in 2003.”
“This comes on the heels of all-time June records set in Poland, Czech Republic and Germany, where the thermometer climbed to 101.5 degrees on Wednesday.”
“One of the world’s most famous climate scientists, Dr. James Hansen of Columbia University, told CBS News, “For all practical purposes, the heat wave is caused by human-made global warming.”
https://www.cbsnews.com/news/climate-change-heat-wave-breaks-records-in-france-experts-say-climate-change-to-blame/?ftag=CNM-00-10aab7e&linkId=69689314
mickey…”For all practical purposes, the heat wave is caused by human-made global warming.”…James Hansen
Hansen was arrested with actress Daryl Hannah for illegally protesting the Keystone pipeline. I’d say he was biased.
As head of GISS he tried to replace 1934 with 1998 as the hottest year in the US. Steve McIntyre of climateaudit caught him, forcing him to return 1934 to its rightful status as the hottest year in the US.
Since then, NOAA has fudged the record to make the 1934 data much cooler.
BTW…the 1930s still hold the record for heat waves. No decade since has come anywhere near.
Ha! Hansen got himself arrested, since he thought it was important.
Something few people here, let alone GR, would ever understand.
An “electronics technician” like Gordon, an expert in soldering, doesn’t get a say in Hansen’s science….
GR has inhaled a few too many soldering fumes to be taken seriously, despite his extensive body of acquired scientific knowledge…..
Right Gordon?
Hansen has been basically WRONG with every prediction he has made. (He’s a bit like you, DA, always WRONG)
Temperatures continue to follow his “zero-extra-carbon” trend, while atmospheric CO2 continues its wonderful, and highly beneficial climb out of near-plant-death levels.
Temperatures are tracking between his B & C scenario from his 1988 prediction. The scenario that has played out is somewhere between B & C. It’s not a perfect prediction, but it’s pretty close which is remarkable considering it is now 30 years old using knowledge and technology that are considered primitive today.
It’s not a “perfect prediction” because it is based on pseudoscience.
Quit trying to pervert reality.
GR said…”Since then, NOAA has fudged the record to make the 1934 data much cooler.”
https://science.sciencemag.org/content/348/6242/1469
Pay particular attention to figure 2B.
bdg, that nonsense was put out by a GOV agency. You should find the cost to taxpayers for such trash.
bdg…”Pay particular attention to figure 2B”.
*********
Shall we quickly put this crap article to rest???
From the article…”The ISTI databank integrates the Global Historical Climatology Network (GHCN)–Daily data set (20) with more than 40 other historical data sources, more than doubling the number of stations available. The resulting integration improves spatial coverage over many areas, including the Arctic, where temperatures have increased rapidly in recent decades…”
These clowns are using the fudged NOAA GHCN data along with 40 other historical data sources no one cares about. The 40 sources likely draw from GHCN as does GISS and Had-crut.
Furthermore, the claim that the Arctic temperatures increased rapidly in recent decades is a gross exaggeration of the scientific misconduct kind. You can clearly see in the UAH data, which is light years ahead of the GHCN fudged data, that at most, certain spots in the Arctic have warmed +5C.
No one has pointed out that similar spots in the Antarctic and elsewhere have cooled almost as much. Had they not, the global average would be well above 1C.
Those spots are tiny compared to the entire Arctic and they move around monthly. Roy has already claimed the warming spots are likely related to North Atlantic systems. I figure they are weather related albeit in a persistent manner.
Gordon,
You made a statement, “Since then, NOAA has fudged the record to make the 1934 data much cooler.”
The figure 2b points out that the OPPOSITE was true.
This is not the first time.
You ignore this glaring contradiction. Then you go on to make more hyperbolic statements.
What is the point of making new statements then, if they cannot be believed?
Why dont you get that?
GR,
1. Here is documentation on the International Surface Temperature Initiative (ISTI) and the 40 or so datasets they aggregate. GHCN is but one among many.
https://www.researchgate.net/publication/278123575_The_International_Surface_Temperature_Initiative's_Global_Land_Surface_Databank
2. UAH has a trend of 0.25C/decade for NoPol which is about 2x more than the global mean.
3. UAH has a trend of 0.00C/decade for SoPol. That is not the same thing as “cooled almost as much”.
4. Transient cooling events on a local basis are not inconsistent with the secular increase in the global mean temperature.
Ayuh … its warming … 0.5C per century. Its likely going to keep warming, with phases of warming and cooling, to 2600. The part you’re going to like is its all natural, driven by the sun. That’s according to Zharkova. https://www.nature.com/articles/s41598-019-45584-3
But RSS’s LT trend is 0.20 C/decade.
Extrapolating over a century isn’t justified, since the physics changes over that time (esp as positive feedbacks kick in).
Does Zharkova explain how total solar irradiance has been slowly decreasing since the 1960s
http://spot.colorado.edu/~koppg/TSI/TIM_TSI_Reconstruction.png
while surface & tropospheric temperatures have been increasing?
roflamo.. There you go using the two El Ninos to create a trend. Linear trends on transients and step.. DOHHH !!
Between those El Ninos, nothing, nada, ZIP.
and El ninos are not caused by human released CO2
Gordon Robertson says:
I have acknowledged there must be some warming from CO2, about 0.04% of atmospheric warming in line with its mass percent. That means for every 1C warming, about 0.04C comes from CO2.
Gordon continues to assert that electromagnetic waves don’t exist.
Ever hear of a radio wave, Gordon? Night vision scopes?
Oh dear, David has NO idea how night vision scopes work.
SO funny !
@Spike55: Visible light (and the principles that “amplify” it) certainly reside squarely in the electromagnetic spectrum:
https://en.wikipedia.org/wiki/Night_vision
The CO2 warming theory can and has been debunked
If the CO2 cause the warming they claim it does the temperature today would have to be 1°C higher than it is.
only climate shysters keep arguing about it
https://youtu.be/EvO7bBuTRno?t=482
Cute, very cute…. and where does this purposted “debunking” appear in the peer reviewed literature?
Amature.
Even Roy is not going to buy your naive claims about a Youtube video.
Ask him.
https://bit.ly/305C2Hh
https://www.youtube.com/watch?v=Un9jmeLNBqY
@DA
Does Zharkova explain how total solar irradiance has been slowly increasing since the 1960s while surface & tropospheric temperatures have been increasing?
Global low level cumulus clouds decreased by 4% globally concentrated over tropic latitudes where the decrease was 8% from 1984 to 2001. As of 2009, global cumulus cloud cover was still 50% down on 1984 levels Thats how you get observations of a slowly decreasing TSI at ToA with an increase in surface temperature, ocean heat content and Tropospheric temperature.
No mystery there.
DA, two times, upthread, you deny that you have made mistakes with physics:
“Disproving the science I cite would be a place to start for you.”
“So start proving me wrong.”
All I have to do is go back and find your comments. It will take a couple of hours. So, if I devote the time to show examples of your deficiencies in physics, will you agree to not comment on this blog for one month per deficiency?
Accept my terms, and I’ll start the search.
You can’t lose. Not blogging here for years will allow you time to learn some physics.
Win-win….
Conclusions
This study showed that the disturbances of the troposphere circulation associated with SA/GCR variations
take place over the entire globe. The spatial structure of the observed pressure variations is determined by the
influence of SA/GCR on the main elements of the large-scale atmospheric circulation (the polar vortex, the
planetary frontal zone and extratropical baric systems). The temporal structure of the SA/GCR effects on the
atmosphere circulation at high and middle latitudes is characterized by a ~60 yr periodicity, with the changes
of the correlation sign taking place in 1890-1900, the early 1920s, the 1950s and the early 1980s. The ~60 yr
periodicity is likely to be due to the changes of the epochs of the large-scale atmospheric circulation. A sign
of the SA/GCR effects seems to be related to the evolution of the meridional circulation C form. A
mechanism of the SA/GCR effects on the troposphere circulation may involve changes in the development of
the polar vortex in the stratosphere of high latitudes. Intensification of the polar vortex may contribute to an
increase of temperature contrasts in frontal zones and an intensification of extratropical cyclogenesis.
http://geo.phys.spbu.ru/materials_of_a_conference_2010/STP2010/Veretenenko_Ogurtsov_2010.pdf
Look how Nino 3.4 has been cooling these past days:
https://www.tropicaltidbits.com/analysis/ocean/nino34.png
This decrease may be related to the blocking of the polar vortex in the stratosphere in the south.
https://www.cpc.ncep.noaa.gov/products/intraseasonal/temp30anim.gif
https://climatereanalyzer.org/wx_frames/gfs/ds/gfs_world-ced_sstanom_1-day.png
The trend is long-term. The charts cover a period of several months.
https://www.cpc.ncep.noaa.gov/products/precip/CWlink/pna/nao.mrf.obs.gif
https://www.tropicaltidbits.com/analysis/ocean/eatlssta.png
Currently, no tropical cyclones are observed.
https://www.tropicaltidbits.com/storminfo/
Lets look at the temperature drop at the equator.
https://climatereanalyzer.org/wx_frames/gfs/ds/gfs_world-ced_sstanom_1-day.png
The weather in North America is now dominated by strong convection. Visible stratospheric intrusion on the north-west coast.
https://www.cpc.ncep.noaa.gov/products/stratosphere/strat_int/gif_files/gfs_toz_NA_f000.png
And still, the looney GHE true believers are unable to come up with a description of the deity they slavishly worship.
The reason is simple – trying to describe something that does not exist is extremely difficult. The GHE apparently would need to satisfy some mutually exclusive criteria. It would only work when the sun is shining, but also not work if the sun is shining. Otherwise, four and half billion years of sunlight would result in increased temperatures, and the fact that the surface has cooled shows that proposition to be untrue!
Oh, what a problem! The GHE true believers sidestep science by just declaring the GHE sometimes heats, sometimes cools, and is so mysterious and secret that its results can never be quantified. It seems to be an effect that only works in the future, certainly not in the past.
The GHE is propounded by fakers and frauds like Trenberth (with his stupid “energy budget”, Gavin Schmidt (not even a scientist of any sort), and Michael Mann (fraudulently claiming to be a Nobel Prize winner).
Followers of this pack of bumbling buffoons include the likes of David Appell, and similarly mentally defective types including many politicians and “journalists”.
No GHE. Not even a description of such a thing! No theory, no measurement, no experimental support. Hardly surprising.
Cheers.
Mike, another great line: “It [GHE] seems to be an effect that only works in the future, certainly not in the past.”
Appel has a psychological disorder the absence of self judgment and self embarrassment, In normal healthy people embarrassment serves as a self check – stop break from doing really stupid things , he doesn’t have it.
That’s why he behaves like a total creep and you can’t get rid of him no matter how you tell him.
You throw him out the door he comes back through the window , you throw him out the window he crawls back through the chimney.
This is not a personal attack , this is a medical diagnosis.
Eben
You have it exactly backwards.
David Appell is a writer. This is his beta test site for ideas and information.
He debates and tests stuff here to see how you weirdos react, then uses the responses to hone it for publication.
Hi Em
Before you race off and support David Appell have a look at you tube Climate Wars when he debates a part time meteorologist. As he starts to lose the debate he completely loose it
David Appell is one weird dude
Regards
Harry
Harry Cummings
As JDHuffman points out, it is easy to make comments, but they tend to mean little without supporting evidence.
Link, please.
Proofs of the influence of changes in solar activity on the circulation should be sought where the changes are most visible – in the lower stratosphere.
https://www.cpc.ncep.noaa.gov/products/stratosphere/strat-trop/gif_files/time_pres_HGT_ANOM_ALL_NH_2019.png
entropic…”He debates and tests stuff here to see how you weirdos react, then uses the responses to hone it for publication”.
Fortunately, DA lacks the intelligence and awareness to pull that off. And you lack the intelligence and awareness to see that.
eben…”This is not a personal attack , this is a medical diagnosis.”
Well stated.
Global Warming – Climate Change – whats in the name ?
The climate shysters promising fixing the weather for money used to be called Rainmakers, they are no different now. why nobody talks about it and call it what it is.
eben…”why nobody talks about it and call it what it is.”
OK, I’ll talk about it. Catastrophic global warming/climate change is a pseudo-scientific scam created by shysters. The scam is perpetuated by hogs feeding at a bottomless financial trough, not because they believe the pseudo-science but because they need the attention and the money. Most, if not all, alarmist climate scientists are uber-egotists who are far more in need of attention than they are doing good science.
Leading the pseudo-science is the United Nations who have been trying to create their own bottomless trough of financial income via global taxation. Fortunately, they are too stupid and incompetent to make it happen. They can’t even do the job for which they were created, for “maintaining international peace and security, developing friendly relations among nations, achieving international co-operation, and being a centre for harmonizing the actions of nations”.
The UN is an utter failure as is its climate offspring the IPCC, who have corrupted science to create a lie about global warming/climate change.
bdgwx,
“, but Arctic sea ice has a HUGE feedback effect. ”
Declining sea ice increases the output from the ocean to the atmosphere and space, cooling the ocean.
This is offset by increased solar a*bs*orp*tion but the increase in output is larger than the increase in input at high latitudes…
Aha, sea ice acted like a lid on all that hot water.
phil…”Declining sea ice increases the output from the ocean to the atmosphere and space, cooling the ocean”.
You forgot to mention that your statement is true during one month of the year that is the solar summer. The rest of the year in the Arctic and Antarctic, both oceans are chock full of ice. The Arctic Ocean is so choked with ice in winter that you can literally walk from the Canadian north shore to the North Pole on solid ice.
reposting down here since these links contain important skeptical information from a top scientist.
DA…”Gordon, what were the net and regional charges in the atmosphere, on the surface and the oceans that interact with this high electrical potential?
And what is the magnitude of this high electrical potential? (in SI units)?
What are the regional charges, in Coulombs?”
*******
Who uses Coulombs? What’s wrong with amps?
Why don’t you read the book?
Here’s a paper by Akasofu explaining the electrical current:
there’s a link to download as a pdf…
https://www.researchgate.net/publication/319218653_The_electric_current_approach_in_the_solar-terrestrial_relationship
Here’s another article in which Akasofu explain the natural warming since 1800 – 1850 due to re-warming from the Little Ice Age.
https://www.researchgate.net/publication/273546039_On_the_Present_Halting_of_Global_Warming
Here’s an entire page of links to articles by Akasofu on the solar wind and natural global warming.
https://www.researchgate.net/scientific-contributions/2034377638_Syun-Ichi_Akasofu
A link to a medal awarded to Akasofu for outstanding scientific research in solar-terrestrial physics. Since Akasofu is a geophysicist, who deals with the atmosphere, that qualifies him as a climate scientist who thinks global warming is natural.
https://www.egu.eu/awards-medals/hannes-alfven/2011/syun-ichi-akasofu/
Svante,
“Aha, sea ice acted like a lid on all that hot water”
Exactly! H2o is peculiar.. As a liqiud it is a fantastic coolant… But it solidifies at a lower density than its liquid state… And as a solid it makes a great insulator..
PJ,
Obviously pseudoscientific climate cultists do not understand basic physics. Ice is an insulator, which is demonstrated by the fact that glacial ice at the South Pole is some 40 C hotter at 2800 m depth, compared with the much colder surface.
There seems to be a rather large lake (Lake Vostok) which is about 4000 m below the surface of the ice.
No doubt pseudoscientific GHE true believers might think that Tremberth’s missing heat has hidden under the ice, keeping Lake Vostok liquid. Alas, no. Just the insulating properties of ice, slowing the release of geothermal heat enough to keep water from freezing under the ice.
Maybe Svante was attempting to be sarcastic, rather than attempting to educate.
Oh well.
Cheers.
Gordon Robertson
” lack the intelligence and awareness ”
There are two signs of madmess.
1) Hairs on the palms of your hands.
2) Not being able to see them.
Climate change deniers have a similar blind spot.
I have lost count of the number of posters who have
) Expressed clmate change denial.
2) Denied that they are deniers.
EM,
Unfortunately, you never specify what these supposed “climate deniers” are supposedly “denying”.
Climate is the average of weather. As this is a definition, it cannot be denied, can it?
I assume you are trying to associate GHE non-believers with anti-Semitism, or some other lunatic politically correct meme. Something like James Hansen saying “The trains carrying coal to power plants are death trains. Coal-fired power plants are factories of death.”
Maybe you could concentrate on science, rather than boasting about the fact you cannot keep track of something you claim to have counted.
How about trying to usefully describe the GHE? Without a useful description, nobody can even formulate a testable hypothesis, which is the basis of the scientific method!
Or you could just keep blathering about “climate deniers”. I suspect you might well be preaching to the converted, which is unlikely to win any new adherents to your cause. Oh well, as Einstein reputedly said ” . . .the definition of insanity is doing something over and over again and expecting a different result.”
How has referring to undefined “climate deniers” worked for you so far? Maybe you could try it again, and again, and . . . . Do you think it might work one day?
Cheers.
You are repeating yourself again.
Go and take your tablets.
And please shave your palms.
Begone, troll!
GR,
“You forgot to mention that your statement is true during one month of the year that is the solar summer. The rest of the year in the Arctic and Antarctic, both oceans are chock full of ice.,
My statement is true at any time of the year… Ice and snow are excellent insulators so the heat loss to space from the oceans decreases as the ice cap grows..
phil …”My statement is true at any time of the year Ice and snow are excellent insulators so the heat loss to space from the oceans decreases as the ice cap grows..”
*******
you said…”Declining sea ice increases the output from the ocean to the atmosphere and space, cooling the ocean.
This is offset by increased solar a*bs*orp*tion but the increase in output is larger than the increase in input at high latitudes”
****
My point was that declining sea ice occurs only during a brief period in the Arctic summer. The rest of the year it’s a non-issue.
The North Pole can be ice free during the Arctic summer and a few months later it’s covered with 10 feet of ice.
Furthermore, during the period of declining ice, there is solar input to the oceans. Why would the water radiate more energy than it receives? The Arctic Ocean is never far above freezing. It’s not a place you’d go swimming in the summer.
phil…BTW, I am just curious, not slamming your theory.
GR,
“The North Pole can be ice free during the Arctic summer and a few months later it’s covered with 10 feet of ice.”
Hah! Careful you don’t drink the Kool-Aid. The North Pole is not ice free even at the height of summer… check this current ice cap: https://neptune.gsfc.nasa.gov/csb/index.php?section=234
“Furthermore, during the period of declining ice, there is solar input to the oceans. Why would the water radiate more energy than it receives?”
A couple things here.. first open water at -1 C radiates more than ice/snow at -1c…
but also conduction and evaporation from the surface to the atmosphere increase considerably as the cold air comes flowing off the ice sheet and out over the open water…
as the warmer water flowing toward the ice cap cools, it sinks drawing more warmer water in to replace it…
the solar radiation in is from a sun at a much lower angle in the sky and so is much weaker than lower latitudes (although the hours of available insolation are higher)…
Here is an image of global net radiation balances and you can see that the poles are negative…
https://wattsupwiththat.files.wordpress.com/2015/05/average-toa-radiation-imbalance-2000-2014.png
It is primarily the heat from the ocean that melts the edge of the caps… the amount of heat available of course increases in summer and the caps shrink, increasing the output of heat from the oceans to the atmosphere…
During the winter the ice caps grow and the amount of heat being lost from the ocean to the atmosphere decreases… with little heat from the surface the atmosphere gets extremely cold and the sinking cold air flows across the frozen surface and down to lower latitudes… we feel those arctic blasts regularly here in the prairies…
FWIW the term “ice-free” has a specific definition in the context of Arctic sea ice. It is < 1 million sq km of extent. Current predictions of such an event are somewhere in the 2050-2075 range. Though given the poor state of Arctic sea ice predictions thusfar and the declining trend it's not unreasonable to consider that it won't happen sooner. 0 sq km of extent likely won't ever happen.
The net effect of Arctic sea ice loss leads to a positive (warming) radiative forcing.
bdgwx, how many times has the Arctic been “ice-free” in the last 5000 years?
Few if any. Prior to 5000 years ago…likely.
https://arctic.noaa.gov/Report-Card/Report-Card-2017/ArtMID/7798/ArticleID/690/Paleoceanographic-Perspectives-on-Arctic-Ocean-Change
It’s good that I know how to translate pseudoscience into reality.
Translation: bdg doesn’t have a clue how often the Arctic has been NATURALLY “ice-free”. He just wants to believe in his false religion.
How many times has the Arctic gone “ice-free” in the last 5000 years?
b,
You wrote –
“How many times has the Arctic gone ice-free in the last 5000 years?”
Ooooh! A gotcha!
What efforts did you make to find an answer? None? Or do you believe you know the answer, and are posing a stupid gotcha to show how clever you are?
Try finding a useful description of the GHE, if you want to impress everybody with your cleverness.
I’ll certainly be impressed if you can achieve something that no other pseudoscientific climate cultist has been able to do. Good luck.
Cheers.
bdg can’t answer my simple question, so he asks the same question. That clearly is an admission that he doesn’t know what he’s talking about.
Which was the point I was making….
My answer was few if any. You disagreed which is why I’m posing the question to you. Present evidence supporting your answer so that we can all review it.
bdg did you get caught, again?
You can’t answer my simple question, so you ask the same question. That clearly is an admission that you don’t know what you’re talking about.
Which was the point I was making….
MF
“Obviously pseudoscientific climate cultists do not understand basic physics. ”
Well they sure seem not to understand the 2LOT and i’m starting to think they dont understand how uniqe h20 is compared to other molecules and how it regulates the cooling of the Earth…
Tomorrow a new data point will be released and new circular nonsense debates started.
Make sure you are armed with the latest in Einsteins theory of climate relativity.
https://i.postimg.cc/PJGM2SjG/einsteinshow2.jpg
Yes – facts are a nuisance, are they not?
DM,
The fact that the Earth’s surface has cooled over the last four and a half billion years seems to be a bit of a nuisance for GHE true believers. Was the GHE asleep during this period, perhaps?
Here are a few other nuisance facts –
Gavin Schmidt is not a climate scientist, despite his claims to be so.
Michael Mann is not a Nobel Laureate.
Climate is the average of weather – no more, no less.
Increasing the amount of CO2 between the Sun and a thermometer does not make the thermometer hotter.
Are you feeling even more stupid and ignorant for opening that particular box of worms?
Carry on.
Cheers.
“One would hope we progressed beyond that mentality.” Come on Doc: They have doubled down and unfortunately they are winning.
Your comment says a lot about what drives non-scientific denialists.
Troll, begone!
What does “Troll, begone!” mean?
Is that meant to be a rebuttal?, an insult?, wishful thinking?
I take it to mean game point to me – thanks.
Begone, troll!
game, set and match (again)
Troll, begone!
…and championship
It doesnt work without the Harry Potter wand.
I thought Mike knew that!
Trolls, begone!
Climate Change Indicators: Great Lakes Water Levels and Temperatures
https://www.epa.gov/climate-indicators/great-lakes
Just in case anyone was interested in acquainting themselves with the data on the topic.
No indication of “climate change”, as we would have guessed.
Thanks barry.
b,
Thanks for reminding me.
From the IPCC WG1 –
“The processes affecting climate can exhibit considerable natural variability. Even in the absence of external forcing, periodic and chaotic variations on a vast range of spatial and temporal scales are observed.”
No need for external “forcing”, you see. Chaotic variations may cause variations “on a vast range of spatial and temporal scales”.
Even the IPCC authors are slowly waking up. Good for them!
Cheers.
Wake up MF.
Chaotic variations still obey the laws of physics – they are just not predictable in the long term.
Your job is to explain the current warming using physics without resorting to enhanced greenhouse gases. You cant.
You seem to believe that the climate is flopping around due to magical, god-like unexplained factors. That was what humans believed in the dark ages. Surprising that this attitude persists today.
Myki, you obviously couldn’t grasp the first sentence Mike quoted: “The processes affecting climate can exhibit considerable natural variability.”
Wake up.
DM,
According to the IPCC –
“The processes affecting climate can exhibit considerable natural variability. Even in the absence of external forcing, periodic and chaotic variations on a vast range of spatial and temporal scales are observed.”
What part of this do you not agree with?
As you say ” . . . they are just not predictable in the long term.” – or in the short term, either?
What part of thermometers measuring temperature do you not understand?
Climate is the average of weather – no more, no less.
Maybe you could quote something with which you disagree, but I doubt it.
Cheers.
Wake up MF.
Chaotic variations still obey the laws of physics – they are just not predictable in the long term.
Your job is to explain the current warming using physics without resorting to enhanced greenhouse gases. You cant.
You seem to believe that the climate is flopping around due to magical, god-like unexplained factors. That was what humans believed in the dark ages. Surprising that this attitude persists today.
So is this an example of your
?MF said…”As you say . . . they are just not predictable in the long term. or in the short term, either?”
Predictions of specific states at specific locations and specific times are predictable in the short term. You can view the skill of these predictions here.
https://www.emc.ncep.noaa.gov/gmb/STATS_vsdb/
Predictions of this kind typically only have skill out to 10 days or so. But predictions average states over large areas spanning long periods of time are predictable/explainable over millions of years.
https://advances.sciencemag.org/content/5/4/eaav7337
bd,
You wrote –
“Predictions of specific states at specific locations and specific times are predictable in the short term.”
Indeed. Using naive persistence methods, which can be performed by any reasonably competent 12 year old. Predicting that the Sun will rise tomorrow, that winter will be colder than summer, and so on, is not especially difficult.
An example anybody can try for themselves is to use a spreadsheet to check the probability that tomorrow’s maximum temperature will be within 2 standard deviations of today’s. Generally, this form of naive persistence forecast will be correct around 85% of the time. In my location – better than 90%!
Your first link does not indicate any increase of skill beyond what a 12 year old child could do, does it?
Your second link is just more wishful thinking based on yet more modelling. Completely pointless.
Still no useful GHE description? Just more claims of being able to predict the future better than a 12 year old? I thought so.
Cheers.
MF,
Persistance forecasting techniques are skillful relative to a random guesses. The same is true for climatological forecasting techniques. But dynamic forecasts (via global circulation models) are dramatically better. For example, 5 day anomaly correlation coefficient scores for global 500mb geopotential heights from the ECM model is currently running 0.931. A climatologial forecast has a score of exactly 0. Persistance is near zero as well and can even be negative sometimes.
Regarding your 2nd paragraph…this is a probabilistic forecast. That’s not the same thing as forecasting a specific atmospheric state. But the technique in general is useful nonetheless; just for other kinds of forecasting in which specific atmospheric states are not required.
A 12 year cannot accomplish an ACC score of 0.931 on a 5-day 500mb height forecast. No human can. In fact, studies show that when skilled meteorologist try augment computerized forecast they almost always make things worse. In other words, computers by themselves handily beat a human even when the human gets to “cheat” off the computer.
Regarding my 2nd link…it’s a demonstration of the skill modern modeling. If you are dissatisfied with the results then I trust you will post a link to a model that did any even better job at matching observations over the last 3 million years. Can you post the link so that we can review it?
b,
You wrote –
“For example, 5 day anomaly correlation coefficient scores for global 500mb geopotential heights from the ECM model is currently running 0.931.”
Very sciencey sounding, but completely meaningless in the current context.
You go on to say –
“A 12 year cannot accomplish an ACC score of 0.931 on a 5-day 500mb height forecast. No human can.” You cannot support this particular unsupported assertion, so I won’t bother asking you to.
Then you say –
“Regarding my 2nd link…it’s a demonstration of the skill modern modeling.”
Really? Atmospheric models, even the extremely expensive types used to produce brightly coloured graphics, have never been shown to be any more skilful, in general, than naive persistence forecasts. Commercial wind forecasts for wind farms, for example, are based on persistence, in general, as other forms of forecasting provide no commercial advantage.
The IPCC also stated that future climate states are not predictable, but I would not be surprised if you blame me for the IPCC’s statement. Maybe disagreeing with something I wrote, rather than lurching off into tangents about things I didn’t, might help to convert others to your cause.
Just a thought.
Cheers.
MF said…”Really? Atmospheric models, even the extremely expensive types used to produce brightly coloured graphics, have never been shown to be any more skilful, in general, than naive persistence forecasts.”
Yes they have. My link proves it. Dynamic forecasts over short time periods using global or regional circulation kinematics have been better than persistence and climatological techniques since at least the early 70’s. And their skill continues to improve every year.
And the 2nd link I provided shows that climate models can reproduce climate states over at least the last 3 million years with remarkable accuracy.
Gee some people are thick.
Trying to blame global warming on “natural variations” and then hiding behind the IPCC statement.
Back to the Dark Ages I suppose.
DM,
You wrote –
“Gee some people are thick.
Trying to blame global warming on natural variations and then hiding behind the IPCC statement.
Back to the Dark Ages I suppose.”
Of course, you don’t actually have the spine to indicate about whom you are apparently complaining. However, if you don’t agree with the IPCC authors, maybe you could state why.
Do you think the IPCC is wrong, or are you just whining because the IPCC is saying something which does not agree with your pseudoscientific cult beliefs?
Don’t blame me if the IPCC writes things you don’t like. I do not control the IPCC.
Cheers.
“No indication of ‘climate change’, as we would have guessed.”
Remarks like these are not made by skeptics. This is anti-skeptical.
The data for the great lakes show a declining trend in the levels over the long term. How this is translated to “no indication of climate change” is likely the result of ideological blindness, or senility or some such. Neutral, rational thinking it aint.
And for those curious, here are the data again.
https://www.epa.gov/climate-indicators/great-lakes
Whether this is indicative of climate change requires deeper study.
THAT is a skeptical observation.
Blog Post: When the Great Lakes water levels were unusually low from approximately 2000 through 2012 or so, this was pointed to as evidence that global warming was causing the Great Lakes to dry up.
Take for example this 2012 article from National Geographic, . . .
National Geographic article climate change attribution discussion 1: This extended period of low water raises questions about whether climate change is contributing to declining lake levels, but the Corps maintains the position that it’s difficult to know, because the lakes continue to fluctuate within their normal range.
National Geographic article climate change attribution discussion 2: The IUGLS evaluated the impacts of climate change on lake levels in the Great Lakes region with state-of-the-art climate research. Projections suggest that “lake levels are likely to continue to fluctuate, but still remain within a relatively narrow historical range – while lower levels are likely, the possibility of higher levels cannot be dismissed.” Nevin explained it another way. “Low lake levels are not a new normal,” he said. “We expect to see lake levels fluctuate as we have in the past.”
I’m not seeing justification of the blog post’s premise.
No, me neither.
Roy’s issue here usually has to do with a disconnect between science and journalism, which is so obvious it’s a non story. But seems he only looked at the headlines again.
Gee some people are thick.
Trying to blame global warming on “natural variations” and then hiding behind the IPCC statement.
Back to the Dark Ages I suppose.
DM,
More inscrutable blathering from you? If you are trying to be authoritative, or attempting to be gratuitously offensive, you might need to work on improving your skill set.
I suggest you try for clarity, and indicate what you are actually trying to say.
Is your obscure reference to the Dark Ages connected to Keith Briffa’s explanation of the initial darkness and possibly global cooling which characterised the start of the the Dark Ages?
Or do you mean something else entirely? Mysterious.
Cheers.
bdgwx,
“The net effect of Arctic sea ice loss leads to a positive (warming) radiative forcing.”
If you mean sea ice loss leads to higher air temps and thus increases IR leaving the TOA at these latitudes, i agree…
If you mean something else, please clarify
David Appel, a so called, scientist commentator in the comments section below these articles is representative of the alarmist hysteria of manipulative short term data. There is no such thing as long term data since we have but just over 100 years of it. Thus, no matter which side you find credible you still only have conjecture, hypothesis and presupposition. Filling in the blanks and reading whatever data you do have REQUIRES interpretation. Therein lies the rub. Thus interpretation becomes what differentiates one view from an opposing one. Hence, all this back and forth bantering actually changes nothing nor establishes anything. So when a consensus of politicians give credence to one view over another THEN you KNOW for certain it’s a bunch of BS. Several of the other posters have made this claim already. I am merely concurring with them and all the others that conclude that “Appel” is one bad APPLE! TROLL BEGONE………..hence yet another denier in the house. What will Appel do now? Ask for a reference link?
“Go Fish” is right to point out how clueless David Appell is. Even so DA is a positive factor on this blog that typically has over 500 responses to every post by our esteemed leader. If Dr. Roy was to cast out trolls like DA the activity here would be far lower.
For several years I commented at John Cook’s “Skeptical Science” and I used to communicate with him via email. Back in 2009 he was confident enough to take on people like me in debate. Then it dawned on him that the facts were not on his side.. That is when he imposed censorship that drove out dissidents (aka trolls) like me.
Somebody hacked SKS and sent me comments by “Moderators” at SKS during their crack down on dissident thought. The SKS moderators (aka censors) often accused me of “ad hominem” even though I attack ideas rather than people:
When the dissidents were cast out at SKS the activity at the site tanked. Today, posts at SKS seldom attract more than a dozen comments.
gallopingcamel you have a good point and normally debate and disagreement are strengths, not weaknesses on a vast number of subjects. I must be getting tired of all the leftist drivel and indoctrination assault on anything they espouse.
Click on the “Mimophants” link here to get an insight into the SKS website:
http://www.gallopingcamel.info/IPCC.html
go fish…”Hence, all this back and forth bantering actually changes nothing nor establishes anything”.
You have missed the point. This is not about bantering back and forth, this is about a few of us presenting actual science, based on real physics, thermodynamics, quantum theory, etc., while supporting a skeptical view of anthropogenic theory.
The rest is a desperate attempt to support anthropogenic theory by alarmists using pseudo-science and propaganda.
Gordon I did not miss the point. You know when you reply with a paragraph you are not exhaustively covering every possible angle. Moreover, the written word is so OPEN to misinterpretation since there is no visual or non verbal body language accompanying it. My point is that the endless “science” based jockeying will not convince another person who INTERPRETS and reads the same exact data that you do but does so differently. It’s an endless journey (but necessary) that never ULTIMATELY gets resolved. Hence, the creation/evolution, Socialism/Constitutional Republic, abortion/right to life, transgender or dysphoria/2 genders, etc., debates rage on endlessly. What seems to happen is that the culture finds a “majority” or consensus and then convinces politicians to jump on the bandwagon. Pseudo science and the culture thus become the driving impetus to bring about change while real science is demonized, denied, ignored, skewed and or passed over.
go fish…”My point is that the endless science based jockeying will not convince another person who INTERPRETS and reads the same exact data that you do but does so differently”.
**********
I am not concerned with interpretation of third parties or consensus. Fact is fact as far as we understand it.
Take for example the work of Clausius. He wrote the 2nd law and stated it very simply as follows: Heat can NEVER be transferred by its own means from a cooler body to a warmer body. Many on this site have argued he is wrong, or that he meant something other than what he wrote, which is dead simple.
He defined heat as the kinetic energy of atoms. Some on this blog have claimed heat does not exist. Clausius, whose interpretation of internal energy as U, in the 1st law, claimed internal energy is both work and heat. He explained the work is involved in the vibration of atoms in a solid and that heat is consumed by the work. He also claimed heat exists in a body as energy.
Modernists, without demonstrating their claims through experimentation, have claimed heat is not energy but a process of ‘energy’ transfer. In some text books, especially in mechanical engineering, there are claims that heat can be transferred in both directions between bodies of different temperatures, despite the definition of the 2nd law by Clausius that it cannot. And by the quantum theory based on electrons.
There are idiots out there claiming gravity is not a force but a space-time anomaly. Those are people who are not dealing with a full deck, since time is a human invention that can be found as an entity only in the human mind. It does not exist in the physical universe, yet the idiots are willing to claim gravity has time as a component.
There is no need to argue back and forth since one party is right and the other wrong. I defend scientists like Clausius and Newton who actually did the work to prove their points. I don’t give a hoot who wants to argue about such scientists, I oppose their contradictions in the name of science.
Having said that…no…I don’t know everything about science, or anywhere near it. I do, however, know bs when I hear it, and I’m not about to sit by while pseudo-scientists spread their bs.
bdg…”FWIW the term ice-free has a specific definition in the context of Arctic sea ice. It is < 1 million sq km of extent".
I don't care how the alarmist idiots define it, the truth is, the Arctic has no little or no solar input for several months of the year. It doesn't matter what kind of propaganda is defined, as long as that is the case, the Arctic will be covered in ice forever.
When that solar input disappears, frigid air from the stratosphere descends into the Arctic. There is absolutely nothing any kind of mythical anthropogenic warming can do to change that truth.
During winter, there is an average of 10 feet of ice covering most of the Arctic Ocean. It takes serious cold to freeze a salt water oceans to a depth of 10 feet of ice.
AGW is a serious joke. The theory has generated all forms of idiocy.
GR said…”I don’t care how the alarmist idiots define it”
It’s just a definition. It helps if everyone is on the same page in regards to terminology. It doesn’t mean you have to agree with the leading theory as to the cause of the sea ice decline.
GR said…”the Arctic will be covered in ice forever.”
If you mean there will be at least 1 km^2 of sea ice year round then I agree. But if you mean there will be at least 1e6 km^2 of sea ice year round then I disagree. The September minimum will likely drop below this value sometime after 2050 if a business-as-usual scenario plays out.
phil j…”The North Pole is not ice free even at the height of summer….”
I’m going on actual observation. Read the account of Ranulph Fiennes, who walked to the NP only to find the ice was breaking up sometime in March. He ended up riding an ice floe from the NP all the way down into the North Atlantic where he was picked up by his ship.
The Russians maintain a station at the NP during the winter but must abandon it during the summer.
As you know, the Arctic Ocean is subject to the Beaufort Gyre and the Transpolar drift, as well as wind current. The ice is always moving around, even in winter. It’s true that most of the ocean is covered in ice but said forces move it around dramatically.
Note…remove hyphen on nsid-c in link to view it. the d-c combo does not work in links or text.
https://nsid-c.org/cryosphere/seaice/processes/circulation.html
I have read several accounts of people walking to the NP and back and they all reported major cracks (leads) in the ice blocking their way with open water.
When the RCMP cutter, the St. Roch, sailed from Vancouver to Halifax via the NW Passage circa 1942, it took two years to make the trip due to being hemmed in by ice. On the return trip from Halifax to Vancouver, it made it straight through in 87 days.
Captain Larsen explained that the Arctic Ocean is subject to ocean and wind currents, making the ice unpredictable.
They all walked to the NP, but the NP was supposed to be ice free?
There are floes in the ice the NP in Summer and at other times. That is not remotely “ice free.”
While the Arctic region is projected to be “ice free” in Summer when all sea ice is less than 1 million sq/km, the NP being ice free is about the NP region being completely free of ice.
Why 1 million sq/km? Because they are not going to count the sea ice ice around the glacier tongues being fed by those glaciers. Obviously the glacier tongues are perennial, and the sea ice we are interested in is that which is not immediately calving off glacier tongues even through, and especially because of Summer.
barry…”Why 1 million sq/km?”
Because they need bs to prop up their lame AGW theory. I don’t think any scientist has the slightest idea how much ice there is during the summer.
Is there any data that you accept as valid? Anything at all?
bdg, is there any reality you will accept? Anything at all?
bdg…”Is there any data that you accept as valid? Anything at all?”
UAH data.
entropic…” Climate change deniers have a similar blind spot.
I have lost count of the number of posters who have
) Expressed clmate change denial.
2) Denied that they are deniers.”
*********
I have never denied that climates change, I have simply questioned the generic term ‘climate change’.
I want to know what it means in relation to the number, ‘global average temperature’. I want to know how CO2, as a trace gas, can affect either global warming or climate change.
Which climate is changing and how can a trace gas affect it?
I’m curious to find out what blog platform you happen to be utilizing?
I’m having some small security issues with my latest blog and I’d like to find something more risk-free.
Do you have any suggestions?
The suns energy input to the planet modulates the weather. Most of the heat comes from the core and mantle. Weather and politics are cyclical. Lake Mead will very likely fill up again in the next ten years or so. One mans opinion.
My apostrophes disappeared. Suns and mans. Proofreading is very important. A misplaced decimal or misunderstood phrase can be costly.