UAH Global Temperature Update for May, 2019: +0.32 deg. C

June 3rd, 2019 by Roy W. Spencer, Ph. D.

The Version 6.0 global average lower tropospheric temperature (LT) anomaly for May, 2019 was +0.32 deg. C, down from the April, 2019 value of +0.44 deg. C:
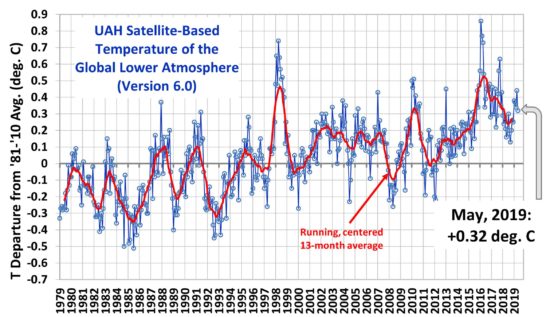
Various regional LT departures from the 30-year (1981-2010) average for the last 17 months are:

YEAR MO GLOBE NHEM. SHEM. TROPIC USA48 ARCTIC AUST
2018 01 +0.29 +0.51 +0.06 -0.10 +0.70 +1.39 +0.52
2018 02 +0.25 +0.28 +0.21 +0.05 +0.99 +1.21 +0.35
2018 03 +0.28 +0.43 +0.12 +0.08 -0.19 -0.32 +0.76
2018 04 +0.21 +0.32 +0.09 -0.14 +0.06 +1.01 +0.84
2018 05 +0.16 +0.38 -0.05 +0.01 +1.90 +0.14 -0.24
2018 06 +0.20 +0.33 +0.06 +0.12 +1.11 +0.76 -0.41
2018 07 +0.30 +0.38 +0.22 +0.28 +0.41 +0.24 +1.49
2018 08 +0.18 +0.21 +0.16 +0.11 +0.02 +0.11 +0.37
2018 09 +0.13 +0.14 +0.13 +0.22 +0.89 +0.23 +0.28
2018 10 +0.20 +0.27 +0.12 +0.30 +0.20 +1.08 +0.43
2018 11 +0.26 +0.24 +0.28 +0.45 -1.16 +0.67 +0.55
2018 12 +0.25 +0.35 +0.15 +0.30 +0.25 +0.69 +1.20
2019 01 +0.38 +0.35 +0.41 +0.36 +0.53 -0.15 +1.15
2019 02 +0.37 +0.47 +0.28 +0.43 -0.02 +1.04 +0.05
2019 03 +0.34 +0.44 +0.25 +0.41 -0.55 +0.96 +0.59
2019 04 +0.44 +0.38 +0.51 +0.54 +0.50 +0.92 +0.91
2019 05 +0.32 +0.29 +0.35 +0.39 -0.61 +0.98 +0.39


The UAH LT global anomaly image for May, 2019 should be available in the next few days here.

Lower Troposphere: http://vortex.nsstc.uah.edu/data/msu/v6.0/tlt/uahncdc_lt_6.0.txt
Mid-Troposphere: http://vortex.nsstc.uah.edu/data/msu/v6.0/tmt/uahncdc_mt_6.0.txt
Tropopause: http://vortex.nsstc.uah.edu/data/msu/v6.0/ttp/uahncdc_tp_6.0.txt
Lower Stratosphere: http://vortex.nsstc.uah.edu/data/msu/v6.0/tls/uahncdc_ls_6.0.txt


672 Responses to “UAH Global Temperature Update for May, 2019: +0.32 deg. C”

Toggle Trackbacks

  1. Barry says:

    From an ‘outsider’ (someone who is not connected with the argument either way), so be nice!…
    What is the cause of the 1 degree C temperature rise in the lower troposphere over 30 years?
    Thanks.

    • Scott R says:

      Hey Barry,

      What data set are you seeing that +1 deg C? Roy just posted we are at +0.32 deg C. He also recently posted an interesting map from weatherBELL that has us at +0.369 deg c over the last 5 months. A good match. I suppose if you take the global temperature of +0.86 deg C on Feb 2016, you could round up to +1 deg C. This however was during the strongest El Nino in the last 40 years. El Nino has an huge impact on global temperatures. For a better estimate on the global temperature trend, you have to measure peak to peak… or do a linear fit to all the data. Roy has it at +0.13 deg c per decade.

      • E. Swanson says:

        Scott R wrote:

        Roy just posted we are at +0.32 deg C.

        Roy has it at +0.13 deg c per decade.

        Dr. Spencer’s data are anomalies calculated with a base period of 1980 thru 2010, thus do not represent the temperature change from beginning to end of the period. The trend line extrapolated over 100 years would result in a temperature increase of 1.3 K. Other groups using the same satellite data have calculated greater trends, for example, the RSS TLT trend is 0.201 K/decade.

        • Scott R says:

          E. Swanson… Barry was asking about a specific 30 year period. I don’t see any data sets showing a 1 deg C increase in 30 years. Your RSS data also doesn’t show that. I believe there was more cooling from 1940-1980 than many here will admit to. We have cycle upon cycle upon cycle of increasing timeframes. You have to do a multiple time frame analysis to understand where we are at, and where we are going. Forcing from the potential grand solar minimum is being way underestimated in my opinion. I believe it will start to rear it’s ugly head on the next la nina, and possibly even disrupt the 400 year linear sea level trend rise. At a min, the 1980-2016 trend should end and we should get a retracement. Guess we will see.

          • E. Swanson says:

            Scott R, Beliefs and guesses aren’t valid in a scientific discussion.

          • Scott R says:

            E. Swanson,

            Maybe so, but we are all forecasters here wouldn’t you agree? Perhaps I used the wrong word.

          • E. Swanson says:

            Scott R, some of us might be called hind-casters, i.e., we rely on measurements before making a forecast, then producing forecasts based on the data and physics. Happy hockey stick!..:-)

          • Gordon Robertson says:

            swannie…”Scott R, Beliefs and guesses aren’t valid in a scientific discussion”.

            Did not stop you from negating the 2nd law of thermodynamics by insisting heat can be transferred from a cooler body to a warmer body, raising the temperature of the warmer body. That is your belief and you don’t even qualify it as a guess.

          • David Appell says:

            After all these years, Gordon STILL doesn’t understand the 2LOT.

            Stupid, or willfully blind, or just stubborn?

          • Dr Roys Emergency Moderation Team says:

            David, please stop trolling.

        • Gordon Robertson says:

          swannie…”Dr. Spencers data are anomalies calculated with a base period of 1980 thru 2010….”

          NOAA defines anomalies below that baseline as being cooler than the baseline (average). UAH anomalies were below the baseline for the most part from 1979 – 1997.

          Therefore the first 20 years of the UAH record cannot be counted as true warming.

      • Mick says:

        What is the margin of error? that info is not presented. Unless I overlooked it.
        That info could be even more important than the measurement itself.

        • Entropic man says:

          Mick

          UAH measurements and trends have 95% confidence limits of +/-0.1C. It is somewhere in Dr. Spencer’s documentation.

          • mick says:

            I find it laughable that the temperature of the whole earth can be measured to that tolerance. Even my backyard has 3 microclimates and I would be hard pressed to claim that I could average the temperature to 0.1 Deg C
            Just saying

          • barry says:

            The 0.1C error is for individual monthly anomalies, not for trends. The confidence intervals for trends are dependent on the variability of the period chosen and its length.

          • Nate says:

            Nick,

            Comparable to saying the average # babies born per woman last year was 1.86+- 0.01.

            Clearly not possible to measure 0.01 of a baby.

            But an error of 0.01 on an a global average still has meaning.

          • Nate says:

            Mick, not Nick.

        • Bindidon says:

          Mick

          “What is the margin of error? … That info could be even more important than the measurement itself.”

          You can download Roy Spencer’s data and enter it into some spreadsheet software like Excel or Libre Office Calc:

          Trend for 1979-now is (using Excel’s LINEST function):
          0.128 ± 0.007 °C/decade

          You can use Dr Cowtan’s Trend Computer based on math reflecting better things like autocorrelation in time series:

          http://www.ysbl.york.ac.uk/~cowtan/applets/trend/trend.html

          Select UAH6.0 LT and enter 1979 as start date:

          Trend: 0.128 ± 0.057 °C/decade (2σ)

    • Stephen P Anderson says:

      Barry,
      It’s called nature.

    • +0.13 C/decade over 40 years is 0.5 C linear rise. Part of it is from stronger El Ninos since the late 1970s, part is (in my opinion) from increasing CO2. But other natural forcings could be involved as well. I’m willing to admit over half of it could well be due to increasing CO2. But there is no way to know. OH, I ALMOST FORGOT…part of the 40-year rise is from the fact two major volcanic eruptions (El Chichon and Pinatubo) were in the early part of the record, which has inflated the 40-year trend.

      NOTE: I stand corrected, the MEI trend since 1979 is downward, not upward. So, ignore that part of my answer. -Roy

      • E. Swanson says:

        As I understand things, the ENSO cycles don’t add energy to the surface of the tropical Pacific Ocean, they re-distribute that which is already there. During an El Nino, the reversal of wind direction in the Eastern Equatorial Pacific cuts the upwelling of cold, deep waters, the result being warmer water on the surface.

        The heating and cooling of the Earth’s oceans has become a major topic of scientific research and the deployment of ARGOS floats has added vastly more information which is being used to answer your point.

      • David Appell says:

        Roy wrote:
        “Part of it is from stronger El Ninos since the late 1970s…”

        Roy, the average MEI (v2) since 1979 is 0.01 — essentially neutral. If the El Ninos are causing warming, are the La Ninas not causing cooling?

        • Scott R says:

          David Appell, depending on where you start and stop your data set, a cyclical force could in fact influence the trend. If you start a trend on a la nina and end it on the strongest El Nino, of course it creates a slope. El Ninos may be getting stronger also. This could actually be a sign of long term cooling. Sure we get a short term bump, but keep a close eye on that southern ocean departure. HADSTT3 has us getting colder for 40 years. The cold water has been hiding uncirculated at the south pole. Upwelling near south America has been minimized the last several decades. When the trade winds pick up this November I suspect a La nina will start.

          • David Appell says:

            The MEI measures the strength of ENSOs. The average MEI from 1979 to today is essentially zero. How, therefore, can El Ninos, strong or weak, have provided net energy when that La Ninas, strong or weak, did not remove?

          • Dr Roys Emergency Moderation Team says:

            David, please stop trolling.

          • Scott R says:

            David Appell let me give you an example. The 1992 El Nino, which should have been the major down beat, was disrupted by the Mt. Pinatubo eruption. This DECREASED the El Nino impact early in the data set. During the 1998 El Nino, this should have just been the harmonic from the 1992 El Nino, but it ended up being the 2nd strongest in the last 40 years. So this one event shifted the El Nino data. That makes the data prior to 1998 artificially low, and the data after 1998 artificially high. Point #2. Instead of putting a linear fit on the El Nino data, try a 5 year moving average so that you can see the 11 year cycle. When you do that, you realize 1980 was a low point. The 5 year MA hasn’t even started to drop yet from the past 2016 El Nino. I contend that we did indeed start the UAH database with a net la nina forcer and ended it with a net el nino. To get a true reading on trend, the start and stop points must be within the same location of the period cycle.

        • El Ninos and La Ninas are EXPECTED to offset each other over the long term, and that is probably still true.

          But, the heat release of the unusually large 1998 and 2015/2016 El Ninos has not yet been offset by La Ninas, SO FAR, AS OF TODAY, so a small amount of warming since january 1, 1998 could be blamed on those two local El Nino events.

          • David Appell says:

            They were offset by La Nina cooling BEFORE 1998, which you seem to prefer to ignore.

            The average ENSO state over UAH’s dataset is neutral.

            And since 1997, the net MEI (v2) is -0.18, which is slightly La Nina-ish.

          • Dr Roys Emergency Moderation Team says:

            David, please stop trolling.

          • Richard Greene says:

            Apple:

            I wrote:
            ” so a small amount of warming since january 1, 1998 could be blamed on those two local El Nino events.”

            Do you bother to read before you incorrectly criticize ?

        • Richard M says:

          David, doesn’t your MEI have an imbedded rising trend? How much is that?

          • David Appell says:

            The MEIv2 trend since 1979 is -0.17/decade — getting more cooler, or La Nina-like.

          • Richard M says:

            David,

            I thought I read somewhere that the new MEI is based on a rising baseline associated with rising SSTs. That would change the trend.

        • It’s not the average MEI value since 1979 that is important…it’s the trend in MEI, which has been upward.

          • Olof R says:

            No, the trend in MEI v2 is negative, -0.17/decade 1979-2018.
            The observed SST trend in the Nino 3.4 region 1979-2018 is virtually zero, whereas that of models is around 0.20 C/decade on average.
            I believe that weak hotspots, lack of warming in the upper troposphere, etc, can be fully explain by the fact that the real world has developed more la Nina-like than models.
            Take a period when real world and models agree in Nino3.4- trends, e g 2000-2018, and they will agree also in tropical hotspots, etc

          • Mark B says:

            Which MEI values are we looking at? If I’ve done it correctly, the linear fit to this data is trending down at -0.0168 per year over the data set (1979 to present).

            https://www.esrl.noaa.gov/psd/enso/mei/data/meiv2.data

          • David Appell says:

            Roy, it’s the *average* that counts.

            The average ENSO state over UAH’s dataset is almost exactly neutral. ENSOs have contributed no net heat to the LT over your record, nor taken any away.

          • David Appell says:

            Roy W. Spencer says:
            Its not the average MEI value since 1979 that is importantits the trend in MEI, which has been upward.

            Roy, the trend is downward!

            The trend in MEI v2 since 1979 is -0.17/decade. That’s toward more La Nina-ish conditions.

            data:
            https://www.esrl.noaa.gov/psd/enso/mei/

            NOTE: I stand corrected, the trend in MEI since 1979 is downward, not upward, so ignore that portion of my answer. – Roy

            I stand corrected, the trend since 1979 is indeed downward. – Roy

      • Mr. Spencer, I’m going to disagree with you, and risk being thrown off this website:

        The cause of the warming since the 1970s is unknown — I know real scientists are not supposed to say “No one knows” — but they should, because that is the right answer.

        Another issue unique to satellite data, which you never mention, to the best of my knowledge, is the bad science / math of using a simple linear trend line to describe non-linear temperature data.

        The start and end points selected for a linear trend line, of non-linear data, can be cherry picked to tell a misleading story.

        And that’s what happens (unintentionally) with UAH temperature data, because 1979, the starting year for UAH data, happened to be an unusually cool year — 1980 was a more typical year.

        Consider this UAH SO POL data example:
        A trend line starting in 1979, through 2018, would show a warming trend for UAH SO POL data, but a trend line starting in 1980 would show a flat trend = two different stories.

        An honest person would look at ALL the UAH SO POL data and say:
        (1) Data collection started in 1979
        (2) There was significant warming from 1979 to 1980, and
        (3) There was no temperature change since 1980

        But it’s easier to say there was warming since 1979 !
        Especially if you are a climate alarmist.

        Unfortunately, the climate of our planet has been narrowed down to a single statistic, the global average temperature, and a single linear trend line … of that non-linear data.

        That over reliance on a linear trend line, of ONE non-linear statistic, is not good for climate science.

        UAH already has data subsets, such as Arctic, So Pol, Tropics, USA48, that are more important than the global average, but they receive too little publicity.

        So Pol data are important for claims of melting land ice, and sea level rise,

        Arctic data are important because that region has had a lot of warming, which seems to have slowed in recent years.

        The temperature differential between the Arctic and Tropics is important because it should have an effect on Northern Hemisphere weather.

        US 48 is important because about 330 million people live in that climate.

        NO ONE LIVES IN THE GLOBAL AVERAGE TEMPERATURE.

        • Nate says:

          ‘A trend line starting in 1979, through 2018, would show a warming trend for UAH SO POL data, but a trend line starting in 1980 would show a flat trend = two different stories.’

          C’mon, Richard, don’t be daft and insult Dr Roy’s intelligence.

          He would not call the 0.01 C/decade S. Polar trend a ‘warming trend’.

          Nor would any sensible person, considering the error bar is much larger than 0.01.

          No need for your bizarre data exclusion.

        • Craig T says:

          “NO ONE LIVES IN THE GLOBAL AVERAGE TEMPERATURE”

          And no one lives in the lower troposphere. Since the AIRS surface temperatures match Had.CRUT4 and GISTEMP as well at AIRS TLT matching UAH and RSS it seems clear that where we live is warming faster than the lower troposphere.

          • Nicholas McGinley says:

            No one lives out on the open ocean either, so why include that data?

          • Craig T says:

            I welcome all the data. I was responding to Richard Greene’s comments about the global average.

            I do think it’s more important that CMIP5 aligns with surface data (including AIRS) than it overshooting the increase in lower troposphere temperature. I actually want more data on temperature from the atmosphere in the 250 – 300 mb range that AIRS shows warming at 0.2 C/decade.

      • Mick says:

        But isn’t it also possible that the el ninos caused the increase in CO2?

        • Nate says:

          Sure, possible, and pirates possibly caused global warming.

          • Mick says:

            This response is not helpful. I usually come here to learn. I rarely comment. Maybe this is why

          • Nate says:

            Mick, sorry…

            But where does this idea come from? Seems out of left field.

          • Lewis guignard says:

            Nate,

            It doesn’t matter where thoughts come from. It is a question which may or may not be answered here. Some of those who are more knowledgeable might answer why it could or couldn’t be true. Personally, I don’t care. I’m glad it’s warmer and hope it stays that way.

            Lewis

          • Chic Bowdrie says:

            Mick,

            Don’t be discouraged from asking questions that are impugned by some. Others will be more respectful especially if they realize you are a seeker and not a wiseass.

            But Nate has a point. Better to propose a reason or hypothesis that would put your question in context.

        • Nate says:

          And BTW, it is well known that ENSO causes variability in CO2, but not the overall upward trend.

          • Bart says:

            Nonsense. The trend tracks perfectly well.

          • Nate says:

            As it does with pirates, and many other things.

            Got any evidence of causation?

          • Bart says:

            It does not track pirates.

          • Entropic man says:

            Actually there is a negative correalation between pirates and global warming. I believe this was first pointed out by the Pastafarians.

            https://www.venganza.org/category/pirates/page/4/

          • Craig T says:

            “Nonsense. The trend tracks perfectly well.”

            But what does it mean Bart?

            A graph of atmospheric CO2 forms a sine wave with an upward trend because of the seasonal increase and decrease of CO2. It’s a rare clear signal in climate data (see purple line.) Graphing the derivative of that rate gives a rough repeating “M” shape with no upward trend (green line.) Smooth it with a 6 month mean and it returns to a sine wave but still no trend (blue line.)

            Taking the derivative and adding a 12 month mean takes that well-patterned data and creates massive noise with a slight upward trend (red line.) It takes the rough shape of the TLT data but what does that tell us? Can you figure out how much CO2 is produced during an El Nino versus a la Nina using the graph? Can you use the CO2 data alone to calculate TLT temperature?

            http://woodfortrees.org/plot/esrl-co2/mean:12/from:1995/derivative/scale:20/offset:-2/to:2000/plot/esrl-co2/from:1995/derivative/to:2000/scale:2/plot/esrl-co2/from:1995/to:2000/mean:6/scale:4/derivative/plot/esrl-co2/from:1995/to:2000/offset:-360/scale:1

          • Bart says:

            It’s not rough. It’s a very good match

            http://woodfortrees.org/plot/esrl-co2/mean:12/from:1979/derivative/plot/uah6/scale:0.18/offset:0.144

            It provides an affine relationship between the rate of change of CO2 and temperature anomaly. Since it is absurd to imagine that the rate of change of CO2 drives temperature anomaly, we must conclude that temperature anomaly is driving CO2, and there is little to no room left in that relationship for significant human impact.

            “Can you figure out how much CO2 is produced during an El Nino versus a la Nina using the graph? Can you use the CO2 data alone to calculate TLT temperature?”

            I would not say produced, but induced. But, yes, you can use the affine model to calculate these things.

          • Nate says:

            ‘Since it is absurd to imagine that the rate of change of CO2 drives temperature anomaly, we must conclude that temperature anomaly is driving CO2, and there is little to no room left in that relationship for significant human impact.’

            Homicides and ice-cream sales in the summer are correlated. Since it is absurd to imagine that homicides drive ice-cream sales, we must conclude that ice-cream sales drive homicides. There is little room left for any other explanation. Right???

            This is Bart’s logic.

            It is absurd that Bart ignores all other explanations for two variables rising over the same period, other than a speculative one-way causal relationship.

            For example, there is a well known causal quantitative relationship between CO2 emissions and CO2 accumulation.

            And there is a proposed causal relationship between CO2 concentration and temperature with a well established physics mechanism.

            To use the word ‘absurd’ to describe this alternative scenario is absurd.

          • Bart says:

            Little of the above merits a response.

            “And there is a proposed causal relationship between CO2 concentration and temperature with a well established physics mechanism.”

            Under controlled conditions in a laboratory. One cannot reliably extrapolate such results in linear fashion to a massive, uncontrolled, interconnected system like the Earth’s climate.

          • Craig T says:

            Bart said:
            “… we must conclude that temperature anomaly is driving CO2, and there is little to no room left in that relationship for significant human impact.”

            Every month the CO2 goes up. Why are you sure every ppm of that CO2 increase is driven by temperature?

            “I would not say produced, but induced.”

            Do you believe it is the temperature or the El Nino /la Nina condition inducing the CO2? Where is the CO2 coming from?

          • bobdroege says:

            This just show the pause in the pirate global warming trend.

            Once the Somalis regroup after recent setbacks the pirate global warming trend will resume.

          • E. Swanson says:

            Bart, How do your calculations square with the isotropic data which points to fossil fuels as the cause of the increase in atmospheric CO2 concentration? The issue is not a new one and has been widely discussed. HERE’s a discussion of the science.

          • Nate says:

            ‘I have described my hypothesis here”

            Just as I said, there is no identified causal relationship. It is pure speculation.

            Then how can Bart still be absolutely certain that there is a causal relationship?

            And be absolutely certain the rise of the two quantities is not caused by causal relationships with OTHER variables?

          • Nate says:

            ‘There is a continual flow of CO2, rising with the upwelling waters in the tropics, and descending with the downwelling waters at the poles. If transport of CO2 within the downwelling waters is impeded, it must accumulate in the surface oceans, as that transported with the upwelling waters cannot be stopped. ‘

            Many problems with this.

            1. This effect, if real, fizzles out, as soon as atm CO2 builds up and increases descending CO2 in downwelling waters.

            2. There is no significant measured change in downwelling water volume. The effect of temperature to decrease CO2 concentration in this water is SMALL compared to the opposing effect of increasing atm concentration.

            3. Any measurements of any kind support this hypothesis?

            4. How big is this proposed effect? Is it, order of magnitude, comparable to the observed CO2 increase?

          • Bart says:

            1. This effect, if real, fizzles out, as soon as atm CO2 builds up and increases descending CO2 in downwelling waters.

            Atmospheric pressure cannot force any more down because an increase in the atmospheric currents is directly offset by a decrease in the ocean currents. You are attempting to extract work merely by dividing the flow. That is a perpetual motion setup.

            2. There is no significant measured change in downwelling water volume. The effect of temperature to decrease CO2 concentration in this water is SMALL compared to the opposing effect of increasing atm concentration.

            Has nothing to do with water volume.

            3. Any measurements of any kind support this hypothesis?

            Yes. The data show that the rate of change of atmospheric concentration is proportional to appropriately baselined temperature anomaly.

            4. How big is this proposed effect? Is it, order of magnitude, comparable to the observed CO2 increase?

            Evidently, it is. These flows are enormous. Even a small imbalance produces a significant rate of change.

          • Bart says:

            E. Swanson @ June 6, 2019 at 9:36 AM

            This is a conjecture involving vast simplification of complicated diffusion processes and assuming comprehensive knowledge of all sources.

            To me, it is much, much weaker than direct measurements which show an astounding match between two obviously connected variables.

          • e. Swanson says:

            Bart, You call for “direct measurements” while ignoring the well known data I presented. As DA points out below:

            “The CO2 thats been added to the atmosphere is well known to be anthropogenic in origin”.

          • Bart says:

            I’ve seen it. It’s not compelling. This is narrative weaving, not proof.

            It is really little better than saying the progression of malarial symptoms is consistent with it being caused by poisonous gases leaking from the ground in the night, or ulcers are caused by stress, or droughts are caused by the displeasure of the gods. All the symptoms are consistent with the proffered cause, but consistency is merely necessary, not sufficient.

            The match between temperature anomaly and the rate of change of atmospheric concentration, in both the long and the short term, does not have a satisfactory alternative explanation. One can apply arbitrary filters to make room for human forcing, but there is no justification for that when there is already agreement with minimal processing. Occam’s razor says this is it: temperature is driving the rate of change of atmospheric concentration, and is overwhelmingly responsible for the change we have observed.

          • E. Swanson says:

            Bart wrote:

            I’ve seen it. It’s not compelling. This is narrative weaving, not proof.

            The match between temperature anomaly and the rate of change of atmospheric concentration, in both the long and the short term, does not have a satisfactory alternative explanation.

            The temperature anomaly and rate of change of atmospheric concentration, particularly considering short term variation in temperature, has no influence on the ratio of 13C to 12C. The fact that land based plants capture less 13C than 12C results in the low ratio being preserved in fossil fuels derived from plants. Burning those fossil fuels and adding the resulting CO2 to the atmospheric pool has changed the 13C/12C ratio in the atmosphere.

            That explanation appears to be the most likely reason for the increase in atmospheric CO2 and you have offered no other explanation for this effect. As was pointed out to you previously, you also appear to be ignoring the considerable work to identify the sources and sinks of the carbon budget.

          • fonzie says:

            Swan Song (☺️), three things…

            1) A warming planet will produce a lower carbon ratio on its own. This is thought in part due to plankton dying with warmer temps.

            2) Just simply burning CO2 as we have since 1850 will cause a lower carbon ratio. This is called simple dilution.

            3) Deforestation also causes a lower ratio. Especially so when you consider that deforestation not only destroys trees, but also the future rate of growth of trees. (This would exacerbate the low ratio from my reason #1)

            These three together (and Gawd only knows if there’s a fourth) make it impossible to tell whether or not the rise is due to human emissions or not.

            p.s. i always bristle when Bart says human activities as opposed to human emissions. If what Bart is saying is correct, then the rise is surely not due to human emissions, although it could still be due to human activities (such as deforestion).

          • fonzie says:

            2) Just simply burning CO2 should read 2) Just simply burning fossil fuels

          • fonzie says:

            (my point being that by burning fossil fuels we could be lowering the C13 ratio without contributing to the rise in CO2; simple dilution)…

          • E. Swanson says:

            fonzie, About your 3 points:

            1 – Plankton receive their CO2 from the ocean, which should have the same ratio as the atmosphere, thus my guess is that their dying would appear not capable of changing the ratio in the atmosphere. Got a reference?

            2 – We don’t “burn CO2”, we burn carbon and burning fossil carbon results in a lowering of the ratio. Isn’t that the whole point?

            3 – Deforestation might also reduce the ratio, except that those trees would normally release their carbon back to the atmosphere via decay anyway when they die. It might also be that burning those trees to make way for crops would result in the addition of new plants taking up some of the excess 12C. Agricultural land can also be depleted over time and then abandoned to return to natural cover, i.e., trees. Got a reference?

          • E. Swanson says:

            fonzie, Sorry about your #2, I was writing while you posted. But your second point in #2 misses the fact that the CO2 concentration has increased along with the decline in the 13C/12C ratio. The change in the ratio, for which data is available for thousands of years, points to fossil carbon as the source of the increase in atmospheric CO2.

          • Bart says:

            E. Swanson:

            “That explanation appears to be the most likely reason for the increase in atmospheric CO2 and you have offered no other explanation for this effect.”

            To you, it seems the most likely reason. To me, it never made sense. CO2 circulation is dynamic, with active inputs and dissipation to sinks. It never made sense to me that natural inputs would dissipate, but anthropogenic inputs would accumulate. That has “special pleading” written all over it.

            As for the ratio, I think the most likely explanation is what Fonzie calls “dilution”. This is a horrifically complicated diffusion problem. We could well be responsible for the change in the ratio without being responsible for the overall change in concentration.

            But, on the other hand, we do not have comprehensive knowledge of all sources and sinks, either. The ratio rises and falls with the El Nino induced excursions in CO2 concentration, too, which even the orthodox admit is temperature driven. ‘Splain that one to me, Lucy.

            So, there’s plenty of room for alternatives, both obvious things like this, and perhaps others that haven’t been thought of because researchers jumped to a pleasing conclusion and stopped investigating.

            Thus, this is not compelling evidence. It is a rationalization of observations, but again, once people rationalized that stomach ulcers were due to stress, and malaria was due to “bad air”. Such rationalizations are notoriously unreliable.

            On the other had, we have direct measurements that show the rate of change of CO2 is tracking temperature anomaly. Human inputs are not temperature dependent. There is no reasonable alternative explanation. We are not the main drivers of atmospheric CO2 concentration.

          • fonzie says:

            1 Plankton receive their CO2 from the ocean, which should have the same ratio as the atmosphere, thus my guess is that their dying would appear not capable of changing the ratio in the atmosphere. Got a reference?

            Swanson, tis the weekend and i generally don’t do blogs on the weekend. So, i’m afraid that i’ll have to short shrift you here. (i’d like to go a little deeper into the weeds with you here, but alas… ☹️) i first got wind of the plankton argument from Dr Roy, so you might try searching his archives. At any rate, the C13 data does shows a lower ratio for the MWP (or MCA) than the LIA. And depending on the comparison of the MWP with modern warming it could be significantly lower than that.

            But your second point in #2 misses the fact that the CO2 concentration has increased along with the decline in the 13C/12C ratio. The change in the ratio, for which data is available for thousands of years, points to fossil carbon as the source of the increase in atmospheric CO2.

            The decline in the carbon ratio also coincides with modern warming. You can’t use your argument for attribution when it can just as easily point to risings temps…

            3 Deforestation might also reduce the ratio, except that those trees would normally release their carbon back to the atmosphere via decay anyway when they die. It might also be that burning those trees to make way for crops would result in the addition of new plants taking up some of the excess 12C. Agricultural land can also be depleted over time and then abandoned to return to natural cover, i.e., trees. Got a reference?

            i don’t think that you’ve thought this one through very well, Swanson. When a tree dies in a forest, it is replaced by another tree. Deforestation simply results in the loss of the tree. Furthermore, when we lose forests we lose the potential growth for new forests. If we assume that ice cores tell us the truth (bart, shush… ☺️), then they give us an increase of 16 ppm per degree celsius. But, that is with the growth of sequestering trees. Were there no trees on planet terra at all, that 16 ppm figure would be much, much higher. So when mankind cuts down trees over time, it’s as though we’ve effectively taken out the growth of trees in that (16 ppm/1C) equation. Add to that the relatively rapid rise of modern warming (“10,000 years” of warming since 1850) and viola!

            Swanson, as i said, i can’t spend much more time than this. Consider this one last point: Cores tell us than CO2 rose 20 ppm from 1750 til the turn of the century (1900). Emissions were at most 5 ppm of that. We did not warm anywhere near 1C during that period of time. And whatever it was that we were doing to cause that kind of rise back then without emissions, you can rest assured that we’re doing a whole lot more of that now. That alone, even without Bart’s temperature argument, should shake your confidence that emissions are driving the growth in atmospheric CO2…

          • E. Swanson says:

            Bart, Sorry, I don’t see any obvious evidence of El Nino’s on the 13C/12C ratio. Look again at the data (select “Carbon-13/Carbon-12 in Carbon Dioxide (D13C(CO2))” and plot). Looking at the graph, I see what appears to be a seasonal cycle, but do not see anything like the strong El Nino of 1998 or 2016. The warming and cooling temperatures of the annual cycle are seen in the annual cycle of the CO2 concentration, but I think it’s improper to claim that a short term correlation proves that the long period warming is causing the change in CO2 concentration.

            Most of those other sources and sinks, including the deep ocean, are much shorter time constants than that of fossil fuels, which have been isolated from the atmosphere for many millions of years. Perhaps you have other information which you could present to support your claim.

          • Nate says:

            Bart,

            1. Atmospheric currents, huh? This is simply increased co2 atm pressure increasing concentration in the downwelling water. This happens, ordinary physics. So, no, the effect still fizzles.

            2.This means, with #1, more co2 is downwelling, not less.

            3.IOW, there are no supportive measurements.

            4. No estimate. Not even back of the envelope with easily looked up numbers? Well, thats convincing!

          • Nate says:

            ‘So, theres plenty of room for alternatives, both obvious things like this, and perhaps others that havent been thought of because researchers jumped to a pleasing conclusion’

            I absolutely love how whenever we show Bart data supportive of anthro carbon, it is always ‘merely consistent’, ‘just trying to fit a narrative’, ‘not well validated’ and ‘plenty of alternatives explanations’.

            But when we point out that he has merely a correlation without causation, and avweak one at that, he insists there is no room for alternative explanations.

          • Nate says:

            ‘A weak one at that’

            Here’s what I mean by that. If we look at Bart’s correlation, but focus on the > 5 year variations, by using a 60 mo filter, this is what we see:

            https://tinyurl.com/y3rs66s7

            I don’t think ‘Its not rough. Its a very good match’

            is a good description of what we see here.

            Its a poor match, other than both show a similar rise after 1975, effected by using a scale factor of 10.

            Now, if we bring back the 1-5 y variations, they look better matched.

            https://tinyurl.com/y4qm994v

            But a much smaller scale factor of 2.5 is needed. IOW this is NOT an ‘affine relationship’.

            And ALL agree there is good evidence for causation between ENSO and CO2 on < 5 y time scales.

          • Bart says:

            E. Swanson –

            You need to filter out the annual variation to see what is happening in the longer term.

            I think its improper to claim that a short term correlation proves that the long period warming is causing the change in CO2 concentration.

            It isnt a short term correlation. The rate of change of atmospheric CO2 matches the temperature anomaly going back at least as far as the beginning of the MLO record. It matches both the short term variations, and the long term trend.

            Nate –

            So, no, the effect still fizzles.

            No, it doesnt. As an analogy, suppose you have a river with an island splitting the flow near to one of the banks. So, a small rivulet goes around the island before rejoining the stream.

            Now, a weir is placed across the river just downstream from the island. The level of the river behind the weir rises, as it does in the rivulet.

            The argument that the atmospheric rise in concentration will force more CO2 down is analogous to arguing that the rise of the level in the rivulet will force the water past the weir, and result in no net rise of the river level.

            This is, of course, preposterous. Dividing the flow of the river around the island has no net impact on the functioning of the weir.

            Stop playing your stupid games showing that if you alter the data, it no longer matches. There is a strong match in both the long and the short term, as I have shown.

          • Bart says:

            E. Swanson

            You need to filter out the annual variation to see what is happening in the longer term.

            Moreover, why is there an annual variation, when we’re not drastically changing our emissions seasonally? Why, when the ratio goes down in one part of the year, does it go back up in another?

          • E. Swanson says:

            Bart wrote:

            The rate of change of atmospheric CO2 matches the temperature anomaly going back at least as far as the beginning of the MLO record.

            I thought we were addressing the source of the increasing CO2, which is the reason I brought up the 13C/12C ratio data. The crux of the issue is that the increase in CO2 is causing the increase in temperature, not the other way around.

            Moreover, why is there an annual variation, when were not drastically changing our emissions seasonally? Why, when the ratio goes down in one part of the year, does it go back up in another?

            The temperate regions of the NH experience a seasonal cycle in plant growth over land. Thus, 12C captured during the growth portion of the yearly cycle is later released back into the atmosphere after the plant material dies back in Winter and then decays and feeds new growth during the next Summer. The same process also appears in the total CO2 record.

          • Bart says:

            “The crux of the issue is that the increase in CO2 is causing the increase in temperature, not the other way around.”

            The crux of the issue is that the temperature anomaly matches the rate of change of CO2, and it is absurd to believe the rate of change of CO2 is driving temperature. The arrow of causation is necessarily in the direction of temperature driving CO2, and not the other way around.

            The possibility that the relationship is bilateral in a positive sense is disqualified by the fact that this would comprise a positive feedback loop that could not be stabilized even by T^4 radiation. The upshot is that there is no significant sensitivity of temperature anomaly to CO2 in the present climate state.

            “Thus, 12C captured during the growth portion of the yearly cycle is later released back into the atmosphere after the plant material dies back in Winter and then decays and feeds new growth during the next Summer.”

            The preference for 12C is not that heavily lopsided.

          • Nate says:

            ‘It isnt a short term correlation. The rate of change of atmospheric CO2 matches the temperature anomaly going back at least as far as the beginning of the MLO record. It matches both the short term variations, and the long term trend.’

            No, no it doesn’t as I showed here. You want to claim this is a good match, then you are simply denying reality.

            https://tinyurl.com/y3rs66s7

            Show it to someone who doesnt have a dog in this fight, your sister, your cousin, and see if they think this is a good match.

            ‘Stop playing your stupid games showing that if you alter the data, it no longer matches.’

            Not ‘altering’, just analyzing the data. In a way that seems most logical to me. That is normal in science. You make a claim. Someone else tries to replicate it, and can’t. Happens all the time.

            If you don’t like how I have removed the fast variation in order to focus on the slow variation, please show us how you would do it.

          • Nate says:

            ‘No, it doesnt. As an analogy, suppose you have a river with an island splitting the flow near to one of the banks. So, a small rivulet goes around the island before rejoining the stream.’

            “Now, a weir is placed across the river just downstream from the island. The level of the river behind the weir rises, as it does in the rivulet.

            “The argument that the atmospheric rise in concentration will force more CO2 down is analogous to arguing that the rise of the level in the rivulet will force the water past the weir, and result in no net rise of the river level.”

            No, confusing as to why you think this analogy is apt or helpful. What is the ‘weir’ in our atmosphere?

            Analogies can be used to obfuscate the issue, as is happening here.

            Why not just talk about the REAL physics in the real problem to avoid being mislead and confused?

            The real physics is that regardless of what is happening ‘upstream’ and far away in the atmosphere, if the atm pressure of CO2 above the ocean surface is much higher, then equilibraion of this pressure with the ocean surface MUST happen, and clearly it does.

            If so, and with a constant rate of water downwelling, then MORE CO2 will downwell.

            Its just not that complicated.

            And of course this is one of the main ways for the deep ocean to equilibrate with the atmosphere.

          • Nate says:

            ‘The possibility that the relationship is bilateral in a positive sense is disqualified by the fact that this would comprise a positive feedback loop that could not be stabilized even by T^4 radiation. ‘

            You have made this claim many times, where is the proof?

            Roy’s model from last month shows no such instability. You ignore neagtive feedbacks, like ocean and biomass uptake.

            If we use the known long-time response of CO2 to temperature from ice-cores etc, we find ~ 20 ppm/K.

            Thus we have 120 ppm from emissions, and perhaps an additional 20 ppm from temperature feedback.

            If that is the case, then there is little evidence of instability arising any time soon.

          • E. Swanson says:

            Bart wrote:

            The crux of the issue is that the temperature anomaly matches the rate of change of CO2, and it is absurd to believe the rate of change of CO2 is driving temperature.

            This comment follows your discussion from 2017 which resulted in this statement of your hypothesis:

            The observations very closely follow a pattern described by

            dA/dt := k*(T – T0)

            But, over the short term, dA/dt exhibits sharp peaks and troughs resulting from the annual cycle, as would be expected. Those peaks and troughs are located at the maximum and minimums of the annual cycle in the CO2 record.

            It should thus be no surprise that the dA/dt of Co2 closely follows the annual cycle in the NH temperature record, since the seasonal cycle in CO2 is driven by that annual cycle’s growth and decay of plant mater. It should also be no surprise that dA/dt exhibits a negative correlation with the SH annual temperature while the SH temperature data exhibits a strong El Nino influence.

            Over the longer term, dA/dt shows a small trend consistent with the increase in the rate of CO2 emissions, whereas (T-T0) is increasing. It’s not clear to me how your hypothesis is correct.

            You also wrote:

            The preference for 12C is not that heavily lopsided.

            The preference for 12C was the cause of the 13C depletion in fossil fuels in the first instance, so your statement would appear to be incorrect.

          • Bart says:

            OK guys, this is just sad. It’s not worth responding further. Anyone who could be swayed by your poor arguments does not have the acumen to understand why they are fallacious and facile, and could not be reached in any event. I might as well go back to discussing GR with Gordon. It’s more productive.

          • Nate says:

            ‘OK guys, this is just sad. It’s not worth responding further. Anyone who could be swayed by your poor arguments does not have the acumen to understand why they are fallacious and facile, and could not be reached in any event.’

            Wow, what a flimsy excuse for having absolutely no good answers!

            Why do you keep bring up the same plot, again and again, here on this forum, and never deal fully and honestly with the genuine rebuttals?

            Why don’t you ever bring NEW evidence?

            Quite baffling.

          • E. Swanson says:

            Bart says:

            OK guys, this is just sad. It’s not worth responding further.

            In other words, you’ve lost the argument. Don’t go away mad.

            But, seriously, if you are going to try to use the dA/dt as your standard of proof, you are not going to get much accomplished. The short period annual cycle has intentionally been removed from all of the temperature time series in order to produce the area weighted values. I think that a proper comparison would require also removing the annual cycle from the MOL record, which just leaves the long term trend with an upward change due to the increase in the rate of CO2 addition from fossil fuels.

            The de-seasonalized MOL CO2 LOOKS LIKE THIS. Which came first, the chicken or the egg?

          • E. Swanson says:

            Woops, the graph didn’t make it thru. Trying again
            https://app.box.com/file/472818236252

          • Nate says:

            What is the MOL record? Still can’t see it, BTW.

          • E. Swanson says:

            Nate, Sorry to say, I’m not a good editor. That should have been MLO, not MOL. HERE’s another link to the graph. Maybe I’ll get it right this time…

          • Bart says:

            “Why dont you ever bring NEW evidence?”

            Because it is not necessary. What I have provided is sufficient.

            In all seriousness, you guys are just looking for excuses to avoid the obvious. It’s not worth any more of my time. I might as well go engage Huffman on the rotation of the Moon, or get the Brantisvogan Civil Service to acknowledge a change-of-address card.

          • fonzie says:

            Nate, you need to make a few changes in your (5 year average) graph…

            1)hadsst3sh is the best fit dataset out of hadley. Presumably, the southern ocean is where all the action is.

            2)after making that change (to hadsst3sh), the scale (on esrl-co2) is 4.3 and the offset is 0.43 (on hadsst3sh). This you can verify using a linear trend on both…

            3)it doesn’t hurt to add a mean:12 to to hadsst3sh dataset to make it even.

            i wonder the value of doing what you’ve done given that the anomolous pinatubo event sits right in the middle of it. This would affect the trend calculation i would think and affect the data to either side of it, too. Plus, it may well be that hadley just is not as good a fit as compared to the satellite data. (too noisy) Bart used to post graphs all the time over at watts’ and uah, rss always looked like a much tighter fit than the hadley sh data sets. (you might try doing a graph of one or both of those. Use the linear trend to get them scaled, offset correctly)…

          • Nate says:

            Bart,

            Right now you have a correlation, a weak one, and speculation as to cause.

            That’s all.

            As you should know very well from your many responses discussing LOGIC flaws, correlation, by itself, with no clear evidence of causation, is not sufficient to make a case in science.

            You need more evidence.

          • Nate says:

            Fonzie,

            Thanks.

            “Nate, you need to make a few changes in your (5 year average) graph

            1)hadsst3sh is the best fit dataset out of hadley. Presumably, the southern ocean is where all the action is.

            2)after making that change (to hadsst3sh), the scale (on esrl-co2) is 4.3 and the offset is 0.43 (on hadsst3sh). This you can verify using a linear trend on both”

            Yes it does look better, with those settings.

            But now bring back in the high frequencies. Change the smoothing from 60 to say 24 for both curves. You can see the high frequencies begin to come in more strongly for CO2.

            Now go from 24 to 12 for both. Now you can see the match is terrible. A much different scale factor is needed now to get a match of high frequencies, and then the trend no longer matches.

            This makes clear that the scale factor is highly frequency-dependent. Not an affine relationship.

            “i wonder the value of doing what youve done given that the anomolous pinatubo event sits right in the middle of it.”

            Yes. But it is showing that what is driving CO2 variabbility is not simply temperature.

            The link between ENSO and CO2 has been studied a lot, and it seems that most of this effect is arising from LAND warming and drying in the tropics, which decreases biomass production regionally, thus increasing atm CO2.

            “Bart used to post graphs all the time over at watts and uah, rss always looked like a much tighter fit than the hadley sh data sets.”

            Yes, I think UAH, but not RSS currently. It is well-known that the troposphere responds much more strongly to ENSO than either land or ocean globally. Something to do with increased tropical latent heat generation during El Ninos. This gives a better match.

            These are measurements are of the troposphere. But all possible sources of CO2 that could be T-dependent are in land or ocean, not the troposphere.

            As I mentioned, the source of additional CO2 during El Ninos is regional warming and drying of LAND. For long term rise in CO2 due to Global Warming this mechanism doesnt work quantitatively.

          • E. Swanson says:

            Bart continues to ignore the problems with his analysis. He again points to his earlier graphical comparison of MLO CO2 vs. the UAH v6 global productin which the UAH product is neither surface temperature and nor representative of the NH seasonal temperatures.

            BTW, there appears to be an error in the Wood for Trees calculation of mean (aka” moving average). Consider THIS GRAPH comparing 12 vs. 24 months with THIS ONE comparing 12 vs. 18 months.

            One would expect that the longer averaging period should reduce the variance, but that doesn’t appear to be happening as the amplitude of the final graph is greater in the 18 month curve than in the 12 month curve. It’s well known that a moving average induces a signal with the averaging period into the final result. It may be that the software is performing the moving average computation before the derivative calculation, which isn’t necessarily the desired intent. Thus, your graphical comparisons may be based on an incorrect calculation, especially as you are applying the averaging twice.

          • Nate says:

            Yeah, 12 mo or multiple before the drivative seems to produce least noise.

            If you 12 mo before deriv than any smoothing after seems ok.

            Can also us Fourier section to make sharper cutoff filters. I did that with 12 mo on both, very noise free. But Bart didnt like it.

          • E. Swanson says:

            Nate, The Mean function on Wood for Trees appears to be a centered moving average. To use this averaging correctly, one must apply an even number of samples to maintain the correct date in the result. That said, things get weird when applying a simple moving average filter to a time series with a strong frequency component, such as the MLO CO2 time series or it’s derivative. HERE’s a graph which demonstrates the problem.

            When one applies the MA to the MLO CO2 derivative with a sample period less than 12 months, the result is in phase with the original time series. When one selects a period of more than 12 months, the resulting series has a greater range than the 12 month case and there is a phase reversal, in signal processing terms. The 12 month MA suppresses most of the yearly variation, leaving one to wonder what Bart expects to obtain from his comparison with the various temperature time series. Then too, to begin with, the derivative is already 180 degrees out of phase with the MLO CO2 record. I don’t think he has a valid argument, but I’m sure he’s had lots of fun making graphs.

          • Bart says:

            E – Just say you know nothing about signal processing, and let it go. It’s painful.

          • E. Swanson says:

            Bart wrote:

            Just say you know nothing about signal processing, and let it go. It’s painful.

            Yeah, I can’t claim to be an expert on that subject, but at least I know that a moving average is a rather poor digital filter. I used a better filter in my latest attempt at doing science.

            However, you apparently don’t understand the basic situation, thus your claim of cause and effect is highly suspect. As noted by others, the annual CO2 variation shows a clear influence from the El Nino cycle in the NH. Remember also that the SH doesn’t contribute much to the annual cycle in the NH, as the two atmospheric reservoirs are rather isolated because of limited cross equatorial transport. I demonstrated this effect with THIS GRAPH. The oceans provide a large buffering to the whole process as well and are said to be not in equilibrium with the slowly increasing temperature.

            Trying to sort out which of these processes are leading the other appears to be your goal, but what you’ve presented so far leaves me unconvinced. Perhaps you have another, more detailed analysis which doesn’t rely on the Wood for Trees math.

            So, I ask again, Which came first, the chicken or the egg?

          • Bart says:

            Of course you’re unconvinced. You don’t even know that, given that the rate of change of CO2 is proportional to temperature anomaly, CO2 itself necessarily has a 90 deg phase lag with respect to temperature anomaly. There’s no question of which one is leading which.

            An average filter is a very good digital filter for many applications. For white noise, it is optimal. And, when comparing against average global temperature anomaly, it is the right one to choose, given that spatial averages are equivalent to temporal averages for a traveling wave.

            There’s no point in trying to convince you. You just don’t have the chops. This is my last word in this thread.

          • E. Swanson says:

            Bart, Fine with me. Do let us know when your peer reviewed paper is published in a journal dealing with the question.

          • fonzie says:

            (Swan Song has the last word)…

        • David Appell says:

          Again, the average ENSO state, as measured by MEI v2, over UAH’s record is nil (neutral).

          Therefore any net CO2 input to the atmosphere from the ENSO region is going to be near zero as well.

        • Craig T says:

          “But isn’t it also possible that the el ninos caused the increase in CO2?”

          A lot of people on here make a big deal of the fact that CO2 is slowly climbing while temperature goes up and down (with a slow warming trend.) That seems to solidly suggest El Ninos do not drive the increase of CO2.

          The link is to a graph of CO2 increase and TLT temperatures from 1990 to present. CO2 gets the slightest extra bump during the strong El Ninos of 1998 and 2016 but has little effect on the trend.
          https://i.imgur.com/2d27CFr.jpg

        • mick says:

          Well looking at the chart, the largest CO2 spikes were during el nino years.
          https://www.esrl.noaa.gov/gmd/ccgg/trends/gr.html

          • mick says:

            Whether this is due to off gassing from the Pacific due to warmer water or due to Warmer land temperatures causing accelerated biomass
            is uncertain. Either way, the measurements do indicate the El nino correlation

        • David Appell says:

          Mick says:
          But isnt it also possible that the el ninos caused the increase in CO2?

          No.

          The CO2 that’s been added to the atmosphere is well known to be anthropogenic in origin.

          Here’s that science:

          http://www.realclimate.org/index.php/archives/2004/12/how-do-we-know-that-recent-co2-increases-are-due-to-human-activities/

          • Dr Roys Emergency Moderation Team says:

            David, please stop trolling.

          • It’s not worth arguing about how the extra CO2 got into the atmosphere because there is no other logical explanation other than burning fossil fuels.

            The much more important argument is whether the added CO2 is good news, based on real science, or whether the CO2 is an evil boogeyman, as people with magical thinking who have joined the CO2 is Evil religious cult believe, such as Mr. Apple.

            A boogeyman for which the only cure is a more powerful socialist government, with strict regulations on energy, and high taxes on inexpensive dense sources of energy.

            And of course the $100 trillion Green New Deal, that reads like a Communist Manifesto, and would destroy the US economy relative to competitors such as China, who would never shoot themselves in their foot with their own Green New Deal … and after spending up to $100 trillion over 10 years, destroying the US economy, as we know it. would NOT even stop the worldwide growth of CO2 emissions !

            People who hate America, like Mr. Apple, want to destroy the US economy through the false demonization of CO2 — the staff of life.

      • Mark B says:

        Part of it is from stronger El Ninos since the late 1970s, part is (in my opinion) from increasing CO2. But other natural forcings could be involved as well. I’m willing to admit over half of it could well be due to increasing CO2. But there is no way to know.

        When you say “there is no way to know” are you implying that you believe that the various attribution techniques are necessarily faulty? If so, why?

        • Gordon Robertson says:

          mark….”When you say there is no way to know are you implying that you believe that the various attribution techniques are necessarily faulty?”

          I took Roy as claiming there is no way to know.

          • Mark B says:

            Gordon: I took Roy as claiming there is no way to know.

            My interest is how that position is justified versus the various studies claiming otherwise.

    • David Appell says:

      The 30-year linear trend of UAH LT v6 is +0.13 C/decade, same as the overall trend.

      • Richard M says:

        The UAH data starts during a -AMO and moves into a +AMO. Almost the entire data set is during +PDO conditions. These are warming influences. Just how much will be understood better when the AMO goes negative again.

        As Roy has indicated the trend itself is also influenced by major volcanic eruptions in the first half of the data.

        It is entirely possible that almost all of the warming we have seen is natural.

        • Chris says:

          I would say the opposite is true. The first 20 years contains more big + events and the last 20 years the opposite (a lot of la nina):
          https://www.esrl.noaa.gov/psd/enso/mei/

          • Richard M says:

            Chris, you think 2 major volcanic eruptions are big + events????? Interesting.

        • David Appell says:

          The average AMO index since 1979 is 0.03 — nothing.

          The average PDO index since 1979 is 0.31 — slightly positive.

          But the PDO index only measures SSTs north of 20 N latitude. And during the positive phase, the western Pacific becomes cooler and the eastern Pacific becomes warmer. How much of a net warming is that then?

          • Richard M says:

            David, using an average AMO is meaningless as it ignores the fact all the big negative values were in the first half of the data.

            Thanks for verifying the PDO has been mainly positive. What we know is the early 20th century warming was during +PDO conditions. This correlation implies that the +PDO can produce a rising global temperature. So far I’ve seen no evidence to dis-confirm that possibility.

      • Richard Greene says:

        Lots of CO2 has been added to the atmosphere since roughly 1940 — the only trend line that counts is one that starts in 1940.

        We’re interested in the temperature change as CO2 increases, not a short subset of the data since 1940.

        I know you HATE 1940 through 1975 because there was no warming.

        How inconvenient.

        Of course we have that phony excuse that air pollution overpowered the mighty CO2 for those 35 years.

        And then suddenly, in 1975, I suppose all the air pollution magically fell out of the sky (it did not but that’s what the CO2 is Evil Cult must believe), and then CO2 took over, warming the planet until the early 2000’s … which is where the temperature was in 2018.

        Starting in 1979 is data mining to avoid the lack of warming from 1940 through 1975 (at least until the repeated “adjustments” wipe away that cooling trend).

        Use surface data before 1979, and UAH data after 1979 — there is no logical reason to start in 1979, except for the nonsense reason that the satellite data just happened to start that year.

    • Svante says:

      Barry, it’s easier to say if you look at the long term, where oscillations such as ENSO cancels out.

      This is the latest science:
      https://www.sciencedaily.com/releases/2019/05/190522120501.htm

      We can now say with confidence that human factors like greenhouse gas emissions and particulate pollution, along with year-to-year changes brought on by natural phenomenon like volcanic eruptions or the El Niño, are sufficient to explain virtually all of the long-term changes in temperature,” says study lead author Dr Karsten Haustein. “The idea that oceans could have been driving the climate in a colder or warmer direction for multiple decades in the past, and therefore will do so in the future, is unlikely to be correct.”

      • Richard M says:

        Sounds a lot like confirmation bias. Essentially, it says if we assume are assumptions are correct (GHGs cause warming) than our assumptions match the warming we’ve seen and must be correct. LOL.

        Of course, that is beyond silly. It’s is basically claiming correlation IS causation. And this gets published? The field of climate science is looking more ridiculous every day.

      • Svante, that is Science Daily nonsense.

        No one knows what caused the warming since the 1970s.

        The :confidence: in the Science Daily quote is not justified.

        • David Appell says:

          We do have data on what’s causing warming, and of course almost of it is due to aGHGs:

          “Increases in greenhouse forcing inferred from the outgoing longwave radiation spectra of the Earth in 1970 and 1997,” J.E. Harries et al, Nature 410, 355-357 (15 March 2001).
          http://www.nature.com/nature/journal/v410/n6826/abs/410355a0.html

          Radiative forcing measured at Earths surface corroborate the increasing greenhouse effect, R. Philipona et al, Geo Res Letters, v31 L03202 (2004).
          http://onlinelibrary.wiley.com/doi/10.1029/2003GL018765/abstract

          “Observational determination of surface radiative forcing by CO2 from 2000 to 2010,” D. R. Feldman et al, Nature 519, 339343 (19 March 2015).
          http://www.nature.com/nature/journal/v519/n7543/full/nature14240.html

          • Dr Roys Emergency Moderation Team says:

            David, please stop trolling.

          • Nothing has happened to the climate in the 20th and 21st centuries that could not have had 1–% natural causes … unless you are a member of the CO2 is Evil Cult, where any bad news about the climate is blamed on CO2, and even the good news (slight warming in the past 150 years) is twisted into bad news, by claiming the pleasnat warming is realluy just the beginning of a climate crisis already in progress.

            This is the magical thinking of gullible people!

            Usually leftists (I repeat myself).

            Natural climate change has been in progress for 4.5 billion years, and has been powerful enough to cover Canada with an ice glacier, and melt all the ice on the planet.

            It’s YOUR job to explain, and you have failed miserably so far, why YOU ARE SO SURE natural climate change suddenly became unimportant in the mid-20th century, and no longer matters, and how, magically, man made CO2 took over as the “climate controller” !

            The 1910 to 1940 warming is not blamed on man made CO2 … so why would a similar warming in the same century, from 1975 to 1998, have a completely different cause ?

            I know, because YOU SAY SO –based on the junk science of your CO2 is Evil Cult !

            If enough government bureaucrats with science degrees say something, it just has to be true … at least in your imagination.

          • Nate says:

            Surprise, another laundry list of strawmen from Richard-not-so-Green.

            ‘Its YOUR job to explain, and you have failed miserably so far, why YOU ARE SO SURE natural climate change suddenly became unimportant in the mid-20th century’

            Nobody is saying natural has stopped. But glaciation this century was not in the cards anyway.

            ‘The 1910 to 1940 warming is not blamed on man made CO2 so why would a similar warming in the same century, from 1975 to 1998, have a completely different cause ?’

            There is more than one way to skin a cat. And there is more than one way for Earth to warm. Both natural and humans are needed to account for 20th century warming, even in 1910-1940.

            ‘If enough government bureaucrats with science degrees say something, it just has to be true’

            Most climate scientists are not bureaucrats, nor work for the govt. And they are from all over the world.

      • Svante says:

        Anyway, temperature corresponds to ln(CO2) long term, as predicted by physics. That’s the thick black line here:

        Berkeley Earth Results

        Possibilities:
        – The temperature increase forced more CO2 out of chimneys.
        – Emitted CO2 disappeared down a hole but was replaced by natural sources to the same amount.
        – Physics and all types of measurements are wrong.
        – Physics is wrong, it is something else, don’t know what, but it happens to match.

        I was wrong on climate change

        • JDHuffman says:

          Svante says: “…temperature corresponds to ln(CO2) long term, as predicted by physics.”

          Wrong Svante. You should do some real research on your hero. Besides his racism, he was also good at self-promotion. He got involved with the early formation of the bogus Nobel Prize Committee, and got himself a “Prize”.

          False religions are so tricky, huh?

        • Gordon Robertson says:

          svante….”Anyway, temperature corresponds to ln(CO2) long term, as predicted by physics. Thats the thick black line here:”

          That is a bad theory based on speculation. It contradicts the Ideal Gas Law and is based on the GUESS that 0.04% CO2 in the atmosphere can warm it.

          The 0.04% is for all CO2 which is 96% from natural sources. If CO2 has some miraculous way of warming the atmosphere that warming should have occurred long before the stupid IPCC notion that it has suddenly warmed since the pre Industrial era.

          As Akasofu has claimed, the IPCC erred by ignoring re-warming from the Little Ice Age which can pretty well account for all warming since 1850.

          • bdgwx says:

            The radiative forcing behavior of CO2 does not contradict the IGL. The IGL in no way forbids a molecule from emitting or abs**bing infrared photons.

            The ln(ΔCO2) law is based on 100+ years of laboratory experiments, infrared spectroscopy, molecular and quantum physics theory, paleoclimate studies, contemporary warming trends, etc.

            Of the 410 ppm of CO2 in the atmosphere about 130 ppm got there by way of anthroprogenic behaviors. That means about 68% is accounted for by natural processes.

            The IPCC has not ignored the LIA. Rewarming is not a cause. It is just a term used to describe a scenario in which the temperature trend increases immediately following a decrease. Both the initial decrease the subsequent increase could be caused by any number of factors. The trick is figuring out what those factors are and in what quantity they contributed to the trend.

          • Bart says:

            “Of the 410 ppm of CO2 in the atmosphere about 130 ppm got there by way of anthroprogenic behaviors.”

            It didn’t.

            “The ln(ΔCO2) law is based on 100+ years of laboratory experiments, infrared spectroscopy, molecular and quantum physics theory, paleoclimate studies, contemporary warming trends, etc.”

            Inappropriate extrapolation of controlled small scale experiments to a massive, complex, uncontrolled system + confirmation bias.

          • Nate says:

            ‘It didnt.’

            Speculation, not fact.

            Don’t mix those up.

          • Svante says:

            Gordon, I thought I had mentioned this once before.

            Global warming occurs when input power exceeds output power.
            Power is energy per time unit.
            Neither the ideal gas law nor 0.04% will give you a measure of power. They are completely useless for this.

          • Dr Roys Emergency Moderation Team says:

            “Global warming occurs when input power exceeds output power.”

            No, according to you guys warming can happen even if the input and output power remain unchanged:

            http://www.drroyspencer.com/2019/06/uah-global-temperature-update-for-may-2019-0-32-deg-c/#comment-355524

          • Svante says:

            What do you think?

          • Bart says:

            “Speculation, not fact.”

            Fact.

          • Nate says:

            Well Bart, each time you come back, after lengthy critiques of your hypothesis, your certainty about it grows, though you bring no new evidence.

            Still just a correlation with no identified causation. And perfectly good alternative correlations that have identified causation.

            And yet it has risen from speculation to fact.

            Belief is a powerful force.

          • Bart says:

            It has always been fact.

          • David Appell says:

            Gordon Robertson says:
            That is a bad theory based on speculation. It contradicts the Ideal Gas Law and is based on the GUESS that 0.04% CO2 in the atmosphere can warm it.

            Reliably as stupid as ever.

          • Gordon Robertson says:

            bdg…”The radiative forcing behavior of CO2 does not contradict the IGL. The IGL in no way forbids a molecule from emitting or abs**bing infrared photons”.

            The IGL deals with pressure, temperature, volume, and mass. It’s clear from the relationship between the four that the mass of CO2 is far too small to have a significant warming effect.

            No one has proved otherwise using the scientific method.

          • Gordon Robertson says:

            svante…”Global warming occurs when input power exceeds output power.
            Power is energy per time unit.
            Neither the ideal gas law nor 0.04% will give you a measure of power. They are completely useless for this”.

            Power has nothing to do with it. We are talking about internal factors governing the temperature of a gas at a relatively constant volume and mass.

            Dalton’s law tells us that the total pressure is the sum of partial pressures of each gas. With a constant volume, temperature is proportional to mass percent. The mass percent of CO2, which is 96% from natural sources, is about 0.04%. That translates to a warming contribution of the same order, about 4/100 C.

            The heat into the system must be distributed in proportion to the IGL, which means in proportion to the mass percent of each gas. It’s obvious that N2 and O2 at about 99% of the atmospheric mass is controlling 99%+ of the heat.

          • Entropic man says:

            Gordon Robinson

            What mechanism is causing this recovery from the LIA?

            Where is the energy ∆ coming from?

          • Svante says:

            Gordon,
            Earth has heat gain from the Sun and heat loss to space.
            If the input heat transfer rate is higher than the output, the temperature must rise.
            Heat transfer rate is measured in energy per time unit.

            I don’t know why I’m saying this because you will never understand.

            You said mass but forgot specific heat capacity.
            Those can only slow the process down.
            The atmosphere has minuscule heat capacity, and there is plenty of power flowing through all the time.

          • David Appell says:

            Bart says:
            Of the 410 ppm of CO2 in the atmosphere about 130 ppm got there by way of anthroprogenic behaviors.
            It didnt.

            What is claimed without evidence can be dismissed without evidence.

          • David Appell says:

            Gordon Robertson says:
            Power has nothing to do with it. We are talking about internal factors governing the temperature of a gas at a relatively constant volume and mass.

            Still running on stupid.

          • Dr Roys Emergency Moderation Team says:

            David, please stop trolling.

        • Nate says:

          JD, so because Isaac Newton was a dick in many ways, his physics is wrong?

          Most of our science heroes have flaws, but their discoveries stand on their own.

        • Mick says:

          Priciples of Physics on the lab bench are different in a dynamic, integrated system with thousands of variables, some of which are unknown.

          • Svante says:

            Mick says:

            Priciples of Physics on the lab bench are different in a dynamic, integrated system with thousands of variables, some of which are unknown.

            The laws are the same, but yes it’s complicated.
            It’s like ray tracing and the finite element method combined.
            You need a computer program to help:
            http://climatemodels.uchicago.edu/modtran/

        • Bart says:

          “Possibilities:”

          Argument from ignorance, and failure to appreciate the dynamic nature of the system.

          • Svante says:

            Yes, I’m ignorant of any other plausible cause.
            I appreciate the dynamic nature, feed backs may alter the relationship.

          • Nate says:

            ‘Argument from ignorance, and failure to appreciate the dynamic nature of the system.’

            Failure to appreciate the difference between assertion and fact.

          • Bart says:

            “Yes, Im ignorant of any other plausible cause.”

            Do you believe this constitutes an argument in your favor?

          • Nate says:

            “Do you believe this constitutes an argument in your favor?”

            Actually Svante’s original statement was

            “Physics and all types of measurements are wrong,…something else, dont know what, but it happens to match.”

            Yes, this constitutes and argument in his favor.

          • Nate says:

            In all seriousness, Bart, in the past, the way we’ve learned that a science paradigm has been overturned is by an accumulation of hard evidence, all pointing in the same direction.

            If your hypothesis is correct, you ought to be able scan the literature each month and find some new supporting evidence, maybe in recent measurements of ocean carbon fluxes, satellite measurements of the CO2 distribution, sediments, tree rings, isotopes, ice cores, etc. Something.

            At the moment, the accumulating evidence is pointing to an anthro source for atmospheric CO2.

          • Bart says:

            There is no way around the temp-CO2 rate of change plot. It matches in every detail, both the short and the long term since accurate measurements at MLO began. It leaves little room for a significant impact from anthropogenic forcing.

          • David Appell says:

            Bart says:
            There is no way around the temp-CO2 rate of change plot. It matches in every detail, both the short and the long term since accurate measurements at MLO began. It leaves little room for a significant impact from anthropogenic forcing.

            What bananas. It’s humans who are putting all that CO2 into the atmosphere. Hence it’s humans causing the temperature rise.

            We need smarter skeptics.

          • Nate says:

            ‘There is no way around…the plot’

            This sounds just like JD with his GPE plot, and his horse.

            So, no new corroborating evidence? You claim you dont need it, ok.

            But no one else will ever be convinced without it.

            Sorry, that is how science works. It is not just belief.

            Because the ‘plot’ can be explained in other ways.

          • David Appell says:

            Bart says:
            Argument from ignorance, and failure to appreciate the dynamic nature of the system.

            Another meaningless reply from Bart, who doesn’t know how to address scientific questions, even if his life depended on it.

            Next?

          • Bart says:

            We need smarter skeptics and alarmists. In fact, we need smarter people in general. This is a slam dunk, and it’s just sitting out there, obvious to anyone with a brain.

          • David Appell says:

            Bart, I’ve never seen you make a rational argument. Ever.

            You only like to sit back and pronounce, like you’re the Queen of Mathematics.

            Did you study any physics, ever Bart?

            If you did, why don’t you ever show what you’ve learned.

            Besides using the word “affine” when you can, like none of us know what it means.

          • Nate says:

            ‘smarter skeptics and alarmists’

            How is it smarter or more skeptical to be

            more accepting of assertions without evidence?

          • Bart says:

            These comments are just weird.

        • Vostok ice core proxy studies show temperature peaks led CO2 peaks by hundreds of years, on average.

          Changing CO2 levels did not CAUSE changing temperatures in the past 500,000 years.

          If you want to believe climate physics changed in the 20th century, that’s your guess, but it is completely lacking scientific proof.

          “Authorities” asserting something to be true does not make it true.

          • Nate says:

            ‘Vostok ice core proxy studies show temperature peaks led CO2 peaks by hundreds of years, on average.’

            Yes solar insolation was the dominant Forcing for glaciation. So what?

            Same goes for seasonal oscillation of temp in the hemispheres.

            So what?

            You think there can be only one way to change Earth’s temp?

          • David Appell says:

            CO2 leads temperature such as during the PETM, and WHEN HUMANS ARE PUMPING IT DIRECTLY INTO THE ATMOSPHERE REGARDLESS OF THE TEMPERATURE.

            This issue is an intelligence test for deniers. Richard Greene failed it.

          • Dr Roys Emergency Moderation Team says:

            David, please stop trolling.

          • Very “intelligent”, Mr. Apple — June 4 at 4:55 — lot’s of ALL CAP words and a character attack on a third grade level — did you forget to take you anger management medications ?

      • Kristian says:

        Svante says, June 3, 2019 at 9:06 AM:

        Barry, it’s easier to say if you look at the long term, where oscillations such as ENSO cancels out.

        Stop saying ENSO when referring to the NINO indexes. ENSO is a much larger phenomenon than that narrow stretch along the equatorial East Pacific. That covers the Eastern signal of the ENSO phenomenon only, not the Western one.

        ENSO does not ‘cancel out’ over multiple decades:

        https://okulaer.files.wordpress.com/2019/02/oceanic-enso-map.png
        (WWPH = Warm West Pacific Horseshoe; EPCW = East Pacific Cool Wedge; WPWP = West Pacific Warm Pool; KOE = Kuroshio-Oyashio Extension; SPCZ = South Pacific Convergence Zone)

        https://okulaer.files.wordpress.com/2019/02/oceanic-enso.png

        https://okulaer.files.wordpress.com/2019/02/gl-ssta-vs.-oceanic-enso.png

        • Nate says:

          K, What’s your point, other than GW is also warming water in the central Pacific?

          ENSO, as measured by e.g. the SOI, or detrended NINO indices, still has a long term average of 0.

        • Svante says:

          Thanks for making that distinction Kristian, I wasn’t aware of it.
          I meant all those things that end with an ‘O’.
          They have no internal heat generation, so they can not generate a long term trend.
          Only a TOA imbalance can do that.

        • Dr Roys Emergency Moderation Team says:

          “Only a TOA imbalance can do that.”

          Or, the simple act of separating three identical objects.

    • Barry
      The global average temperature is not up +1 degree C in the past 30 years.

      Don’t make up numbers.

      But no matter what the trend is, the cause is “No one knows.”

      I noticed that in a comment by Mr. Spencer, he does not give that correct answer.

      And that is the primary problem with climate science — people with science degrees are afraid to say “I don’t know”, or “We don’t know”.

      There has been 4.5 billion years of climate change from natural causes, so why not assume recent climate change had natural causes too … until there is scientific proof of man made causes — merely asserting that over half the warming since 1950 had man made causes, as the IPCC does, DOES NOT MAKE IT SO.

      There is nothing in the temperature record from UAH, or elsewhere, that could not have had 100% natural causes.

      The ONLY natural warming that we think we can explain, are the 1998 and 2015/2016 unusually large local warming events in the Pacific Ocean, that we call El Nino’s, which have not yet been offset by equally large La Ninas.

      A global average temperature is non-linear data, so simple trend lines can be VERY deceiving.

      Note the large difference when the UAH trend line starts in 1979, which was a cool year, versus starting in 1980, which was a more typical year.

      Since 1980, perhaps only a +0.3 degree C. increase — I would say that is statistically insignificant, although all compilers of global average temperature statistics claim much smaller margins of error ( I don’t believe them, especially the surface “measurements / infilling ).

    • Eben says:

      Remember last month when I said it was just El Nino dead cat bounce going back down already ?
      And you said “Thus speak the skeptics.”
      you remember that ?
      That was awesome

    • Gordon Robertson says:

      barry…”What is the cause of the 1 degree C temperature rise in the lower troposphere over 30 years?”

      Why would anyone be nice to an ‘outsider’ troll, whose main purpose on Roy’s blog has been to bend fact to his alarmists views?

      There has been nothing anywhere near a 1C warming since 1989. Warming is measured from the baseline, not from 1989, where temperatures were below normal due to cooling events. The best you could claim is a 0.3C warming and even that would be a misrepresentation of fact.

      The IPCC and Roy’s graph on this site shows a flat trend from 1998 – 2012, extending to 2015. The question you might ask is why the level of the flat trend at around 0.2C occurred in the first place following a major El Nino in 1998.

      At this point, to be accurate,one might observe a temporary warming trend that has been declining since 2016.

      You might also consider the baseline range of 1980 – 2010. That favours data earlier in the series making current data appear warmer than it likely is.

      You might also ask why all the warming spikes are associated with El Ninos.

      Better to understand the question before leaping to conclusions.

      • bdgwx says:

        GR said…”You might also consider the baseline range of 1980 2010. That favours data earlier in the series making current data appear warmer than it likely is.”

        It doesn’t matter what the baseline is. The delta-T anomalies compute out exactly the same. The only thing the baseline changes is the point in time in which the anomalies are zero’d.

        GR said…”You might also ask why all the warming spikes are associated with El Ninos.”

        This is already pretty well established. It is because the heat flux processes from ocean to atmosphere increase drawing energy out of the ocean and putting it into the atmosphere.

        One interesting point in this regard is that if there were no energy imbalance on the planet then the warming atmosphere should come at the expense of a cooling ocean. But what is actually observed is that the oceans (plus the cryosphere, lithosphere, etc.) continue to warm even as the atmosphere warms. That means that there is an energy imbalance causing the entire planet to warm. It’s not just heat moving from one medium to another.

        • JDHuffman says:

          bdgwx, there is no energy imbalance.

          You were unable to understand the flaws in your bogus energy balance diagram, remember?

      • David Appell says:

        Gordon R wrote:
        You might also consider the baseline range of 1980 2010. That favours data earlier in the series making current data appear warmer than it likely is.

        Trends are independent of baselines.

        (When are you going to learn this?)

    • Bindidon says:

      Hi barry, I reply here to Roy Spencer’s remark:

      ” OH, I ALMOST FORGOTpart of the 40-year rise is from the fact two major volcanic eruptions (El Chichon and Pinatubo) were in the early part of the record, which has inflated the 40-year trend.”

      Mr Spencer is obviously right: El Chichon’s eruption and its stratospheric aerosol spread were so strong that they litterally annihilated in UAH’s record the effect of the 1982/83 El Nino edition (which was, according to MEI/V2, even stronger than 1998/98 and of course stronger than 2015/16).

      May I recall here the work done years ago by Santer, Bonfils & al. ?

      They extracted ENSO and volcano signals out of the old RSS3.3 series (nearly equivalent to UAH6.0) and computed for 1979-2013 a residual warming of 0.086 C / decade, i.e. 70 % of RSS3.3’s trend at that time (0.124 C).

  2. finnpii says:

    This global number is the lowest this calendar year, but still higher than every month last year.

  3. LevelX says:

    GLOBE NHEM. SHEM.
    +0.32 +0.29 +0.25

    Shouldn’t +0.29 +0.25 be +0.27 in average?

    • Scott R says:

      LevelX I think your right. Looking back at all the data, the globe temp is always close to the average of nh and sh. Roy can you correct that? I’m not going with this data until I hear something more.

    • Gunnar says:

      agree all 3 values can´t be correct.

    • Scott R says:

      Perhaps the SH number was mis-typed. Should be 0.35? I’m in disbelief that the NH would be 0.39 with that huge negative USA departure.

      • E. Swanson says:

        Scott R wrote:

        Im in disbelief that the NH would be 0.39 with that huge negative USA departure.

        The US lower 48 is only 1.8% of the total area of the globe and the Mid-Western portion is only about 1/2 of that. The Arctic Ocean is larger and Dr. Spencer’s area labeled “Arctic” is larger still. Look at that big increase over the Arctic for February thru May, if you want to understand what’s happening.

        • Scott R says:

          E. Swanson well I was right, so… When you are splitting hairs over tenths of 1 deg C globally, a +1 deg c change in one region does matter. As for the arctic, I see huge swings. Since 2016, the arctic has actually cooled twice the speed as the globe. So are you saying we are getting colder? 😉

          • David Appell says:

            Since 2016, the arctic has actually cooled twice the speed as the globe.

            And you think this is significant how?

          • Dr Roys Emergency Moderation Team says:

            David, please stop trolling.

          • Scott R says:

            David Appell,

            It is significant in the fact that on the way up during the El Nino, the media was sure to advertise the fact that the arctic was warming twice the speed as the globe, so it is with my great honor to announce that on the way down, the arctic is indeed COOLING twice the speed of the planet. The arctic is like a leveraged stock. Global temp departure moves show up amplified in the arctic. I’m just giving you guys a taste of your own medicine.

    • good catch, my bad. SH was +0.35 C. I fixed it.

  4. Thomas P. Burwell says:

    finnpii, yes, you may have heard of El Nio…

  5. Thomas P. Burwell says:

    El Nino. (apparently the comments don’t work with my cell’s special characters)

  6. Dr Roys Emergency Moderation Team says:

    Day 88. As far as I’m aware, all the regulars here are still in denial…

    • E. Swanson says:

      Yeah, the denialist trolls are still ignoring reality:

      India heatwave temperatures pass 50 Celsius

        • E. Swanson says:

          Historically, India does experience high temperatures before the arrival of the monsoon. Those latest temperature readings may yet be eclipsed, since, as the article points out, the monsoon appears to be running late this year. India has seen much worse problems due to a collapse of the monsoon, which have caused great famines. Only now, their population is over a billion people. Cross your fingers…

      • yet, the alarmist trolls are not yet cancelling out the denialist trolls.

        • CoRev says:

          Dr spencer, “yet, the alarmist trolls are not yet cancelling out the denialist trolls.” Especially not in number of comments, but the AGW skeptics certainly make more sense than the alarmists who just cite IPCC and worse science.

          Anyone still showing a hockey stick graph without understanding data details are just ignorant.

        • David Appell says:

          Roy, you are completely wrong about the MEI trend.

          PLease don’t pretend you haven’t noticed these replies. You’re supposed to be a scientist, interested in the truth.

      • JDHuffman says:

        Swanson claims: “…the denialist trolls are still ignoring reality.”

        Derogatory labels and name-calling are such fun. It always reminds me of junior high school….

        But we may be in need of some new labels. “Denier” has been so over-used, it’s lost effectiveness.

        How about some simple labels such as:

        (Based on increasing pseudoscience)

        Realist —–> Lukewarmist —–> Warmist

        Works for this Realist.

        • bobdroege says:

          JD,

          if you believe this

          “Derogatory labels and name-calling are such fun. It always reminds me of junior high school.”

          Why do you drink from that well so often??????????????????

          • JDHuffman says:

            bob, you have a history of jumping in with nothing but insults, misrepresentations, or false accusations. That’s why you have zero credibility.

            Here, you can not present one time where I have called Swanson anything but “Swanson”. He is always preverting my name, but I never act as childishly.

            That’s why you, and others like you, have zero credibility.

            Nothing new.

          • bobdroege says:

            So JD,

            Are you denying that you have called me names?

            You are a name calling denier.

          • JDHuffman says:

            bob just can’t control himself…..

        • Realist > Lukewarmist > Warmist = that’s no fun

          How about:

          Realists — People who don’t like to make waves — Computer Game Loving Science Deniers

    • Dr Roys Emergency Moderation Team says:

      …that the Green Plate Effect

      • E. Swanson says:

        The Green Plate Effect fits experimental results and standard engineering practice, both of which the Huffingboy/DRs Empty sock puppet continues to deny. How long before it jumps to it’s lunatic digression about the Moon’s rotation?

        • JDHuffman says:

          Swanson, the 3-plate example completely destroys your pseudoscience.

          Plates together:
          244 K…244 K…244 K Ein = Eout = 400 Watts

          Plates slightly apart:
          244 K…290 K…244 K Ein = Eout = 400 Watts

          For you to remain in denial just verifies your ignorance of thermodynamics.

          Nothing new.

          • bobdroege says:

            We should just table the green plate effect and the moon rotation discussion.

          • Dr Roys Emergency Moderation Team says:

            Ball4’s inadvertently admitted you guys are wrong on the GPE. If just one of the rest of you would have the honesty to admit you are wrong, too, then I would certainly be happy to leave it.

          • E. Swanson says:

            Huffingboy, You seem to have forgotten your cartoon 3 plate model with the magic green arrows. That the middle plate warms after separation confirms the Green Plate Effect, which is, the outer plates act as insulation, thereby requiring an increase in the middle plate’s temperature to achieve steady state. Is the sock puppet having an empty head problem?

          • Dr Roys Emergency Moderation Team says:

            Nope, nobody. What a shame.

          • JDHuffman says:

            Swanson insults and misrepresents: “Huffingboy, You seem to have forgotten your cartoon 3 plate model with the magic green arrows.”

            Wrong Swanson, I didn’t forget anything. That link you provided is the correct solution to 3 plates. Your incorrect solution violates the laws of thermodynamics.

            Swanson continues with his confusion: “That the middle plate warms after separation confirms the Green Plate Effect, which is, the outer plates act as insulation, thereby requiring an increase in the middle plate’s temperature to achieve steady state.”

            Wrong Swanson, a colder (“downstream”) black body is NOT an insulator to a warmer (“upstream”) black body. The colder black body would absorb everything emitted by the hotter black body.

            Swanson resorts to insults, because his pseudoscience fails: “Is the sock puppet having an empty head problem?”

            Nothing new.

          • bobdroege says:

            JD and DREMT

            We have told you several times what is wrong with your solution to your green plate effect problem.

            The blue plate can not emit 800 watts/m2 and be at the same temperature as the green plate emitting 400 watts/m2.

            Sorry try again using real physics and real laws of thermodynamics, not the ones you make up.

          • Dr Roys Emergency Moderation Team says:

            “We have told you several times what is wrong with your solution to your green plate effect problem.”

            Yes, you keep trying that. Unfortunately, you keep forgetting that this is us telling you what is wrong with your solution; and you criticizing alternative solutions won’t make your solution right.

          • JDHuffman says:

            bob, the blue plate is NOT emitting 800 Watts/m^2.

            The green plate is NOT emitting 400 Watts/m^2.

            In the correct solution, all plates are emitting 200 Watts/m^2. You are WAY off.

            As we recommended before, get an adult to help you understand the simple diagram.

          • E. Swanson says:

            Huffingboy/DRsEMT the sock puppet appears to be confused.
            Is Huffingboy’s comment, it notes:

            “Plates slightly apart:
            244 K290 K244 K Ein = Eout = 400 Watts”

            Is this the correct statement, or is it’s later comment:

            “blue plate is NOT emitting 800 Watts/m^2.
            The green plate is NOT emitting 400 Watts/m^2.
            In the correct solution, all plates are emitting 200 Watts/m^2.”
            In the correct solution, all plates are emitting 200 Watts/m^2.

            the correct statement? With it’s 3 plate model, for the Blue plate to be at 290K, it would be emitting 800 watts over an area of 2 meters, for 400 watts/m^2. Given that it’s confusing watts and watts/m^2, I suggest it still doesn’t understand the physics.

          • Dr Roys Emergency Moderation Team says:

            bobdroege confuses watts and watts/m^2, and so E. Swanson accuses JDHuffman of confusing watts and watts/m^2, just for quoting him. Then E. Swanson drags my name into his own confusion, for no reason.

          • Norman says:

            JDHuffman

            And neither you nor the incredibly stupid DREMT will actually do an experiment with three plates in a vacuum. If you did such an experiment you would find the heated center plate would warm up above the temperature where it was when it can conduct the energy it gains away through the green plates.

            Endless trolling form the tag team. No confirmation, no testing, no links to valid science. A very stupid cartoon is all they have to support the endless troll nonsense that goes on from thread to thread.

          • Dr Roys Emergency Moderation Team says:

            OK, Norman. 3 things:

            1) the cartoon is not the debunking.
            2) the debunking involves the belief that you people have that the plates together will be 244 K…244 K…244 K, and then 244 K…290 K…244 K when separated, despite there being no change in energy in/out.
            3) you declaring what you think would happen in an experiment that hasnt taken place (one with 3 plates) is not the same as you actually doing the experiment.

          • Nate says:

            Baiting and trolling. Baiting and trolling. The bait is old and rotten and stinks.

            No thanks.

          • bobdroege says:

            Ah,I forgot to divide by two,

            Still the blue plate is emitting 400 watts/m2 from both sides and the green plate is emitting 200 watts/m2 and they are at the same temperature.

            This is wrong, they can’t be at the same temperature and emit different amounts.

          • Dr Roys Emergency Moderation Team says:

            “Given that it’s confusing watts and watts/m^2, I suggest it still doesn’t understand the physics.”

          • bobdroege says:

            Or,

            One could say the blue plate is emitting 800 watts and the green plate is emitting 400 watts and since they are both the same size and the same temperature that can’t be correct.

            Failure Will Robinson

            Failure Evacuate

            Failure Self Destruct Eminent

          • Dr Roys Emergency Moderation Team says:

            “…and you criticizing alternative solutions won’t make your solution right.”

          • bobdroege says:

            Dr Empty

            You say

            “Yes, you keep trying that. Unfortunately, you keep forgetting that this is us telling you what is wrong with your solution; and you criticizing alternative solutions wont make your solution right.”

            You bet, but your criticisms involve photons reflecting, or energy not being transferred from cold to hot, or temperature increasing without addition of energy, or other misunderstandings of physics.

          • Dr Roys Emergency Moderation Team says:

            Our criticisms of your solution do involve the fact that you have temperature increasing without addition of energy, yes.

          • bobdroege says:

            Dr Empty,

            Your failure to address the criticisms of your solution speaks for itself.

            Step up defend your solution.

            Theoretically or experimentally.

            You have not done either.

            At least the flow and temperatures balance in the blue plate at 290 solution.

          • bobdroege says:

            Dr Empty

            So you say

            “Our criticisms of your solution do involve the fact that you have temperature increasing without addition of energy, yes.”

            So which law of thermodynamics does that violate?

            reminds me of one of my favorite Stacy Keach quotes

            “Nun”

          • Dr Roys Emergency Moderation Team says:

            “Your failure to address the criticisms of your solution speaks for itself.”

            Yes. It speaks to the fact that it has already been explained to you many, many times, whilst you still sit here pretending not to understand how all three plates could be emitting the same, and pretending not to know what the extra green arrows are meant to represent, etc.

            Whilst your failure to address the criticisms of your solution, and continual attempts to try to pass the buck onto criticizing alternatives, also speaks for itself.

          • Dr Roys Emergency Moderation Team says:

            “So which law of thermodynamics does that violate?”

            Scroll down, click on the “…ked.”, and one of your own team members will fill you in on the details.

          • jdhuffman says:

            Swanson, bob, Nate, and Norman are still unable to understand the simple diagram.

            No wonder they are also lost in the relevant physics.

            No surprise.

          • bobdroege says:

            Ball4 at least got it right that upon separation the green plates decrease in temperature until the blue plates heats up due to receiving energy from the green plates.

            But he is wrong that there is a first law violation as there still is the same energy in as out.

            It’s like heating your house in winter with the windows wide open, it’s going to be cold inside as the heater can’t keep up, but close all the windows and the temperature goes up with no increase in energy.

          • bobdroege says:

            JD,

            I admitted I made that mistake

            “Still the blue plate is emitting 400 watts/m2 from both sides and the green plate is emitting 200 watts/m2 and they are at the same temperature.”

            That’s what your diagram shows and it is incorrect and violates several physics laws which you refuse to address.

            Can you get with the program and address the deficiencies in your diagram?

            Your diagram is still wrong and Franco is still dead.

          • Norman says:

            Dr Roys Emergency Moderation Team

            Since you do not seem to be a bot like Mike Flynn I can only think you are the dumbest poster on this blog.

            How incredibly unthinking does one have to be to post this point? “Our criticisms of your solution do involve the fact that you have temperature increasing without addition of energy, yes.”

            Idiot that you are. You have addition of energy. The blue plate is continuously heated with some energy source, always added.

            If you wrapped the heated blue plate with insulation do you think it would not increase in temperature? If you remove conduction from cooling the blue plate it will increase in temperature.

            You already have a two plate experiment that shows the blue plate increasing in temperature. Why would you think this would not take place again if you added another plate? It would do even more than one plate. Why do you have to be such an unthinking nitwit? It is not pleasant posting to someone who has zero thought ability, no logic and no reasoning ability.

            JDHuffman has an excuse, he is an annoying troll. Are you one too or just really stupid?

          • JDHuffman says:

            Norman says: “You have addition of energy. The blue plate is continuously heated with some energy source, always added.”

            bob says: “Still the blue plate is emitting 400 watts/m2 from both sides…”

            Norman and bob continue to demonstrate their ignorance of the relevant physics, and their inability to learn.

            Nothing new.

          • bobdroege says:

            JD,

            “bob says: “Still the blue plate is emitting 400 watts/m2 from both sides…””

            I learned it right off your stinking diagram

            It’s there clear as green and blue

          • Dr Roys Emergency Moderation Team says:

            When I said to bob, in response to one of the things that he listed:

            “Our criticisms of your solution do involve the fact that you have temperature increasing without addition of energy, yes.”

            He said:

            “So which law of thermodynamics does that violate?”

            bob accepted it, you see.

            Norman comes along, and says:

            “How incredibly unthinking does one have to be to post this point? “Our criticisms of your solution do involve the fact that you have temperature increasing without addition of energy, yes.”

            Idiot that you are. You have addition of energy. The blue plate is continuously heated with some energy source, always added.”

            Norman doesn’t accept it. Norman and bob are in what is known as “disagreement”.

            bob also said that Ball4 was “wrong”.

            Now, I am going to wait for Norman to argue it out with bob, and Ball4 to come and argue it out with bob, too.

            Something tells me I might be waiting an awfully long time…

          • JDHuffman says:

            I couldn’t tell is bob was color blind, or stupid.

            “It’s there clear as green and blue”

            He’s obviously not color blind….

          • bobdroege says:

            Dr Empty,

            You seem to think there is a disagreement between me and Norman, there is none, I said energy in equals energy out, meaning there is addition of energy which is what Norman said, and I agree with him.

            I would like you to defend your arguments, not try to say that your opponents are in disagreement.

            If you could please point out the first law violation when the blue plate heats up when the green plates are separated. Thanks in advance, but I think the universe will undergo heat death before you understand thermodynamics.

          • bobdroege says:

            JD posts the most wonderful sentence

            “I couldnt tell is bob was color blind, or stupid”

            A blue arrow 200 watts/m2 plus a green arrow 200 watts/m2 equals 400 watts/m2.

            See here chum, they are vectors pointing in exactly the same direction so you add them together and multiply by the cosine of the angle between them.

            Which gets you 400 watts/m2

          • bobdroege says:

            Dr Empty,

            Remember this is what you said, I was quoting you,

            “Our criticisms of your solution do involve the fact that you have temperature increasing without addition of energy, yes.”

          • JDHuffman says:

            bob says: “A blue arrow 200 watts/m2 plus a green arrow 200 watts/m2 equals 400 watts/m2.”

            The two green arrows would be added vectorially, resulting in

            +200 – 200 = 0.

          • Dr Roys Emergency Moderation Team says:

            …and the gloves are off, again. “Dr Empty”…

            Of course there’s no disagreement, bob! There never is…

            …apart from the one I pointed out.

          • bobdroege says:

            JD,

            There you go, in defense of your diagram, off you go violating the properties of photons.

            They do not interact with each other so

            “The two green arrows would be added vectorially, resulting in

            +200 200 = 0.”

            Is impossible. Or magic photons.

            Anyway I was saying one blue arrow in the same direction as one green arrow sum to 400

          • bobdroege says:

            Yeah Dr Empty, if you want to be known by your real name instead of a stupid moniker, change the name by which you post.

            Both Norman and I are disagreeing with you, not with each other.

            This is the hill your argument dies on.

            “Our criticisms of your solution do involve the fact that you have temperature increasing without addition of energy, yes.”

            That’s your post, don’t lay that boogie woogie on me.

          • Dr Roys Emergency Moderation Team says:

            bob, you can stamp your feet if you want to, but your 10:36 am comment isn’t going anywhere.

          • JDHuffman says:

            bob, you’re so confused you’re arguing with yourself!

            That’s when you’re really funny.

          • bobdroege says:

            JD and Dr Empty,

            As they say

            You have been pwned

            All your base belong to us

            Three strikes, you are out

            Game set match

          • Dr Roys Emergency Moderation Team says:

            Good for you, bob. So who did you beat? Norman, Ball4, or yourself?

          • bobdroege says:

            You Dr Empty,

            You are refusing to defend your position against the criticism I have offered.

            In particular this statement of yours

            “Our criticisms of your solution do involve the fact that you have temperature increasing without addition of energy, yes.”

            Which you have tried to deflect into a disagreement between norman an me.

            It’s your statement and it’s wrong.

            Because you can add insulation to make something warmer with out the addition of additional energy.

            You have abandoned the argument so you have lost.

          • Dr Roys Emergency Moderation Team says:

            Yes, you could add insulation.

            But anyway, back to discussing the GPE…

          • bobdroege says:

            Dr Empty,

            You haven’t as of yet

            Why should you start now?

          • Dr Roys Emergency Moderation Team says:

            Sure, bob. Whatever you say.

          • bobdroege says:

            So Dr Empty.

            explain how your model of the blue plate effect is correct.

            I won’t hold my breath.

            Since you haven’t responded to any of the criticisms of it, I assume you have none.

          • Dr Roys Emergency Moderation Team says:

            OK, bob.

          • bobdroege says:

            So you are back to counting days then

          • Dr Roys Emergency Moderation Team says:

            #2

            OK, bob.

          • bobdroege says:

            Dr Empty,

            So you can count, after all I must respond to get my $0.10 per post as a paid AGW shill.

            So you don’t want to try and get your argument out of the rubbish bin?

          • Dr Roys Emergency Moderation Team says:

            #3

            OK, bob.

      • Nate says:

        And off we go, thanks once again to the denier trolls, not the paid AGW sophists.

        • JDHuffman says:

          Nate, the plates nonsense was started here by “barry”, as I recall. Maybe he will own up, but likely not. Swanson tired to keep it alive with his failed “demo”.

          So, if you’re calling barry and Swanson “denier trolls”, I won’t get in your way….

        • Nate says:

          Barry said nothing about plates…

          You gonna offer anything new, or same old rinse and repeat?

          • JDHuffman says:

            You may have the wrong “barry”. Just as you have most everything wrong.

            Nothing new.

    • Dr Roys Emergency Moderation Team says:

      …is de

    • Dr Roys Emergency Moderation Team says:

      bun

    • Dr Roys Emergency Moderation Team says:

      ked.

    • David Appell says:

      DREMT: Ironically, you’re the biggest troll here, posting the most useless messages that say nothing.

      No one is leaving on your account.

  7. E.Derksen says:

    Last year there was no El Nio

  8. Richard M says:

    This is what I predicted would happen (my actual prediction was .34). The reason for this drop is two fold. First, in NH summer the effect of the +AMO is reduced. Second, the current El Nino is slowly fading away.

    Hopefully, the El Nino will be replaced by neutral conditions for the rest of the summer which would give us another reasonable data point for comparing global temperatures.

  9. Darwin Wyatt says:

    Barry,

    It’s a return to the Holocene average. Don’t jinx it.

  10. Mac says:

    Another month…more of the same….no significant warming since 1998….

    • David Appell says:

      UAH LT trend since mid-1998 = +0.11 C/decade

      • John F. Hultquist says:

        If this continues, in another 50 years I may get ripe tomatoes before they freeze in September.
        Can we speed this up? I can’t wait that long.

        • bobdroege says:

          I have given up on tomatoes, they don’t go with thanksgiving dinner.

          It gets too hot at night where I live for tomatoes to set fruit.

          • Mick says:

            Is that due to climate change or that you live in an area that isn’t hospitable to tomato growing? I couldn’t grow lemons this year. Nor any year, so the climate hasn’t changed where I live. Therefore, not global

          • bobdroege says:

            No, I used to have no problems growing tomatoes. I used to get buckets full, now it’s hard to get more than a few from each plant.

            It’s climate change.

            Plus one hardiness change since 1990

            https://www.arborday.org/media/map_change.cfm

          • mick says:

            No problem where I live. I still grow the same things that I grew 30+ years ago, and cant grow the things that I couldn’t grow back then. Therefore it isn’t global. CO2 is pesky and sneaky. It warms and cools some areas and leaves others untouched by its magical hand.
            I will admit slight variation from year to year, but nothing that I would say is un-natural. Just natural variation. I spend lots of time outdoors. Tomatoes are growing like crazy as they do every year. Had a later start though due to the cold spring.

          • David Appell says:

            camel, the past is great, isn’t it? (I agree)

            Robert Hass ‘Nostalgia locates desire in the past where it suffers no active conflict and can be yearned toward pleasantly.’

          • Dr Roys Emergency Moderation Team says:

            David, please stop trolling.

        • David Appell says:

          John F. Hultquist says:
          If this continues, in another 50 years I may get ripe tomatoes before they freeze in September.

          How high up in the troposphere do you garden?

          If you want a longer growing season, move south instead of expecting the entire world to warm up just for your convenience.

        • gallopingcamel says:

          You need a greenhouse like the one my family operated in South Wales. I never tasted tomatoes half as good before or since.

      • Richard M says:

        David, the UAH LT trend since mid-1997 is .08 C/decade. I can only chuckle at your attempted cherry pick.

        • Craig T says:

          “David, the UAH LT trend since mid-1997 is .08 C/decade.”

          June 2001 – May 2019: .122 C/decade
          June 2000 – May 2019: .127 C/decade
          June 1999 – May 2019: .141 C/decade
          June 1998 – May 2019: .111 C/decade
          June 1997 – May 2019: .081 C/decade
          June 1996 – May 2019: .095 C/decade
          June 1995 – May 2019: .097 C/decade
          June 1994 – May 2019: .100 C/decade
          June 1993 – May 2019: .113 C/decade

          “I can only chuckle at your attempted cherry pick.”

          • Richard M says:

            Craig, 1996 or 1997 are probably the best years to minimize the influence of ENSO. Naturally, you would think that was a cherry pick. Why is that?

          • bdgwx says:

            RM, I’m going to argue that using all of the available data is the best way to avoid cherry-picking and minimize ENSO influences. That means the trend from 1979 to present should suffice.

          • Richard M says:

            bdgwx, when a noisy data record is as short as the UAH data then all data selection is a cherry pick of sorts. You can bet if we all of a sudden had another major volcanic eruption that flattened the trend we’d hear all about how it shouldn’t be included.

          • David Appell says:

            I cherrypicked nothing — I addressed Mac’s claim that “no significant warming since 1998.”

          • Bindidon says:

            Craig T

            You see in the answer of Richard M

            “Craig, 1996 or 1997 are probably the best years to minimize the influence of ENSO.”

            that not only Robertson ignores how trends are computed.

            Starting a trend with a strong El Nino peak is the best way to MAXIMIZE the influence of ENSO. The same holds of course when starting the trend in front of a strong La Nina.

            I repeat one more time (of about 100 I guess):

            Extracting ENSO and volcano effects gives a residual trend of about 70 %.

            Thus the residual trend of UAH6.0 LT for 1979-2019 is
            0.128 * 0.7 = 0.09 C / decade

          • Richard M says:

            Bindidon,

            your comment is silly. starting in 1996-97 does not start the trend “with a strong El Nino peak”. It starts the trend with a very balanced period of El Nino and La Nina. Now that you admit you’ve lied about this over 100 times, are you going to retract those lies?

          • Nate says:

            Richard M.

            Indeed the trend since mid 1997 is .08

            But the error bar on that trend is 0.146.

            Thus the data are consistent with a range of trends from -0.07 to +0.25.

            According to this useful calculator:

            http://www.ysbl.york.ac.uk/~cowtan/applets/trend/trend.html

      • Another wrong Mr. Apple comment:

        1998 is a poor year to use as a starting point for a linear trend because of the large EL Nino heat release.

        But you chose 1998 ( “mid-1998”, whatever that means ) anyway, Mr. Apple, even though it was a warm year, and then you lied about the trend since then, assuming no one would check the numbers.

        The global average UAH LT temperature anomaly in 1998 was +0.48 degrees C., calculated by adding up the 12 monthly anomalies (all positive) and dividing by 12.***

        The global average UAH LT anomaly for May 2019 was +0.32 degrees C.

        And not one month since January 2018 reached +0.48 degrees C.

        May 2019, therefore, was COOLER than the 1998 average, using UAH LT data, so there WAS NO WARMING TREND SONCE 1998, Appleman — post a correction immediately,
        or I’ll huff and I’ll puff, and then … I’ll look for my oxygen tank.

        *** While calculating the 1998 average anomaly, I was reading the Wall Street Journal, eating lunch, being scolded by the wife, and writing an article on astrophysics, so the number could be slightly off./

        • Craig T says:

          But you chose 1998 ( mid-1998, whatever that means ) anyway, Mr. Apple, even though it was a warm year, and then you lied about the trend since then, assuming no one would check the numbers.

          The global average UAH LT temperature anomaly in 1998 was +0.48 degrees C., calculated by adding up the 12 monthly anomalies (all positive) and dividing by 12.***

          The global average UAH LT anomaly for May 2019 was +0.32 degrees C.

          And not one month since January 2018 reached +0.48 degrees C.

          DA gave the correct trend for the time period. You compared the average anomaly for 1998 (including the second highest El Nino in the satellite data) to the last year and a half. I know you don’t like trends but that doesn’t mean he lied about it.

          In your financial newsletter do you tell people to stay away from stocks with a solid upward trend for 40 years because they’re lower than their all-time high price?

          • Once again a linear trend line can be very misleading for non-linear temperatures.

            The trend line is using very warm period in late 2015 and early 2016, which has nothiong to do with Co2, to create a misleading trend.

            1998 was a warm year.

            2018 and 2019 are not as warm.

            That is what people need to know.

            They don’t need to be misled by capturing the 2015 / 2016 EL Nino heat peak that was temporary, and unrelated to CO2.

            One can count on the global warmunists to cherry pick whatever data seems to support their climate crisis fairy tales … when anyone looking at the UAH temperature chart would see something different — the UAH global average temperature in 2018 and 2019 is similar to the early 2000’s — everything else is noise, especially temporary El Nino heat peaks.

          • bdgwx says:

            RG, How do you know the warming in 2015 and 2016 wasn’t caused by CO2? How do you know the behavior of ENSO isn’t being modulated by CO2?

          • JDHuffman says:

            “How do you know the warming in 2015 and 2016 wasn’t caused by CO2?”

            CO2 can not cause warming.

          • David Appell says:

            Does carbon dioxide absorb infrared radiation?

          • JDHuffman says:

            Does carbon dioxide emit infrared radiation?

          • Nate says:

            “The trend line is using very warm period in late 2015 and early 2016, which has nothiong to do with Co2, to create a misleading trend.”

            It is also using very cool periods, 2008-09, and 2011-2013, due to strong La Ninas, which have nothing to do with CO2 either, to create a misleading impression of a ‘pause’.

            You see how that works both ways, Richard?

        • David Appell says:

          I addressed Macs claim that no significant warming since 1998.

      • bdgwx says:

        I can confirm DA’s +0.11C/decade from mid-1998. That’s exactly what I get when I use Excel’s LINEST function. And it wasn’t DA that cherry-picked 1998…it was Mac.

        • You can’t confirm anything bdgwx.

          1998 was an unusually warm year.

          Look at 2018 and 2019 so far.

          Not as warm as 1998.

          Not even one month in 2018 and 2019 was as warm as the average monthly anomaly in 1998.

          Stop trying to confuse with deceptive “trend lines” — these are nonlinear temperature data that should not be described with linear trend lines — that’s basic math.

          You might want to use common sense for a change bdgwx and stop relying on confusers !

          A five second glance at Mr. Spencer’s temperature chart in this article quickly shows 1998 was an unusually warm year … and 2018 and 2019 was not as warm. PERIOD.

          • Mick says:

            Now go look at the mid 1930s. What do you see? Hot Af

          • bdgwx says:

            Well, yes. I think I can confirm this calculation. I just double checked to make sure I didn’t make a mistake. DA’s math appears to be correct. The linear regression trendline is +0.111C/decade from mid-1998 to present.

            Wouldn’t computing a trendline from all available data points be consistent with “common sense”; or at least more so than computing a trendline from just two data points?

          • Bart says:

            Common sense would tell you that a trend line one these data is rather arbitrary.

          • David Appell says:

            Richard Greene says:
            1998 was an unusually warm year.

            Mac said no warming SINCE 1998. He was wrong.

          • Dr Roys Emergency Moderation Team says:

            No, Mac said no significant warming since 1998. Assuming he means statistical significance, he would be correct. The Skeptical Science temperature trend calculator gives 0.076 +/- 0.157 for 1998-2019, UAH v6.0 TLT:

            https://skepticalscience.com/trend.php

          • David Appell says:

            DREMT – thanks. good to know you accept SkS’s science. This will be useful.

          • Dr Roys Emergency Moderation Team says:

            In fact you need to go back to 1993-2019 and prior before the trends are statistically significant.

            1994-2019 is not statistically significant. A 25-year trend. I guess if it gets to 30 years, people will…still just ignore it.

          • David Appell says:

            1994-2019 is not statistically significant.

            Numbers?

          • Dr Roys Emergency Moderation Team says:

            Can be found by using the trend calculator.

      • Nate says:

        John F, sorry bout the tomatoes, they are better from the garden..Maybe start em in a cold-frame?

        Enjoy your mild summers.

    • Mac says:

      Thank you Dr Roys Emergency Moderation Team. Well done! I was wondering when someone would finally read the key word…..significant!!

      ….and yes I do mean statistical significance….

      June 4, 2019 at 2:35 AM

      No, Mac said no significant warming since 1998. Assuming he means statistical significance, he would be correct. The Skeptical Science temperature trend calculator gives 0.076 +/- 0.157 for 1998-2019, UAH v6.0 TLT:

      https://skepticalscience.com/trend.php

      • David Appell says:

        So why are you asking about time intervals that can’t deliver statistically significant trends?

        PS: You also need to include auto correlation.

        • Mac says:

          It is correct that David did not cherry pick data. I chose this interval from an observation which is apparent by simply eyeballing the graph and is confirmed by statistical analysis.

          The main point is that 1998 or earlier may mark the beginning of a lengthy hiatus which had been thought to have ended a few years ago….

          This begs the question …why is it so?….amongst a number of possibilities, including that temperature data sets need to be much larger, (given the noise in the system maybe in the range of hundreds of years)is the possibility that the hypothesis of an increase in greenhouse gas concentration resulting in detectable temperature increases is incorrect….

          That we need additional time to establish a significant trend is proof that the science is not settled…

          • Craig T says:

            “That we need additional time to establish a significant trend is proof that the science is not settled”

            No, that’s proof that there are a lot of factors affecting temperature so that the data is noisy. Most of the factors cancels out over 30 years leaving any long term trends.

      • Dr Roys Emergency Moderation Team says:

        David, please stop trolling.

  11. Andrew stout says:

    *cough* The polar Vortex LAST Winter already went down the memory hole, apparently.

  12. CO2isLife says:

    Dr Spencer, do you have any plans to update the review of the IPCC Models that you created a few years back? The Teen Age Super Sleuths made a video of it, and I was thinking that they may want to redo their research with more current data. I think they are working on a state science fair project.
    https://youtu.be/K_j1NoBRQ6U

    • bdgwx says:

      That publication does not provide evidence that says naturally modulated agents can account for the warming from 1993 on. What it does is demonstrate that ENSO and volcanic forcing cannot account for it; at least not all of it or even most of it. Furthermore, when adjusting the CMIP model inputs to use known quantities instead of assumed quantities the spread between modeled and observation is reduced.

      Anyway, here is a recent publication from most of the same authors. In it they argue that the signal-to-noise ratio for an anthroprogenic signal is higher than that for a natural signal. There are criticisms of their methodology and conclusions so its important to consider this as just another line of evidence instead of some smoking gun. I’m only presenting it here it to demonstrate that Santer et. al. firming in the mostly-anthroprogenic camp.

      https://www.nature.com/articles/s41558-019-0424-x

    • David Appell says:

      John Bills says:
      Santer proved natural warming from 1993 on:

      Baloney.

    • Bindidon says:

      John Bills

      You completely misunderstood and therefore misinterpret the work of Santer, Bonfils et alii.

      Their original intent was to give a proof that climate models underestimated the effects of volcanic aerosols.

      To do this, they firstly had to remove all ENSO signals out of RSS3.3 LT.

      That is why they were able to compute a residual RSS3.3 trend without any ENSO or volcano influence for the entire RSS period, i.e. 1979-2013 (research date).

      The trend was 0.086 C / decade, i.e. roughly 70 % of the original RSS trend.

      To which source this residual warming has to be attributed is of course subject to intense debate.

      By no means did Santer & Co write this would have any natural origin.

      Here is their detailed research paper:

      https://dspace.mit.edu/bitstream/handle/1721.1/89054/solomon%206%20Santer_etal_NatGeo_Article_File_22jan2014.pdf?sequence=1&isAllowed=y

      Look at page 52.

  13. ren says:

    High pressure in the Eastern Pacific may increase the amount of tropical storms in the Gulf of Mexico.
    http://tropic.ssec.wisc.edu/real-time/mtpw2/product.php?color_type=tpw_nrl_colors&prod=conus&timespan=24hrs&anim=html5

  14. ren says:

    Texas must prepare for a tropical downpour this week.

  15. Yuri says:

    Yes, that is, after the software update to V4.
    V3.3 rss was in agreement with uha untill the end of 2018.

    • bdgwx says:

      What elements of RSS 3.3 do you feel are superior to 4.0?

      Do you think the use of a numerical weather prediction model to estimate the diurnal temperature adjustments was a better choice?

      Do you think using a combined land+ocean diurnal offsets was a better choice?

      Do you think suspect data should still be included?

      Do you think the inclusion of NOAA-19 and METOP-B datasets made things worse?

      http://www.remss.com/measurements/upper-air-temperature/

      • Yuri says:

        No, I just think the difference of those two looks bloody suspicious.
        Sure you can always ‘justify’ some changes, but introducing a slight downward trend pre 2000 and a steeper upward for 2000 until now is just too convenient.

        • Bart says:

          That is one of the subtler ways in which confirmation bias manifests. Individually, each change can be defended to some degree or other. But, other defensible changes that could be made tipping the balance the other way are not pursued.

          • Yuri says:

            Well, possibly. Have to say tho, this is not subtle anymore, it is pretty much in your face when you look at the difference.
            It’s almost as if someone had to desperately get rid of the hiatus.

          • Bart says:

            Noble Cause Corruption. They’re so sure they just must be right that, in their minds, they are justified in cutting corners.

          • David Appell says:

            Bart says:
            That is one of the subtler ways in which confirmation bias manifests. Individually, each change can be defended to some degree or other. But, other defensible changes that could be made tipping the balance the other way are not pursued.

            This claim says nothing whatsoever.

            Can you provide a substantial analysis of RSS’s data?

            I suspect not.

          • Bart says:

            Just close your eyes and ignore the obvious, and maybe it will go away.

          • David Appell says:

            Bart, that’s perfect — an inconsequential reply that is the perfect example of all your replies.

            You’re a lightweight.

          • Bart says:

            Meh. You’re a failed science dilettante who couldn’t cut it in the big leagues, and was relegated to writing about what your betters could produce.

        • bdgwx says:

          That’s why it’s almost always best have multiple groups publishing the same class of data and then draw conclusions from a blend of all of them.

          • Yuri says:

            That is of course true. But I take objection with introducing a new version of the same product all of a sudden, that generates a trend of 1C/century right where everyone thought the hiatus was, and that with an rsquared of 0.85.

          • David Appell says:

            All of a sudden???

            Do you know when RSS started?

            Why don’t you tell us?

          • Dr Roys Emergency Moderation Team says:

            David, please stop trolling.

        • barry says:

          Yuri,

          Does it not also concern you that UAHv5.6 was closer to the surface data sets and then with the change to v6 was suddenly a lot cooler from 2000?

          Here’s the difference.

          http://www.woodfortrees.org/plot/uah5/mean:12/plot/uah5/mean:12/from:2000/to:2017.5/trend/plot/uah6/to:2017.59/mean:12/plot/uah6/mean:12/from:2000/to:2017.5/trend

          Would anything prevent you being suspicious about this large change?

      • Yuri says:

        So to clarify,
        let d = v4 – v3.3, the difference of the two rss versions.
        We then find by OLS fit:

        a)for the first 20 years
        d(month) ~ 2.82e-04*month – 0.034,
        introducing an additional trend of 0.034C/decade.

        b)for 2000 until now (where the hiatus took place)
        d(month) ~ 8.31e-04*month + 0.032,
        introducing an additional trend of 0.1C/decade.

        c) for the whole of the record we have
        d(month) ~ 5.49e-04*month – 0.066,
        introducing an additional trend of 0.066/decade.

    • Gordon Robertson says:

      yuri…”Yes, that is, after the software update to V4.
      V3.3 rss was in agreement with uha untill the end of 2018.”

      RSS were always cozy with NOAA. I think they just got tired being away from home and returned to the fold.

      • Yuri says:

        But as the song makes it clear, sweet home is in Alabama, surely.

      • David Appell says:

        Gordon Robertson says:
        RSS were always cozy with NOAA.

        Gordon can’t even begin — can’t even begin — to analyze RSS’s methods, or say anything intelligent about them.

        “Gordon Robertson — as stupid as ever.” It’s the first lyric to his theme song.

      • Dr Roys Emergency Moderation Team says:

        David, please stop trolling.

    • Bindidon says:

      Yuri

      It is always interesting to see in comments that some people criticise decisions making things warmer and vice-versa.

      You remind me June/July 2011, as Roy Spencer communicated the transition to UAH5.6, with as result a substantial warming. All the people I call the Pseudoskeptics criticised him and preferred the ‘cooler’ RSS3.3 series…

      *
      Please explain UAH6.0’s sudden drop wrt other temperature series (Had-CRUT4, GISSTEMP, and… UAH5.6), between 2000 and 2005:

      https://tinyurl.com/y6b2tn7r

      Any idea, Yuri?

  16. Bobdesbond says:

    “Latest Global Temp. Anomaly” near the top of the page has not been updated with the May anomaly.

  17. Lawrence Miller says:

    Notes on 12 years left… Scientific ideas and theories are constantly changing. Probably most of you are aware now that our direct ancestors have been roaming the planet for more than a million years, most of that time without the luxury of electricity or shopping malls. In that million years they have had to deal with the most extreme climate changes this planet could muster, as well as other natural disasters. They survived it, I suspect that we will as well. Most of the global temperature data that we are looking at now is really about weather, climate can only be measured by long intervals. If you look at graphs of the climate for the last million years you can see some sharp temperature spikes as well as sudden drops into glacial cold. A closer look at these spikes seems to show that in fact these rapid changes were not so rapid. A quick plunge of 10 degrees into a full blown ice age, seems to have occurred a number of times. However these drops took place over a period of thousands of years, easily 2 to 4 thousand years for the sharpest declines, this works out to 1 degree colder over a period of 200 to 400 years! Probably someone will say that one big volcano could effectively cause a temperature drop of 2 degrees in only a few years, even so it may be that the temperatures would eventually rebound back to where there were. My point being that it may be centuries or even thousands of years before man has to worry about a changing climate.

    • David Appell says:

      Lawrence Miller says:
      Scientific ideas and theories are constantly changing.

      No they’re not.

      When did the laws of thermodynamics last change?
      Maxwell’s equations?
      Planck’s law?
      The spectroscopy of greenhouse gases?
      Newton’s laws?

      It’s exactly because these theories HAVEN’T changed that makes them so useful.

      • Lawrence Miller says:

        hard to argue with someone who thinks that scientific ideas and theories have not changed in the last 2000 years…

        • David Appell says:

          Last 2000 years! Ha.

          We had something called the Enlightenment

          Address my points. Which of these fundamental physical theories/ideas have changed in the last 100 years?

          • Lawrence Miller says:

            As this has been answered by a few others, and I have already said that I was thinking of changes in ideas and theories in the field of archeology where new discoveries often mean that theories must change to absorb new information. To answer your other question as to whether or not I have ever read any books that concern climate…
            I am now 71 and I have been seriously studying climatology for over 50 years. Early on in my research I discovered H. Lamb’s classic Climatology text book, Climate: Past Present and future. Hubert Lamb was one of the leading climatologists of his time, indeed described in one obituary as the greatest. These books are still an invaluable primer to todays obsession with Climate. In the past I have looked into the question of climate and longevity, and spent part of my life looking for the ideal place to live in terms of climate. After more than 40 years on a remote island in the South Pacific, “ideal” takes on a different meaning.

    • Gordon Robertson says:

      lawerence…”They survived it, I suspect that we will as well”.

      Maybe not all will survive. The alarmist cult will gather in a South American jungle and drink poisoned Kool-Aid.

      I am sure there are a few hardy humans still left who will survive.

  18. PhilJ says:

    Barry,

    “What is the cause of the 1 degree C temperature rise in the lower troposphere over 30 years?”

    Lower troposphere temps follow ocean surface temps, so the better question is what has caused a rise in ocean surface temps…

    Imo, increased a*bs*orp*tio*n of uv, especially in the southern hemisphere and at higher latitudes is likely the culprit…

    http://ozonedepletiontheory.info/ImagePages/TempClOzCO2-5.html

    • David Appell says:

      The temperature change in the LT over the last 30 years hasn’t been 1 C, it’s about 0.4 C (according to UAH; higher according to RSS).

      • PhilJ says:

        DA,

        If you wish to quibble over the amount of warming, I suggest you respond to Barry, that’s his figure…

        As for what I posted, one nice thing about that hypothesis : it doesn’t require playing fast and lose with the 2LOT…

        carry on trolling…

  19. SAMURAI says:

    Within the next 3~4 years, the earth will experience the start of a 30~50 year cool cycle caused by: the PDO, AMO, NAO and AOO all entering or approaching their respective 30~year cool cycles, and a 50~year Grand Solar Minimum event which has already started.

    The next La Nia cycle will also be strong one, which will negate most of the 2015/16 Super El Nio warming spike and will cause UAH to hit -0.2C

    After the next La Nia cycle finishes, Dr. Spencer needs to update the CMIP5 vs. UAH6 graph, which will show CMIP5 model model projections at +1.2C vs. UAH6 reality at near 0.0C…

    By the end of Trumps second term, CAGW will be laughed at.

    • Eben says:

      You just named five climate drivers The climate modelers never heard off

    • Gordon Robertson says:

      samurai…”Within the next 3~4 years, the earth will experience the start of a 30~50 year cool cycle caused by: the PDO, AMO, NAO and AO…”

      I think it may have started tonight here in Vancouver, Canada. After a week or so of warm evenings I find myself wearing a jacket indoors while the space heater warms.

      • Scott R says:

        SAMURAI we are on the same page with these natural cycles! El Nino is the most important forcer on the planet, and it is about to hand it to us. This will make it clear that we haven’t left behind the -0.2 deg c floor. The FEB 2016 global temperature peak occurred during the strongest El Nino of the last 40 years. The 2 peaks since then have made a perfect down trend line as we received our 2 expected El Nino harmonic waves after the major cycle. Now that the harmonics are on the way out, the 11 year El Nino forcer will combine with 3.6 yr, 2.2 yr harmonics and produce the strongest la nina since 2008. It will probably take 1 1/2 years to be realized. We will be below baseline for the next election. lol

        • SAMURAI says:

          Scott-san: I agree. The current very weak El Nino cycle has already crashed and burned.

          There will be a period of ENSO neutral conditions, but the next La Nina cycle will be a strong one which will likely start around the end of 2020. There is usually at least one strong La Nina every 10 years, and the last string one was 2010/11.

          The NAO already seems to have started its 30-year cool cycle, and the AOO and AMO will soon follow.

          Since 1850, global temp trends have always followed the 30-year warm/cool ocean cycles.

          The added cooling from the 50-year Grand Solar Minimum will simply add to the coming 30-year cooling from cold ocean cycles; a double whammy…

          CAGW will soon have to tossed on the trash heap of failed hypotheses.

          • Scott R says:

            Let’s hope that the Holocene doesn’t end with all of this. We also have the magnetic field weakening, increasing galactic cosmic rays, cloud nucleation, snow and ice, reflection.

          • David Appell says:

            The Holocene ended several decades ago.

          • Scott R says:

            David Appell the global temperature is +0.32 c. We are still in the Holocene. We just barely equalized the medieval warm period as we came out of the little ice age. These temperature spikes are very common in the proxy data. Let me give you some examples. About 5000 bc during the Atlantic we had a similar temperature spike. At the beginning of the sub-boreal there was a temperature spike. At the end of the Sub-Boreal we had a temperature spike. All 3 of these happed as the obliquity of the earth actually decreased. The overall trend has been lower since 10,000 years ago with sudden temperature spikes followed by the reassertion of the primary trend. In the mean time CO2 naturally went up just like it has been for 8000 years. So what is your explanation if CO2 drives the climate, how is it that the proxy data clearly shows we were dropping as CO2 increased? How do you even rationalize the existence of the little ice age? Go ahead and tell me it’s volcanos. Then I will tell you volcanos are a function of increased galactic cosmic rays, which are a function of the sun’s 400 year cycle.

    • David Appell says:

      SAMURAI says:
      Within the next 3~4 years, the earth will experience the start of a 30~50 year cool cycle caused by

      When are you people ever going to learn??

  20. Aaron S says:

    Now the most likely outcome is we watch the next hiatus in L Trop global temp until the next stairstep upward at a major El Nino.

    Maybe there will be a surprise, but if not, Im getting bored with climate change. It is almost certainly a luke warm pattern for global warming (.13C to .15C per decade).
    I am enjoying watching the Obama era solar and wind proponents wake up to the reality they wasted trillions on a dead end technology that doesnt change anything and nuclear is the only potentially viable option.

    So globally we will double CO2 and we should prepare for Eemian like warming as a base case. I think I rank this outcome as a moderate issue for humanity and less significant than population growth, deforestation, plastic pollution, wealth divide, stability of globalization, nuclear war, war, trade war, super microbes, etc.

    https://en.m.wikipedia.org/wiki/Eemian

    • Svante says:

      Yes, if the Paris agreement works it will be like the Eeminan when: “Sea level at peak was probably 6 to 9 metres (20 to 30 feet) higher than today”.

      • fonzie says:

        Svante, that’s a walk in the park as compared to the relatively rapid destruction of demographic changes. Look at how fast Detroit became rubble as compared to the slow creep of sea level rise. If sea level rise is all you guys got (and it is), then y’all are going to be greeted with one great big collective yawn…

        • Scott R says:

          fonzie… Detroit is my home town. The city has not recovered since the riots in the late 60s. The down town area is starting to come back. The subs are completely safe / fine. That said, our winters have been getting colder for 17 years! That’s what woke me up to all of this.

          • fonzie says:

            “The down town area is starting to come back.”

            Scott, that’s very nice to hear. i live in downtown new orleans, so there are similar issues going on here. Population maxed at about 600,000+ around 1960 compared to your 2 million circa 1950. Before Katrina, there was a lot of talk about n.o. racing with Detroit in becoming the nation’s first ex-city. What some people don’t realize is that if you don’t have enough people from one culture to replace the culture that is moving out, then the city dies. That said, New Orleans has been a much easier urban renewal fix than Detroit. i really loved that film about the guy who hit a golf ball all the way across Detroit. (folks who are interested in this sort of thing ought to see that one)…

          • David Appell says:

            How much taxpayer money has been sunk into New Orleans since Katrina?

          • JDHuffman says:

            DA, speaking of “taxpayer money”, what portion of your income is from welfare?

          • Svante says:

            fonzie says: “i live in downtown new orleans”

            Great if you ignore sea level rise:
            https://tinyurl.com/y5m4k769

        • Svante says:

          Yes fonzie, sea level rise is slow, and then there are a long list of risks.
          My main concern is collapsing eco systems, the speed of change makes it hard for species to adapt.

          • JDHuffman says:

            Svante, your concern should be over your imagination taking you away from reality.

    • JDHuffman says:

      Arron S has the ability to think for himself.

      Svante does not have such ability.

    • David Appell says:

      Few humans lived in the first Eemian.

      What will it be like when 7-10 B humans live in the 2nd Eemian?

  21. gallopingcamel says:

    bdgwx, June 3, 2019 at 7:20 PM

    You said:
    “RG, How do you know the warming in 2015 and 2016 wasnt caused by CO2? How do you know the behavior of ENSO isnt being modulated by CO2?”

    Like Al Gore you have the cart before the horse. Temperature controls CO2 over at least the last 850,000 years (thanks to Henry’s law ). Don’t take my word for it. EPICA papers by Jouzel et al. and Luethi et al. provide persuasive evidence given that they show CO2 lagging temperature by 500 to 800 years:
    https://diggingintheclay.wordpress.com/2013/05/04/the-dog-that-did-not-bark/

    • bdgwx says:

      I’m not questioning whether CO2 is dependent upon T. We already know it is. I’m questioning the claim that T is not dependent upon CO2. The assertion of the former does not by itself preclude the assertion of the later. Claiming as such is called a affirming a disjunt. In other words, proving that CO2 is dependent upon T does not disprove that T is dependent upon CO2. In reality we know that both statements are true. If you disagree then you need to present evidence (and a lot of it) that shows precisely how T cannot be dependent upon CO2.

      • JDHuffman says:

        bdgwx, CO2 can not raise the temperature of a system. You have been mis-informed, and apparently want to remain that way.

      • Bart says:

        bdgwx

        “…proving that CO2 is dependent upon T does not disprove that T is dependent upon CO2.”

        It strongly implies it.

        If CO2 depends positively on T, and T positively on CO2, then you have a positive feedback loop. Since such a dynamic evidently has not produced a runaway condition in all the history of the Earth, we must conclude that, in the aggregate, one or the other effect must diminish under appropriate conditions.

        Right now, we can see that the rate of change of CO2 has been proportional to appropriately baselined temperature anomaly since at least the advent of MLO measurements. Over that amount of time, a significant positive sensitivity of temperature to CO2 would have produced an exponential rise. There is no evidence of such accelerating increase in temperature. We must conclude that, over this interval, the aggregate sensitivity of temperature to CO2 is essentially nil.

        This does not invalidate the greenhouse effect. It merely says that it is dependent upon other variables than mere concentration. E.g., the convective state of the atmosphere plays a role. Convection of heat can transport it to high altitude, whence it can be released without impedance by the IR blocking effects of CO2 and water vapor. Increasing CO2 concentration can actually aid the release, and cancel out the impact of blockage of IR emitted from the surface.

    • David Appell says:

      gallopingcamel says:
      Temperature controls CO2 over at least the last 850,000 years (thanks to Henrys law ).

      Did temperature control CO2 during the PETM? (no)

      The hyperthermals that followed? (no)

      Does temperature control CO2 today? (no) We’re pumping CO2 into the atmosphere regardless of the temperature.

      I can’t believe how many deniers, like camel, cannot grasp this simple point. It’s really an IQ test.

      • gallopingcamel says:

        You look at the same facts but draw perverse conclusions.

        You said:
        “Did temperature control CO2 during the PETM? (no)”

        The answer is “YES”.

        You said:
        “Does temperature control CO2 today? (no)”

        The answer is “YES”.

        Henry’s law was in operation during the Petm (~55 million years ago) and it still operates today so the sensitivity constant remains at 12 ppm of CO2/degree Centigrade.

  22. gallopingcamel says:

    @David Appell,

    Lawrence Miller said:
    “Scientific ideas and theories are constantly changing.”

    You said:
    “No theyre not.”

    All those theories you listed are wrong. There was only one of those theories that Einstein thought might survive the test of time and that was “Classical Thermodynamics”.

    • Lawrence Miller says:

      When I wrote that, I was actually thinking about recent theories concerning the divergence of Neanderthal and Denisovan lineages from a common ancestor… now we are beginning to ask whether or not Neanderthals were more sophisticated than previously assumed, their image is changing as well as theories about the length of time that they may have been in existence, all of which, I see as relevant to the question of our ability to adapt to a changing climate.

    • Norman says:

      gallopingcamel

      I generally like your posts but I will need you to explain what you mean with the word “wrong”.

      The theories David Appell listed:

      “When did the laws of thermodynamics last change?
      Maxwells equations?
      Plancks law?
      The spectroscopy of greenhouse gases?
      Newtons laws?”

      Which of these is wrong? Newton’s laws are still used to this day only needing to be modified when light speed is approached.

      They still used the laws of thermodynamics all the time.

      I would hope you explain further what your “wrong” means as I do not currently agree with your opinion at all.

      • JDHuffman says:

        Norman. “wrong” occurs when you try to pervert and corrupt the laws.

        For example, when you try to claim that you can violate 2LoT, if you say you are not violating 2LoT.

        That’s “wrong”.

        • Norman says:

          JDHuffman

          Do you have to interject your idiotic troll comments all the time? You don’t have a clue about anything science and make up most of what you don’t know. You have no clue about any laws of physics. You don’t even accept the Moon rotates once per orbit which is firmly established. You don’t understand the definition of rotation. Many have tried to explain it to you. All have failed. You don’t have enough knowledge to realize you know nothing.

          But you pretend to be an expert at things but you don’t have a clue about the things you think you know.

          I was hoping gallopingcamel might respond, not you.

          • JDHuffman says:

            More insults, false accusations, and misrepresentations from Norman. That’s all he has.

            Nothing new.

          • Norman says:

            JDHuffman

            More trolling from you. If I had the desire to be an ignorant blog troll (like you) your posts would have some value. I could learn how to bait the lure to attract the fish (unsuspecting poster that thinks you are a rational skeptic) then I would reel them in and generate hundreds of pointless troll posts just keeping an endless stream of posts going.

            That is why I would rather have a NON-Troll poster like gallopingcamel respond to my questions. I want to engage in a useful, meaningful discussion on science. I am not interested in learning your troll tactics. So if you just bug out and troll another poster, maybe gallopingcamel will be kind enough to reply in a thoughtful fashion.

          • JDHuffman says:

            More insults, false accusations, and misrepresentations from Norman. That’s all he has.

            And, he can’t learn.

            Nothing new.

          • Norman says:

            JDHuffman

            Troll on troll it is what you do. Nothing new with you.

          • JDHuffman says:

            Just one line?

            Norman’s typing class must be over….

        • David Appell says:

          Ger*an, dumb as ever, thinks the 2LOT is somehow violated.

          This is the easiest scientific point ever, and still he is too stupid to understand it and the role of an adiabatic system.

          Clearly it’s willful ignorance.

      • David Appell says:

        camel thinks electrical engineers no longer use Maxwell’s equations.

    • David Appell says:

      gallopingcamel says:
      All those theories you listed are wrong.

      Maxwell’s equations are wrong?
      Planck’s law?

      Too stupid to even address.

      PS: Did you find that missing 150 W/m2 yet, camel?

  23. ren says:

    The shift of the troposphere to the North Pole is certainly not due to the increase in CO2.
    http://ds.data.jma.go.jp/tcc/tcc/products/clisys/STRAT/gif/zu_sh.gif

  24. Geoff Sherrington says:

    The boring talk here about the gradients of various linear regressions and the lack of agreement shows that the linear least squares method has limited use and low value unless you want to stir up arguments.
    Do a mini paradigm shift. Start to ask, “what do we really want to get out of these UAH monthly numbers so capably presented by their authors headed by Drs Spencer & Christy?
    A few seconds glance shows that there is likely to have been some time series warming rather than cooling, from the start of the data collection.
    Next, it is currently impossible to attribute this warming to any physical climate effect, in part or in whole, because of the lack of major variables proven to influence the warming and related matters whether one should expect linear or non linear relationships with primary drivers. So little is known that we can disregard linear least squares because they are near useless for most approaches. So, each new month, if not LLS, what? Some study of the meaning of “stochastic”? Or some less statistical work?
    My preference for analysis is to be guided from time to time by those most immersed in the data each month. Read what Drs Christy, Spencer & colleagues point to and see if you can extract more or deeper meaning from their monthly comments.
    Customary hard science, however, starts here with an author with a hypothesis and a set of observations to be examined against the new UAH data. (Read this in the narrow sense). If you are researching a hypothesis when an odd result happens one month, then consider a blog comment.
    Do whatever exciting, innovatory and interesting action you can create, but for mercy sake do not start again on the LLS regression of cherry picked time intervals that have overloaded Dr Roy’s past monthly global temperature updates.
    You have a chance to participate in leading edge science, yet so many of you leap in to reduce comments to the lowest level. Research in science does not advance that way – unless your dreary task in life is sabotage by stultification.
    A recent example of exciting observation comes from Tom Quirk writing on the Jo Nova blog this week. Set yourself an aim of surpassing his originality with your next posts on this Dr Roy Spencer blog or just go away. Geoff

  25. Andrew stout says:

    @Entropicman

    Yes, the question IMO, STARTS there: In the proxy reconstruction we see veritably break-neck reversals in averages , cycles, and cycles within cycles. The downfall of the Mann Graph and replacement with Ljungqvist-esq varitability beggs the question what got us going since LIA. I have a fun parlor game where I show a graph of the CO2 graph beginning in ~175O, unlabeled without scale, explain to the table that this shows the increase in C02 we believe to be true, then ask anyone to peg when 1975 is, after I quote the IPCC about when AGW began, and most people, without fail, admit they want to logically pick the beginning of the curve, although they sense a trap. It certainly looks like a single function -to me- not like a system in stasis disrupted by evil, unnatural forces, whatever our CO2 contribution happens to be. At that scale and context there is no obvious inflection point. The *Failure of CO2 corrolation on some time scales being erased (such as the post 40’s cooling), and the failure of cause-effect being ‘backwards’ on a 100,000 year timescale in the ice cores, are yet more, wholly different arguments!

  26. Joseph Campbell says:

    Can anyone give me the baseline temperature (in degrees C) which is used in calculating the “temperature anomaly” used in the various plots and tables? Thanks…
    …JLC

    • JDHuffman says:

      JLC, remember these are atmospheric anomalies. I’ve seen the baseline for global LT, but don’t remember the exact figure–seems it was about 262 K.

    • Mark B says:

      For surface data sets there is typically an anomaly baseline per station per month so there isn’t a single baseline. Part of the rational for using anomalies is that station time series can be combined without explicitly compensating for differences in altitude, location, and sensor bias that affect the absolute temperature.

      • Gordon Robertson says:

        mark…”Part of the rational for using anomalies is that station time series can be combined without explicitly compensating for differences in altitude, location, and sensor bias that affect the absolute temperature”.

        You forgot to mention that anomalies help cheaters like NOAA fudge temperatures to please their masters in Washington.

    • bdgwx says:

      It’s different for different datasets. It can even be different for different plots of the same dataset depending on who the author of the plot is. The important point is that it doesn’t actually matter if you’re only concerned with ΔT and not absolute T.

      As an example Berkeley Earth uses the average from 1951-1980 which they compute as 14.184C±0.046.

    • Svante says:

      Joseph Campbell, the UAH baseline temperature is about -9 C: https://tinyurl.com/ybv7wdzr

      • David Appell says:

        Where does this graph come from?
        Who made it?
        Some blogger?

      • Gordon Robertson says:

        svante…”Joseph Campbell, the UAH baseline temperature is about -9 C:”

        Obviously Joe does not understand the relationship between temperature and altitude, or the AMSU units used on the sats. One of the AMSU channels covers right to the surface even though the averaged value from multiple channels may be rated at -9C.

        It’s simply a matter of extrapolating from that particular altitude to the surface. After all, that’s exactly what NOAA has done with the surface record but with a far less accurate extrapolation.

        NOAA is extrapolating temperatures to uncovered areas based on temperature stations up to 1200 kilometres apart. In some cases they are extrapolating temperatures to the entire Canadian Arctic based on one surface station. In California, they are extrapolation to the entire state based on three stations near the warmer coast.

        They are even using extrapolation retroactively. If they find a temperature they deem to be too high, they erase it and replace it with extrapolated temperatures from distant stations. They erased the entire record warming in the US during the 1930s.

        • Gordon Robertson says:

          sorry Joseph Campbell I misread svante’s typically misleading post and related the reference he supplied to you. Obviously he dug up the trivia on his own.

    • Bindidon says:

      Joseph Campbell

      “Can anyone give me the baseline temperature (in degrees C) which is used in calculating the “temperature anomaly” used in the various plots and tables?”

      Do you mean UAH’s plots and tables?

      The answer you find for example in one of Roy Spencer’s head posts:

      http://www.drroyspencer.com/2016/03/uah-v6-lt-global-temperatures-with-annual-cycle/

      There you see UAH’s baseline for the reference period 1981-2010:

      Mon. Kelvin

      JAN 263.037
      FEB 263.108
      MAR 263.299
      APR 263.721
      MAY 264.324
      JUN 264.966
      JUL 265.288
      AUG 265.108
      SEP 264.471
      OCT 263.786
      NOV 263.273
      DEC 263.072

      This you can construct at any time out of
      https://www.nsstc.uah.edu/data/msu/v6.0/tlt/tltmonacg_6.0

      Mon Kelvin Celsius

      Jan 263.037 -10.11
      Feb 263.108 -10.04
      Mar 263.300 -9.85
      Apr 263.721 -9.43
      Mai 264.325 -8.83
      Jun 264.966 -8.18
      Jul 265.289 -7.86
      Aug 265.108 -8.04
      Sep 264.471 -8.68
      Oct 263.786 -9.36
      Nov 263.274 -9.88
      Dec 263.072 -10.08

      Avr 263.955 -9.20

      Thus the average altitude is, according to a lapse rate of -6.5 K/km, somewhere around 4 km.

      What Robertson tells here – that UAH sounding reaches till the surface – is UTTER NONSENSE.

  27. Eben says:

    listen peoples – There is no trend in this data set !

    The normal regular variability shown here is about 0.7C range up and down within just few years.
    There is only 0.5C rise in 40 years.
    This is nothing but noise of a chaotic turbulent system on different time scale.
    Its called a fractal.
    Will the real scientist on this blog please stand up please stand up

    • David Appell says:

      Eben says:
      There is only 0.5C rise in 40 years.
      This is nothing but noise of a chaotic turbulent system on different time scale.

      What’s the evidence for this claim?

      BTW, RSS’s LT trend is 50% higher than UAH’s.

    • Eben says:

      Numbers and math standing alone is meaningless without a context , you cannot go to the store and buy “five”. you cannot feed “two” to your pet monkey , you can only feed her two of something like two bananas .
      Determining whats noise in a climate system and whats a real trend is as much a matter of math as it is a judgment call you make , that’s the bananas.
      If you can’t tell the difference between the real trend and the noise you are just like a dog chasing its own tail thinking if you only go faster you will catch it.

      But of course, If you are a climate shyster only looking at the world through your hockey stick glasses, seeing global warming under every rock, non of what I say will make any sense to you.

    • Scott R says:

      Eben,

      Millions of people everywhere discussing global warming when the global temperature departure is +0.32 deg C during an el nino. It’s not even movement within the margin of error on the 100,000 year cycle. Basically, it’s the thickness of the line! lol

      The best case is that the earths climate sensitivity is VERY VERY low, and both the global warming alarmists and the grand solar min preppers are both wrong. For me, I’m preparing for the worst on the cold side, and hoping for low climate sensitivity.

  28. Tim Folkerts says:

    Eben says: “Its called a fractal.”
    No, not actually. From wikipedia … “In mathematics, a fractal is a subset of a Euclidean space for which the Hausdorff dimension strictly exceeds the topological dimension. Fractals tend to appear nearly the same at different levels…” You can sort of say this temperature data tends to ‘appear nearly the same at different levels’, but that is not sufficient to make this a “fractal”.
    It is noisy. It is self-correlated. It has variations on different timescales. It is kinda sorta fractal-like. But it is not actually a ‘fractal’.

    There is no trend in this data set !
    Sure there is! Many different statistical tests would show statistically significant differences from the beginning to the end. Three quick examples
    * A simple T-Test of the 1st half of the data against the 2nd half shows the two sets are different at much better than p=0.000000001 level.
    * Every single point for the first 4 years is lower than every single point in the last 4 years. That doesn’t happen without a trend.
    * The slope is 0.128 +/- 0.007 C/decade using standard statistical tests in Excel. That is clearly a non-zero slope.

    Now, this doesn’t establish WHY there is a trend. It might be from CO2. It might be part of a larger natural oscillation in climate. It might be something else altogether.

    But there is a trend.

    • mick says:

      Yes historically there are trends. Vast majority occurred with less CO2. Both cooling and warming.

    • Eben says:

      you missed the part where I call for the real scientist

    • Gordon Robertson says:

      tim…”There is no trend in this data set !
      Sure there is! Many different statistical tests would show statistically significant differences from the beginning to the end. Three quick examples….”

      Tim…you are missing a fundamental tenet of statistics….context. Statistics is not about number crunching, the beginning and end of a data series has nothing to do with two or more contexts within the series.

      For example, the UAH series begins with a re-warming trend. In their 33 year report, UAH points out that true warming during the UAH range did not begin til the 1998 El Nino warming.

      That is context #1. From 1998 – 2015 is context #2, which is a flat trend. How can a linear trend be drawn through two different trends produced by two different contexts?

      We have a rough idea what caused context #1, volcanic aerosols. What produced an 18 year flat trend in context #2?

      Context 3 might be the post 2016 super El Nino, which has been negative since early 2016.

      Again, how does one create a single positive trend to accurately depict the data range from 1979 – present?

      What good are statistical tests unless you implement a range over which they might apply while being able to describe the context?

      CO2 warming does not begin to offer an explanation for either of the three contexts.

    • Bart says:

      “A simple T-Test of the 1st half…”

      Such tests are valid for a specific statistical model. These data do not fit that model. The results are at best dubious.

  29. ren says:

    “The Bonnet Carré Spillway, which diverts water from New Orleans to keep the city dry, was also opened for the second time this year, which is the first time that has occurred since it was built following the epic 1927 flood.

    Should the worst-case scenario of rainfall from a budding tropical feature in the western Gulf of Mexico become involved, levels on the lower Mississippi could approach that of the Great Flood of 1927.”

  30. Dirk McCoy says:

    Well, the Bible did tell us time was relative, the Universe was created in an instant, and provide dimensions for large ocean-going boats over 3000 years ago, so what have Einstein and modern science really contributed anyway? Beside a lot of detail, like the CLOUD paper last September that indicated cloud nuclei growth may have been underestimated by a factor of 10 due to atmospheric trace elements. Hmm, factor of 10 seems like it could be significant in cloud formation, and my ancient temperature measurement system tells me clouds have a significant impact on temperature…

  31. David Appell says:

    The Holocene ended over a half century ago.

  32. gallopingcamel says:

    @Norman,
    “I generally like your posts but I will need you to explain what you mean with the word wrong.”

    We used to talk about Newtons’s LAWS of motion and they worked pretty well for over 300 years. Yet they were proved “Wrong” by Einstein.

    Modern scientists don’t talk about LAWS any more. We talk about THEORIES because we known our theories can be proven false by a single experiment.

    Plato talked about “Forms” such as “Truth and “Justice” that were ideals that we could strive to achieve.

    Ask yourself how you could know if you discovered a true “LAW OF PHYSICS”? How could you be sure that nobody would ever conduct an experiment proving you wrong?

    Thus it makes sense to assume that all physics theories are “Wrong” even though they may be useful even after their limitations are discovered.

    • David Appell says:

      What an abysmal interpretation of Einstein.

      Einstein’s theory was only about motion at very high speeds. Newton’s laws are completely applicable at low speeds, the only realm where they were ever applied.

      NASA used Newton’s laws to get to the Moon, and back.

      So go tell NASA that Newton was wrong. They will laugh in your face.

      PS: camel, where is that missing 150 W/m2?

    • David Appell says:

      gallopingcamel says:
      Ask yourself how you could know if you discovered a true LAW OF PHYSICS? How could you be sure that nobody would ever conduct an experiment proving you wrong?

      What absolute stupidity.

      Scientists aren’t stupid. In fact, they’re far far smarter than you. They know what the experimental facts are.

      PS: 150 W/m2?

    • Gordon Robertson says:

      cam…”We used to talk about Newtonss LAWS of motion and they worked pretty well for over 300 years. Yet they were proved Wrong by Einstein”

      Gotta disagree. Einstein claimed time dilation as part of his proof and as I pointed out, time cannot dilate since it is based on the period of the Earth’s rotation, which is basically a constant. That means the second is a constant.

      Newton claimed time is absolute and it appears he was right and Einstein wrong. Einstein had no problem with Newtonian mechanics at terrestrial speeds and he never did prove his theory at the speed of light by the scientific method.

      The inventor of the atomic clock, Louis Essen, claimed Einstein did not understand science involving measurement. Einstein lived much of his life as a theoretical physicist doing thought experiments, and according to Essen, he got somewhat carried away with his mental projections. Simply put, he made claims that he did not corroborate with experimentation.

      That theory is somewhat backed up by psychologist Eugene Gendlin who inferred that GRT imposes psychological constructs on reality. Somehow, the GRT advocates have given properties to time that it does not have. They seem to think time can influence force and mass, which is a load of hooey.

      I know GRT is accepted as a paradigm at many universities, if not most, but so is AGW theory.

      I urged you once before to rethink what you know about GRT and find a more plausible theory related to only force and mass. Who knows, you may be the first Rugby Union player to win a Nobel. ☺ ☺

      re Louis Essen…on the GRT and Einstein

      http://www.naturalphilosophy.org/site/harryricker/2015/05/25/dr-louis-essen-inventor-of-atomic-clock-rejects-einsteins-relativity-theory/

      “My criticisms were, of course, purely destructive, but I think the demolition job was fairly complete. I concluded that the theory is not a theory at all, but simply a number of contradictory assumptions together with actual mistakes. The clock paradox, for example, follows from a very obvious mistake in a thought experiment (in spite of the nonsense written by relativists, Einstein had no idea of the units and disciplines of measurement)”.

      • Gordon Robertson says:

        I am reposting the comment of Louis Essen, the inventor of the atomic clock, on Einstein and the general theory of relativity. I think it is pertinent to the nonsense with which we are inundated today on anthropogenic global warming.

        Essen claimed of the GRT…”I concluded that the theory is not a theory at all, but simply a number of contradictory assumptions together with actual mistakes”.

        Sounds exactly like AGW.

        He said of Einstein…”Einstein had no idea of the units and disciplines of measurement)”

        Sounds a lot like climate modelers.

        re Louis Essenon the GRT and Einstein

        http://www.naturalphilosophy.org/site/harryricker/2015/05/25/dr-louis-essen-inventor-of-atomic-clock-rejects-einsteins-relativity-theory/

        My criticisms were, of course, purely destructive, but I think the demolition job was fairly complete. I concluded that the theory is not a theory at all, but simply a number of contradictory assumptions together with actual mistakes. The clock paradox, for example, follows from a very obvious mistake in a thought experiment (in spite of the nonsense written by relativists, Einstein had no idea of the units and disciplines of measurement).

  33. Gordon Robertson says:

    bdg…”If you disagree then you need to present evidence (and a lot of it) that shows precisely how T cannot be dependent upon CO2″.

    I already have. The percent mass of CO2 in the atmosphere is far too small to significantly affect atmospheric temperatures. Although percent mass does not correspond exactly with the concentration, since different molecules have different weights, the difference is so small as to be negligible.

    The Ideal Gas Law, PV = nRT, relates a trace gas like CO2 to the heat it can add to the atmosphere. One might argue that the volume of the atmosphere is not constant, but the mass of the atmosphere is always constant (if tiny amounts of gases escaping to space are ignored). Even though the atmosphere should expand and contract with solar heating of the surface, for purposes of the IGL it should be relatively constant.

    The static pressure of the atmosphere is controlled entirely by gravitational force and the volume based on the mass is as close to constant as required to lump n, R, and V together as constants.

    P = (nR/V) T

    This tells us that in the entire atmospheric gas, pressure is proportional to temperature. If you look at a graph of temperature vs. pressure by altitude, there is a relatively linear relationship over the troposphere. It’s not till stratospheric warming due to solar UV that the relationship becomes non-linear.

    However, there are two major gas components, N2 and O2, that account for over 99% of the atmosphere. That means N2 and O2 account for 99% of the pressure in the atmosphere. That is true because pressure is related to the mass of the atmosphere, which is created as a pressure gradient by gravity.

    Right there, we can see that if N2/O2 account for 99% of the pressure they must account for 99% of the temperature.

    That fact is irrefutable. No amount of propaganda and consensus can change that. CO2 is not even close to being a real trace gas, at 0.04%. Argon accounts for nearly 1% itself.

    It’s a mystery why water vapour is not included as a gas, perhaps the reason being that the other gases are relatively stable while WV varies wildly. Anyway, over the entire atmosphere, WV accounts for about 0.3%.

    Back to the IGL. If P is proportional to T, it means even WV cannot supply more than 0.3% of the heat.

    It is totally obvious the N2 and O2 supply 99% of the atmosphere’s heat, by conducting it from the surface, or perhaps by absorbing some incoming solar energy.

    AGW theory has presumed only CO2 and WV can absorb solar energy and once it has been converted to infrared energy by the surface. There is no proof of that, it is conjecture and consensus, not fact.

    Roy has claimed repeatedly that no one knows what is causing warming and John Christy of UAH has claimed repeatedly that the atmosphere is far too complex to be fully understood.

    There is no point offering inane theories like AGW if no one can supply evidence that N2 and O2, contrary to the IGL, are not supplying 99% of the atmosphere’s heat.

    CO2 is a non-player. Prior to the pre-Industrial Era it was more than 0.03% for centuries and it caused no known warming of the catastrophic variety. Nor did it change climates.

    • Mick says:

      This was my comment above. There are so many variables, known and even unknown that CO2 control knob hypothesis cannot be considered fact. Just try to apply its study to the scientific method. In an integrated system with some known and some unknown variables, CO2 gets lost in the noise.
      Cant do it, so it stays in the hypothesis stage and not factual.
      Climastrology.

  34. Gordon Robertson says:

    cam…a bit more of Louis Essen’s critique of Einstein and GRT. Please note the similarities between it and AGW theory.

    He claims that:

    1)The effects are on the border line of what can be measured. The authors tend to get the result required by the manipulation and selection of results.

    2)…in the more resent results of Hafele and Keating with atomic clocks. This result was published in Nature, so I submitted a criticism to them. In spite of the fact that I had more experience with atomic clocks than anyone else, my criticism was rejected.

    Where have we heard this before when someone with expertise challenges an established paradigm and is rejected? Roy has complained about having papers rejected by journals even though he has a degree in meteorology, has worked for NASA as an expert on AMSU units, and represents UAH, one of the premier data set providers.

    Richard Lindzen is a professor at MIT and has published over 300 papers in atmospheric physics yet he gets the third degree from journals.

    Paradigms are created and maintained by people resistant to truth and change. I am afraid GRT is a paradigm maintained by such people as is the AGW theory.

    http://www.naturalphilosophy.org/site/harryricker/2015/05/25/dr-louis-essen-inventor-of-atomic-clock-rejects-einsteins-relativity-theory/

    One aspect of this subject which you have not dealt with is the accuracy and reliability of the experiments claimed to support the theory. The effects are on the border line of what can be measured. The authors tend to get the result required by the manipulation and selection of results. This was so with Eddingtons eclipse experiment, and also in the more resent results of Hafele and Keating with atomic clocks. This result was published in Nature, so I submitted a criticism to them. In spite of the fact that I had more experience with atomic clocks than anyone else, my criticism was rejected. It was later published in the Creation Research Quarterly, vol. 14, 1977, p. 46 ff. With best wishes, Sincerely yours L. Essen

    • Bart says:

      Gordon – GRT works. I have seen it with my own eyes. I have processed GPS signals, and removed one by one the errors due to things like the ellipticity of the orbit, and the shape of the GEOID. I have derived the formulas myself from the GRT principles. They fit like a glove.

      • Bindidon says:

        Bart

        Thanks for the valuable effort you spent. But it is useless.

        Robertson will wait for a couple of days/weeks/months, and repeat the stuff as if nobody hadn’t contradicted him ever.

      • Gordon Robertson says:

        bart…”Gordon GRT works. I have seen it with my own eyes. I have processed GPS signals, and removed one by one the errors due to things like the ellipticity of the orbit”

        Bart…I respect you, you obviously know your stuff. I am not questioning your claims and I have nothing in particular against GRT as a means of comparing relative velocities. Please note, however, that at the velocity of orbiting bodies the spe4ed of light factor is negligible. You might as well apply the Newtonian mechanics version of relativity.

        As I tried to advise cam (galloping cam) try looking for an alternate explanation for time dilation. It makes no sense since the basic unit of time, the second, is a constant. It is defined based on a constant and cannot dilate unless the angular velocity of the Earth changes.

        The errors to which you refer related to orbits have nothing to do with time. The only force acting in an elliptical orbit is gravitational force and the momentum of an orbiting vehicle. There may be an issue between atomic clocks on an orbiting vehicle and an atomic clock on a surface station due to relativity but the errors are related to forces, momentum, and the human brain, not time.

        I am not arguing with GRT itself as a means of comparing relative velocities to each other. If you remove reference to the speed of light, GRT becomes the relative motion of Newtonian mechanics.

        I am arguing with the inferences, that time can dilate and that it has an effect on force and mass to shorten physical dimensions. That notion is sheer nonsense related to distortions of the human mind. I claim that because we humans invented time and our colossal egos and penchant for illusion have given it properties it cannot possibly have.

        There is no dimension of time, it is an illusion presented by theorists. Astronomer Wal Thornhill lamented that humans have imposed a 4th dimension of time onto a real 3-dimensional world.

        Does that make sense to you?

        Before reading Einstein’s original of the GRT, I had presumed others were misrepresenting his words. However, his first analysis of a man in a box experiencing ‘accelerations’ from a gravitational field or a sky hook made me immediately suspicious. Why was he not working the problem from an engineering POV where forces and masses are required to establish motion?

        If you jump straight in using kinematics, you miss a lot of what is actually causing the accelerations. Also, accelerations are based on time, a human invention, and the tendency to re-arrange an equation to make time an independent variable is risky.

        Furthermore, Einstein defined time as the hand on a clock. I thought, “Good grief, Albert, tell me you did not claim that”. So he established GRT through a human with a distorted brain watching a clock while observing a man walked along the corridor of a moving train.

        That scenario is fraught with human error, not to mention illusion. A machine would not see what the human sees and a machine could not measure time dilation. A machine would not notice objects getting shorter as they approached the speed of light, because they don’t.

        Mind you, humans have the ability to separate illusion from fact but I fear most scientists are not privy to such awareness. They simply regurgitate what they are taught based on a paradigm. If you ask them to go beyond the equations, their eyes gloss over.

        • Gordon Robertson says:

          ps. “….the errors are related to forces, momentum, and the human brain, not time”.

          I might add communications error, not errors in the data but in the transmission of the data. There are many variables as you know and I think it is incorrect to claim time is changing. Time is not involved physically in the transmission of data or in the orbital mechanics. It’s purely for convenience of the human observer.

        • Bart says:

          “It makes no sense since the basic unit of time, the second, is a constant.”

          But, the rate at which those units tick off is different depending on your speed and location.

          It works, Gordon. That’s all there is to it. That’s the bottom line. With GRT, we can predict the motion of bodies in a gravitational field far better than we can without it.

          If you have a competing theory that does the same, then you might get people interested. But, until you do, you are descending to the level of “crank” to most observers.

          • Gordon Robertson says:

            bart…”But, the rate at which those units tick off is different depending on your speed and location”.

            That means my location and speed can affect the angular velocity of the Earth. It’s like the Twin Paradox in which a twin travels at the speed of light while his twin remains on Earth. When the traveling twin returns he finds his twin has aged while he has not.

            That notion comes from the nonsense we are discussing. We don’t age due to time, we age due to biological processes in our bodies. It does not matter how fast the traveling twin is moving, his body will age biologically at the same rate as his twin left on Earth.

            Don’t you see what I’m getting at? We humans defined time based on one rotation of the planet. There is no way to change that.

            Louis Essen claimed Einstein was missing something with units and measures. To Einstein, time was the hands on a clock but that clock is nothing more than a machine synchronized to the angular velocity of the Earth.

            You are a bright guy. Break the problem down while refraining from using equations in which time is involved as an independent variable. Look for something else that could account for the errors you described in your last post.

            Most people would not try. They’d write me off as an idiot. However, I have laid out an inconsistency with time and no one has proved me wrong. Time is imaginary and it’s a constant as defined.

            Physicist, David Bohm once claimed that Newtonian physics and quantum physics have reached the respective ends of their roads. He felt we’d have to invent something new, besides time, as the basis of our equations.

            I take that to mean that the relationships we have developed between, say a force and mass, require some other factor to relate them other than time. There has to be something we have yet to discover that explains the effect a force has on a mass.

            In a dialog with the thinker Jiddu Krishnamurti, Bohm declared explicitly that humans invented time. I can dig up the quote if you like. Both concluded that we humans have incorporated time into our thought processes as a past and a future and that imaginary events from the past and future can affect our existence in the present.

            Neurotic thought is based on that illusion. We observe something real which is contradicted by our past views on it. In a psychological sense that can lead to anxiety and stress.

            Of course, the solution is to become aware of the contradiction and to either modify our thoughts or learn to live with them. The reality is unlikely to change. Better still, become aware of the process of mind that causes the distortion. Through that awareness alone, the mind adjusts to the awareness.

            The philosopher Jean Paul Sarte solved it by finding reality boring and moving mentally into a fantasy state. I can see his point as long as one is aware of the fantasy.

          • Bart says:

            You are missing the forest for the trees, Gordon. It does not matter if you, personally, feel uncomfortable with the conceptualization.

            The equations work. You may not like it, but that is the bottom line. They work.

          • Gordon Robertson says:

            bart…”The equations work. You may not like it, but that is the bottom line. They work.”

            3 points:

            1)Physicist David Bohm once commented that an equation with no reality to back it is garbage. There is no reality to back GRT and Louis Essen, an expert on time, claims GRT is not even a theory.

            Feynman once said of quantum theory, “It work but no one knows why”.

            Don’t you have an interest in being able to explain why? Your theory has gaping holes in it yet you seem satisfied with not rocking the boat.

            I am aware it will take a lot of effort to shed the paradigms and look for yourself but that effort will separate you from the wannabees who are content to live with delusions based on math, like the Big Bang theory, a sheer load of nonsense.

            I believe you, that you have measured something but you cannot prove or explain what it is you have measured. It was not time dilation, which cannot possibly occur.

            What was it?

            2)Show me that what I said is wrong, that time must be a constant because it is defined based on a constant. Newton was able to see that but it completely missed Einstein and his adherents.

            3)Show me any particular use for GRT. It has been used to explain the apparent retrograde motion of Mercury but little else. Even Einstein lamented the lack of application.

            Claiming it works is not enough. We are doing science here, explain the conundrum surrounding time, which has no existence and is defined as a constant.

          • Nate says:

            Gordon,

            Neither Feynman nor Bohm, who you quoted, had any problems with relativity.

            Here’s Feynman’s chapter on special relativity:

            http://www.feynmanlectures.caltech.edu/I_15.html

            Tells us what he has wrong.

          • fonzie says:

            3)Show me any particular use for GRT. It has been used to explain the apparent retrograde motion of Mercury but little else. Even Einstein lamented the lack of application.

            Gordon, isn’t the quest for truth the ultimate use for theory? (do we need more than that?) If the special theory was confirmed by putting a clock on one of the apollo rockets and the general theory was confirmed by observations in the orbit of mercury, then isn’t that enough?

          • Nate says:

            Applications of GR? How bout gravity waves? Recently found, and now can be used to see stuff in the Universe we couldn’t see before, like Black Holes colliding.

            How bout gravitational lensing? Which can be used to see much farther than before.

          • Bart says:

            GR is absolutely necessary for precise application of GPS signals. Surveyors now use these signals to get down to millimeter accuracy. You can’t get anywhere near that accuracy without the formulas provided by GRT. You can see it readily in the plots, with the error going down as each GRT error term is subtracted out. I’ve seen it myself. It works.

          • Bart says:

            “Show me that what I said is wrong, that time must be a constant because it is defined based on a constant.”

            The convention that defines the second is not the issue. The issue is not the unit of time, but the rate at which it unfolds.

            “Claiming it works is not enough.”

            It is enough for me to derive benefit from it. That’s enough.

            We don’t know why anything in this universe actually works the way it does. We just know how to model some of it in ways that provide practical benefit. That is the real object of science.

          • Gordon Robertson says:

            nate…”Neither Feynman nor Bohm, who you quoted, had any problems with relativity”.

            I have no problem with relativity myself. I studied relative motion as part of my engineering physics. My beef is with the definition used in GRT for time and the implication of using an imperfect observer like a human making his observation using an incorrect definition of time.

            For example, the planet Mercury in particular, a mass in motion, being viewed from Earth, another mass in relative motion to Mercury, appears in certain parts of its orbit to be moving backwards.

            Of course, it is not moving backwards, the retrograde motion is an illusion created by a human observer on the Earth seeing retrograde motion from his/her perspective. I feel the same mistake was made in GRT

            That is my argument against the inferences related to GRT that time can dilate and that physical dimensions can shorten due to velocities near the speed of light. Both are due to illusion created by the human mind via thought experiments.

            If you deal with thought experiments based on kinematics, without referencing the real forces and masses involved, there is a possibility of mistaking the time element in velocity and acceleration as a real variable, hence moving it to the LHS of an equation where its value becomes dependent on forces and masses.

            That is not allowed in reality because time does not exist. It is a creation of the human mind, the same human mind that sees Mercury moving backwards and the Sun rising and setting in relation to Earth.

            As Louis Essen implied, and also psychologist Eugene Gendlin, Einstein failed to understand that about measurement. It seems highly unlikely to me that someone of Einstein’s stature could do that but it seems that’s exactly what he has done.

            To make matters worse, Einstein adherents who followed him have taken his word for relative motion and it’s relationship to time and space. Now we have sheer idiots trying to teach that gravity is not a force but an anomaly of space-time.

            What kind of a deluded mind tries to create a reality from time and space, then use that mental fabrication to replace a real force like gravity?

          • Gordon Robertson says:

            bart…”The convention that defines the second is not the issue. The issue is not the unit of time, but the rate at which it unfolds”.

            If time is defined based on a constant how can it have a rate of unfolding?

            You are not clear on the matter and you seem to be diverting. Please don’t take that as a patronizing comment, I am not coming from a position of presuming I am correct. I would simply like to see you confront this issue and ‘see’ that time cannot possibly dilate.

            That means something else has to explain the errors you detected in your GPS observations. I think if you look closely at the problem you will find an explanation in the forces, masses, and electronic communications between the orbiting vehicle and the surface station.

            I know for a fact there is no know electronic equipment that can detect time dilation. The atomic clocks used on the orbiting vehicle and in the surface stations run on different time systems. That means both time systems have to be synchronized using electronic communications systems.

            Furthermore, atomic clocks don’t measure time, they generate regular pulses that when summed can be created equal to the same second that is based on the Earth’s rotation. Atomic clocks only serve to stabilize the accuracy of the second which is 1/86,400th of one Earth rotation.

            If gravity is somehow affecting the rate of atomic vibration on the atomic clock on the orbiting vehicle, that is not a change in time, it is a change in the internal forces of the atom. That’s where you should look for your time dilation error.

            If time dilation is being detected it is coming from an algorithm created by someone who believes in time dilation. It means that person manipulated something to achieve the result.

            Don’t laugh, I have seen it done. The oscilloscope is designed to measure difference in potential (voltages). The instrument will not measure currents. However, you can get it to measure the equivalent voltage that drives a current and display that voltage as the representation of a current.

            I have seen curves of transistor operation with current along one axis and the collector voltage along the other axis represented on an oscilloscope screen. To the inexperienced, it may appear as a magic, but to the experienced it’s just another electronics trick.

          • Gordon Robertson says:

            bart…”GR is absolutely necessary for precise application of GPS signals”.

            One of the concerns with atomic clocks is that they have a natural variability. It may be tiny, like a few nanoseconds per day but it’s still there. It is further claimed that traveling at velocities of more than 10,000 km/hr. and at higher altitudes, the clocks tend to run at different rates.

            None of this has anything to do with time. It’s all about inter-atomic forces and noise within the atom. However, if you manipulate the pertinent equations you can express the inter-atomic relations, albeit incorrectly, using time.

            It is simply incorrect to express any relationship in terms of time interval changes. Time intervals never change as time variations, the change is in the physical quantities being measured.

            That should be obvious to the astute observer. The reference clock is ALWAYS ticking with constant seconds. Those seconds cannot vary no matter what the conditions may be. If there is a change in a time interval, it means something has covered more or less distance during that fixed second, or seconds.

            Einstein was wrong. Mechanical clocks as machines may generate time with different intervals due to external forces, but those clocks are not time as Einstein described them. He was completely wrong about that. Time is not the hands on a clock as he described it.

            Time is an imaginary series of fixed intervals. If something is varying with velocity, it is not time.

          • Gordon Robertson says:

            fonzie…”Gordon, isnt the quest for truth the ultimate use for theory? (do we need more than that?) If the special theory was confirmed by putting a clock on one of the apollo rockets and the general theory was confirmed by observations in the orbit of mercury, then isnt that enough?”

            I agree with your first part about the quest for truth. That’s what is driving me now. I know time is a human invention, that it is imaginary, and that it is defined as a constant that cannot vary. GRT claims it can and I claim GRT is wrong in that sense.

            I think a wrong assumption was made in a thought-experiment by Einstein et al. If it was just me making the claim I could be considered a crank. However, scientists like Louis Essen have claimed GRT is not even a theory, but a compilation of inferences.

            If a clock is put on a rocket-ship and changes it’s rate during flight, that does not mean time is changing, it means the clock is being affected as a machine. The machine is running slower (or faster) not time, which is locked to the rotation of the Earth velocity-wise.

            GRT may have confirmed the retrograde motion of Mercury but that was observed long before. Someone figured it out using straight awareness.

            My point has been, what requires GRT besides such confirmations? It so happens that scientists can use it to compare very small perturbations in atomic structure. I am not so sure Newtonian relativity could not be used with some ingenuity.

            With regard to the pursuit of truth, my angst about GRT and time dilation comes from the absolute hogwash being taught to students today about space-time theory. Once again, Einstein developed that theory from an incorrect approach to REAL physics. That is ironic because he once preached REAL physics over some of the imaginary claims of quantum theory.

            By real physics he seemed to mean physics that can be directly observed and/or measured. With GRT he went off on a wild abstraction of acceleration and tied that into gravitational fields. Then he asked how we might differentiate between a gravitation field due to gravitational force and a force applied by an imaginary sky hook that could accelerate us upwards.

            In other words, Einstein’s focus was on an abstracted universe based on accelerations. Everything he saw was the relationship between accelerating bodies and from that came a relationship between space and time.

            Guess what? Neither exist. The space he mentions based on Cartesian or polar coordinates is a human creation, an illusion. So is time. Therefore, Einstein has created a false reality based on abstracted bs.

            People claim it can be used but I am claiming they are measuring something other than what they think they are measuring.

            Academics may find that amusing and good for them. But please leave those of us who want to understand real physics alone. Furthermore, as Pink Floyd once claimed, “Teacher…leave those kids alone”. Don’t be filling young minds with abstracted crap. If they want to pursue such abstractions later in life, that’s cool, but first teach them the fundamentals of physics based on Newton et al.

        • Gordon Robertson says:

          fonzie…I just want to add something about forces and accelerations in case what I said earlier was not clear.

          Einstein replaced gravitational force with the acceleration it produces. When a force is applied to a mass, in general, the mass changes position at a changing rate. That changing rate is acceleration.

          Of course, to measure that change we invented time as a reference base. That time is now built into acceleration as d^2s/dt^2. It’s the second derivative of the change of position wrt time.

          If you omit reference to force and mass, and analyze change of position, especially relative changes, you create an abstraction of the real world. That’s because you have given acceleration a reality of its own while ignoring what produced it.

          Furthermore, you rely on the human brain to view relative motion, a prospect at which it is useless. GRT is based largely on illusions of the human mind.

          The danger there is that scientists make assumption about the change of position wrt time by giving time a property it does not have…the property to change interval durations. Time has no existence, how can it change?

          Worse still, scientist begin creating an abstracted universe featuring accelerations as entities with their built in non-existent time parameter. Today, scientists are talking about the entire universe as human-defined 3-dimensional spaces coupled to a non-existent 4th-dimension of time.

          They do this with a straight face much as climate alarmists pass on their propaganda.

          When you play with abstractions like that in thought experiments, it’s not long before people begin making stupid assumptions based on the math alone. They begin talking about time dilating and physical bodies changing dimensions due to velocity.

          Then there’s the Twin Paradox that relativists brag about as an example of GRT. They describe a twin leaving Earth and traveling at the speed of light. When he returns after 30 years, his twin has aged and he has not.

          What utter rubbish!!! Humans do not age due to time, they age due to biochemical changes in their cells. This is the kind of idiocy that is driving me. I do want to pursue truth in science but current paradigms are becoming so outrageous in their falsehoods that any responsible student of science needs to stop and address them.

          • Bart says:

            Well, I’m done. No point.

          • Craig T says:

            “What utter rubbish!!! Humans do not age due to time, they age due to biochemical changes in their cells.”

            They age due to boichemical changes that happen at specific rates. The same is true for radioactive decay. Both are slowed down by time dilation. Physics grad students at MIT study it in the lab.

            Muons can serve as clocks with which one can study the temporal aspects of kinematics at velocities approaching c where the strange consequences of relativity are encountered. Each muon clock, after its creation, yields one tick–its decay. The idea of this experiment is, in effect, to compare the mean time from the creation event to the decay event (i.e. the mean life) of muons at rest with the mean time for muons in motion.

            In this experiment you will observe the radioactive decay of muons and measure their decay curve (distribution in lifetime) and their mean life after they have come to rest in a large block of plastic scintillator. From your previous measurement of the mean velocity of cosmic-ray muons at sea level and the known variation with altitude of their flux you can infer a lower limit on the mean life of the muons in motion. A comparison of the inferred lower limit with the measured mean life at rest provides a vivid demonstration of relativistic time dilation.

            The Speed and Decay of Cosmic-Ray Muons: Experiments in Relativistic Kinematics
            – The Universal Speed Limit and Time Dilation
            https://www.physics.rutgers.edu/grad/506/muon-mit.pdf

          • fonzie says:

            Bart, ☺️…

            Gordon, was that all that it was with Mercury, retrograde motion? (i never really new the reason) Now, the outer planets show retrograde motion as we should expect. i remember trying it out at our highschool track passing my slower classmates. Does Venus, though, exhibit retrograde motion, too? And how was it that the general theory explained Mercury’s retrograde motion?

            i do think that you’re giving somewhat short shrift to Einstein’s thought experiment on time slowing down as we approach the speed of light. An observer on a spaceship

          • fonzie says:

            Sheesh… Somehow my comment got posted, Gordon, without me finishing it. Give me a minute and i’ll close my thoughts.

          • fonzie says:

            i do think that youre giving somewhat short shrift to Einsteins thought experiment on time slowing down as we approach the speed of light. An observer on a spaceship, departing from earth, observing a clock on board will simply have to wait longer for the light coming from the clock to reach his eyes. Thus, in that sense, time is indeed slowing down. (there can be no disputing this) And this, to my knowledge, was all that Einstein was claiming here. Time is relative. It always boggled my mind as to whether or not the observer should “get all the time back” upon his return to earth. But, my understanding of it is that NASA did just that experimentation and the rest is history. (still doesn’t make a lick of sense to me, but i accept it… ☺️) Now, what is it that you dispute about what i’ve just written? i’d really be interested to know so as to stretch my own thinking on this. Especially that which i’ve highlighted in bold. i always think it helps to simplify the discussion as much as possible so as to not talk past each other. Thanks in advance for your reply…

          • Bart says:

            Fonzie – no, you don’t get it back. The rate of time is slower for the accelerated observer than it is at the place he left from. Unless that place is lower down in a gravity well. E.g., time is slower on the surface of the Earth than it is well above it.

            That leads to an interesting result. In a circular orbit, the lower the orbital altitude, the faster the speed so, one would think, the rate of time slower. But, the gravitational time dilation means time gets slowed down at lower altitude.

            It turns out, the break even point for circular orbits is at about 1/2 Earth radius altitude. Below that altitude, time evolves more slowly on board an orbiting vehicle than it does on the surface of the Earth due to the effect of relative velocity. Above that altitude, time evolves faster.

            At GPS satellite altitude, where the altitude is about 3 Earth radii, time runs about 0.44 nanoseconds/sec faster than on Earth.

          • Gordon Robertson says:

            bart…”Well, I’m done. No point”.

            Bart, you’re a better man than that, at least you appear to be. I have stymied with regard to time and you have hidden behind red herring arguments rather than face the truth.

            That’s twice you have tried to impose your authority by claiming their is nothing to discuss. If you cannot answer the question, say so, never mind this bs about ‘it works’, therefore it’s ok.

            Time is imaginary and it is a constant. If you have proof to the contrary let’s hear it.

          • Gordon Robertson says:

            craig …”They age due to boichemical changes that happen at specific rates”.

            A human needs no time reference to age, he/she simply ages. Cells don’t care about time, or any other human illusions, they do their thing, they divide and age in the process.

            At the ends of chromosomes there are units called telomeres. They control the aging of cells and there are people working on finding a way to lengthen the telomeres so the cells won’t age.

            Craig…you are conditioned. Your mind is conditioned to believe certain truths and you are unable to break away from your conditioning to see clearly.

            There is a way to break the conditioning pattern and become aware of it. Time does not exist, it was invented by humans to do what you have suggested about aging, to measure change. That does not mean creating a rate based on time has anything whatsoever to do with a process.

            You need to become aware of that. Time is for humans not for reality. Time and reality have nothing in common.

            BTW…the article at the link you provided is more rubbish from those conditioned to believe time is real and can affect masses and forces.

          • Gordon Robertson says:

            bart…”the gravitational time dilation means time gets slowed down at lower altitude.”

            In any orbit there is only gravitational force and the momentum of the orbiting body operating. Time has nothing to do with either.

            Although momentum has a time component, in the velocity component, momentum is a real phenomenon. It does not require human intervention re time in order for a mass to keep moving.

            Acceleration is a real phenomenon as well and it requires no time component. You can see acceleration without measuring it. If you want to compare it to something then you get a clock…a machine…and impose an imaginary dimension of time onto it.

            I posted an example of that a while back. Take two machines with turning dials geared so one turns two revolutions to one revolution of the other. One clock is turning twice as fast as the other and I have not mentioned time.

          • Gordon Robertson says:

            fonzie…”An observer on a spaceship, departing from earth, observing a clock on board will simply have to wait longer for the light coming from the clock to reach his eyes. Thus, in that sense, time is indeed slowing down. (there can be no disputing this) And this, to my knowledge, was all that Einstein was claiming here”

            Light is electromagnetic energy. It is comprised of an electric field perpendicular to a magnetic field and it has no mass. It carries no heat.

            When we talk about EM having a certain frequency that is a reference to the number of time it changes it’s energy intensity over a distance. One change is one wavelength. Wavenumbers are the number of changes (cycles) per centimetre.

            In order to keep tract of the changes of intensity, humans introduced a machine called a clock. The machine is synchronized to the Earth’s rotation with the basic measuring unit of the clock being one second.

            The second is derived from dividing one Earth rotation by 36,400. That is 60 seconds/min x 60 minutes/hour x 24 hours/revolution = 36, 400 seconds/revolution.

            We call one revolution a day and there is the solar day and the sidereal day, one slightly longer than the other.

            We humans created hours, minutes, and seconds and we have related those to degrees of rotation to get 24 lines of longitude.

            Light has absolutely nothing to do with time as a real phenomenon. EM is real, time is not. Light as EM operates entirely on its own once it is emitted by electrons in the atoms of a mass. There is no way to associate light with time then claim time can dilate. It is pseudo-scientific nonsense.

          • Bart says:

            Gordon –

            If you are approaching an object at rest which is emitting an audible tone at a given frequency, and your speed is some fraction R of the speed of sound, then the wave fronts will be reaching you more frequently than they otherwise would, and the frequency you hear will be elevated by a factor of 1 + R.

            If, on the other hand, you are at rest, and the object is approaching you, the wavelengths are compressed, and the frequency shift will be by a factor of 1/(1 – R).

            If, instead of sound, the object is emitting light, you will see the frequency shift by sqrt((1+R)/(1-R)), where “sqrt” indicates the square root, and R is the ratio of your relative speed divided by the speed of light. For light, it does not matter if the object is approaching you, or you are approaching the object. The formula is the same.

            These are the Doppler shift formulas, and they have been verified and used in practice so extensively that there can be no doubt whatsoever of their veracity.

            The reason that the light formula does not change whether you are approaching the object, or the object is approaching you, is that the signal appears to move at the speed of light for both of you, regardless of which one of you is moving or at rest.

            Please explain to me how the speed of light can be the same for both you and the emitting or receiving object without invoking any change in the rate of time as it unfolds for you versus for the object.

          • Bart says:

            The constancy of the speed of light is the whole issue. If I am moving toward the object with speed v, and the speed of light is c, then if the rate of time is the same for both of us, an observer moving with the object should be able to show that the signal I sent to him is moving at speed v + c.

            But, if he sets up a couple of detectors in a line with my transmission, and measures my signal at one, and then the time it takes to reach the other, he will still find that the ratio of distance between the detectors to time is the same, i.e., the signal still appears to traveling at speed c.

            There are only two differentials to play with here: the differential in space, and the differential in time. If the ratio of the two is constant, but the differential in space (between me and the observer) has changed, then the only possibility to preserve the constant ratio is that the differential in time has to change, too.

  35. barry says:

    Just to be clear, the Barry above (capital B) is not me.

    • JDHuffman says:

      Most of us knew that, barry. It was just those unable to think for themselves that were confused.

      Nothing new.

  36. Dr Roys Emergency Moderation Team says:

    Day 90. Still no improvement.

  37. Aaron S says:

    David A.

    Sorry I only have my phone and get dumped down here at the bottom. Population is a real problem. Why are there 7 to 10 billion people (by the time we get to Eemian like warming)? Seems we have been distracted by a correlative issue not the causal one.

  38. Dirk McCoy says:

    At least Einstein knew his understanding was incomplete, unlike my friends who want to keep 10,000 people dying a day from having to burn wood chips and dried cow dung to cook and heat instead of giving them cheap electricity powered by abundant coal- like making rideshare drivers purchase Teslas.

  39. Dirk McCoy says:

    Essentially zero… as in if we used whole numbers on the temperature graph scale temperature rise the past 100 years would be, essentially, a flat line? It is not, however, zero, as numerous measurements attest. Moreover, the oceans act as a storage buffer, so the correlation between solar activity, cosmic ray penetration, cloud formation, and temperatures is not in real time.

    • Gordon Robertson says:

      dirk…”Moreover, the oceans act as a storage buffer, so the correlation between solar activity, cosmic ray penetration, cloud formation, and temperatures is not in real time”.

      The ocean also acts as a buffer between day and night and the atmosphere ‘should’ act as a buffer between day and night through expansion and contraction.

      I think this extremely simplified model of radiation as a means of warming/cooling the atmosphere is way off base. There are factors right in front of us that have obviously been missed. You mentioned buffer action, that is just one means of evening heat over the long term, perhaps even explaining the misnamed GHE.

  40. Gordon Robertson says:

    binny…”What Robertson tells here that UAH sounding reaches till the surface is UTTER NONSENSE.”

    Binny, you would not appear to be such an idiot if you did not state your idiocy so boldly and if you had any idea whatsoever what you are talking about. You are a number cruncher who is deluded into thinking manipulating numbers in any way represents reality.

    If Roy has the time and feels so inclined maybe he could drop in and correct my amateur understanding of AMSU units.

    The AMSU units on NOAA sats use many receiver channels to detect microwave radiation related to the oxygen molecule. The O2 molecules has a strong absorp-tion band at 60 Ghz and the absorp-tion bandwidth is obviously related to its temperature.

    Temperature is related to altitude. By determining the frequency of O2 absorp-tion in the 60Ghz band, it is possible to related the absorp-tion frequencies across the band to altitude.

    On the AMSU unit there are 15 bands for measurement, each band being represented by a receiver. The AMSU band covering the surface is band 5 as can be seen in the following link. It covers all the way to the surface as do other bands.

    I presume UAH is measuring at a temperature/altitude around 263K (-9C) for a reason. Extrapolating that data to the surface should not be an issue. UAH is certainly not extrapolating thermometer readings from surface stations 1200 km apart as is the practice of NOAA.

    https://www.researchgate.net/figure/AMSU-weighting-functions_fig9_252235249

    • E. Swanson says:

      Gordo, Your linked graphic presents the AMSU weighting curves based on theoretical calculations for different frequencies due to pressure broadening of the O2 band near 53Ghz, not 60. Those calculations assume an atmospheric temperature vs. pressure profile based on another model, the US Standard Atmosphere, though the report which is the source of that graph doesn’t make that clear.

      Only MSU channels 2, 3 and 4 and AMSU channels 5, 7, and 9 data are included by UAH in their so-called “satellite temperature” data sets. Since the beginning of the UAH efforts, it’s been widely recognized that the channel at the lowest pressure level (MSU 2 and AMSU 5) include inputs from both the surface and the Stratosphere, which contaminate their results. The original UAH TLT was an attempt to compensate those channels for these effects, with the latest version 6 being an entirely different approach, combining all three MSU and AMSU together into a single product.

      All this work begins with the assumption that those weighting functions are valid at all latitudes and for all seasons. The fact that the data over the Antarctic and other high elevation regions intrudes into the results is ignored by UAH, whereas RSS excludes the Southern Polar region from 70 S and over the higher mountains. The fact that the latest UAH v6 includes MSU3 and AMSU 7 also suggests a potential source of error during high latitude very cold Winter months when the tropopause falls to around 300 mb. Spencer and Christy have never addressed these problems with their results, though they did point out the high altitude contamination in their early reports, later warning “users” of their gridded data to beware of the problem.

      Spencer and Christy have complained that their reports were rejected by American journals, which may be due to their lack of attention to these problems. That they chose to turned to a Chinese(?) journal to publish makes one wonder what were the exact problems found by Western reviewers in their submissions. Just saying…

      • Bart says:

        “That they chose to turned to a Chinese(?) journal to publish makes one wonder what were the exact problems found by Western reviewers in their submissions.”

        Indeed, but perhaps not in the way you are thinking. Just saying…

        • E. Swanson says:

          Bart, You’ve left no comment about the meat of my comment, only my last bit about the publication of their paper(s). I have no way to know about their repeated claims of bias in the peer review process.

          • Bart says:

            I have little to say on the “meat”. One would have to be intimately familiar with the processing to gauge the merits.

            I can only tell you that for me, personally, I watched the major data sets unfold since the turn of this century, and there was a time in which they were all pretty much in sync, and they all were indicating that a marked pause in the temperature rise was occurring. Then, GISS started extrapolating measurements over the poles, ship bucket measurements started to be revised, etcetera, etcetera, et voila! The “pause” disappeared from all but the satellite data sets. Everyone knew it was just a matter of time before RSS capitulated to peer pressure, and it was rather anti-climactic when they did.

            So, yeah, I don’t know all the ins and outs of the data processing or the instruments, but I do know when something is rather too convenient.

            So, I confined myself to commenting on the snark at the end. You asked for more, so there you go.

          • barry says:

            There has been little change in the data over the period you specify. There is still an ‘apparent’ slowdown for the pause period, still not statistically significant.

            In January 2013 Had.CRU4 had 0.05 C/decade mean linear warming trend from 1998 to 2012 incl. That figure is still the same for the same period.

            In January 2013, UAH had a trend for 1998 to 2012 incl of 0.05 C/decade mean linear warming trend. That changed with adjustments to the data set, to -0.08 C/decade today for the same period.

            Here you can see what little difference to the so-called pause period GISS revisions have made.
            https://data.giss.nasa.gov/gistemp/history/

            “One would have to be intimately familiar with the processing to gauge the merits.”

            Indeed. But throwing shade is the perennial game.

          • Gordon Robertson says:

            bart…”GISS started extrapolating measurements over the poles, ship bucket measurements started to be revised, etcetera, etcetera”

            I agree with one exception. GISS is a minor player, both GISS and Had-crut get their data from NOAA. As I understand it, NOAA messed with the ship buckets, changing them to ship’s water intakes, hence a rise in the SST and removing the flat trend.

            And I think NOAA was a minor player to the US EPA under the Obama administration.

            Even NOAA showed the flat trend before the revision.

          • Bart says:

            barry –

            “There has been little change in the data over the period you specify. There is still an apparent slowdown for the pause period, still not statistically significant.”

            1) Stop blathering about “statistical significance”. There is no validated stochastic model for these data. Talk of statistical significance under these conditions is arbitrary and capricious.

            2) The change has been enough to remove what was an obvious slowdown, and make it arguably “statistically insignificant”. It was about manipulating perceptions, their own as well as others’. This is a marketing effort, not a scientific one.

          • barry says:

            It’s not statistically significant under any trend model. You may prefer to ignore statistical rigour in these analyses, but that’s not earning your opinions any credit.

            Very little has changed with data revisions, and your blather about managing perceptions is conspiracy dreck. When you said, “One would have to be intimately familiar with the processing to gauge the merits,” you weren’t talking out of your arse.

            The latest adjustments to SSTs (ERSSTv5) lowered the recent (since 1998) trend. How is this managing perceptions in the way you imagine? Only the most fetid imagination would read that as some kind of double-feint to ease suspicion, or some such bollocks.

            You know that avowed AGW skeptics who crunched their own numbers have generally corroborated the institutional temp records, or come up with even higher trends, so why you, who are not a cretin, keep peddling this conspiracy nonsense is beyond me.

          • Bart says:

            Your attempt to paint it as conspiracy theory is merely an attempt to discredit the argument. It is not so much a conspiracy as blinkered groupthink. They think they are justified in cutting corners because they have convinced themselves that they know the answer already. It is not particularly unusual to observe the phenomenon in the history of scientific endeavors.

          • Gordon Robertson says:

            bdg…”GR, please review the following materials regarding the issue of ship intake, bucket, and buoy measurements. ”

            Why would I want to read that propaganda? The first one features Karl, the head of NOAA.

            Ask yourself this. After the IPCC claimed in 2013 that no significant warming had occurred during the 15 year period from 1998 – 2012, why did NOAA find it necessary to retroactively find a positive trend where the IPCC 2012 review found none?

            Why did NOAA claim 2014 as the warmest year ever, at the time, with a 48% confidence level that it was true. That’s a 52% CL that they were lying.

            It’s obvious that NOAA is a civilian authority that gets it cues from the government. At the time the trend was fudged, the Obama admin was running NOAA. When Trump took over, NOAA was ordered to turn over the data they used to fudge the trend and they refused.

            NOAA was accused of fudging data and they refused to cooperate by releasing their data. Can you see UAH doing that? No!!! NOAA are cheaters who have been single-handedly re-writing the historical temperature data record to make it fit the AGW propaganda.

          • Nate says:

            Ugghh,

            ‘Why did NOAA claim 2014 as the warmest year ever, at the time, with a 48% confidence level that it was true. That’s a 52% CL that they were lying.’

            Gordon seems to think putting error bars on measurements is dishonest.

            Hilarious!

          • barry says:

            “They think they are justified in cutting corners because they have convinced themselves that they know the answer already. It is not particularly unusual to observe the phenomenon in the history of scientific endeavors.”

            But you have no verification for this, Bart. You paint this picture as if its actually happening instead of just some surmise on your part. That’s why calling you a conspiracy theorizer fits – because you exercise zero doubt in your ‘analysis’ and conclusion, even though you cannot truly know if the scientific choices made are biased, and because inferring from their results is still guessing. Your approach is what earns you the label.

      • Yuri says:

        Well, perhaps Christy and Spencer thought that these cold northern winters were a thing of the past anyway. After all the missing heat of a cold winter would average out quickly anyway, just saying…

    • Bindidon says:

      Robertson

      Again you insult me.

      I lack time and interest to see myself being insulted by the most ignorant boaster having ever published a comment on this blog.

      Nevertheless, I urge you one more time to learn instead of shouting your nonsense.

      Search for documents within which Roy Spencer explains that there are major bias problems when trying to perform microwave soounding down to the surface, especially at the oceans’ surfaces, where the biases are the greatest.

      • Gordon Robertson says:

        binny…”Search for documents within which Roy Spencer explains that there are major bias problems…”

        I have read Roy and John Christy on this problem and both have been forthright about it. The error that got the greatest focus was the orbital problem and it was resolved circa 2005. According to UAH, the error affected only the tropics and was well within the stated margin of error.

        With regard to biases, I would be surprised if there were none. Having dealt with electronic equipment extensively, I am aware the equipment has to be zeroed, normalized, or whatever, depending on the equipment.

        The AMSU units on sats are similar to receivers with which I have worked over the years. I am thinking of filters and tuned circuits. The heterodyne receivers relied on a local oscillator signal being mixed with incoming signals of known frequency in a band, or range. A tank circuit was setup with the capacitor unit being variable. However, the variable capacitor had adjustable capacitors on each gang of plates to ‘trim’ the capacitor plates to adjust the frequency.

        Electronics equipment is known to drift and if used incorrectly it can introduce a bias into the signal. Old-style volt-ohmeters would load a sensitive circuit and throw off the amplifier sensitivity.

        Modern electronic equipment has built-in circuitry to allow for drift. Some of it is automated with an IC chip and others bring leads out so the user can do their own adjustments.

        With AMSU units, they are obviously dealing with set points to get them going. Then they have to deal with at least 15 different channels to detect the signals required. At the same time, the sats are in motion at high speeds and no doubt wobbling, or whatever they do.

        Teasing realistic data from such telemetry is not straight-forward and I am sure there are biases in the system. The question that I am sure arises is, “can we live with them”?

        The difference I see with UAH is that they are willing to acknowledge errors and biases whereas NOAA introduces them intentionally and tries to pass them off as real. UAH compares their results with radiosondes.

      • Gordon Robertson says:

        binny…”Robertson

        Again you insult me.”

        Why do you take it so seriously? Can you see no humour in it?

        What does it matter what I call you, it’s irrelevant in the grander scheme of things?

  41. Brett Keane says:

    Roy, the astrophysicists rely on the gas laws for stellar fusion ignition T from c.3K. Tunnelling helps a little.

    The gas laws demonstrate that no gas has special heating abilities in an atmosphere. Maxwell showed us that eg pp 330_350 in The Theory of Heat for starters.

    The Spectra you read are effects. KE is the proximate cause because the energy path to space via buoyancy and LH is easiest to a free path. Please look past the photon soup. Regards from Brett Keane, NZ

    • Gordon Robertson says:

      brett…”The gas laws demonstrate that no gas has special heating abilities in an atmosphere”.

      The Ideal Gas Law is a compilation of several laws, one of them Dalton’s law of partial pressures. His law claims that the total gas pressure is the sum of partial pressure of constituent gases.

      In a constant volume, constant mass atmosphere P = T, with (nR/V) as the constant of proportionality. T is defined as the average kinetic energy of a gas but that does not describe a gas mixture. T is the average KE of each gas in the mix.

      That means each gas adds heat to the mix based on its percent mass. It stands to reason that N2 adds the most heat with O2 a second. The rest of the gases, based on their percent mass, barely contribute anything.

      Looking at it another way, the T of nitrogen in the mix is based on the average KE of N2. Since N2 has 78% of the mass of the atmosphere, why should it not have the highest pressure and contribute the most heat?

      On the other end, with CO2 at 0.04% of the mix, why should it contribute more than about 0.04% of the heat?

      • Svante says:

        Because CO2 absorbs more EM than O2 and N2 put together.

        • Gordon Robertson says:

          svante…”Because CO2 absorbs more EM than O2 and N2 put together”.

          At terrestrial temperatures. However, there is such a pitifully small amount of CO2 in comparison to N2/O2 that it’s heat contribution is measured in hundredths of a degree C.

          • Svante says:

            Gordon Robertson says:

            However, there is such a pitifully small amount of CO2 in comparison to N2/O2

            Completely irrelevant.

            its heat contribution is measured in hundredths of a degree C.

            No, heat is measured in units of energy.
            What matters is energy per unit of time, called “power” in physics.
            Just like your radiator at home, it’s the power that matters.

          • Gordon Robertson says:

            “Completely irrelevant.

            [GR] …its [CO2] heat contribution is measured in hundredths of a degree C.

            No, heat is measured in units of energy”.

            ***********

            Svante drops off the deep end into the abyss of pseudo-science. If you want to look at the total energy of the atmosphere, that cool with me. Just remember that N2/O2 accounts for 99% of it and CO2 about 4/100ths of it.

            Heat is measured in degrees C, as well as calories. If you are comparing heat quantities, or relative intensities of heat, temperature is the measure.

            You can use the calorie, which is the amount of heat required to raise the temperature of 1 cc of water by 1C. Note in this case that you are raising the water from one heat level to another by adding more heat.

            Heat is energy therefore the calorie is its unit of energy. Temperature is a measure of the average kinetic energy of a gas. Heat is that average kinetic energy.

            However, heat and work are equivalent and work is measured in foot-pounds or newton-metres.

            1 joule = 1 newton-metre = 0.239 calories

            Note that the units don’t match between joules and calories but they are equivalent. The scientist Joule said so.

  42. Gordon Robertson says:

    swannie…”Gordo, Your linked graphic presents the AMSU weighting curves based on theoretical calculations for different frequencies due to pressure broadening of the O2 band near 53Ghz, not 60.”

    You forget that the curves represent real data from microwave radiation. The peaks on the curves represent the microwave frequency at which the AMSU amplifiers receive best.

    Where the curves overlap, the signals can be added.

    Note spectrum range from channel 1 at 23.8 Ghz to channel 15 at 89 Ghz. the troposphere is covered from channel 5 @ 53.596 Ghz to channel 8 @ 55 Ghz, so that’s the range at which the units receive troposphere energy from O2 molecules.

    It is obvious that each channel receives data best at a centre frequency. That frequency corresponds to an altitude. However, each channel receives a range of altitudes over it’s 0.707 amplitude width and channel 5 is receiving down to the surface at that amplitude. Note that the other channels mentioned overlap channel 5 and all except channel 8 are capable of detected down to the surface.

    • E. Swanson says:

      Gordo, Only AMSU channels 5, 7 and 9 are included in the UAH v6 time series. The UAH LT v6 combines ch 5 and 7, each weighted, with a small amount (1%) of ch 9 to produce their product. Those channels’ frequencies were chosen to capture emissions from the pressure broadened emissions of the O2 band, not the “center frequency” of the emitting O2 bands. The UAH TLT combination actually increases the weighting of surface emissions compared with ch 5.

      While the other channels may be useful for weather forecasting and reanalysis, they aren’t “added” to provide a temperature product.

  43. Eben says:

    Ready for another lesson in climate shystering ?

    https://www.youtube.com/watch?v=hzAuHzcexcM

  44. aaron smith says:

    in 2 years or less, temp will be below the 0 line

  45. Svante says:

    Do you mean UAH’s read line?

  46. Tim Wells says:

    There has been a definite cool down in the UK this summer. A lot more cloud, wind and rain. The last week feels like winter again. My big concern is a reduction in global food production due to a cooling climate. I understand that the Dutch are 2nd to the Americans in food production and use lots of greenhouses. We need to implement what the Dutch are doing.

  47. bobdroege says:

    There’s a volcano erupting in Indonesia that might have an effect on global temperatures so we might get a temporary drop even to an anomaly of zero.

    Mount Sinabung

    https://en.wikipedia.org/wiki/Mount_Sinabung

    • Eben says:

      Nice preemptive excuse

      • bobdroege says:

        No, it’s an acknowledgement that more things than CO2 affect global temperatures.

        We will see if it is as big as Pinatubo, a volcanic eruption that actually showed the models have skill.

      • Eben says:

        It was a single blast event, nothing but a puff of smoke on planetary scale
        But alarmists already in panic it might cool their global warming

      • bdgwx says:

        Eben,

        I’m calling this what it is. A strawman.

        Climate scientists don’t think there is a single agent that modulates the climate. They think it is the net effect of all of them that matters.

        Ironically I find that those who selectively ignore GHGs are the ones who advocate for a single agent at a time theory. Why is that?

    • Scott R says:

      bobdroege,

      A blast to 22,000 ft is not high enough / big enough to have the type of effect we saw with Mt. Pinatubo @ 112,000 ft. We have these type of eruptions every year. Their effect is there, but when you have a dynamic system with the effects of prior eruptions fading, and new eruptions taking their place, it doesn’t show up on the global temperature. The next cooling drop will be because we have reached the end of the current El Nino harmonic, and we will go into a deep la nina phase.

      • bobdroege says:

        Don’t trust wikipedia, I only linked for the name, news reports have shitty websites with clickbait.

        other reports have the ash reaching 55,000 feet.

    • Gordon Robertson says:

      bob d…”Theres a volcano erupting in Indonesia that might have an effect on global temperatures so we might get a temporary drop even to an anomaly of zero”.

      Circa 1400 AD, we had a mini ice-age begin, the Little Ice Age (or the Mother of all La Ninas). For the next 400 years or so, right through the Industrial Revolution, global temps were 1C to 2C below normal.

      The LIA ended circa 1850 and the planet began to re-warm. The IPCC and other climate alarmists blamed it on a trace gas that had never caused warming in the past, and completely failed to acknowledge re-warming from the LIA.

      The IPCC completely missed the fact that global temps were at least 1C colder when they claimed pre-Industrial levels of CO2 were about 280 PPMV. Guess what happens with colder oceans over 400 years? They absorb lots of CO2.

      Guess what happens when the same oceans warm up? They out-gas CO2.

      • bdgwx says:

        CO2 concentration dropped by maybe 10 ppm during the LIA. After the LIA it increased by at least 10x that amount.

        If the oceans were outgassing CO2 then you’d expect pH levels to increase. But the exact opposite is happening. pH levels are decreasing.

        Also, the IPCC does not blame all of the warming post 1850 on CO2. They don’t even blame all of the warming on GHGs. What they say is that the warming is the product of the net effect of all climate modulating agents. Sure, different subsets of agents can dominate over the others during different eras. The dominating factor in one era is not necessarily going to be the dominating factor in another.

        • fonzie says:

          bdgwx, pH levels could be dropping because of aco2 (sinking) all the while that the oceans are naturally outgassing. Natural co2 would be sinking at a rate near 100% even if the rise were all natural. And if the mass of aco2 is observed sinking at a rate of at least 50%, then there’s no reason why it can’t be sinking at a rate also near 100% with natural sources making up the difference. We do know by measurements that the oceans are a net sink for co2. (but that would be the case whether the rise was natural or anthropogenic)…

        • Bart says:

          “If the oceans were outgassing CO2 then youd expect pH levels to increase.”

          Incorrect. It is not a zero sum game.

          Every second of every day, CO2 laden waters are upwelling in the tropics, a transport process that was initiated centuries previous when currently upwelling waters originally downwelled, and began their trek along the THC.

          All that is needed for a buildup is to have an impedance to the transport of an equal amount of CO2 in downwelling waters at the poles.

          The atmospheric content tracks the content of the surface oceans, and both increase in tandem.

      • bobdroege says:

        Gordon,

        Check your Henry’s Law calculations, say 4 degrees C and see if it’s enough to cause the observed changes in the concentration of CO2 in the atmosphere.

        And by the way, this statement

        “The IPCC and other climate alarmists blamed it on a trace gas that had never caused warming in the past, and completely failed to acknowledge re-warming from the LIA.”

        Is just false

        Look up some past volcanic eruptions and their warming effect on climate, here are some subjects to google

        Anoxic events

        Ontong Java

  48. Gordon Robertson says:

    reposted from earlier. Did not notice the htread had gotten so old.

    bdg…”GR, please review the following materials regarding the issue of ship intake, bucket, and buoy measurements. ”

    Why would I want to read that propaganda? The first one features Karl, the head of NOAA.

    Ask yourself this. After the IPCC claimed in 2013 that no significant warming had occurred during the 15 year period from 1998 – 2012, why did NOAA find it necessary to retroactively find a positive trend where the IPCC 2012 review found none?

    Why did NOAA claim 2014 as the warmest year ever, at the time, with a 48% confidence level that it was true. That’s a 52% CL that they were lying.

    It’s obvious that NOAA is a civilian authority that gets it cues from the government. At the time the trend was fudged, the Obama admin was running NOAA. When Trump took over, NOAA was ordered to turn over the data they used to fudge the trend and they refused.

    NOAA was accused of fudging data and they refused to cooperate by releasing their data. Can you see UAH doing that? No!!! NOAA are cheaters who have been single-handedly re-writing the historical temperature data record to make it fit the AGW propaganda.

  49. Lawrence Miller says:

    A famous climatologist has just revealed proof that the Earth has entered a cooling phase that will result in a full return to an Ice age climate. He has demonstrated that over the next 2 thousand years temperatures will drop at a rate of 1 – 2 degrees every 2 centuries. This means that humans will not see any significant changes for a number of centuries. However he warns that it may take centuries before we can say for certain whether or not temperatures are actually going up or down, although down is certainly inevitable in the long term. He advises a complete moratorium on the issue of Global temperatures until the year 2200 at which point scientists may actually be able to give a realistic appraisal of the situation.

    • Svante says:

      Lawrence Miller says:
      “A famous climatologist”.

      Was it Trump?

      • Lawrence Miller says:

        He wishes to remain anonymous due to knowing that his opinions are not going to be well received by those who are currently promoting catastrophic warming theories. However he is confident that the passage of time will prove him right..

  50. steve case says:

    GISSTEMP’s Land Ocean Temperature Index is out for May:
    https://data.giss.nasa.gov/gistemp/tabledata_v4/GLB.Ts+dSST.txt
    Compared to the April report, of the 1671 monthly entries since 1880, 1359 of them (81%) were changed and on an annual basis, all of them since 2003 were increases.

  51. Jim says:

    This data looks different than the UAH data I graphed in 2009 here: http://endofinnocence.com/anthropogenic-global-warming-myth/

    Is that because this is version 6.0? Has historical data been revised since 2009? If so, do accept the revisions?

  52. Greg Bates says:

    Saw article with title below

    90 leading Italian Scientists sign Petition: “Anthropogenic Origin of Global Warming is an unproven Hypothesis” … Catastrophic Predictions “Not realistic”

    website location

    https://abruptearthchanges.com/2019/07/07/90-leading-italian-scientists-sign-petition-anthropogenic-origin-of-global-warming-is-an-unproven-hypothesis-catastrophic-predictions-not-realistic/

  53. Nice post. I learn something new and challenging on sites I stumbleupon on a daily basis.

    It’s always useful to read through articles from other writers and
    use a little something from their websites.

  54. maddy_lug says:

    Привет! Пока!

Leave a Reply to Dr Roys Emergency Moderation Team