
 Home/Blog
July 2019 was probably the 4th warmest of the last 41 years. Global “reanalysis” datasets need to start being used for monitoring of global surface temperatures. [NOTE: It turns out that the WMO, which announced July 2019 as a near-record, relies upon the ERA5 reanalysis which apparently departs substantially from the CFSv2 reanalysis, making my proposed reliance on only reanalysis data for surface temperature monitoring also subject to considerable uncertainty].
We are now seeing news reports (e.g. CNN, BBC, Reuters) that July 2019 was the hottest month on record for global average surface air temperatures.
One would think that the very best data would be used to make this assessment. After all, it comes from official government sources (such as NOAA, and the World Meteorological Organization [WMO]).
But current official pronouncements of global temperature records come from a fairly limited and error-prone array of thermometers which were never intended to measure global temperature trends. The global surface thermometer network has three major problems when it comes to getting global-average temperatures:
(1) The urban heat island (UHI) effect has caused a gradual warming of most land thermometer sites due to encroachment of buildings, parking lots, air conditioning units, vehicles, etc. These effects are localized, not indicative of most of the global land surface (which remains most rural), and not caused by increasing carbon dioxide in the atmosphere. Because UHI warming “looks like” global warming, it is difficult to remove from the data. In fact, NOAA’s efforts to make UHI-contaminated data look like rural data seems to have had the opposite effect. The best strategy would be to simply use only the best (most rural) sited thermometers. This is currently not done.
(2) Ocean temperatures are notoriously uncertain due to changing temperature measurement technologies (canvas buckets thrown overboard to get a sea surface temperature sample long ago, ship engine water intake temperatures more recently, buoys, satellite measurements only since about 1983, etc.)
(3) Both land and ocean temperatures are notoriously incomplete geographically. How does one estimate temperatures in a 1 million square mile area where no measurements exist?
There’s a better way.
A more complete picture: Global Reanalysis datasets
(If you want to ignore my explanation of why reanalysis estimates of monthly global temperatures should be trusted over official government pronouncements, skip to the next section.)
Various weather forecast centers around the world have experts who take a wide variety of data from many sources and figure out which ones have information about the weather and which ones don’t.
But, how can they know the difference? Because good data produce good weather forecasts; bad data don’t.
The data sources include surface thermometers, buoys, and ships (as do the “official” global temperature calculations), but they also add in weather balloons, commercial aircraft data, and a wide variety of satellite data sources.
Why would one use non-surface data to get better surface temperature measurements? Since surface weather affects weather conditions higher in the atmosphere (and vice versa), one can get a better estimate of global average surface temperature if you have satellite measurements of upper air temperatures on a global basis and in regions where no surface data exist. Knowing whether there is a warm or cold airmass there from satellite data is better than knowing nothing at all.
Furthermore, weather systems move. And this is the beauty of reanalysis datasets: Because all of the various data sources have been thoroughly researched to see what mixture of them provide the best weather forecasts
(including adjustments for possible instrumental biases and drifts over time), we know that the physical consistency of the various data inputs was also optimized.
Part of this process is making forecasts to get “data” where no data exists. Because weather systems continuously move around the world, the equations of motion, thermodynamics, and moisture can be used to estimate temperatures where no data exists by doing a “physics extrapolation” using data observed on one day in one area, then watching how those atmospheric characteristics are carried into an area with no data on the next day. This is how we knew there were going to be some exceeding hot days in France recently: a hot Saharan air layer was forecast to move from the Sahara desert into western Europe.
This kind of physics-based extrapolation (which is what weather forecasting is) is much more realistic than (for example) using land surface temperatures in July around the Arctic Ocean to simply guess temperatures out over the cold ocean water and ice where summer temperatures seldom rise much above freezing. This is actually one of the questionable techniques used (by NASA GISS) to get temperature estimates where no data exists.
If you think the reanalysis technique sounds suspect, once again I point out it is used for your daily weather forecast. We like to make fun of how poor some weather forecasts can be, but the objective evidence is that forecasts out 2-3 days are pretty accurate, and continue to improve over time.
The Reanalysis picture for July 2019
The only reanalysis data I am aware of that is available in near real time to the public is from WeatherBell.com, and comes from NOAA’s Climate Forecast System Version 2 (CFSv2).
The plot of surface temperature departures from the 1981-2010 mean for July 2019 shows a global average warmth of just over 0.3 C (0.5 deg. F) above normal:
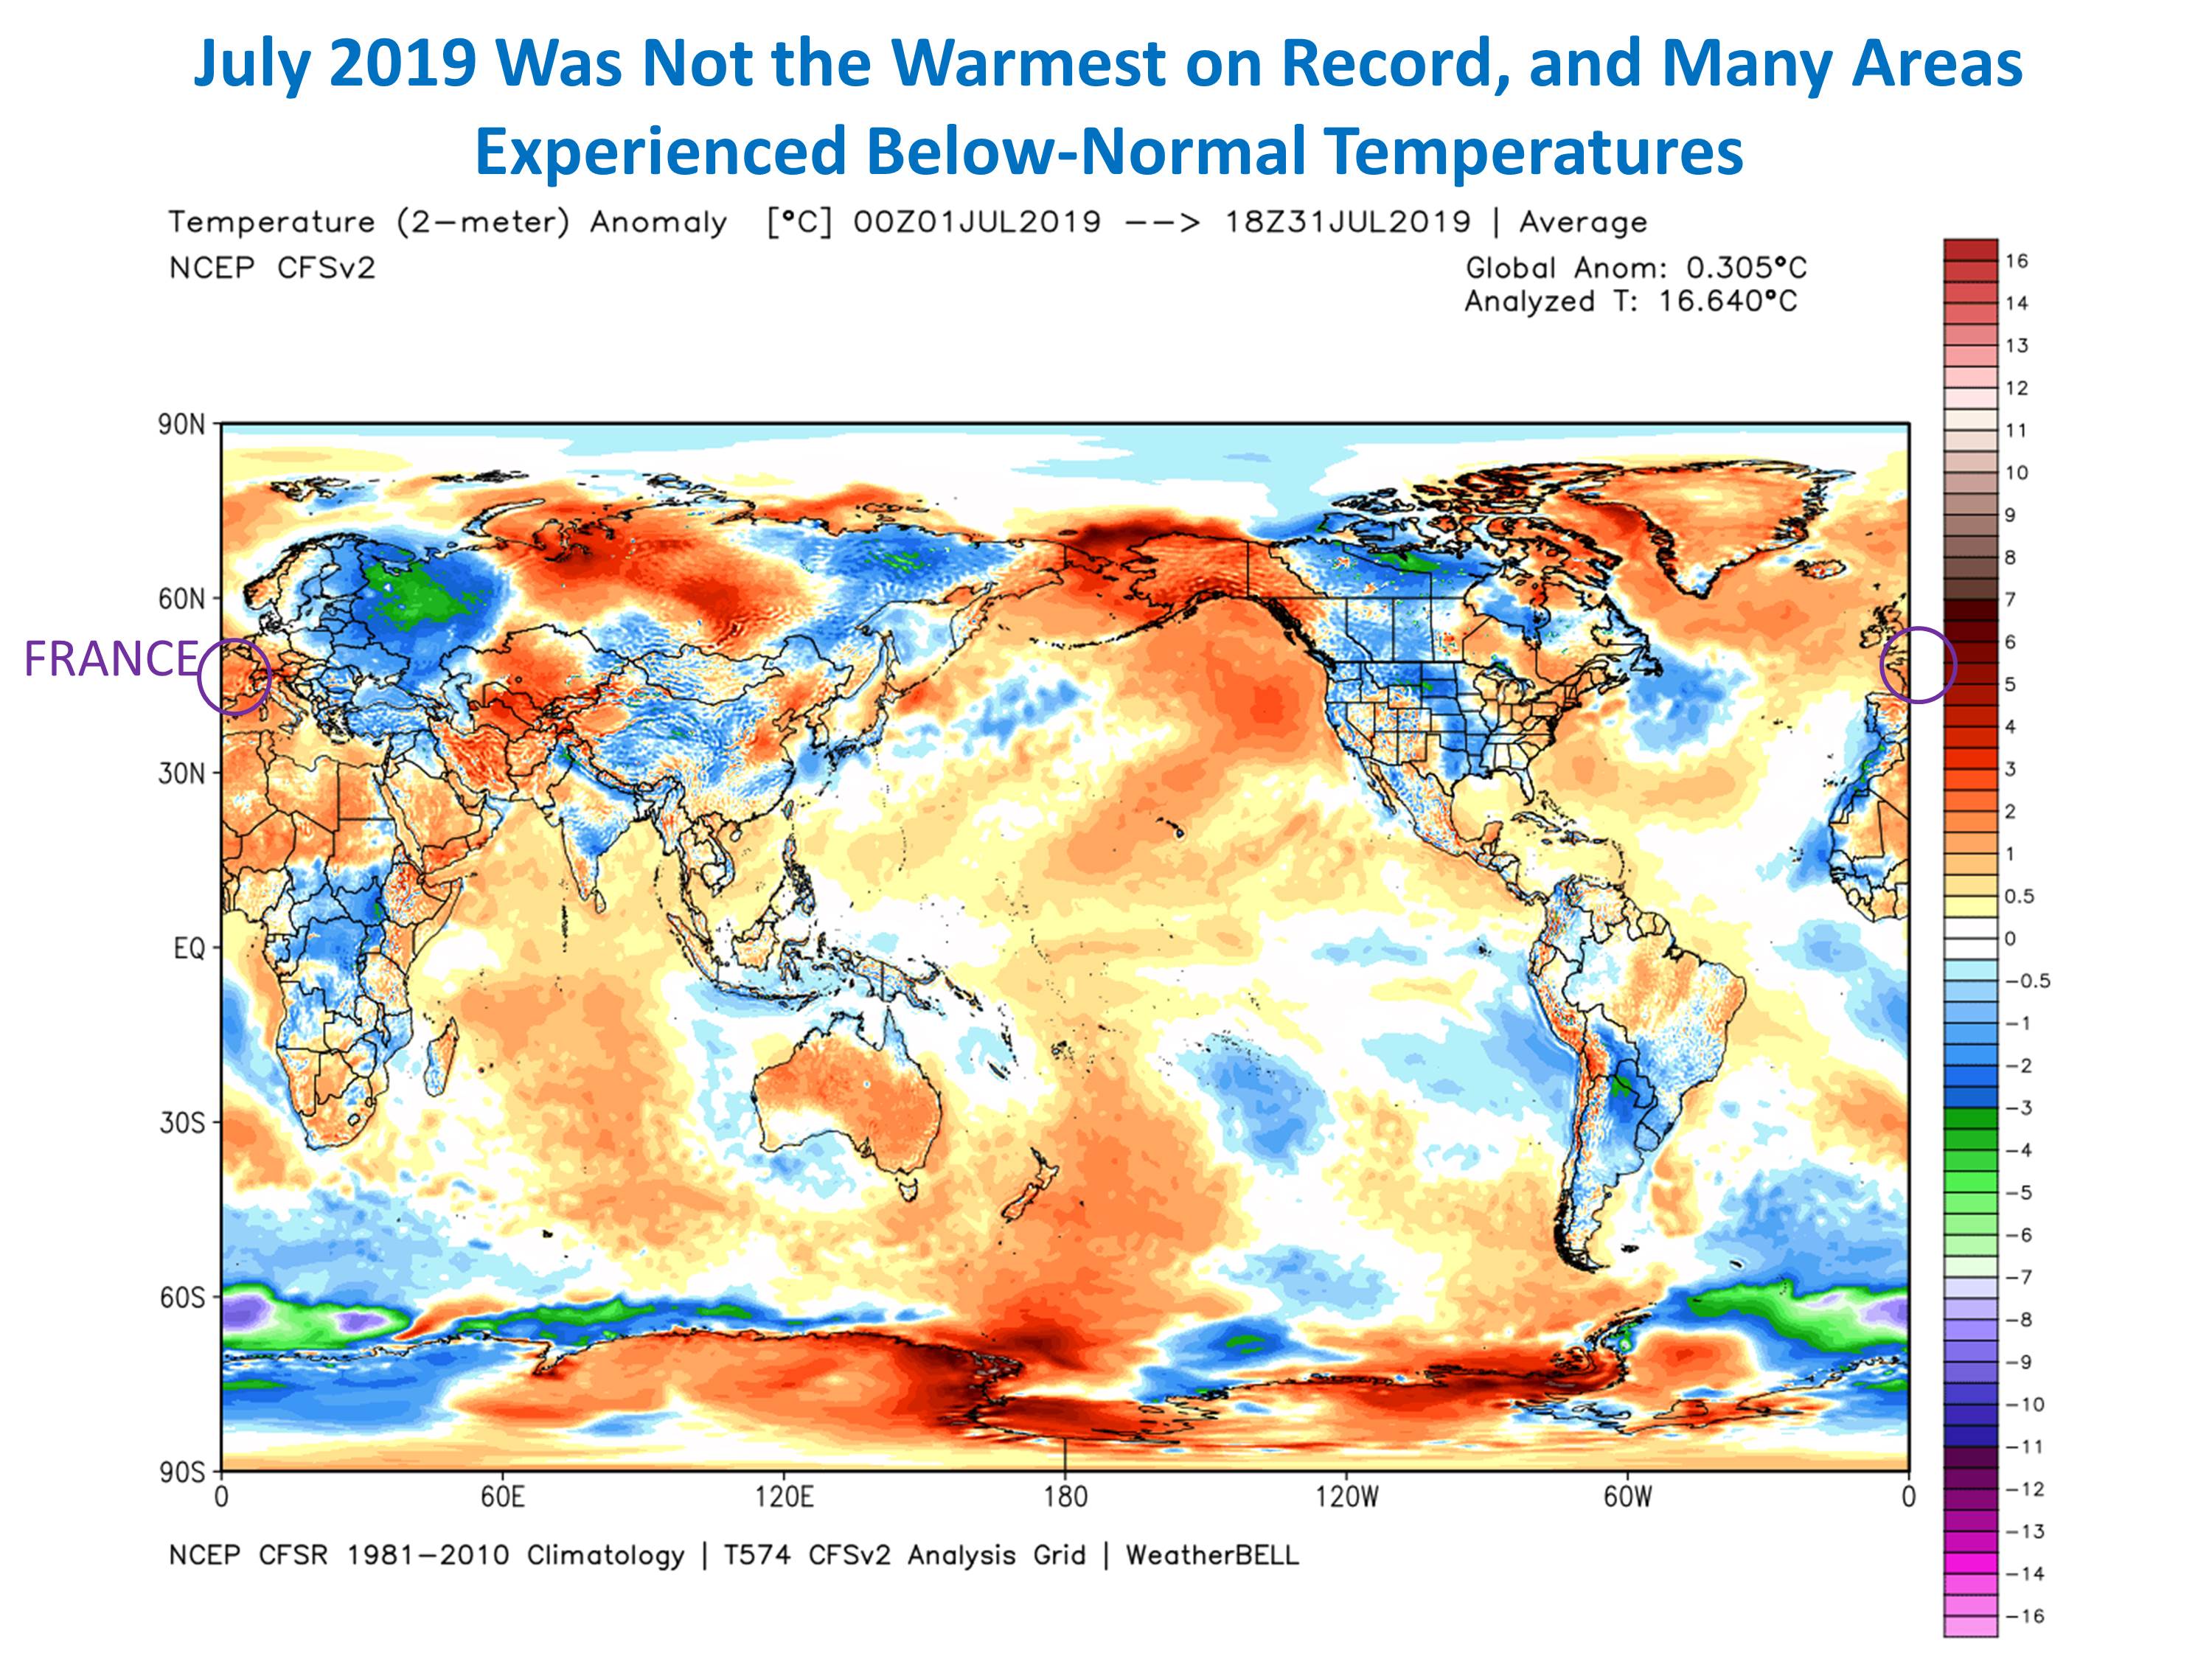
Note from that figure how distorted the news reporting was concerning the temporary hot spells in France, which the media reports said contributed to global-average warmth. Yes, it was unusually warm in France in July. But look at the cold in Eastern Europe and western Russia. Where was the reporting on that? How about the fact that the U.S. was, on average, below normal?
The CFSv2 reanalysis dataset goes back to only 1979, and from it we find that July 2019 was actually cooler than three other Julys: 2016, 2002, and 2017, and so was 4th warmest in 41 years. And being only 0.5 deg. F above average is not terribly alarming.
Our UAH lower tropospheric temperature measurements had July 2019 as the third warmest, behind 1998 and 2016, at +0.38 C above normal.
Why don’t the people who track global temperatures use the reanalysis datasets?
The main limitation with the reanalysis datasets is that most only go back to 1979, and I believe at least one goes back to the 1950s. Since people who monitor global temperature trends want data as far back as possible (at least 1900 or before) they can legitimately say they want to construct their own datasets from the longest record of data: from surface thermometers.
But most warming has (arguably) occurred in the last 50 years, and if one is trying to tie global temperature to greenhouse gas emissions, the period since 1979 (the last 40+ years) seems sufficient since that is the period with the greatest greenhouse gas emissions and so when the most warming should be observed.
So, I suggest that the global reanalysis datasets be used to give a more accurate estimate of changes in global temperature for the purposes of monitoring warming trends over the last 40 years, and going forward in time. They are clearly the most physically-based datasets, having been optimized to produce the best weather forecasts, and are less prone to ad hoc fiddling with adjustments to get what the dataset provider thinks should be the answer, rather than letting the physics of the atmosphere decide.


