Why Haven’t the Tropics Warmed Much? A Tantalizing Piece of Evidence

September 28th, 2019 by Roy W. Spencer, Ph. D.

The radiative resistance to global temperature change is what limits the temperature change in response to radiative forcing from (say) increasing CO2, or the sun suddenly deciding to pump out a 1 percent more sunlight.

If the climate system sheds only a little extra energy with warming, it warms even more until radiative energy balance is restored. If it sheds a lot of energy, then very little warming is required to restore global energy balance. This is the climate sensitivity holy grail, and it will determine just how much warming results from increasing CO2 in the atmosphere.

John Christy and I are preparing a paper based upon Dept. of Energy-sponsored research explaining why the tropical troposphere hasn’t warmed as much in nature as in climate models. (The discrepancy exists for surface temperature trends; for both RSS and UAH tropical tropospheric trends; as well as for global reanalysis datasets). Danny Braswell and I did a lot of research on this subject about 5-10 years ago, and published several papers.

Without going into the gory details of why it is so difficult to measure “feedbacks” (how strong the climate system radiatively resists a temperature change in response to radiative forcing), I’m going to present one graph of new results from our work that suggests where the problem with the models might be.

The plot I will show is based upon month-to-month variations in area-averaged tropical (30N-30S) tropospheric temperatures. When those temperature changes are the largest, we expect to see the clearest signal of radiative resistance (negative “feedback”) which, by definition, is a response to that temperature change. In contrast, if the month-to-month temperature change was zero, any change in radiative flux would result in an infinite feedback parameter, which is clearly unphysical.

So, let’s focus on the biggest observed temperature changes. If we take the 10% of the 224 months of detrended CERES satellite radiative flux data (March 2000 through October 2018) which have the LARGEST month-to-month temperature changes (warming and cooling) in detrended UAH LT data, and compare them, we get the following plot of diagnosed feedback parameter (flux change divided by temperature change) versus average absolute temperature change. Also included in the plot are the results computed in the same manner from 19 different CMIP5 climate models, where I have used the model surface to 500 mb geopotential thickness converted to temperature to approximate the UAH LT product.

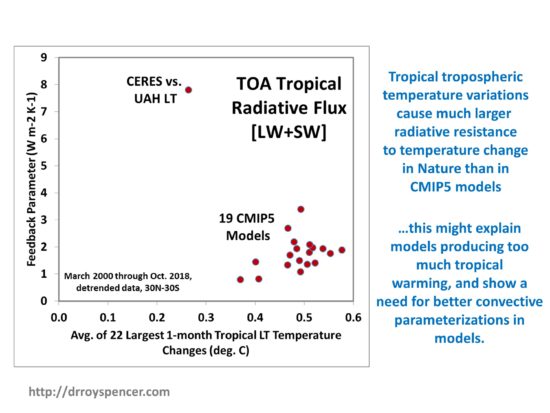
There is a clear discrepancy between the 19 different climate models and the observations. The observations suggest a much larger resistance to a temperature change (vertical axis) than the models do, by over a factor of 4, for the same temperature change. This large feedback parameter is probably why the observations also show the smallest month-to-month temperature changes (horizontal axis) compared to the models (about 50% weaker than the models): the radiative resistance to temperature change actually reduces the month-to-month temperature fluctuations.

What Does this Mean?

The results are qualitatively consistent with Lindzen’s “infrared iris” effect, as we find the discrepancy between models and observations is larger in the infrared (LW) component of radiative flux than in the reflected solar (SW) component (SW and LW plots not shown here).

Interestingly, I had to exclude the GISS model results because they show increasing temperatures lead to a feedback parameter with the wrong sign, which is not physically possible for a stable climate system. It could be the GISS model has issues with energy conservation.

Just how these results would impact global warming projections remains to be seen. First, improvements in how tropical convection and its associated clouds and vertical distributions of water vapor *change with temperature* would have to be put into the models. Then, the models would have to be run with increasing CO2 to see whether model projections of warming are reduced.

My prediction is that, if this was done, the models would produce considerably less tropical warming than they currently do. This might also extend to reduced warming rates outside of the tropics, since the tropics export excess heat energy to higher latitudes. If less heat builds up in the tropics, less will be exported out of the tropics.

We have many more results on this issue, including comparisons to a simple time-dependent forcing-feedback model that can replicate both the observations and the CMIP5 model behavior.


189 Responses to “Why Haven’t the Tropics Warmed Much? A Tantalizing Piece of Evidence”

Toggle Trackbacks

  1. Michael Lorrey says:

    I hope you have factored in the curved-Earth geometry into your radiative model like we discussed. I know you don’t think it is significant, but a discrepancy of 5-6% by the time you reach the upper troposphere means a lot to a feedback loop.

  2. PhilJ says:

    Why haven’t the tropics warmed much?

    Perhaps because most of the increased uvb ab*sor*pt*ion (due to low ozone levels) occurs at higher latitudes?

    • Greg Goodman says:

      ozone is mainly present in lower stratosphere, not mid or upper tropo.

    • Mick says:

      More water vapour from el ninos over the last 20 years, moderates cold dry areas like the arctic than warm temperate climates.
      That’s why the desert has extreme temperature swings. Low moisture levels. Yet CO2 stays constant or even increases over time.
      ergo: not CO2

  3. First, thanks for a most interesting study.

    Next, a question. What did you use as the TOA downwelling LW from the CERES dataset? CERES provides the following TOA datasets:

    toa_sw_all
    toa_lw_all
    toa_net_all
    toa_sw_clr
    toa_lw_clr
    toa_net_clr
    toa_cre_sw
    toa_cre_lw
    toa_cre_net
    solar

    For overall downwelling LW, I use the surface upwelling LW (surf_lw_up_all) minus the TOA upwelling LW (toa_lw_all). This is net LW that is absorbed by the atmosphere, and thus is downwelling LW. However, it is NOT TOA, but instead a total effect of the entire atmosphere.

    Many thanks, good stuff,

    w.

    • Roy W. Spencer says:

      I use TOA LW_all and SW_all and LW_clr and SW_clr. I don’t trust observational estimates of fluxes at the surface (except at instrumented sites) so I wouldn’t trust those comparisons to models.

      • Svante says:

        Hi Roy, a lot of your old blog entries are open for comments, should they not be closed?

        Example:
        http://www.drroyspencer.com/2018/11/the-sorry-state-of-climate-science-peer-review-and-kudos-to-nic-lewis/#comment-391624

        • Chris Erikson says:

          Why the interest in leaving old comment places open? New observations on old comments may be just as valid.

          I have never understood why some people are so resistant to leaving old threads, or comments, open. If there is no activity, they fade anyway, if there is new activity, then the comments can be perfectly valid.

          • Lewis guignard says:

            Making comments on old blogs may work well if the blogs notifies one of new replies. Otherwise, a new comment will not likely be read, or only by a very few. On the other hand, if someone new is looking at the blog, a newer comment will be just as germane as any of the earlier ones.
            So, I vote, leave comments open.

        • barry says:

          I suppose – but they are of limited value a month or two down the road, when no one is reading them anymore. There is no alert for new posts here, so the only people reading the old threads to pick up the last comment would be those reading all the comments. That’s a rare breed indeed, and would not apply to any of the regulars here, who move on from old threads. IOW, new comments on old threads don’t get read.

  4. Berdine LaVoy says:

    Roy with all due respect.

    I am not a scientist, however I have been reading and watching talks about Solar Forcing. There have been plenty of peer reviewed studies on Solar Forcing, Solar Particle Forcing and how they effect warming and cooling of the planet. Solar Forcing is not limited to Visible light or TSI but includes radiation in the invisible light spectrum and particles that bombard our earth as well. Moreover, there are also studies that have shown that the magnetic and electrical connections of the sun to earth effect weather patterns also. Suspicious Observers who you may be familiar with has produced numerous videos discussing this with contributions from Plasma Scientists. This is one video that provides information about this https://www.youtube.com/watch?v=rEWoPzaDmOA. This video discusses among things that the IPCC is introducing Solar Particle Forcing into it’s next report due out in 2022 https://www.youtube.com/watch?v=m-pvJ00E8ZE&t=7s. Roy, I must say that you have my complete respect as a leading world Scientist on Climate.

  5. Forget about the so-called “models”.

    There are no models — not of climate change on this planet.

    There are “computer games” that make wrong climate predictions.

    Long before there were GCMs to make wrong predictions, didn’t the Greenhouse Effect Theory tell us that warm, humid areas would have the least warming, while cold, dry areas would have the most warming … because water vapor was the primary greenhouse gas ?

    That seemed to make sense when looking at the Northern Hemisphere … but just the opposite happened in the Southern Hemisphere.

    The chart at the link below shows what I mean:

    https://elonionbloggle.blogspot.com/2019/09/if-greenhouse-gas-theory-is-correct.html

  6. While the underlying pathway is complex, you’ve illustrated the issue quite simply.

    I’m not surprised that GISS Model E creates a feedback with the wrong sign. That is one of the earliest climate models, with many people working on it over the years since about 1987.

    As a result, it’s pretty much spaghetti code that has never been subjected to any sort of quality control review except withing the incestuous GISS/Columbia ecosystem.

    • Curious George says:

      GISS Model E has “a feedback parameter with the wrong sign, which is not physically possible for a stable climate system.” That’s a strong statement. How sure are we that the climate system is stable?

      • Roy W. Spencer says:

        Because if it wasn’t we wouldn’t be around to discuss it.

        • Curious George says:

          Is the GISS Model E still included in CMIP5?

          • Roy W. Spencer says:

            Yes, in fact, GISS submits more model runs for archival than any other modeling center. I have no idea why.

          • Chris Morris says:

            “Yes, in fact, GISS submits more model runs for archival than any other modeling center. I have no idea why.”
            If one was being cynical, the more model runs you submit, the closer the average will be to at least one of your runs. Then you can claim kudos for predicting the “right” simulation.

          • Stephen P Anderson says:

            You have to continue submitting updates to models when the baseis for your models are incorrect.

        • Frank from NoVA says:

          Dr. Spencer,

          Please, let’s look at this from the viewpoint of post-modern science — how do we know we’re around?

          All kidding aside, very nice work! Thank you.

          • Stephen P Anderson says:

            Science should be based on intuition and common sense. A statement like “if the climate system wasn’t stable we wouldn’t be here” is intuitively obvious. The leftists have come up with all kinds of permutations and propaganda which defy logic opposing this intuitive common sense view.

          • bdgwx says:

            Stable needs to be defined objectively then. I think what Roy means that is global mean temperatures are constrained within a range. That doesn’t mean that the temperature doesn’t change. Afterall, the PETM, other ETMx events, glacial cycles, etc. all happened and we’re still here even though those epochs weren’t “stable” under a more strict definition.

          • barry says:

            Precise definitions are a minimum requirement to communicate science. For example, who is “we” in “we’re still here,” when there were no humans during the PETM?

            At blog level discussions, especially on climate, a huge amount of disagreement and confusion boils down to terminology.

        • gallopingcamel says:

          Profound.

  7. Eben says:

    I can answer this in one sentence
    It is because
    A- CO2 does not cause warming
    B- computor models have no ability to predict absolutely anything other than what the programmers decided to start with

  8. Nabil Swedan says:

    Way too complex for my brain to comprehend. There must be a simpler explanation out there.

  9. Randy A Bork says:

    Is the ‘flux change’ number used for the 10% of months used in this calculation for observation data the same as the flux change used in the calculation for the models? Or do the models somehow produce an independant flux change number?

  10. Andrew stout says:

    Dr Spencer, I’m just an enthusiast so my understanding is shallow, but I looked up Lindzens infrared iris to follow your article, and I’m curious: generally I’ve thought Understanding how cloud cover is actually a negative feedback , by reflecting energy back into space prior to getting to the surface, might be the lynchpin to understanding why Climate models are all wrong. But that hypothis sees the absence of clouds as the negative feedback : in your opinion, are the negative-feedback reflective properties less potent than the negative feedback of no trapping effect? I also might be asking the wrong Question. Many thanks, -A

  11. Alick says:

    If 1 Btu is the energy equivalent of 778 ft lbs, then is it safe to say the energy required to raise 1 lb of water 1 degF is the same amount of energy required to raise 1 lb of water 778 ft?

    If so, I weigh 180 lbs and I could heat up some water from 32 degF to 212 degF and use that energy to lift my lazy ass 778 ft.

  12. I ask for examining mechanisms that increase cooling of the tropics in response to global warming, for determining if some of these to increase transport of heat from the tropics to elsewhere. For one thing, I suspect heat transport can increase even if global atmospheric circulation slows down (due to polar amplification, even if only around one pole) as a result of increased water vapor presence.

    Also, I expect global warming from increase of GHGs to make convective clouds more efficient, which would make the cloud feedback a positive one, although with decrease of atmospheric relative humidity because updrafting clouds cover a smaller percentage of the globe as they get more water vapor to work with, so a larger percentage of the world gets covered by downdrafts with low humidity. I expect that because of this, the combined feedback factor of water vapor feedback and cloud albedo feedback is positive, but no more positive than the water vapor positive feedback alone would be with assumption of unchanged relative humidity. For that matter, I guesstimate around .2 W/m^2 per degree C/K less positive than the water vapor feedback alone would be with relative humidity being unchanging. Also, I expect the lapse rate negative feedback to get more negative in response to warming, and the surface albedo positive feedback to mostly become less positive in response to warming.

  13. donald penman says:

    What effect does the level of solar radiation have on the Enso signal it may just be starting to respond to low solar radiation after a ten year lag by remaining close to normal now. We have seen no large la Nina response to the last large el Nino . Could we remain Enso neutral for the next few decades?

  14. Aaron S says:

    Sounds good to read the call for calibration of models with empirical data.

  15. dai davies says:

    This raises two questions for me. The first is how the models deal with radiative flux. I’ve never seen a detailed explanation. Has there been a post on this at this site?

    The second is whether they include horizontal radiative transfer that allows radiative leaking through the gaps on small grained cellular cloud formations greater than you would get just considering vertical transfer.

  16. Mark Wapples says:

    Could the answer not be that convection not radiation is the major heat transfer system in the tropics.

  17. Entropic man says:

    Dr Spencer

    “This might also extend to reduced warming rates outside of the tropics, since the tropics export excess heat energy to higher latitudes. If less heat builds up in the tropics, less will be exported out of the tropics.”

    Have you considered an alternative explaination?

    The rate of warming is lowest in the tropics and highest at the poles. If CMIP5 underestimates the rate of heat export from the tropics it would overestimate the tropical temperatures as you describe.

    This should be testable.

    If the overall rate of warming is overestimated by the models, then both tropical and high latitude temperatures would be overestimated.

    If the rate of export is underestimated, then tropical temperatures would be overestimated and high latitude temperatures would be underestimated.

  18. Erik Aamot says:

    come effects of heat and convection are counter-intuitive
    this explaining the African Humid Period just blew my ming

    https://www.youtube.com/watch?v=CM_QS984JKI

  19. frankclimate says:

    Roy, are you aware of this paper: https://www.researchgate.net/publication/335650196_Indian_Ocean_Warming_Trend_Reduces_Pacific_Warming_Response_to_Anthropogenic_Greenhouse_Gases_An_Interbasin_Thermostat_Mechanism ? Also this earlier is interesting: https://www.sciencedirect.com/science/article/pii/S0377026518301222?via%3Dihub .
    They find an “interbassin thermostat”, in short it leads to a negative “upwelling feedback” in the east Pacific. GCM don’t replicate it. One of many possible reasons why they are running hot…

  20. Jeff Id says:

    Very interesting work. I can’t wait to read the rest.

  21. Lasse says:

    This will be fun to follow.
    Willis E commenting above is a sign of quality!
    His thermostat can be quantified!

  22. Stephen P Anderson says:

    More on the Thunberg front:

    https://www.youtube.com/watch?v=pV4VBcWYSC8

    • barry says:

      “front” ?

      the foremost line or part of an armed force; the furthest position that an army has reached and where the enemy is or may be engaged

      Is there a war on?

    • Norman says:

      Stephen P Anderson

      Here is a longer and more in depth analysis of Thunberg.

      https://www.youtube.com/watch?v=9Jpk8Ix1CCg&feature=youtu.be

      • Nate says:

        Norman, even YOU going the smear the child-messenger route?

        You really buy into this conspiracy-themed nonsense?

        “Here are some of the top reasons why Greta Thunberg is a pawn and a fraud, manufactured by PR firms and used by an army of globalist climate change alarmists that seek to gain more financial and political control. They are creating an apocalyptic cult obsesses with the end of the world.”

        Of course Ms. Thuneburg exaggerates some things. She is only 16.

        Deniers who are generally old and have little at stake, distort facts, promote conspiracy theories, and exaggerate the problems of renewable energy.

        They are old enough to know better.

        • Norman says:

          Nate

          Yes when there is money on the table many things are possible and lots of manipulations take place.

          I like to look at the issue from many sides.

          Problem with renewables is not so much the cost of the electricity. It is about getting the energy when you need it.

          Here is one source:
          https://www.e-education.psu.edu/eme807/node/667

          If it was not for climate change hysteria there would not be a multi-billion dollar wind industry. Someone profits greatly from pushing the worst case scenarios with climate change. Greta is pushing the worst case. I do not know what science this is based upon. So far I do not see evidence for any worst case scenario.

          https://www.nrel.gov/docs/fy17osti/68227.pdf

          The billions spent would not occur if climate change hysteria was not a market product to enrich some people.

        • Nate says:

          No need to smear a brave young women whose main message has been ‘listen to the scientists”.

          The idea of supporting renewable energy has been around for a long time. Remember the solar panels on the white house? With several motivations.

          No hysteria needed.

          Wind in great plains is cheaper than coal.
          Solar in southwest is cost competitive.

          Govt support brought this about.

        • Nate says:

          And yes profit comes to energy producers, as it should.

          And with a mix of sources inclu nuclear, wide distribution, a smart grid, and advances in energy storage, intermittency is hardly an insurmountable problem.

          You re echoing the auto industry in the 70s, saying low polluting cars are impossible, will bankrupt the industry!

          • Norman says:

            Nate

            YOU: “You re echoing the auto industry in the 70s, saying low polluting cars are impossible, will bankrupt the industry!”

            No that is not at all what I am stating. I will give you a link to MISO energy please put it on your favorites and look at it daily. Now you will see wind providing a decent amount of power. Watch in the middle of summer when the wind does not blow. I have calculated how many big truck batteries would be needed just to supply one day of energy use in the MISO region summer months demand. You should use your math skills and do your own calculations. You will see there is nothing even remotely available to make wind energy a mains source of power.

            Here is the MISO link. I want all politicians and even Greta to look at it. You can go with large amounts of summer months with no electricity at all. That is about the only actual solution with wind.

            https://www.misoenergy.org/markets-and-operations/real-time–market-data/real-time-displays/

            Again please accept that no one is saying anything about the cost of wind power verses fossil fuels. The point is the reliability of each. Wind is great when it blows. What do you do when it doesn’t. The cost of wind power is pointless then. The argument is NOT about the cost, it is about the availability of the source.

          • Nate says:

            ‘And with a mix of sources inclu nuclear, wide distribution, a smart grid, and advances in energy storage, intermittency is hardly an insurmountable problem.’

            It seems like you ignored this part.

            In the case of the auto industry, the ‘impossible’ low emission car disappeared rather quickly when they needed to develop the catalytic converter technology.

            I am confident that cheaper energy storage technology will become available, when needed.
            Energy storage possibilities: pumped hydro, compressed air in mines, flywheels…

            “You can go with large amounts of summer months with no electricity at all.”

            Why would you think the grid supply would ever be 100% wind?

            Your MISO site seems to show that the grid is smart enough to bring in different suppliers as needed, some far away, during peak demand, I assume as cheaply as possible.

            I agree that this is an issue, but not a fundamental one.

          • Norman says:

            Nate

            I am not even close to confident such energy storage is anywhere on even the distant horizon. Those ideas you suggest would not even come close to supplying the energy needed to satisfy demand. You need to do some actual calculations. You need to supply about 120,000 MW peak load during summer months in just the MISO region. Calculate how much compressed air storage you need to store this energy or how many flywheels. I think the answer will astound you.https://en.wikipedia.org/wiki/Hoover_Dam

            https://en.wikipedia.org/wiki/Hoover_Dam

            Hoover Dam produces 2080 MW. You would need 60 of these to store the energy needed to supply MISO customers. Where are all these large lakes and dams going to be built? Then if you don’t have wind for a few days your lakes will run out of water.

            If you look at the MISO pie graph. You have to remove all fossil fuel energy production (natural gas as well). Also there are a lot of environmental groups that want to eliminate nuclear. Now you are left with just mainly wind and some hydro. You need to build about 10 times the windmill number already built. But you would have to build probably 10 times that number to be able to have enough excess wind energy when it blows so you have some when it stops. That would get you 10 days of storage when the wind did not blow. After that, lights go out. You really should look at wind energy during the summer months. Wind is often below 1000 MW production when the demand is over 120,000 MW and it can persist like that for several days with only a change when a storm system moves in which lasts a couple of days.

          • Svante says:

            It’s not just storage, an HVDC supergrid can even out load and production. Water power is the perfect backup for wind and solar because it can ramp up fast. China is the leader but Canada also has quite a few HVDC lines bringing water power north to south. The Pacific Intertie does seasonal load balancing between California and the north west.

            See this mix:
            https://en.wikipedia.org/wiki/Super_grid#/media/File:TREC-Map-en.jpg

            Add some natural gas turbines as backup if you like, and nuclear power if you can afford it.

            If all else fails free markets will balance supply and demand (by definition).

          • Nate says:

            Good points Svante.

            it is a strawman to imagine a future with current technology and 100% wind.

            Undoubtedly in 30 years we will have a potpourri of suppliers, with a larger proportion of renewable.

            If you look at history, it takes about 30 y for a new energy source to become a major player (~ 20 %) in energy mix.

            True for hydro 1930s-1960s, nuclear 1950s-1980s, gas 50s-80s?

            Currently wind and solar are ramping up withvthe same trajectory.

          • Stephen P Anderson says:

            Nate,

            It is diabolical for adults to hide behind a child to spew their propaganda. This child is being abused by her handlers.

          • Nate says:

            Stephen,

            I work with many young people. Many are concerned about climate change. They dont need ‘handlers’.

            Lets face it, it will impact them more than us.

            BTW, are you upset with your buddy John Solomon? He seems to have helped get Trump into this fine mess.

  23. David Young says:

    Roy, If I understand your plot correctly it also seems to indicate that the average month to month changes in climate model temperatures are a lot larger than those measured by satellites. This would imply that model “internal variability” is too high. Is this a correct interpretation?

    • bdgwx says:

      I can’t speak for Dr. Spencer, but that is the interpretation I have as well. That and it takes less W/m^2 of forcing to induce a change in temperature. One thing is clear here…models aren’t perfect and I suspect if the mid troposphere tropical hotspot problem were to tighten up a bit then the analysis here would fall more inline as well.

    • Dr Roys Emergency Moderation Team says:

      bdgwx, please stop trolling.

  24. Rob JM says:

    Roy, look at the water vapour in the upper troposphere.
    The enhanced GHG theory state static relative humidity,
    The observations show declining relative and specific humidity.
    There is no hotspot because there is no increase in humidity/water vapour positive feedback.
    That is falsification.

  25. Eben says:

    She is back – to compete with Greta

    https://youtu.be/ZXK_47TXo84

  26. Kristian says:

    Spencer, you write:

    If the climate system sheds only a little extra energy with warming, it warms even more until radiative energy balance is restored. If it sheds a lot of energy, then very little warming is required to restore global energy balance.

    Or no warming at all. It’s not like there MUST be warming. Please stop just assuming that as an established fact. There’s no physical law demanding this to be the case.

    As long as Earth sheds an amount of energy that corresponds more or less 1:1 to the tropospheric temperature, that is, if the T_e/OLR is observed to simply track T_tropo/TLT over several decades, then that means there is no “greenhouse” warming to be discerned. And if, during that same time span, we observe that the solar heat input to the Earth system (the ASR, not the TSI) has increased significantly, then we pretty much know what caused the warming …

    This isn’t very complicated. There is a positive ToA imbalance, causing energy to pile up inside the Earth system, in turn forcing the globe to warm overall. Such an imbalance can be the result of 1) more heat coming IN (ASR, SW_net), or 2) less heat going OUT (OLR, LW_net).

    Well, OLR hasn’t gone down, while ASR has gone markedly up.

    So we know the cause of the positive imbalance. More heat IN. Not less heat OUT.

    The Sun+clouds/Earth’s internal variability are responsible. Not Man.

    • MDBill says:

      That’s way too logical, Kristian. Takes all the fun (and money) out of tilting with the windmills, or “models” in this case. If you can’t beat ’em, join them, eh Roy?

    • Nate says:

      ‘This isnt very complicated.’

      But analyzing the available data is more complicated than you portray it.

      ‘They track pretty well, I would say. Over a 33y period.’

      Sure if you work at it and make the data behave as you desire.

      • Kristian says:

        Nate says, October 1, 2019 at 11:53 AM:

        (…) analyzing the available data is more complicated than you portray it.

        How? It shows what it shows, Nate. There’s no hiding from it. The ASR went up and so did the OLR. What, then, caused the positive imbalance? Hard?

        Sure if you work at it and make the data behave as you desire.

        How have I “worked” at the data, Nate? I use the data exactly as it’s presented, and use the same offset between the two datasets as Loeb et al. and (your heroes) Allan et al. do, based directly on TRMM-CERES calibrations. Also, the particular 99-00 offset is neatly supported by both ISCCP-FD, HIRS and AVHRR data. Is all of this something you have a problem with?

        Or is it simply that you don’t like what the data shows …?

      • Nate says:

        Each time its as if we never discussed it all before.

        You know all the issues, but pretend you dont.

        No error analysis. No quantitative comparison to theory. No hypothesis test.

        No one has published a continous 33 y record of olr that agrees with what you show.

        There are systematic errors that you ignore that make creating such a record difficult, as Allen showed.

        • Kristian says:

          Nate says, October 1, 2019 at 7:03 PM:

          Each time its as if we never discussed it all before.

          Yup.

          You know all the issues, but pretend you dont.

          The only issues that exist on this matter are the ones YOU struggle with, Nate. This is a settled case. You’re wrong, I’m right. I will simply refer you to the official data sources.

          Also, read my analysis, even incorporating your particular (yet bizarre) objections. It’s all there for everyone to see. You have no case, Nate. It’s all merely cognitive dissonant bluster on your part.

          https://okulaer.wordpress.com/2018/03/24/the-data-sun-not-man-is-what-caused-and-causes-global-warming/

          https://okulaer.wordpress.com/2018/06/26/verifying-my-near-global-1985-2017-olr-record/

          No error analysis.

          Read the data quality summaries of the original series. It’s not my data, Nate. The offset between the two sets is verified and thus validated directly against other/independent data sources (ISCCP FD, HIRS, AVHRR) and aligns directly with the calibrations done by Loeb et al. (tropics) and Allan et al. (global), based on the TRMM-CERES overlap. It also agrees with the new ERBS Ed4 data update project overseen by Sato.

          And the worst thing is, you know about all of this, Nate. Because you’ve been told and shown repeatedly in the past. And STILL you pretend you don’t know. STILL you come back with the very same objections. STILL pretending you have some sort of case. You don’t. If you don’t like the data I present, go argue with the people repsonsible for it, not with me.

          No hypothesis test.

          The hypothesis test is right there in front of you. The “enhanced GHE” hypothesis failed it. That’s the whole point here. You cannot accept this fact, and so all you do each and every time is try to obfuscate the issue as much as possible. Nothing else. You bring nothing new to the table.

          The data stands.

          No one has published a continous 33 y record of olr that agrees with what you show.

          It’s ERBS+CERES, Nate. That’s all. It now covers ~34 years. With the TRMM-CERES offset across the small 99-00 data gap incorporated. Employed by Allan et al. as well. And also used by the people behind the new ERBS Ed4 dataset.

          Do you have a problem with all this?

          There are systematic errors that you ignore that make creating such a record difficult, as Allen showed.

          *Sigh*

          Again with this nonsense? There are no systematic errors, Nate. That whole thing is Allan’s (and Trenberth’s) fantasy and thus invention. Nothing else. This particular issue was looked into and thoroughly dismissed ages ago, by the people actually collecting the data and compiling the dataset in question. Which you know full well.

          There is nothing there. You, Allan and Trenberth are grasping at straws that aren’t even there. And it’s all been explained to you again and again. I discussed it already in my original analysis (links above). But I guess you still have ready any of them.

          You have to do better than this, Nate.

        • Nate says:

          ” YOU struggle with, Nate. This is a settled case. Youre wrong, Im right.”

          Oh I hadnt realized that you published your analysis and conclusions, gotten glowing reviews from the professionals, and its already been replicated?

          You honestly believe that the systematic error in the global olr was kown well enough in the late 80s? Well enough to compare with today’s values with less than 1 W/m2 error?

          Nope. That is why you dont see any such comparison made by the professionals.

        • Nate says:

          , No hypothesis test.

          The hypothesis test is right there in front of you. The ‘enhanced GHE’ hypothesis failed it. Thats the whole point here. You cannot accept this fact, and so all you do each and every time is try to obfuscate the issue as much as possible. ”

          No. If ‘enhanced GHE’ theory had failed something, I would see a curve for that prediction. I would see that the data misses that prediction, by an amount significantly larger than the errors.

          Science 101. How to test a hypothesis.

  27. steve case says:

    The IPCC’s AR4 Chapter ten Executive summary page 750 Temperature Extremes tells us:

    It is very likely that heat waves will be more intense, more frequent and longer lasting in a future warmer climate. Cold episodes are projected to decrease significantly in a future warmer climate. Almost everywhere, daily minimum temperatures are projected to increase faster than daily maximum temperatures, leading to a decrease in diurnal temperature range. Decreases in frost days are projected to occur almost everywhere in the middle and high latitudes, with a comparable increase in growing season length.

    I have taken that to mean that the warming will be at night, in winter and in the higher latitudes. Day time, summertime and in the tropics, not so much.

    I post that quite often in various blogs, forums and comment sections when someone starts telling me about how hurricanes are going to be more severe or some other tropical or summertime phenomenon is going to doom us all. Sort of wonder how heat waves will be more intense when the daily max is in the not so much category.

    • gbaikie says:

      Urban Heat island effect [though mostly warming night time temperatures] can increase heatwaves {increase number days it is warmer}.
      So human effects can increase heat waves, though UHI effects are not about CO2 {though some might imagine it is}.

    • Bindidon says:

      steve case

      “I have taken that to mean that the warming will be at night, in winter and in the higher latitudes. Day time, summertime and in the tropics, not so much.”

      Plain correct.

      The world imho is not so much directly warming, it warms indirectly because it becomes less cool.

      And I have some doubt about heat waves becoming “more intense, more frequent and longer lasting” in the very near future, at least as far as Europe is concerned: 2003 is now 16 years ago, AR4 was dated 2007, and the heat wave we experienced this year in France & Germany was far below that of 2003.

    • barry says:

      And what time period is meant by “future” warmer climate?

      It’s 12 years since that was written. Are we at that future warmer climate now, or did the passage refer to a time further off?

      • steve case says:

        barry says:
        September 30, 2019 at 9:08 PM
        And what time period is meant by future warmer climate?

        Its 12 years since that was written. Are we at that future warmer climate now, or did the passage refer to a time further off?

        I put up the link to Chapter Ten of the IPCC’s AR4. I assume from your question you didn’t read any of it or do any sort of investigation to answer that for your self.

        A word search on “2100” turned up 110 hits for chapter ten. The previous page to the quote above talked about modeling warming for the early 21st century (2011 to 2030).

        I am reminded of a line from my file of pithy quotes, snarks and smart remarks:

        The most important lesson in Climate Science: Never make an
        unfounded assertion on a timeline that expires before you do.

      • barry says:

        Sorry, did you provide a direct answer there? I couldn’t make it out.

  28. donald penman says:

    The sun shines on the mid latitudes as well as it does on the tropics and it also loses that heat in the same way as the tropics, because the tropics are warmer they radiate more heat to space and have a higher surface temperature than the mid latitudes. Any mixing of temperatures between the two zones is two way not just one way. The mid latitudes is not the place where heat goes from the tropics in order to get radiated to space it would radiate more if it stayed in the tropics. the movement of water vapour from the tropics to the mid latitudes reduces the ability of the mid latitudes to radiate to space therefore it does not decrease the Earths temperature. this is simply how I see this.

    • bdgwx says:

      But I think we can agree that advective processes move heat away from the tropics and into the mid latitudes. If models underestimate the transport of heat away from the tropics then might that explain the mid troposphere tropical hotspot?

    • Dr Roys Emergency Moderation Team says:

      bdgwx, please stop trolling.

  29. Christopher Game says:

    “Radiative forcing” is a mathematical construct. That is to say, it is a theoretically defined quantity. It is a fictive invention of the conventional mickey-mouse or back-of-an-envelope framework for calculating the ‘climate sensitivity’.

    “Radiative forcing” at a particular time is the difference between absorbed solar radiation and outgoing long wave radiation, adjusted as appropriate for some chosen fictive enclosure or ‘boundary’ of the earth system.

    “Radiative forcing” is not an elementary or simple physical quantity. It is found necessarily by calculation from several disparate physical quantities.

    It follows that “radiative forcing” is not logically admissible as candidate to be considered as a cause for some actual physical process. It does not have the appropriate logical structure. Its value is as an aid to theoretical calculation.

    A customary idea is that a necessary condition for the theoretical construct of an earth system in a steady state (often, but questionably, called an ‘equilibrium state’) is that the radiative forcing should vanish. Whether or not the vanishing of the “radiative forcing” should be a sufficient condition for a steady state is not too germane for the present discussion.

    There is no law of nature that requires the actual physical earth system to be in a steady state, over any chosen time scale. Indeed, we should provisionally expect that it may often be found out of a steady state in any chosen time scale. The purpose of considering a vanished “radiative equilibrium” is mathematical, unlocked from any particular physical scenario.

    • bdgwx says:

      If the point is that radiative forcing isn’t a fundamental property then point taken. But, mathematical constructs provide a rigorous way of modeling reality nevertheless. I have no problem with Dr. Spencer and the scientific community in general using constructs like these. You are certain free to propose alternate model though.

      • Stephen P Anderson says:

        There is no place for mathematical constructs in science theory. Math should flow from logic, intuittion and common sense understanding-like we see in Berry’s paper.

        • bdgwx says:

          You may find science very dissatisfying then since mathematical constructs are created to estimate physical processes pretty much ubiquitously in nearly all disciplines of science.

          • Stephen P Anderson says:

            In applied science and engineering sure but not in theoretical science with any credibility. I use them all the time in engineering work-don’t see them much in theoretical science.

    • barry says:

      “Mathematical constructs” – one of the cornerstones of science. What on Earth are you talking about?

      • Christopher Game says:

        Yes, my post was a bit obscure. I will try a bit more. My underlying thinking is that there is good place for mathematical constructs, but, in general, only those that express causality. Haphazard or merely artificial mathematical constructs will, in general, not express causality.

        My concluding sentence was “The purpose of considering a vanished ‘radiative equilibrium’ is mathematical, unlocked from any particular physical scenario.” Bad grammar. It intended to speak of a vanished “radiative forcing”. That means ‘global radiative equilibrium’:
        0 = ASR – OLR
        0 = absorbed solar radiation – outgoing long wave radiation
        is not directly delivered by any general law of nature, but needs to be derived from particular given actual initial conditions and general laws of nature. Those general laws express causal relations. Global radiative equilibrium is not a cause. It is a convenient artificial postulated mathematical relation. The climate is always changing. A time scale may be chosen that makes climate change seem very slow.

        The purpose of considering ‘global radiative equilibrium’ is to calculate the climate sensitivity.

      • barry says:

        “My underlying thinking is that there is good place for mathematical constructs, but, in general, only those that express causality”

        The vast majority of science is inductive. The deductive method – which seems to be what you’re implying here – is not well-suited to investigating natural phenomena.

        In pure mathematics and deductive reasoning logic is the authority. In the natural sciences, observation of nature is the authority, and inductive reasoning is the method. A logically coherent statement is not valid if nature examples otherwise.

        There are many things which we model extremely effectively without knowing true cause (such as gravity). You could say that we dont know true causality until we can predict the position of every molecule in the universe. But science is more practical, and inductive reasoning can be highly successful.

        Smoking is bad for you. We’ve never witnessed the cause, but our mathematical constructs (large sample sizes and statistical analysis) make it clear that smoking increases the risk of heart disease.

      • Dr Roys Emergency Moderation Team says:

        barry, please stop trolling.

        • Christopher Game says:

          I am late to answer the comment of barry.

          Causality is the core of natural science. Causality is not kind of reasoning that competes with induction and deduction. Besides induction and deduction, a further kind of reasoning, called abduction, is necessary for the advancement of natural science. Reasoning does not compete with observation of nature; it is part of the process of observation. As Einstein said, theory decides what can be observed.

  30. Nabil Swedan says:

    Perfect analysis. In fact, Chapter 8 of IPCC 2013 refers to Radiative Forcing as a concept not as a science.

  31. Nabil Swedan says:

    Perfect analysis. Chapter 8 of IPCC 2013 refers to Radiative Forcing as a concept not as a science.

  32. Jacques Lemiere says:

    i don’t need stinking satellite data..!!!

    the models are clearly unable to simulate the actual climate..BUT…for some weird reasons we are supposed they are able to simulate right some important stuff..it is faith..or mislead confidence..

    • bdgwx says:

      If by “unable to simulate actual climate” you mean with perfection then point taken. Dr. Spencer’s analysis here is a clear demonstration of the imperfections of climate modeling. But, perfection is not requirement for a model to be useful. What we want is to find the model that provides the best match to reality. Afterall, a model that is factor of 4 off in describing the radiative resistance of the top 10% monthly changes in the mid troposphere tropical region is still infinitely better than having no model at all. At least this way we have something to improve upon.

    • Dr Roys Emergency Moderation Team says:

      bdgwx, please stop trolling.

  33. Christopher Game says:

    Dr Spencer and his colleagues seek to find out how and why the AOGCMs don’t fit the observed data. They compare empirically measured data with AOGCM simulations.

    Part of their comparison is between quantities derived from the empirical and the simulated values of the artificial mathematical subtractive construct of “radiative forcing” when it seems that they could make separate respective comparisons of the more directly natural physical quantities that go into the subtraction, OLR and absorbed solar radiation.

    One might hope that the two more natural comparisons would reveal more detailed and specific diagnostic information for their purpose. The subtraction operation destroys information and conceptually relies on the unnecessary and unphysical idea that “radiative forcing” has some kind of physical cogency. The simpler procedure would avoid unnecessary implicit assumptions about the artificial mathematical construct of “radiative forcing”, and would be easier to interpret.

  34. Christopher Game says:

    Continiung. The AOGCMs are said to directly or explicitly use neither the “radiative forcing” concept, nor the “feedback” concept. It is not obvious why those two concepts are relevant for the purpose of comparing empirical measurements with AOGCM simulations.

  35. bdgwx says:

    Interesting analysis. I’m trying to get my head wrapped around it.

    What is the rationale for using detrended monthly temperature changes as opposed to the raw data?

    What is the result of the analysis when using all months instead of just 10% of them?

    Which months are included in the 10% and is there a common trait they share that might explain the high radiative resistance and disagreement with models?

    What is the result of the analysis when using RSS as opposed to UAH?

  36. ren says:

    Sudden warming of the stratosphere over the southern polar circle reaches the upper troposphere.
    https://www.cpc.ncep.noaa.gov/products/stratosphere/strat-trop/gif_files/time_pres_TEMP_ANOM_JAS_SH_2019.png

  37. Rob JM says:

    So I’ve been thinking the relationship between StefanBoltzmann and GHG and I think I may have found several major failings with the theory.
    1/ GHG works as an energy transport and redistribution function. It absorbs energy travelling towards space and then redistributes it in every direction, reducing the flow by 50%. This should apply to all forms of energy transferred from the surface to the atmosphere, via conduction or evaporation and convention of latent heat. They all must cause back radiation, since they all required two trips to dissipated the same amount of energy as direct OLR.
    2/non black body radiation. The temp of a fluorescent globe is 10k, because it doesnt emit black body radiation, just UV. Does the atmosphere do similar?
    3/storage and release of energy.
    StefanBoltzmann is supposed to be applied to a body in equilibrium, so that energy storage in the system is saturated and not affecting the temp. When you have a body like the earth that is in a constant state of energetic flux with large storage and release components, it smooths the peaks and fills the troughs. The smoothing should have a net warming effect due to the exponential nature of StefanBoltzmann causing a much higher heat loss at full solar power compared to the dark side of the body.
    Just some thoughts anyway.

  38. Antonio (AKA "Un físico") says:

    I hope this new idea could explain the hiatus (the pause in global temperature growth between 1998 and 2015). The pdf from WG1 AR5, admitted that this hiatus was caused by some combination of (a) internal climate variability, (b) missing or incorrect radiative forcing and (c) model response error. Your new idea seems to link both (b) & (c) causes.
    My alternative idea to explain the hiatus, (I commented here and by email time ago), was a misunderstanding on the instrumental-systematic errors that were allowing a bias in global temperature measurement: showing a sharp growth instead of a moderate growth and a hiatus instead of a moderate reduction.

    • Bindidon says:

      Il fisico

      “My alternative idea to explain the hiatus… was a misunderstanding on the instrumental-systematic errors that were allowing a bias in global temperature measurement…”

      *
      Nice idea, but… how do you explain that so many different temperature evaluation sources based on different temperature measurement sources show so similar things?

      The only two sources behaving different from the rest are:
      – WeatherBELL (2m above surface, model-based reanalysis);
      – UAH 6.0 lower troposphere.

      The rest, that is JMA (Japan), GISS, NOAA, Had-CRUT, Berkeley Earth, Copernicus (2m above surface, model-based reanalysis), RSS 4.0 lower troposphere.

      • m d mill says:

        A better single instrument and better methods produce the best result, regardless of the competition, which may use similar methods and data sets to produce similar results.
        The winner of a race is always an outlier…does that mean the outlier is not the winner of the race?
        Are you including all radio-sonde temp records, several of which agree with UAH LT?

      • barry says:

        m d mill

        There is no global temperature record relying on one instrument.

        How do you determine the best method?

        The racing analogy refers to competition, not validity. This is rhetoric, not science.

        • m d mill says:

          1)The global averaged temperature trend over many years is determined by a single exquisite satellite instrument, using a single platinum thermocouple reference (that is my understanding–is that wrong?), as opposed to thousands of land based thermometer readings of questionable quality in ever changing envirements (esp. urban.), which are constantly being drastically modified and corrected, added and subtracted, and reanalysed.

          2)There is a theoretical most accurate method out of a finite group. That “best” method must ultimately be based on the reasoning of each individual. There is currently no way of knowing objectively whether the GISS (for example) record is superior to the UAH LT.
          I prefer the UAH LT global average for the following reasons.
          It has true global coverage with one exquisite instrument for many years, which can be calibrated using radio-sonde LT measurements.I continue to prefer the UAH methodology over RSS as it is based more on independant satellite(data) based diurnal drift corrections, than on models based corrections, which are the subject in question in the first place (it is a circular argument).
          See Dr Spencers previous discussion here:
          http://www.drroyspencer.com/2017/07/comments-on-the-new-rss-lower-tropospheric-temperature-dataset/

          Specifically:
          Because climate models are known to not represent the diurnal cycle to the accuracy needed for satellite adjustments, we decided long ago to measure the drift empirically, by comparing drifting satellites with concurrently operating non-drifting (or nearly non-drifting) satellites. Our Version 6 paper discusses the details.
          I would also give high credence to the various ocean buoy and balloon radio-sonde measurements.

          You may disagree.
          How do you determine the best method?

          3)The race example simply shows that an outlier may be the best(it was not a proof), just as a better instrument and better method would produce the best result, regardless of the competition, which may use similar methods and data sets to produce similar but systemically poorer results. The averaging of systemically poor results may not provide a correct result.

          In short the question is not settled…I do not claim to possess the exact truth but I question those who do so claim.

        • barry says:

          m d mill

          “1)The global averaged temperature trend over many years is determined by a single exquisite satellite instrument, using a single platinum thermocouple reference (that is my understanding-is that wrong?)”

          Yes.Your understanding is wrong.

          The satellite temp records, including UAH, are comprised of about a dozen different satellites and their various instruments over the last 40 years. The data from the different instruments have to be intercalibrated, and the performance of each instrument is variable. The satellites themselves do not have pristine orbit, but experience orbital decay, which has to be adjusted for, resulting in non-zero error. There are other issues. Roy Spencer gives an overview of how the UAH temps are made:

          http://www.drroyspencer.com/2010/01/how-the-uah-global-temperatures-are-produced/

          RSS and UAH both compare well with the radiosonde records – depending on which radiosonde record you compare them with.

          The lead on RSS reckons the land-based records are more reliable, and indeed, some of the largest changes (in decadal trends) from version to version come from the satellite versions. UAH has had some fairly major revisions over the years. Whether the current version is superior to all others is something. no one can say. I think some people prefer it simply because it has the lowest trends of all the temp records.

          “How do you determine the best method?”

          I don’t know. I don’t have nearly enough understanding of the intricacies. At the same time, I am aware of all the things you brought up, and more besides. Still, the matter is too difficult for me (and I dare say anyone who actually has the best understanding) to nail down definitively.

          “I do not claim to possess the exact truth but I question those who do so claim.”

          Me too, which is why I started talking to you.

          • m d mill says:

            The fact that satellites are replaced over time was not the point. My understanding of that was not wrong, it was assumed as obvious. My remarks were for any one satellite instrument over the period of its life (especially wrt global averages) compared to other methods during that time period
            The trend calculation for any one satellite has the advantages outlined above, IMO

          • barry says:

            “My remarks were for any one satellite instrument over the period of its life (especially wrt global averages)”

            I was misled by what you said, when you referred not to global averages but to trends.

            “1)The global averaged temperature trend over many years is determined by a single exquisite satellite instrument, using a single platinum thermocouple reference (that is my understanding-is that wrong?)”

            Over many years, different satellites are used, and if you read Dr Spencer’s post that I linked for you, you would see that the sensors are not pristine, nor is the orbit of the satellite that carries them.

            We are talking about a period from 1998 to 2015, as I’m sure you are aware from the comment that started this subthread. Do you know how many different satellites were used over that period?

            Are you aware that prior to the latest revision of UAH, there was a positive trend for that period. Here is a graph showing both the latest version and the previous one together.

            http://www.woodfortrees.org/plot/uah5/mean:12/plot/uah5/from:1998/to:2016/trend/plot/uah6/mean:12/offset:0.5/plot/uah6/from:1998/to:2016/trend/offset:0.5

            The bottom graph is UAH 5.6 trend from 1998 to Dec 2015, and the top graph is UAH 6.0 trend for the same period.

            I ask you, if the data are pristine, why is there this significant discrepancy between versions?

          • Dr Roys Emergency Moderation Team says:

            barry, please stop trolling.

          • m d mill says:

            the life time of a single satellite is “many years” and a trend is established for that instrument…which can be added to the tends for other instrument life times

      • Antonio (AKA "Un fsico") says:

        Hi Bindidon,
        In drive.google.com/file/d/0B4r_7eooq1u2ZlIwZFcxQ2ZWaHc I have stored my “Climate 2.0”, a document summarizing the issues I found about (IPCC’s) climate change. About the error sources, please look at pg. 5. There are two types: instrumental-systematic & statistical. The statistical errors tend to zero as we keep measuring (as N gets larger) because of that 1/(sqrtN). But the instrumental-systematic errors remain. Now we could claim that different ways of measurement give different instrumental-systematic errors: yes, this is right; but I do not think that they must cancel out between them. In fact (please go back to pg.4) there is a quite disagreement between global temperatures measured in diagram 3 vs. in UAH’s diagram 2. And I thought that that was only possible if the instrumental-systematic errors in both measuring procedures were much higher than what we see. This would explain the sharp growth between 1980-2000 in diagram 3 vs. the more moderate growth in the same period at UAH.
        Anyhow this is just another idea. It needs to be checked carefully if people have time and funds. I do not have much of boths.

        • Bindidon says:

          Hi Fisico,

          Paper downloaded, I’ll manage to read it during the next (holiday) weeks.

          Let me just reply to this:

          ” In fact (please go back to pg.4) there is a quite disagreement between global temperatures measured in diagram 3 vs. in UAH’s diagram 2.”

          Why do you compare the two lowest-trended temperature series for the lower troposphere (one of which being deprecated) with all the rest?

          Your paper is aged quite a bit, Fisico.

          Feel free to download NOAA STAR, RSS4.0, and to compare the stuff with UAH6.0 AND UAH5.6!

  39. m d mill says:

    Dr. Spencer:
    I would suggest not using the phrase or concept “the radiative resistance to temperature change”. It is awkward and confusing. Simply use the EE’s concept of conductance. In this case effective thermal CONDUCTANCE =deltaI/deltaT, where I=radiation power per area(perpendicular to the surface)=Forcing, and T is simply surface or LT temperature. The LW part is the LW (infrared) thermal conductance outward to space, and the SW part is the EFFECTIVE conductance portion due to the change (increase) of cloud SW reflection with temperature. The sum of LW and SW is then just like the parallel connection of 2 different conductors..a simple electrical concept applied to the thermal realm. And it can be easily diagrammed just like an electrical circuit. This is the method I have used.
    In this case a larger conductance decreases the temperature change responce to a given forcing change input
    ie…deltaT=deltaI/CONDUCTANCE. Then define effective thermal RESISTANCE=1/CONDUCTANCE, so deltaT=deltaI*RESISTANCE…just as in the electrical analog.
    …jus’ sayin’…

  40. Guj says:

    And why has the North Pole warmed significantly while the South Pole has cooled moderately in the last forty years? Any AGW supporters here that could answer that?

  41. Leitwolf says:

    Sorry Dr. Spencer, but have not understood the GHE at all. Of course neither have your colleagues in “climate science”, regardless on which “side” they stand on. And it is very weird that you are trying to fiddle on the details, while you have totally failed on the very basics.

    There are indeed two contradicting theories on how the GHE is supposed to work, and both are well accepted. Theory a) is based on the concept of “back radiation” (which you endorsed at many occasions), which would heat the surface in addition to solar radiation. Theory b) is based on the idea of a photosphere (the average level in the atmosphere from where LWIR can be emitted) and the adiabatic lapse rate. The higher up the photosphere is, the more the adiabatic lapse rate will increase surface temperatures below.

    The point is, both theories are totally contradicting and obviously can not be both true. While theory a) it totally ignoring photosphere and adiabatic lapse rate, theory b) has no role for “back radiation”. This contraditcion in the theoretic foundation has been (as far as I know) totally ignored and trivialized as just being different views on the same thing. But that is not the case, as these are views on reality, that is physics. And whatever model tries to explain physics, is a theory.

    Spoiler alert: Theory a) is wrong! First of all it is wrong because it contradicts the of thermodynmics. I know it is a blunt argument, because everyone seems to be fine with that violation of basic physics. So let me put it differently: what if surface temperatures were different? With lower temperatures there would be less “back radiation” for instance. Is “back radiation” not itself a function of surface temperature? And since it is, there is no point in explaining surface temperature by “back radiation”. Rather this is a circular argument, pure tautology. The model may be formally right, but it confuses correlation with causation.

    Only model b) is basically right! That means “back radiation” or more general, “radiative forcing” (unless we talk about a source of energy like the sun) plays no role in climate at all. All this is total garbage!

    Of couse, once we have understood this basic lesson, there is a lot of stuff to be learned. Eventually it can beautifully be shown how GHGs only play a very small role in Earths climate. That however must be reserved for the advanced scholars 😉

    • barry says:

      Theory a) and b) are complementary actions, and some people choose to use one or the other to describe what is happening, but both are.

      “Back-radiation’ is a real physical phenomenon – the atmosphere does radiate to the ground, as well as every other direction. If there are more IR active gases in the atmosphere, the surface will receive more IR from the atmosphere.

      If you want to describe what is happening with an enhanced GHE and use language that doesn’t interfere with the 2nd Law of Thermo, then you simply say that more CO2 reduces the rate at which radiation from the surface passes to space. This means that the cooling rate from the surface to space is slower. Any object receiving continuous energy (ie from the sun) that has it’s rate of cooling slowed down, must perforce become warmer.

      No laws of thermo were broken in this description.

      • Kristian says:

        I agree with barry, and that’s not something that happens too often, I can tell you.

        OLR at the ToA and DWLWIR at the surface are two sides of the same coin, both incorporated into the idea of a “GHE” and the “enhanced” version of it:

        https://okulaer.files.wordpress.com/2018/11/greenhouse-mechanism.png

        This figure plus the explanation of how the “greenhouse” warming mechanism is supposed to work is found here:
        https://okulaer.wordpress.com/2018/11/11/how-the-ceres-ebaf-ed4-data-disconfirms-agw-in-3-different-ways/

      • Leitwolf says:

        “Theory a) and b) are complementary actions, and some people choose to use one or the other to describe what is happening, but both are.”

        Absolutely not! These are two different theories, as said before. I think it is a matter of logical discipline to see the actually obvious, and my considerable IQ my facilitate that. Otherwise we must never undererstimate people’s ability to fail on logical reasoning. Just remember the “Goat Problem”.

        I guess the Jovian atmosphere may very well illustrate the logical fallacy that theory a) is. The deeper you go, the hotter it gets and since Jupiter is a gas giant, this goes on for a little eternity. Pretty soon there will be no more solar radiation since all of which is getting reflected or absorbed by the atmosphere above.

        In this case theory a) becomes extremely simplified. Without latent heat, without solar radiation to take into account, all that remains to explain the prevailing temperature at a certain depth is ambient radiation (some of which downwelling from above, thus being “back radiation”, some coming from below..). This ambient radiation however is obviously a function of temperature again. And so we see how theory a) always goes full circular. The theory can and will never explain why a certain temperature / ambient radiation is prevailing, or why temperatures do increase the deeper you go into the atmosphere. This can only be done with theory b)!

        • ‘Otherwise we must never undererstimate peoples ability to fail on logical reasoning. Just remember the Goat Problem.’

          Serious misunderstanding of the Monty Hall problem. People get it wrong because they start with false premises and then refuse to believe that their logic is false. (Because it isn’t.) You need to recognise the false premises before the penny drops, and that mostly needs a background in probability. I only twigged it 20-odd years ago because I actually built a simulation and then looked to see what happened when I altered a starting assumption in the code. (I had to issue a public recantation and prostrate myself at Canossa, very embarrassing.)

          What you are perpetrating is a simple logical fallacy: False dilemma. Different theories can successfully model the same reality using incommensurate terms of reference without contradiction. Thomas Kuhn, a physicist, pointed out one of the more important consequences of this, as for a long time science can resist change to a new and incommensurate paradigm because the old one predicts results quite well enough except for some niggling detail: Even an outright false model for some set of results appears not to contradict experiments. What chance then of recognising genuine contradiction between two complementary ones?

          “my considerable IQ my facilitate that.”

          Pity it doesn’t help you with grammar.

      • barry says:

        Leitwolf,

        Here is an explanation that incorporates both the back-radiation aspect and the radiating from higher levels (your ‘photosphere’) in the same argument.

        “What happens to infrared radiation emitted by the Earths surface? As it moves up layer by layer through the atmosphere, some is stopped in each layer. To be specific: a molecule of carbon dioxide, water vapor or some other greenhouse gas absorbs a bit of energy from the radiation. The molecule may radiate the energy back out again in a random direction. Or it may transfer the energy into velocity in collisions with other air molecules, so that the layer of air where it sits gets warmer. The layer of air radiates some of the energy it has absorbed back toward the ground, and some upwards to higher layers. As you go higher, the atmosphere gets thinner and colder. Eventually the energy reaches a layer so thin that radiation can escape into space.

        What happens if we add more carbon dioxide? In the layers so high and thin that much of the heat radiation from lower down slips through, adding more greenhouse gas molecules means the layer will absorb more of the rays. So the place from which most of the heat energy finally leaves the Earth will shift to higher layers. Those are colder layers, so they do not radiate heat as well. The planet as a whole is now taking in more energy than it radiates (which is in fact our current situation). As the higher levels radiate some of the excess downwards, all the lower levels down to the surface warm up. The imbalance must continue until the high levels get hot enough to radiate as much energy back out as the planet is receiving.”

        Can you guess, without googling, where this blog explanation comes from?

        • Leitwolf says:

          “Can you guess, without googling, where this blog explanation comes from?” Nope

          First of all this explanation is far too complicated, secondly theory b) is totally in line with the “GHG theory”, at least superficially. So that question is not at stake at this point.

          I perfectly agree with Professor Merrifield’s explanation of the theory itself..

          https://www.youtube.com/watch?v=hUFOuoD3aHw

          The problem is that on the one side, that no one seems to realize the contradiction between the two theories. This however is absolutely mandatory to not be confused.

          On the other side of course such understanding only opens up the door to ask some proper questions. For instance, how could clouds (or aerosols) ever lower the photosphere? Obviously that is impossible, as they can only lift it up. Logically that means clouds and aerosols will heat the planet, rather than cooling it.

          To short cut the story: it turns out, that an Earth without GHGs (but with clouds and aerosols) would be almost as warm in theory (~283K) as it is in reality. The scope of GHGs gets marginalized.

        • barry says:

          I don’t see that the two explanations are contradictory, and you have not explained how they are.

          Back radiation exists, in that the atmosphere radiates towards the ground (and every other direction).

          If the atmosphere is changed, by increasing the amount of GHGs, to absorb more radiation from the surface, re-emitting it in every direction including downward, the rate of heat loss from the surface to space is slowed.

          More GHGs at the top of the atmosphere (the ‘photosphere’ in your parlance) absorb more upwelling infrared radiation, raising the altitude of the layer that emits to space. As the highest emitting level of the atmosphere must be warm enough to radiate spacewards and keep the system in equilibrium with incoming radiation, the lower layers must warm up to achieve that, according to the laws of physics.

          Both these things happen. Most often one or the other is described to lay people to keep it simple. One can choose to describe what is happening at ground level, or one can choose to describe what is happening at the TOA.

          Here again is a description for lay people that describe both phenomena (from the Royal Meteorological Society, UK).

          https://rmets.onlinelibrary.wiley.com/doi/pdf/10.1002/wea.669

          Where is the contradiction?

          • Leitwolf says:

            Well, that paper is a good representation of the confusion and idiocy prevailing on the subject. It is the same old unreflected non-sense I was adressing. My favorite line certainly is this:

            “The average amount of energy retained through this natural greenhouse effect is thus 390Wm2 less the 235Wm2 lost to space, leaving 155Wm2, keeping the surface of the planet 33 degC warmer than it would be without any CO2”

            True! 😉 Sure you could excuse this to be only a typo. But I am afraid this is more like an implicit, unreflected quotation very much like the rest of the text. They cobble it all together and feel no pain about all the inconsistancies they have. It must be right anyhow because they have read or heard it somewhere already. So no reason to reflect on the subject, as reflecting so damn hard for a lazy mind..

      • barry says:

        Leitwolf, a) and b) are not often presented together – they are directed more for lay readers, and are a simplified version of atmospheric physics and the GH effect. But here is another example of both being presented:

        https://rmets.onlinelibrary.wiley.com/doi/pdf/10.1002/wea.669

        They are not contradictory. Both occur at the same time.

      • gbaikie says:

        –barry says:
        October 1, 2019 at 7:22 AM
        Leitwolf,

        Here is an explanation that incorporates both the back-radiation aspect and the radiating from higher levels (your ‘photosphere’) in the same argument.

        “What happens to infrared radiation emitted by the Earths surface?–

        According a Earth energy budget, on average 40.1 watts goes directly into space:
        https://en.wikipedia.org/wiki/Earth%27s_energy_budget

        “As it moves up layer by layer through the atmosphere, some is stopped in each layer. To be specific: a molecule of carbon dioxide, water vapor or some other greenhouse gas absorbs a bit of energy from the radiation. The molecule may radiate the energy back out again in a random direction. Or it may transfer the energy into velocity in collisions with other air molecules, so that the layer of air where it sits gets warmer.”

        The “up layer by layer through the atmosphere”

        Could be in the first 10 meters higher than the surface, that:
        “The molecule may radiate the energy back out again in a random direction. Or it may transfer the energy into velocity in collisions with other air molecules, so that the layer of air where it sits gets warmer”
        Is there any mechanism that indicate the chance that ” it may transfer the energy into velocity in collisions with other air molecules”

        “The layer of air radiates some of the energy it has absorbed back toward the ground, and some upwards to higher layers.”

        At what elevation does 1/2 radiation {not counting the radiation which directly into space [40.1 watts] that first radiates from the surface radiate back to surface.

        ” As you go higher, the atmosphere gets thinner and colder. Eventually the energy reaches a layer so thin that radiation can escape into space.

        What happens if we add more carbon dioxide?”
        The elevation where 1/2 radiate returns to surface is lowered?

        Most carbon dioxide added will go where most of atmosphere is, so something 1/2 mass of atmosphere is below 5 km elevation.
        So half goes below 5 km and 1/2 above 5 km elevation.

        “In the layers so high and thin that much of the heat radiation from lower down slips through, adding more greenhouse gas molecules means the layer will absorb more of the rays. So the place from which most of the heat energy finally leaves the Earth will shift to higher layers. Those are colder layers, so they do not radiate heat as well. The planet as a whole is now taking in more energy than it radiates (which is in fact our current situation).”

        Nope. Earth absorbs as much as is emitted.

      • barry says:

        “I agree with barry, and thats not something that happens too often, I can tell you.”

        A red letter day.

        I once spent some time defending your point of view, as I saw it.

    • Dr Roys Emergency Moderation Team says:

      barry, have you ever heard the expression, “it’s turtles all the way down”?

      • Dr Roys Emergency Moderation Team says:

        That’s where I first heard of it, but apparently it predates Sir Terry…

      • barry says:

        Yes, years ago.

      • barry says:

        I don’t see how the concept of infinite regression applies to that quote.

        • barry says:

          I’ve never found any argument against the GH effect persuasive, and I’m in excellent company with the likes of Roy Spencer, Richard Lindzen, John Christy, Anthony Watts, Roger Pielke Snr and a host of other ‘skeptics’ who understand and endorse the phenomena.

          More GHGs slow the rate at which radiant energy from the surface escapes to outer space. Any object receiving continuous heat energy (ie from the sun) that has its rate of cooling slowed must perforce become warmer. Basic physics. That GHGs absorb and re-emit upwelling radiation much more strongly than downwelling radiation is a matter of empirical fact. It all seems very clear to me, and intuitive, too. The arguments against require murkier explanations and/or denial of some basic facts. The pressure argument doesn’t work because that only succeed if pressure is constantly increasing – a stable pressure by itself can’t create warmth (or it would get warmer as you descend to the ocean floor). For example. There are lots of wacky theories, but none as coherent as the one Dr Spencer tries vainly to convince cranks is correct.

      • Dr Roys Emergency Moderation Team says:

        It only brought it to mind. It doesn’t apply absolutely, but there is an element of “why does x1 hold” > “by x2” > “why does x2 hold” > “by x3” etc when adding the discussion of atmospheric layers. Ultimately the logical error is circular reasoning, but it is sort of “stretched out” by adding the layers such that the circularity becomes more difficult to detect. It’s the result of an intelligent mind finding ways to play tricks on itself in order to defend a principle that it wants to continue to believe in.

        I had a long discussion with a regular GHE-defender here who had written out his understanding of the enhanced GHE into a number of steps. Once written out, it was abundantly clear that it was a textbook example of circular logic, since one of his premises to get to his conclusion of warming involved a warming that he had no other way to explain except through the same mechanism he was outlining. His conclusion was taken as a premise. This got “stretched out” in the exact same way by passing the buck on where this inexplicable warming came from to the next layer of the atmosphere each time. An element of “it’s turtles all the way down”.

        This discussion went on for the best part of two weeks, as I recall, just round and round in circles through the circular logic. He utterly refused to see the error of logic and there was simply no way to get it through to him. Each time he was confronted with the problem his mind would just find another way around it.

        That’s all I see in the quoted explanation.

        And I already know there will be no point trying to get you to see any problem with GHE theory either…

        • David Appell says:

          You have yet to point out any problem with the standard GHE theory….

          • Stephen P Anderson says:

            Well, since Berry’s paper has shown that anthropogenic emissions cannot be the source of the increase in atmospheric CO2 and Salby has shown that CO2 increases as the time integral of temperature and that therefore the warming is due to natural causes the whole GHE theory (religion) is wrong.

        • barry says:

          The atmosphere is a finite property. There’s no infinite regression. Maybe your mind is playing tricks on itself?

          Any object receiving continuous heat (ie the sun) that has its rate of heat loss slowed must perforce warm up. We know empirically how GHGs operate – they absorb radiation of the spectrum emitted by Earth far more strongly than radiation of the spectrum emitted by the sun. That is the most complex empirical fact to understand. After that it’s fairly intuitive to me. More GHGs = thicker medium for IR to pass through from the ground to space. Like insulating a room for winter, the heat loss is slowed.

        • Dr Roys Emergency Moderation Team says:

          “The atmosphere is a finite property. There’s no infinite regression. Maybe your mind is playing tricks on itself?”

          Indeed, as I said…not infinite. Re-read.

        • barry says:

          So you mean circular reasoning, not infinite regression?

          And this refers to a conversation you had with someone?

          Ok.

        • Dr Roys Emergency Moderation Team says:

          I mean what I wrote in my comment.

          OK.

  42. Nabil Swedan says:

    There is no 340 w/m2 of backradiation at midnight. We need no scientist for this. Just ask the lay people and they will tell you there is no such a backradiation.

    • Norman says:

      Nabil Swedan

      That is why science does not rely upon the opinions of lay people. You use instruments to measure things. Not sure what type of point your post is making. Not a very sound one. If there were no backradiation at night the surface would get much colder than it is measured to be.

      • nabilswedan says:

        Norman

        You do not need instruments to measure 340 w/m2 of backradiation. It is too large for our senses. We do not feel it because it does not exist. Also, do not consider lay people as a bunch of idiots; they can reason as well as you can.

        • Norman says:

          Nabil Sweden

          I am not sure you have enough knowledge of physics of radiant energy to discuss anything of intelligence with. Your points are very poor and show little signs of any knowledge of topic.

          I do not think lay people are a bunch of idiots. I think you are not very educated in science.

          A wall at 75 F will be radiating over 400 W/m^2. In your twisted nonsense of bad science, you would believe falsely and without the slightest evidence, that the wall is not radiating toward you this much energy because you personally cannot feel it.

          I don’t even know what you are supposed to be feeling? I hope you open a textbook on the subject and read before you keep posting.

          You are not doing much for showing you know what you are talking about at this time.

          • Nabil Swedan says:

            So, I opened Fundamentals of Heat and Mass Transfer (Incropera and DeWitt, 1985, Second Edition) and applied equation 13.14. The heat transfer between the wall and me is not 400 W/m2, it is in fact a little bit on the negative side, from me to the wall. Where are you coming up with this 400 W/m2? What you are saying is that the wall can heat my room or cook my food, and I do not need to spend for electricity. What logic is this? Ask lay people and they will tell you that you are so wrong. I am not going to reply to you anymore because your logic is well below average lay people.

          • David Appell says:

            Provide a link to the source or your claim is useless.

          • Norman says:

            Nabil Swedan

            You are correct, the heat transfer from the wall to you would not be 400 W/m^2. But that has nothing to do with what you are claiming.

            The wall is emitting over 400 W/m^2 toward you. That can be established. Heat transfer is considered to be the net of the energy transfer. Your body is emitting at the rate of around 500 W/m^2. The net energy transfer (heat transfer) is around 100 W/m^2 away from your body to the wall. If the wall was very cold you would be losing heat at a far greater rate. You would feel much colder with a very cold wall around you even if the air temperature around you were not so cold as your body would be losing more heat via radiant flow.

            I am objecting to your claim that back-radiation does not exist.

            The concept is similar to the GHE. The warmer air radiates back to the Earth. The Earth surface loses less heat because of this radiant energy. Just like you will be warmer in a room with 75 F walls then in one with -200 F walls.

          • Dr Roys Emergency Moderation Team says:

            Norman, please stop trolling.

  43. A whole range of approaches predicted polar amplification, as reflected in IPCC reports through several reporting cycles. This is a strong confirmation of mainstream forecasting. Surely it follows trivially that a bias to more heating at the poles leaves less heat for the tropics for any given level of overall forcing. This appears almost like a rephrasing of the observation of polar amplification, without further elucidation.

  44. Scott R says:

    Interesting… my take is that the amplitude of short term climate changes at the poles is always going to be higher than the tropics. This is due to the simple fact that a little extra warming (especially in the arctic) has a large effect on albedo (a strong feedback). This isn’t the case in the tropics where there is no ice, or in Antarctica where it is SO cold that a little energy makes no difference. You can see this happening as we come in and out of the ENSO cycles. During the warm up, the artic warms faster than the globe. During the cool down, the artic gets colder faster than the globe. As the AMO and PDO end their multi-decadal up trends, the cooling in the arctic should in theory be greater than the globe on average.

    Looking forward to the September numbers.

  45. Nabil Swedan says:

    Norman
    You do not need instruments to measure 340 w/m2 of backradiation. It is too large for our senses.

  46. gallopingcamel says:

    barry asked:
    “For example, who is “we” in “we’re still here,” when there were no humans during the PETM?”

    There were no humans during the Eocene but that was when the “Mammal Explosion” occurred. Mammals got their chance following the K-T extinction that did in the non-avian dinosaurs:

    https://en.wikipedia.org/wiki/Cretaceous%E2%80%93Paleogene_extinction_event

  47. Ken says:

    The tide gauge in my home town shows -1.64 mm per year. Meanwhile the Province is telling us to get ready for 1 meter sea level rise by 2100. How do I get them to look at the data?

Leave a Reply