UAH Global Temperature Update for September, 2019: +0.61 deg. C (see update, below)

October 1st, 2019 by Roy W. Spencer, Ph. D.

UPDATE: (10/3/2019, 4:55 p.m. CDT): We have discovered that the last 1-2 months of LT data could be biased high. This is based upon a quick analysis of tropical temperatures where our mid-tropospheric (MT) and upper-tropospheric product (TP) anomalies are usually in good agreement. September 2019 is a clear outlier, with TP much too cold compared to MT. MT was cooler in the tropics in than in August, but because TP fell so much more, their weighted difference produced a spuriously warm result for LT. Furthermore, the tropical LS (lower stratospheric temperature) is at a record low in the tropics, a result which I do not believe. I will provide an update when we figure out the problem.

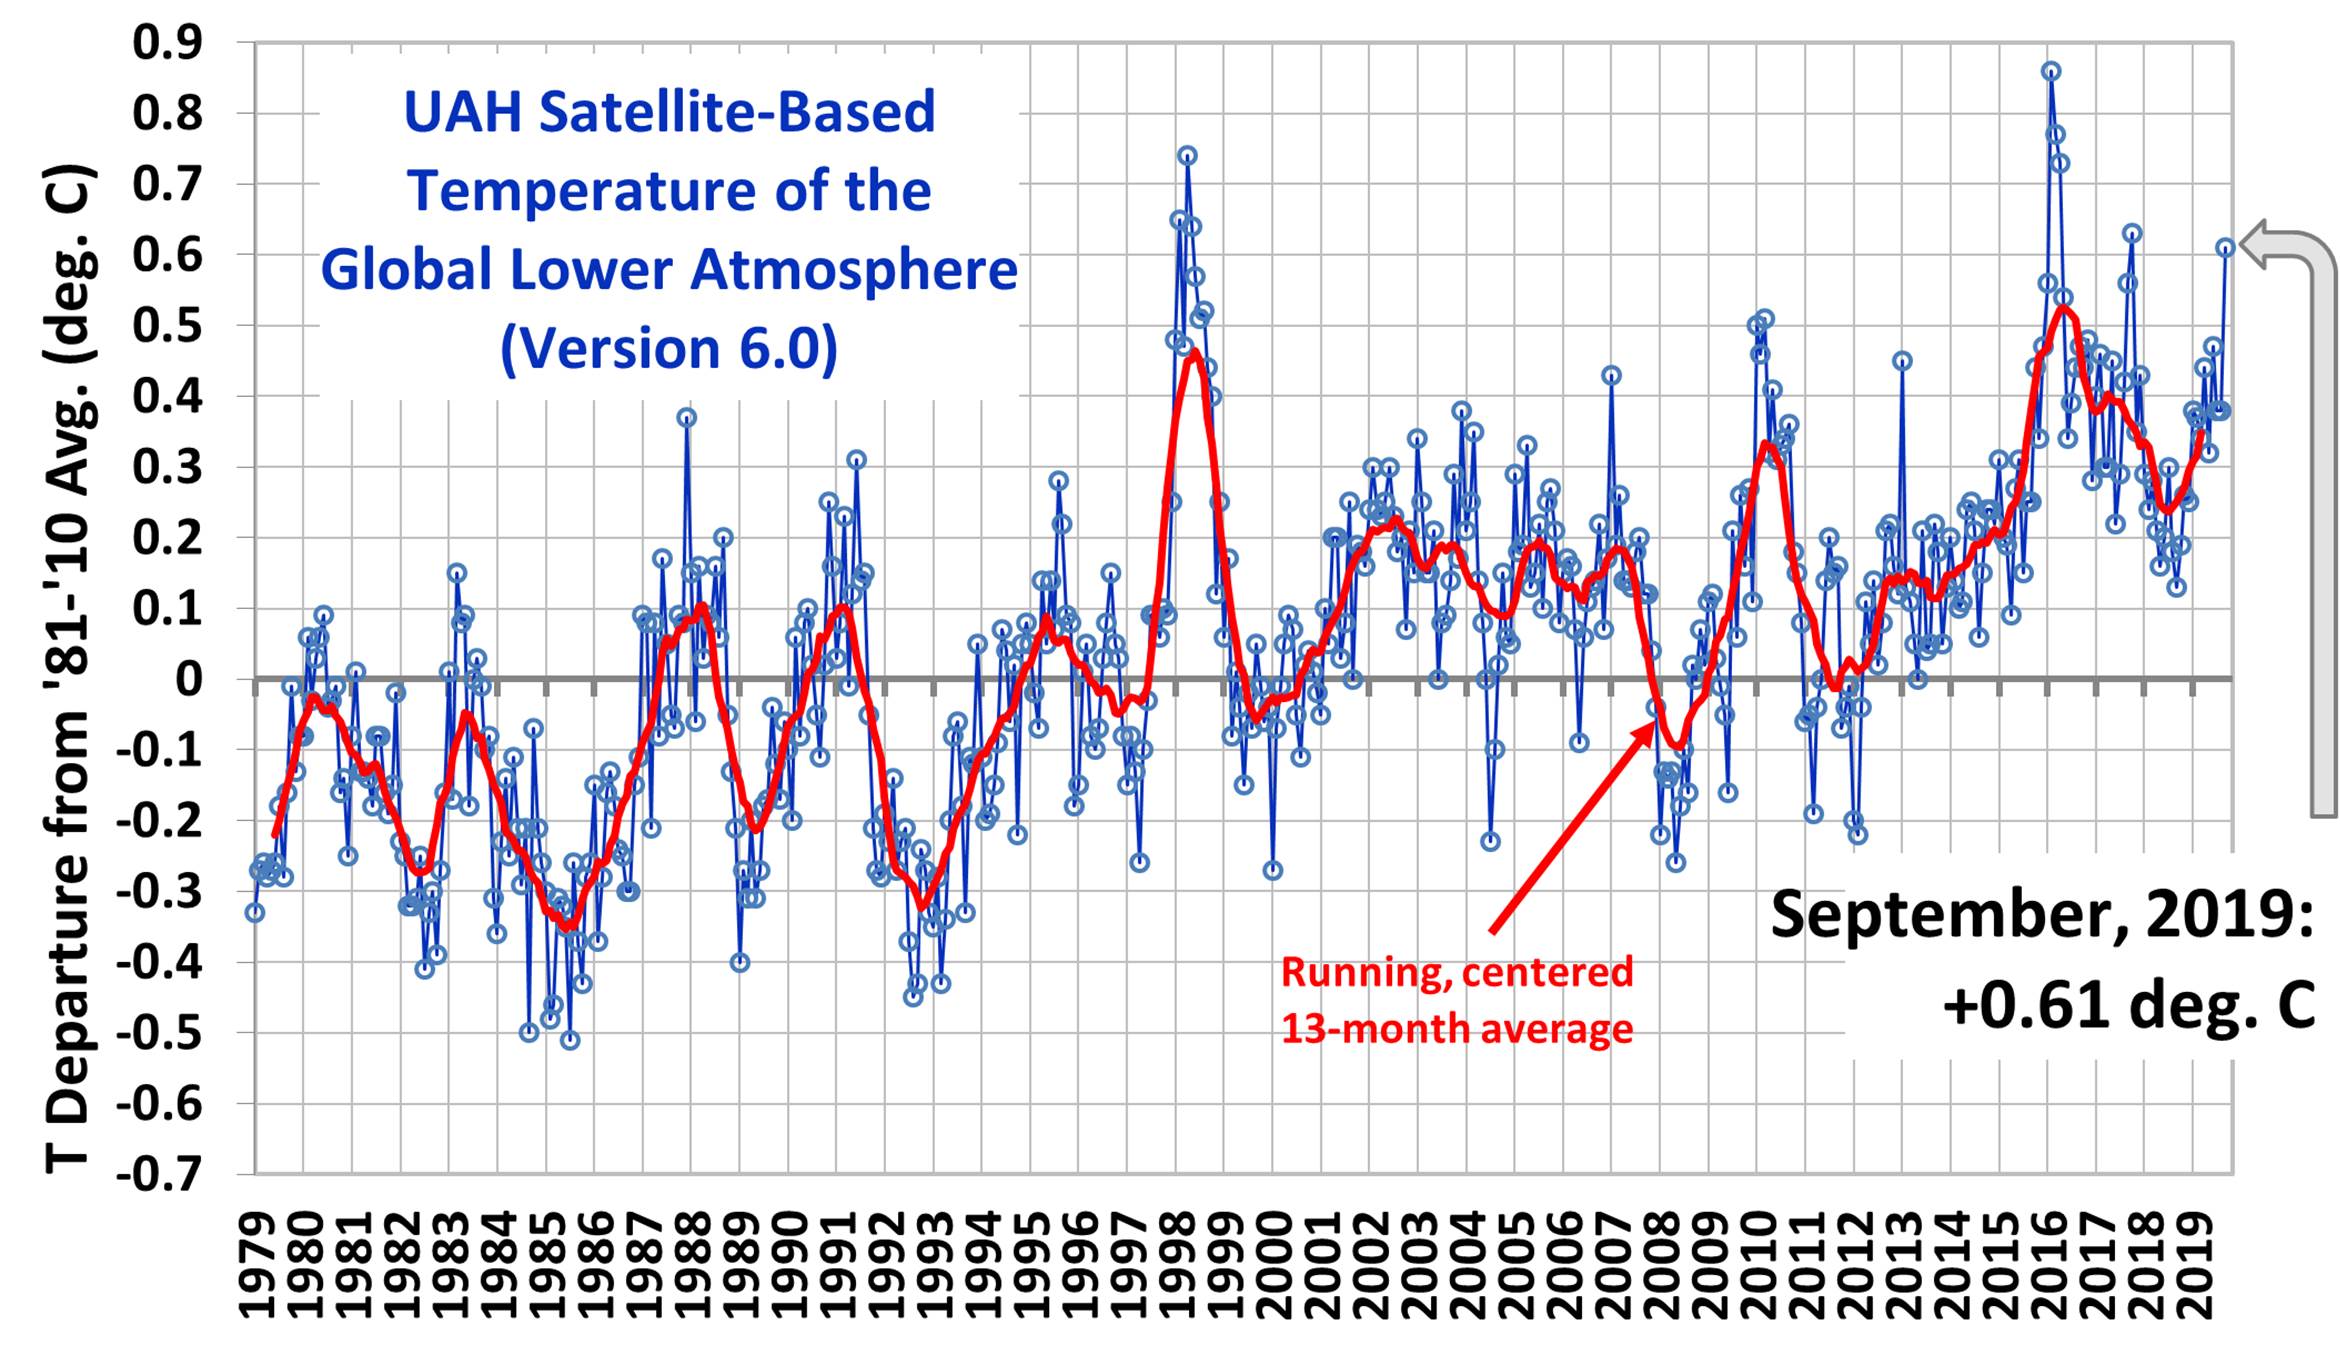
The Version 6.0 global average lower tropospheric temperature (LT) anomaly for September, 2019 was +0.61 deg. C, up considerably from the August value of +0.38 deg. C.

The linear warming trend since January, 1979 remains at +0.13 C/decade (+0.11 C/decade over the global-averaged oceans, and +0.18 C/decade over global-averaged land).

Various regional LT departures from the 30-year (1981-2010) average for the last 21 months are:

YEAR MO GLOBE NHEM. SHEM. TROPIC USA48 ARCTIC AUST
2018 01 +0.29 +0.51 +0.06 -0.10 +0.70 +1.39 +0.52
2018 02 +0.24 +0.28 +0.21 +0.05 +0.99 +1.22 +0.35
2018 03 +0.28 +0.43 +0.12 +0.08 -0.19 -0.32 +0.76
2018 04 +0.21 +0.32 +0.09 -0.14 +0.06 +1.02 +0.84
2018 05 +0.16 +0.38 -0.05 +0.01 +1.90 +0.14 -0.24
2018 06 +0.20 +0.33 +0.06 +0.11 +1.11 +0.76 -0.42
2018 07 +0.30 +0.38 +0.22 +0.28 +0.41 +0.24 +1.48
2018 08 +0.18 +0.21 +0.16 +0.11 +0.02 +0.11 +0.37
2018 09 +0.13 +0.14 +0.13 +0.22 +0.89 +0.23 +0.27
2018 10 +0.19 +0.27 +0.12 +0.30 +0.20 +1.08 +0.43
2018 11 +0.26 +0.24 +0.27 +0.45 -1.16 +0.68 +0.55
2018 12 +0.25 +0.35 +0.15 +0.30 +0.25 +0.69 +1.20
2019 01 +0.38 +0.35 +0.41 +0.35 +0.53 -0.15 +1.15
2019 02 +0.37 +0.47 +0.28 +0.43 -0.02 +1.04 +0.05
2019 03 +0.34 +0.44 +0.25 +0.41 -0.55 +0.96 +0.58
2019 04 +0.44 +0.38 +0.51 +0.53 +0.50 +0.92 +0.91
2019 05 +0.32 +0.29 +0.35 +0.39 -0.61 +0.98 +0.38
2019 06 +0.47 +0.42 +0.52 +0.64 -0.64 +0.90 +0.35
2019 07 +0.38 +0.33 +0.44 +0.45 +0.11 +0.33 +0.87
2019 08 +0.38 +0.38 +0.39 +0.42 +0.17 +0.44 +0.23
2019 09 +0.61 +0.64 +0.58 +0.60 +1.21 +0.75 +0.57

This makes September, 2019 the warmest September in the 41 year satellite record.

The UAH LT global anomaly image for September, 2019 should be available in the next few days here.

The global and regional monthly anomalies for the various atmospheric layers we monitor should be available in the next few days at the following locations:

Lower Troposphere: http://vortex.nsstc.uah.edu/data/msu/v6.0/tlt/uahncdc_lt_6.0.txt
Mid-Troposphere: http://vortex.nsstc.uah.edu/data/msu/v6.0/tmt/uahncdc_mt_6.0.txt
Tropopause: http://vortex.nsstc.uah.edu/data/msu/v6.0/ttp/uahncdc_tp_6.0.txt
Lower Stratosphere: http://vortex.nsstc.uah.edu/data/msu/v6.0/tls/uahncdc_ls_6.0.txt


954 Responses to “UAH Global Temperature Update for September, 2019: +0.61 deg. C (see update, below)”

Toggle Trackbacks

  1. fonzie says:

    There’s been something super weird going on with northern hemisphere SSTs, too:

    http://woodfortrees.org/plot/hadsst3gl/from:2010/plot/hadsst3nh/from:2010/plot/hadsst3sh/from:2010

  2. Glad to see the cooling spell is finally kicking in. 🙂

    • Stanley says:

      More than 11 years of super-warming continues. The trend the last 11 years is more than double the trend from 1979.

      • argus says:

        The trend is the only important part. There will be pauses and downturns.

      • Bart says:

        And, for random data, the uncertainty in an 11 year trend is 7 times that of a 40 year trend.

        • David Appell says:

          Good, let’s quote the 40yr trend, OK?

          +0.13 C/decade

          • Bart says:

            That is for purely random, independent, identically distributed data. We don’t have a validated statistical model for these data.

            If, for instance, the data are disturbed by a significant 60 year cyclostationary process, then the calculation of the trend component due specifically to other causes will be highly uncertain.

          • barry says:

            How about subjecting the data to a goodness of fit test?

            https://en.wikipedia.org/wiki/Akaike_information_criterion

            Do you know how to do that, Bart? We could ask Tamino and see if he might do it (he’s used this test before).

          • Bart says:

            Barry – This is just a way of telling if one model fits the data better than another. A) you’ve got to have viable models to compare, and B) finding a better match is only suggestive, not definitive.

            The truth is, we are really fumbling in the dark here. We don’t know how the data are supposed to behave. There is no contemporaneous control experiment to run.

            That is why the observation that the time rate of change of CO2 is proportional to temperature anomaly is so important. From that, we know that we are not the major contributors to the rise in CO2, and we know that temperature anomaly cannot be significantly sensitive to it in the present climate state, because that would comprise a positive feedback loop that would have run away eons ago.

            You don’t have to believe me, and I know you won’t, but the day will come when it becomes painfully obvious and undeniable, and the ensuing meltdown in the hallowed halls of science will become an object lesson for generations to come.

          • fonzie says:

            …and we know that temperature anomaly cannot be significantly sensitive to it in the present climate state, because that would comprise a positive feedback loop that would have run away eons ago.

            Bart, i’ve never really given much thought to the implications of (what i’ll call) fonzie’s theorem. Let’s assume for the sake of argument that it is deforestation + ocean warming that is the culprit in the atmospheric carbon dioxide rise. We might have a much bigger problem on our hands than if it were just fossil fuels alone. Without the normal sequestration of CO2 by trees, we may have effectively given the oceans cart blanche to pour as much CO2 into the atmosphere as it wants. And that CO2, if it does, say, continue to cause future warming could indeed comprise a positive feedback loop. This CO2 rise that we are observing could increase at an even more rapid pace for centuries(!) The implications could be staggering. i think dr roy did a post once on what the world would be like without trees. (i’ll have to look it up, circa 2014) Just something to think about. That would be even more catastrophic than having a bunch of dopey scientists telling us that it’s our emissions that done it. To think that we may actually have a real problem on our hands…

          • fonzie says:

            cart blanche should read carte blanche

            (knew something was amiss… 👍)

          • barry says:

            The rate rise fluctuation model you use doesn’t explain the long term rise. The long term model you use has too many parameters fitting – you’ve fit an elephant.

            But what really kills your hypothesis is that it completely lacks any empirical basis. The mainstream understanding has plenty.

          • fonzie says:

            The mainstream understanding has plenty.

            (no it doesn’t)…

          • barry says:

            Sure it does, fonzie. The empirical basis of the mainstream, view of the cause of the rise of CO2 in the atmosphere is based on inventories of CO2 emissions, cross-referenced with energy usage for the anthro contribution; many measurements over time of the atmospheric composition and differewnt kinds of proxies that cross-verify going back further than the instrumental record; measurements of oceanic CO2 at various depths, as well as of marine fauna, like coral, to see if the ocean has been a net sink or source (sink) for CO2; measurements of isotopic rations of CO2 to glean the source for the increase – anthro CO2 has a particular signature when using C12, 13 and 14 combined to discern changes.

            These and more empirical measurements support the mainstream view. They do not support Bart’s view of the rise of CO2, which would produce a different isotopic ratio change over time.

            Bart has not identified a source for and natural source, nor has he provided math that explains how anthropogenic sources, which account for twice the atmospheric increase, could be displaced by some natural source, that happens to show the exact, steady rate of increase over exactly the same period as anthro.

            Yes, there is a substantial empirical basis for the mainstream view, with many independent lines of evidence. Not so for Bart’s which is merely an exercise in curve fitting.

          • fonzie says:

            Barry, one thing i like about bart’s comments is that i’m always learning a new word or two. Tautology is one word that he used this go round (that had me scrambling for differing definitions on google to get his intent). All of what you mention would hold true even if the source were something other than anthro (iow, tautology). Are you aware that a warming world naturally produces a lower C13 ratio? Are you aware that deforestation also produces a lower C13 ratio over time? Are you aware still that just simply burning fossil fuels (without actually adding to the mass of atmospheric CO2) would also decrease the C13 ratio? Put ’em all together and what do we got? Lower C13 ratios(!) Are you aware that if the mass of ACO2 sinks at a rate near 100% (as do natural sources), then the oceans will be a net sink for CO2 as well? Are you aware, also, that the temperature model is a far better fit than the emissions model going back hundreds of years? (that’s even better than tautological) Your empirical evidence doesn’t amount to much if it would be happening anyway…

          • fonzie says:

            A tautology in logic is a formula that is always true on any valuation or interpretation of its terms.

            Barry, i noticed (somewhere) down thread that you were questioning Bart on the meaning of the word. It apparently has more than one meaning. (you might say it is what it is… 😉)

          • Bart says:

            barry –

            “Bart has not identified a source for and natural source, nor has he provided math that explains how anthropogenic sources, which account for twice the atmospheric increase, could be displaced by some natural source, that happens to show the exact, steady rate of increase over exactly the same period as anthro.”

            A) The increase is NOT at “the exact, steady rate of increase over exactly the same period as anthro”. As you noted yourself, CO2 concentration has risen roughly 50% of the total accumulation of anthro. You can always find a factor such that the rate of rise of one thing is proportional to the rate of rise of another. This one happens to be roughly 0.5. It could be anything.

            B) I have provided a hypothesis for how such a situation could arise many times. You probably never bothered to follow the link. See here:

            https://tinyurl.com/y7sf2uoh

          • Nate says:

            ‘As you noted yourself, CO2 concentration has risen roughly 50% of the total accumulation of anthro.’

            Yes, and 50% is predicted based on the known parameters of the carbon cycle.

            The number is corroborated by measurements of ocean carbon content.

            While the ‘natural’ model there are no parameters to corroborate or test whatsoever, because the ‘model’ is hand waving speculation. It is not quantitative.

            The hypothesis is all based on correlation = causation.

            But the correlation is weak, and there are several variables correlated, ENSO, CO2, emissions, global temperature.

            The causal relationships cannot be decided with correlation evidence alone.

            But unlike the anthro-model, there is no independent evidence of a natural source with the required properties.

            There is no evidence of large-enough natural variations of atm CO2 in the past.

            There is no sensible logic behind the theory that anthro emissions are gobbled up, and replaced by just the equivalent amount of ‘natural’ carbon, decade by decade for a century.

            It is improbable that this long series of quantitative agreements is simply happenstance.

            If so, God is really working hard to f*k with us.

            Then there is the mountain of other evidence Barry mentioned, no matter what fancy words Bart uses to dismiss it:

            ‘tautology’, ‘merely consistent with’, ‘not validated’, ‘just spinning a narrative’, ‘semper fi’, etc.

            IOW, all evidence contrary to Bart’s beliefs can be summarily dismissed.

          • Bart says:

            “Yes, and 50% is predicted based on the known parameters of the carbon cycle.”

            No. Those “known parameters of the carbon cycle” are based upon the observation itself. This is q circular argument.

          • Nate says:

            Given that you dont bother to read any papers on the carbon cycle, and dismiss all papers we show you, how would you know?

            In case feel like learning, you can start here in 1957.

            “Revelle, Roger; Suess, Hans E. (1957). ‘Carbon Dioxide Exchange Between Atmosphere and Ocean and the Question of an Increase of Atmospheric CO2during the Past Decades’. Tellus. Informa UK Limited. 9 (1): 18–27.

          • Bart says:

            That reference reinforces what I said, and does not support you at all.

          • Nate says:

            Oh so in 1957, before the Mauna Loa record began, Revelle somehow anticipated what the Co2 rise would be over the next decades, and ‘fiddled’ with his model to make that all work out?

            Didnt your mother teach you to read first before rejecting, and about causality?

          • Nate says:

            The Earths carbon cycle has many many moving parts. To think that the massive pile of research on all these parts and the effort to model them over the last 60 y has been one large exercise in circular logic…is both laughable and willfull ignorance of how science works.

          • fonzie says:

            The hypothesis is all based on correlation = causation.

            But the correlation is weak…

            Au Contrare, Nate. There’s a level of exactitude going all the way back to 1850. The 125+ppm increase that you see here is very close to that of law dome + mlo. (in 1850, the atmospheric concentration stood at 287ppm)

            http://www.woodfortrees.org/plot/esrl-co2/from:1958/mean:12/derivative/plot/hadsst3sh/from:1850/scale:0.2525/offset:0.1/integral/plot/esrl-co2/from:1958/mean:12/derivative/trend/plot/hadsst3sh/from:1958/scale:0.2525/offset:0.1/trend

            Here’s the same graph with the integral feature on the temp series removed:

            http://www.woodfortrees.org/plot/esrl-co2/from:1958/mean:12/derivative/plot/hadsst3sh/from:1850/scale:0.2525/offset:0.1/plot/esrl-co2/from:1958/mean:12/derivative/trend/plot/hadsst3sh/from:1958/scale:0.2525/offset:0.1/trend

          • fonzie says:

            The temperature relationship is also evident in a comparison of ice core and temp reconstruction (law dome and moberg) going back 500 years:

            https://i0.wp.com/i90.photobucket.com/albums/k247/dhm1353/LawMob1.png

          • bdgwx says:

            fonzie, the relationship certainly changed quite bit starting around 1800 according to that chart. I’d like to your model represented by the woodfortrees plots performed on Moberg’s data. BTW…I just read the Moberg 2005 paper. When you add in the instrumental temperature record like what Moberg did in his original publication you’ll see that temperature trend is already past the +0.6 y-axis value by 2000. Adding in the warming since then you’re probably close to +0.8. He also includes a plot of the ECHO-G model which is a nice fit to his data.

          • Bart says:

            “Oh so in 1957, before the Mauna Loa record began, Revelle somehow anticipated what the Co2 rise would be over the next decades, and fiddled with his model to make that all work out?”

            This is rather incoherent. Please state plainly and distinctly what point you are trying to make.

            You seem to think Revelle says specific things he, in fact, does not say. So, I need you to make a specific point, and back it up with a citation from the paper.

            “…the massive pile of research on all these parts and the effort to model them over the last 60 y…”

            They were doing the best they could with the data on hand. Science is a process, not a conclusion. As new data become available, we have to continually reassess our positions.

            We now have access to a long record of temperature variations and CO2, from which we can see plainly that the rate of change of atmospheric CO2 concentration is proportional to appropriately baselined temperature anomaly.

          • Nate says:

            Fonzie,

            Thanks for that data going back 2000 y. What I see there is an increase of CO2 by about 8 ppm going back from the LIA to the Middle Warm Period. While temperature increase over that period was about 0.6 C.

            So that means a quite low sensitivity of co2 to temperature of 8 ppm/0.6 C = 13 ppm/degree C.

            Yes?

            Thus the change of ~ 130 ppm from 1880 to today cannot have been caused by the 1.0 C temperature rise.

            Yes?

          • Nate says:

            “Please state plainly and distinctly what point you are trying to make.”

            Sure. All of the work understanding the carbon cycle, like Revelle model and refinements that followed over 60 y, cannot possibly be explained as circular logic.

            But that was your declaration. Please explain plainly and distinctly how that works.

          • fonzie says:

            Nate, yes, it is certainly true that the temperature relationship (a la bart) does well for about five hundred years past and then something happens to it. Which is a very good topic for discussion(!) Two things… These are ice cores and (as a nod to bart) ice cores remain unverified. (yet they are good enough to verify the temperature relationship with the co2 growthrate for half a millennium) Secondly, assuming ice cores are valid (bart, that’s a nod to me… 😉), there is one big difference between the MWP and now — deforestation. What would the MWP have looked like with the same amount of trees. Deep ice cores, of course, show a CO2/temperature relationship of a rise of 16ppm/1C. But, that relationship is predicated on the growth of sequestering trees (over time). Humanity has effectively taken trees out of the equation by its deforestation and this may have given birth to a new temperature relationship with CO2. Whatever the hell is going on, i hope that you do recognize that the temperature relationship with the carbon dioxide growth rate is not weak. (and it well deserves an explanation)…

          • fonzie says:

            fonzie, the relationship certainly changed quite bit starting around 1800 according to that chart.

            bdgwx, had a nice comment written out to you and it disappeared into cyberspace. (luv dr. s., but his software sure sucks… 😖) So, the fonz is moody! Yes, the relationship does change quite a bit circa 1800. Coincident with the rise in the temperature anomaly above -0.4, where it never goes back. i, too, would like to see a comparison of the temperature integral with law dome. (as well as the derivative of law dome with moberg) Unfortunately, the quintessential high school dropout in a leather jacket ain’t the guy for that job (👎). i’m hoping that by advertising this someone with the chops might want to do it. Time will tell (we shall see)…

          • Nate says:

            “Whatever the hell is going on, i hope that you do recognize that the temperature relationship with the carbon dioxide growth rate is not weak.”

            I dunno. It is 13 -16 ppm/deg C according to the evidence we have for periods of time that would have had no fossil fuel burning.

            This is 10 times smaller than during the current 150 y when we have added fossil fuel emissions, and additional deforestation.

            This is strong evidence that temperature change was not the cause of the recent 130 ppm rise.

          • Nate says:

            I assume the 16 ppm/deg is coming from the deglaciation period of the ice core data, when deforrestation wouldnt have been an issue.

            How much did deforestation contribute during the MWP-LIA? Good question, I dunno.

            But if it did contribute significantly, then why wouldnt FF emissions also contribute significantly?

          • bdgwx says:

            Good question Nate. And if FF extraction didn’t go into the atmosphere and hydrosphere then where did it go?

          • fonzie says:

            I assume the 16 ppm/deg is coming from the deglaciation period of the ice core data, when deforrestation wouldnt have been an issue.

            Nate, yes, it comes from deep ice cores, glacial to interglacial. However, deforestation (or rather reforestation) would indeed have been an issue. There are relatively few trees during a glacial max due to a number of factors. (ice sheets, solar irradiance, carbon dioxide levels, etc) Trees act like a negative feedback on ocean outgassing. As CO2 levels increase, trees increase right along with them. What we have is a world in which trees may not be adequately performing their sequestration function due to deforestation this go round. (fundamental difference between MWP and now)…

          • fonzie says:

            But if it did contribute significantly, then why wouldnt FF emissions also contribute significantly?

            Nate and bdgwx, i just had another comment eaten. (be patient with me; i hope to give you still the narrative on the above question)…

          • fonzie says:

            Nate, my 12:44pm comment was actually my second to you. (the first got eaten) i just posted an answer to your question and, alas, it got eaten, too. i’ll have to try again later. (4th down, time to punt… ☹️)

          • bdgwx says:

            fonzie, Yeah, having your posts eaten is pretty annoying. Be careful with absorp.tion. You have to spell it like I just did. That’s a big one. Also, I occasionally can’t post for hours at a time even though I haven’t used any censored words.

          • fonzie says:

            If human emissions are a part of the rise, then the question is how will it manifest itself in the relationship between co2 and temperature? The atmospheric carbon dioxide growth rate is set by temperature. So if human emissions are having a greater and greater impact on the growth rate, then the relationship should break down over time. (more and more aco2 should be padding the totals) But, we’re not seeing that. .35C above equilibrium state gives us a 1ppm rise per year. (the pause was about .7C above equilibrium and gave us 2ppm/year) It hasn’t changed over time with burgeoning emissions. The carbon dioxide growth rate is whatever the temperature above equilibrium state dictates that it shall be. The logical conclusion from this is that the mass of anthropogenic co2 sinks at a rate near 100% (just the same as natural co2 emissions do).

            Keep in mind that if the rise is due to deforestation,then the real problem is not the deforestation itself, but the ensuing positive feedback loop that may be arising from the deforestation. Anomalously high co2 causing warming which, in turn, causes higher co2 levels still (and then further warming, etc). So the real problem is the runaway warming/outgassing of the oceans unconstrained by a biosphere that is no longer sequestrating as it has in times past. This is the process that is leaving little apparent room in the data for any atmospheric rise in carbon dioxide from human emissions.

          • Nate says:

            “The atmospheric carbon dioxide growth rate is set by temperature.”

            is a hypothesis, not a fact.

            “So if human emissions are having a greater and greater impact on the growth rate, then the relationship should break down over time.”

            The relationship was ~ 15 ppm/degree C in the past when we has no or very small human emissions.

            If you claim that the relationship is now 130 ppm/deg C than Houston we have a problem with this scenario.

            There is no known mechanism to explain such a large sensitivity. While if the sensitivity is on ~ 15 ppm/C, that CAN be explained in terms of the known values of ocean Co2 solubility vs temperature.

            “.35C above equilibrium state gives us a 1ppm rise per year. (the pause was about .7C above equilibrium and gave us 2ppm/year)”

            Again hypothesis that Temp change CAUSING rate. The causality could be the reverse of that.

            “It hasn’t changed over time with burgeoning emissions. The carbon dioxide growth rate is whatever the temperature above equilibrium state dictates that it shall be.”

            False.

            The cumulative emissions and CO2 levels are highly correlated since accurate measurements of CO2 began.

            See here:

            https://climexp.knmi.nl/data/icum_global_co2_emissions_1950:2020corr4229.png

          • fonzie says:

            The cumulative emissions and CO2 levels are highly correlated since accurate measurements of CO2 began.

            http://www.drroyspencer.com/wp-content/uploads/mauna-loa-co2-vs-emissions.jpg

            Nate, here are the growth rates of those cumulative emissions and atmospheric carbon dioxide growth. You can see that they don’t look anything like each other. (unlike temperature compared with the atmospheric growth rate) Notable are the two step rises in the atmospheric growth rate circa 1980 & 2000 that are concurrent with the two known step rises in temperature. We’re it not for those two step rises, the two trends would in no way be at 50% and your cumulative emissions graph would not work. They are only trending at 50% (the one of the other) because the step rises in temperature are allowing the one to keep pace with the other. (thus, of course, leading to a spurious correlation)…

          • fonzie says:

            The atmospheric carbon dioxide growth rate is set by temperature.

            is a hypothesis, not a fact.

            It’s a FACT(!)

            Nate, i’ve shown you the derivative plot of the carbon growth rate vs temperature going back to 1958. i’ve shown you the integral of temperature matching cores + mlo back to 1850. And i’ve shown you the relationship still with temp reconstruction and cores going back 500 frickin years(!!!) Why the denial? We can argue all day long about why it’s happening (which is fine), but we can’t argue that it is happening. For whatever the reason, the carbon dioxide growth rate correlates with the temperature anomaly and that’s the fact, jack!

          • fonzie says:

            There is no known mechanism to explain such a large sensitivity. While if the sensitivity is on ~ 15 ppm/C, that CAN be explained in terms of the known values of ocean Co2 solubility vs temperature.

            TREES, Nate. T-R-E-E-S(!) As stated before, 16ppm/C is predicated on the sequestering function of trees. And one thing mankind has done a lot of is cut down trees. (and for a lot longer time than he’s been digging up fossil fuels) And i’m suggesting that once ocean outgassing is decoupled from the biosphere (aka trees) we get a runaway positive feedback loop. Again, we can argue all day long about why it’s happening, but not that it is happening. For whatever the reason, the carbon dioxide growth rate is driven by temperature. (why it is, is another matter)…

          • fonzie says:

            .35C above equilibrium state gives us a 1ppm rise per year. (the pause was about .7C above equilibrium and gave us 2ppm/year)

            Again hypothesis that Temp change CAUSING rate. The causality could be the reverse of that.

            This is stupid (don’t do dat)…

          • Nate says:

            “Its a FACT(!)”

            Sure if you wear blinders and ignore all glaring facts that disagree!

            “ive shown you the integral of temperature matching cores + mlo back to 1850.”

            I just showed you excellent correlation between cumulative emissions and co2.

            Ignored.

            I showed you from YOUR data that the sensitivity to temp was 15 ppm/deg, now you want to claim it is 130 ppm/deg. Doesnt work, logically or physically.

            Ignored.

          • Nate says:

            Fonzie

            “http://www.drroyspencer.com/wp-content/uploads/mauna-loa-co2-vs-emissions.jpg

            Nate, here are the growth rates of those cumulative emissions and atmospheric carbon dioxide growth. You can see that they dont look anything like each other. ”

            That is not showing cumulative emissions. My plot, which you ignored, does show that, and shows nearly perfect correlation to CO2 levels.

            Your plot shows emissions vs derivative of Co2.

            It shows the trends in both track each other, as expected, over the 60 y period.

            It also shows lots of noise in co2 derivative, reflecting the natural variation of CO2 sources and sinks. This has been understood for a long time to be driven by ENSO.

            Why does sub-decade natural variation in CO2 say anything about the origins of the long term RISE in CO2? Hint: it doesnt.

          • Nate says:

            “TREES!”

            Yes there are trees.

            What you assert about them is pure speculation.

            So for instance, lets say tree cutting caused a rise of 10 ppm from MWP to LIA. But cooling of 0.6 C was also going on, and the net result was a decrease of 8 ppm, then the temperature sensitivity was still way too small to explain the 20th century rise.

            If you are serious about trees explaining CO2, then find some data, and come up with a quantitative model that explains what we have observed in CO2 record.

            Lacking that, its just hand-waving.

          • fonzie says:

            Its a FACT(!)

            Sure if you wear blinders and ignore all glaring facts that disagree!

            There’s no question whatsoever that the carbon dioxide growth rate is set by temperature. It’s right there in the data for 500 years. Now, you could argue that the growth rate is actually caused by human emissions which are in turn being modulated by temperature (which is fine). But, you cannot deny the fact that growth rate is set by temperature. That would be more stupid (so, don’t do dat either)…

          • fonzie says:

            “I just showed you excellent correlation between cumulative emissions and co2.

            Ignored.”…

            …Nate says:
            October 12, 2019 at 11:27 AM
            Fonzie

            http://www.drroyspencer.com/wp-content/uploads/mauna-loa-co2-vs-emissions.jpg

            Nate, here are the growth rates of those cumulative emissions and atmospheric carbon dioxide growth. You can see that they dont look anything like each other.

            That is not showing cumulative emissions. My plot, which you ignored, does show that, and shows nearly perfect correlation to CO2 levels.

            Your plot shows emissions vs derivative of Co2.

            This is too stupid for words (up your game, do better then that or jus’ don’t do dat)…

          • fonzie says:

            I showed you from YOUR data that the sensitivity to temp was 15 ppm/deg, now you want to claim it is 130 ppm/deg. Doesnt work, logically or physically.

            Ignored.

            Ignored? This is ridiculously stupid. (i’ve gone to great lengths in explaining my thesis) So, don’t do dat!

          • fonzie says:

            TREES!

            Yes there are trees.

            What you assert about them is pure speculation…

            …If you are serious about trees explaining CO2, then find some data, and come up with a quantitative model that explains what we have observed in CO2 record.

            Lacking that, its just hand-waving.

            Exactamundo !!! We totally agree here. This is just a comment page on a science blog and i’m just batting around ideas. (it could be TREES) This is a discussion that hasn’t been had elsewhere, because nobody has noticed the (500 year) correlation between temps and co2 growthrate. If somebody has a model that can make human emissions work, while honoring the correlation, i’d be more than happy to see it. But, seriously, Nate, you’ve got to get off the stupidity. Nobody wants to run around playing mind games with a moron like you. It’s just a waste of time. i hope your not as stupid as you look and i fear that your not really that stupid, rather just playing games instead. (and i don’t know which is worse) i’m not interested in playing chess with someone whose not even interested in learning how the pieces move. Show a little respect, put forth a cogent argument and don’t be stupid! (don’t do dat)…

          • Nate says:

            Fonzie,

            If the best you can respond with is ad-homs ‘stupid^n’ then you obviously don’t have real answers.

            ‘ im just batting around ideas.’

            Exactly.

            Then your statements about things being FACTs, when they are mere speculation have no credibility.

            Go work on those ideas and come back when youve thought them through.

          • Nate says:

            “And ive shown you the relationship still with temp reconstruction and cores going back 500 frickin years(!!!) Why the denial? We can argue all day long about why its happening (which is fine), but we cant argue that it is happening. For whatever the reason, the carbon dioxide growth rate correlates with the temperature anomaly and thats the fact, jack!”

            https://i0.wp.com/i90.photobucket.com/albums/k247/dhm1353/LawMob1.png

            You forgot to take derivative of CO2 in this plot. When you do, the CO2 data will shoot up dramatically on the right side.

            The ‘relationship’ to temperature vanishes.

          • fonzie says:

            Nate the Nut

            Goes to show you, if the fonz waits long enough, the nick name will come (whoa… 👍)

          • Nate says:

            And yet again, name calling, flawed analysis, but no answers.

            Ruining the Fonz’s good rep.

    • Stephen P Anderson says:

      I hope it keeps getting warmer. We need more CO2 in the atmosphere to grow more to feed people.

      • David Appell says:

        https://www.scientificamerican.com/article/ask-the-experts-does-rising-co2-benefit-plants1/

        “Even with the benefit of CO2 fertilization, when you start getting up to 1 to 2 degrees of warming, you see negative effects, she [Frances Moore, an assistant professor of environmental science and policy at the University of California, Davis] says. There are a lot of different pathways by which temperature can negatively affect crop yield: soil moisture deficit [or] heat directly damaging the plants and interfering with their reproductive process. On top of all that, Moore points out increased CO2 also benefits weeds that compete with farm plants.

        “We know unequivocally that when you grow food at elevated CO2 levels in fields, it becomes less nutritious, notes Samuel Myers, principal research scientist in environmental health at Harvard University. [Food crops] lose significant amounts of iron and zincand grains [also] lose protein.”

        • Stephen P Anderson says:

          I guess that’s why commercial green houses keep their CO2 levels so high.

          • ingersol says:

            I guess that is why commercial greenhouses control temperature, humidity nutrient levels, pH, etc.

          • David Appell says:

            Farmers can’t control temperature and water like greenhouse gardners do.

            Not rocket science.

          • Dr Roys Emergency Moderation Team says:

            David, please stop trolling.

          • bill hunter says:

            David – Farmers do control their production on the basis of predicted climate and precipitation already. Regionally, climate naturally varies much more annually than warming predicted over a generation. Some non-farmer in a lab somewhere can only demonstrate what farmers already know and provide for.

        • Stephen P Anderson says:

          Judas you need to call your lying propagandists friends and maybe they can explain to the many experts of commercial greenhouses they don’t know what they’re doing.

          https://fifthseasongardening.com/regulating-carbon-dioxide

        • John Finn says:

          Quite right, David. We need to return to the pre-industrial “ideal” climate. Admittedly it was a period of frequent drought, crop failure and famine but at least population growth.

          If we try hard enough we might even be able to recreate the conditions of the early 14th century when a shift in climate triggered a European-wide famine which wiped out up to 25% of Europe’s population.

          • ingersol says:

            If you want to argue that AGW will make the climate better, go ahead. But first you must acknowledge that humans are warming the planet due to their carbon dioxide emissions.

          • Nate says:

            ‘Admittedly it was a period of frequent drought, crop failure and famine but at least population growth.’

            You mean like 20th century and today?

          • David Appell says:

            John: except we can’t “return” to any previous climate.

          • Dr Roys Emergency Moderation Team says:

            David, please stop trolling.

        • Mr. “Appeal to Authority” Apple is blathering again —

          Any so called study that claims the future climate will be bad news is believed, while actual observations of the past 325 years of intermittent global warming are dismissed.

          Over 100 years of adding CO2 to the air, greening our planet, and making some cold upper Northern Hemisphere areas warmer, have been 100% good news.

          But never mind actual experience with global warming, because Mr. Apple will cherry pick some “study” to tell us the future will be different, and the ONLY news from adding CO2 to the atmosphere MUST BE BAD NEWS.

          The 50+ years of climate scaremongering may have brainwashed you, Mr. “Appeal to Authority” Apple, but not those of us with common sense.

          For every faulty “study” you highlight, there are at least 10 studies to prove adding CO2 to the air is beneficial for food crops, and is beneficial for our planet.

          A decent summary of studies here:
          ttps://www.heartland.org/_template-assets/documents/CCR/CCR-IIb/Summary-for-Policymakers.pdf

          You climate alarmists would deny the poorest people on this planet the fossil fuels they desperately need to improve their lives — shame on you !

    • bohous says:

      Based on my model, I expect an observable decrease of the blue temperature curve in the first months of 2020. Now we are near a local maximum: No wonder that September has a record temperature.

      • Yep, there it is again: The cooling spell will be next year. Like free beer, always “tomorrow”.

      • ingersol says:

        You mean your unpublished, non-peer-reviewed, physics-free model? LOL. September was the 8th highest anomaly in 500 months of observations. You don’t have to be clairvoyant to see that near future months are likely to be cooler. But you could be wrong about that too.

        So when does your model predict the next zero anomaly will be? Haven’t seen one of those since 2013 so that would be a more novel prediction.

      • David Appell says:

        bohous – where can someone read about and pick apart your model?

        • bohous says:

          The model cannot be picked appart. It is only best-fit-type formula:
          T = A * sin(B * t + C) + E * t + F
          where
          A=0.147177254326263
          B=1.74532925199433
          C=6.92793623087502
          E=0.0127217002387231
          F=-25.3918796086528
          It is simply a linear trend 1.27 Deg/century plus sinusoid with period 3.6 years. It is not meant to predict direct temperatures, only a sort of a trend

          • Scott R says:

            bohous is on the right track. We are in the 3.6 yr harmonic off the 2016 high. The next leg will be down as the 3.6 and 2.2 harmonics combine.

            bohous puts that E*t in there to add an underlying linear trend. I will debate that actually, bohous is capturing a larger cycle with that and that forcer will also have to be changed to multiple sin functions eventually, but maybe I can convince bohous about that after we collect more recorded data over the next several years.

            It’s just pleasant to see a sin function in ANYTHING climate related from anyone honestly.

          • John Tillman says:

            Looks like the September-October 2017 spike to 0.63 anomaly, after which the downtrend from February 2016 continued. But, who can say what will happen next month or next year with any degree of confidence?

          • bdgwx says:

            Your model has a linear force of E*t. What physical mechanism can be invoked to justify or explain it? How skillful is your model in reproducing the temperature profile over the paleoclimate record?

          • Dr Roys Emergency Moderation Team says:

            bdgwx, please stop trolling.

  3. argus says:

    The science is settled. Start work on 100 new nuclear reactors ASAP.

    • Shoo says:

      I think overwhelming support on this blog for building those nuclear reactors, whether or not they think climate change is something to be concerned about.

      • bobdroege says:

        Some things are cheaper, come on line faster, are more reliable, can’t burn up your whole investment due to some stupid engineer’s mistake, and don’t burn fossil fuels.

        Let’ build some of those.

        • argus says:

          And what would those be? Solar and Wind are not reliable.

          • bobdroege says:

            Like says who, with battery backup they are cheaper than nuclear and competitive with natural gas.

          • argus says:

            He could be wrong, and I hope he is, but I doubt it.

            https://www.youtube.com/watch?v=N-yALPEpV4w

          • bobdroege says:

            He told a fib or two.

            One being that nuclear power plants can’t ramp up and down in power, that’s not true, the real reason they say that is that economical, you only maximize the revenue if you run the nuclear plants at 100% power.

            In fact the nuclear plants on submarines and targets are load following, when the throttles are opened to make the boat or ship go faster, there is no action taken to raise the reactor power, it does that automatically.

            And basically, no new nuclear can come on line in less than 10 years so that won’t save the planet either.

          • argus says:

            Wait, Greta says we got a 50/50 using the settled science if we meet our climate goals in 10 years. So there’s still hope.

          • David Appell says:

            But it’s “blue” — a pretty color.

            Do you have a problem with “blue?”

          • David Appell says:

            argus says:
            October 1, 2019 at 10:09 PM
            And what would those be? Solar and Wind are not reliable

            Says who?

          • gbaikie says:

            –bobdroege says:
            October 2, 2019 at 11:40 AM
            He told a fib or two.

            One being that nuclear power plants cant ramp up and down in power, thats not true, the real reason they say that is that economical, you only maximize the revenue if you run the nuclear plants at 100% power.–

            Nuclear is clean energy {and so is natural gas} and they operated for longer times. He said 90%, and think it’s more than 95% of the time.
            Also the fuel costs of nuclear are far less than any fossil fuel powerplant. Or if stop using fossil fuel you have “cost saving” of not using up the fuel. Or infrastructural cost of fossil fuel is cheap and fuel is main cost. With nuclear, the infrastructure is major cost, and fuel is basically nothing.
            The other cost is labor costs needed to operate either of them, and sure there is much difference.
            So not using a nuclear powerplant makes them a lot less profitable.
            But to lessor degree this also applies the fossil plants, using any them sporadically increases their operational costs, and applies to hydrodams, because a hydrodams will manage their use depending upon the water supply, if use them with solar and wind, the inability of solar and wind to provide electrical power, manages the use of hydrodams {and run out water- making droughts a more severe problem}.
            But one can lower the infrastructural costs of Nuclear power and design nuclear power to have greater ability to have variable power- it’s good to have such capabilities even if you didn’t have problem of wind and solar power.

            –And basically, no new nuclear can come on line in less than 10 years so that wont save the planet either.–

            Nuclear power is already “saving the planet” and has doing it for decades. But climatic activists are trying to shut them down {They already shutdown some, and want shutdown even more of them}.
            Google search number of deactivated nuclear power plants.
            Wiki:
            “The number of decommissioned nuclear reactors out of the List of nuclear reactors is small. As of 2016, 150 nuclear reactors were shut-off, in several early and intermediate stages (cold shut-down, defueling, SAFSTOR, internal demolition), but only 17 have been taken to fully “greenfield status”. ”
            And:
            “As of 2017, most nuclear plants operating in the United States were designed for a life of about 3040 years and are licensed to operate for 40 years by the US Nuclear Regulatory Commission. The average age of these reactors is 32 years. Many plants are coming to the end of their licensing period and if their licenses are not renewed, they must go through a decontamination and decommissioning process.”

            It seems to me, one should re-license them, and not vaguely be requiring every every powerplant to go thru “decontamination and decommissioning process”. One should plan on a site to use nuclear energy for centuries- and “try hard” to avoid getting to needing to do a “greenfield status”. Or if screw up and put nuclear site in “wrong place”, than I guess you have do the “greenfield status”.
            And the 17 unless they are mostly small experimental reactors, it seems crazy.

          • bobdroege says:

            Gbailkie,

            Nuclear plants don’t operate 95% of the time, it’s more like 75 to 80%, typically 18 months operating and then 6 months for refulueling.

            Been there done that, 14 years working at a nuclear plant.

            Bottom line is Nuclear is too expensive compared to other clean energy, and no, natural gas is not clean, it’s ok for home heating and cooking but power generation, no.

          • Dr Roys Emergency Moderation Team says:

            bobdroege, please stop trolling.

          • gbaikie says:

            “Fuel is replaced after being in the core for six years, so every two years a third of the fuel is replaced and the other two thirds are moved around to make for even burning. Many smaller maintenance projects will occur at the same time – 13,000 separate tasks in only six weeks.”

            So 3 weeks per year.
            What else:
            “Nuclear power plants operated at full capacity more than 92% of the time in 2018making it the most reliable energy source in America. Thats about 1.5 to 2 times more reliable as natural gas (58%) and coal (54%) plants, and roughly 2.5 to 3.5 times more reliable than wind (37%) and solar (26%) plants.”

            Anyhow I read that some {newer} nuclear reactor have been doing more 95% per year. If some having it down on average 3 weeks out 52 weeks, that is 94.2%, so some them don’t do only down time of just 6 weeks every 2 years, if nation average is more than 92%.

        • argus says:

          that link^^

          Why renewables cant save the planet | Michael Shellenberger | TEDxDanubia

          • Yaniv Tomer says:

            The problem with “sure let’s build some nuclear plants but we still don’t believe in warming” is that it is intellectually bankrupt and politically a nonstarter. You want to eat your cake and stuff it in your briefcase as well. Nuclear power is NOT popular, is extreme NIMBY fodder, and is extremely capital intensive. If you want buy-in from people (very much including conservatives) for nuclear then you NEED to accept/acknowledge/come to grips with REALITY, including the consequences of business as usual. And, BTW, nothing would help nuclear more than putting a freaking price on carbon.

            But seriously how about that cooling. 0.1 degrees per year since 2016. Amazing.

          • argus says:

            Warming or no, build 100 reactors yesterday. Make the bulk of our power nuclear.

          • David Appell says:

            Argus: who really wants to build more nuclear plants?

            If we do, can we at least bury the waste in your backyard?

            It will only last for a few 10s of thousands of years.

            No?

          • bobdroege says:

            Whose got a trillion dollars to build those 100 nuclear power plants?

          • David Appell says:

            Who’s got $10 B to pay for climate change damages?

          • argus says:

            That waste will be reused. The choice is nuclear power make up the bulk of our energy production, or we allow the government to intentionally hamstring the economy and severely curtail freedoms. Is that not clear to everyone?

          • argus says:

            @bodbroege Who has 3-4 trillion a year for Yang’s UBI, or 1+ trillion a year for Bernie’s Medicare 4 All? We’re in danger of destroying Gretas kid’s childhood, too, with all this inaction.

          • bobdroege says:

            Argus,

            I never said I was in favor of Yang’s UBI or Bernies medicare for all, but in the US, we do spend 16-17% of GDP on medical care, so I think Bernies 1 trillion for medicare for all would have most of the people winning only a few losing, those few being those in the healthcare industry taking advantage and making money with out providing any useful benefit.

          • argus says:

            A win so small even Trump isn’t interested. We could win even bigger if we throw all that money at climate.

          • argus says:

            And, Bob, this is spending on top of current levels. The only way you get money for a UBI or Medicare for All is raising taxes significantly or gutting existing programs and/or the military.

          • bobdroege says:

            Argus,

            check your pay stub,

            I pay more for social security, medicare, health insurance and my health savings account than I do for state, local and federal taxes.

            So yeah, double my taxes for “free” healthcare.

    • Richard Greene says:

      Science is never settled, Argus.

      Only a dingbat would say that.

  4. Chris says:

    At what point does an upturn or downturn become a trend? And at what point do we acknowledge that multi-decadal trends are not unusual in Earth’s climate history?

    • RW says:

      Not any time soon. If the temp can jump up over 0.2C in one month, it can also jump down over 0.2C in one month. The also means the entire upward increase since 1979 could be wiped out in a just a couple of months. Yet people still want to think the monthly fluctuations (in either direction) mean something about the future. They don’t. Trends are only known after the fact, and from specific starting points and end points.

      • David Appell says:

        not so. the trend would easily still be positive….

        • Richard Greene says:

          Using linear trend lines for non-linear temperature data is likely to mislead, and deceive, which is why you love trend lines, Mr. Appeal to Authority Apple.

          Start the trend line during the Holocene Optimum and we’ve had global cooling since then — I guess that’s “scientific proof” we are in a cooling trend ?

          Better yet, start the trend line when dinosaurs roamed our planet !

      • Tim Folkerts says:

        RW, it doesn’t work like that. The month-to-month jumps are related. Most of the biggest jumps down are either proceeded by or followed by similar jumps up.

        The biggest 1-month downward jump was -0.32 (proceeded by +0.33).
        The biggest 2-month downward jump was -0.43 (proceeded by +0.28).
        The biggest 3-month downward jump was -0.43.(proceeded by +0.52)

        You simply don’t ever get three big down jumps in a row to ‘wipe out the entire upward gain since 1979 in just couple months’. Big jumps merely tend to wipe out previous jumps in the opposite direction.

      • RW says:

        I’m not talking about the trend itself being wiped out. I’m talking about the amount of the trend, i.e. the actual amount of temperature increase over the trend period, could be wiped in only a couple months. This demonstrates how spectacularly small the 40 year trend amount actually is.

        • Tim Folkerts says:

          RW Claims: “the actual amount of temperature increase over the trend period, could be wiped in only a couple months.”

          Yeah, the linear trend could be brought to zero in a couple months … at -21 C on the graph! So if the whole globe were below freezing for a couple months, that would do it. Or a year with a global anomaly of -3.5 C would do it.

          This actually show how resilient the trend. It would take years of impossibly cold temperatures to whip out the trend.

          • Bart says:

            Which tells you what about using trending analysis on data which may not have an actual linear component?

          • Tim Folkerts says:

            Oh, certainly any analysis of oscillating, noisy, auto-correlated, data is prone to all sorts of difficulties. Linear trends are a trendy (pardon the pun) way to analyze data. They are the simplest (and often too simple) tool available, and hence they get used a lot as a ‘first pass’ analysis.

            And sure, there could be 60 year cycles (or 50 years or 70 years or 375 years or 11 years as other have claimed). But here is the flip-side to linear trends being perhaps over-simple. The climate data is not goo enough over long enough time scales to confirm these sort of cycles. You would want 3+ cycles with clear, statistically significant oscillations (ideally coupled to theoretical or modeled predictions). We don’t have 150+ years of good global records; we don’t have the ability to accurately and confidently identify long-term cycles.

          • Bart says:

            IOW, the temperature data are not helpful in determining if AGW is a reality or not. Thank you. The witness may step down.

          • David Appell says:

            Bart says:
            IOW, the temperature data are not helpful in determining if AGW is a reality or not

            Hilarious.

            Listen to yourself.

          • bdgwx says:

            The defining metric of AGW is the global mean temperature. I’m having a hard time understanding how temperature data is not helpful here.

          • Tim Folkerts says:

            “IOW, the temperature data are not helpful in determining if AGW is a reality or not.”

            That is not quite what I said.

            The global temperature data is marginal for detecting specific global cycles that have periods of 50+ years. Furthermore, estimates for the PDO and the AMO show significant variations in period and intensity, meaning that ‘predictions’ for the future based on a specific period and/or amplitude are pretty much just guesses.

            On the other hand, the data are plenty robust to show a significant overall warming. Furthermore, there is a simple physical reason (GHGs) to expect warming. The combo of theory and experiment gives added confidence.

            Now I will admit that determining how much of current warming is human-caused is a bit fuzzy. Is AGW 100% of the warm? Maybe only 60%? Heck maybe it is 120% (overcoming natural cooling that would have occurred otherwise)?

            But the data is definitely helpful, and definitely points toward the reality of AGW.

          • Bart says:

            “On the other hand, the data are plenty robust to show a significant overall warming.”

            But, not the cause.

            “Furthermore, there is a simple physical reason (GHGs) to expect warming.”

            Your fallacy is: begging the question.

            It’s either warming, or it is not warming. There are only two choices, 50/50. So, you are seeking to “prove” your hypothesis by a coin flip.

        • RW says:

          Tim,

          The trend itself and the amount of the trend are NOT the same thing. The trend itself cannot be wiped out by 2 months of cooling. This is not what I was saying.

          • Tim Folkerts says:

            RW, I see now. Sorry — I misinterpreted what you said.

            Yes, in a few months the data for that month could be back to zero. It has never happened that the temperature has dropped 0.6C in two months so saying ‘a couple’ would be ‘unprecedented’. Maybe in 6 or 8 months — but still quite unlikely.

            And to wipe out the ‘gain since 1979’, the temp would have to drop to ~ -0.2, or 0.8 below the current value. That is even less likely!

    • Eben says:

      At what point does an upturn or downturn become a trend? And at what point do we acknowledge that multi-decadal trends are not unusual in Earths climate history?

      In order to have a discernible trend the long time average has to climb above the short time variations noise.
      In other words the red line would have to be above 0.8 degrees on the above scale and stay there for at least 10 years, anything less is just a noise in the system
      and that is if you disregard multi-decadal oscillation.
      If you want to know for sure by including multi-decadal oscillation you have to collect another 40 years of data because right now you have only exactly half of it.

      Of-course the climate shysters insist any uptick and downturn within the range of the noise of the system is a trend , but thats a circular argument.

      • Svante says:

        Quite right Eben, it’s been going on for two hundred years:
        https://tinyurl.com/y95cmx6t

      • TheFinalNail says:

        Eben says:

        “At what point does an upturn or downturn become a trend? … In order to have a discernible trend the long time average has to climb above the short time variations noise.”

        A ‘climatology’ is defined by the WMO as a period of 30 years and a statistical significance test is a commonly used way to discern whether a long term direction of travel can be distinguished from the short term variability,

        So I would say that if a period of monthly temperature data spanning 30 years or more contains a statistically significant ‘trend’ then it’s hard to see what other word could be used to describe it. ‘Prolonged and unusual upturn or downturn’ hardly seems to do it justice. It’s a trend.

        Whether it’s unusual or not to see such a trend in global temperature data, and irrespective of what it’s causes might be, it’s no less of a trend.

        TFN

        • Bart says:

          30 years is the worst, given the ~60 year periodicity. There is no fundamental reason for 30 years. It was picked out of a hat.

        • Bart says:

          There is no basis for 30 years. It’s particularly bad given 60 year periodicity.

          • Bart says:

            Hmm… Delayed acceptance. Curious.

          • David Appell says:

            Bart, speaking of 60yr trends:

            60-yr trend of NO.AA global monthly average surface temperature = +0.16 C/dec.

            Want to explain?

            data page:
            https://tinyurl.com/n2twzcm

          • barry says:

            You’re back, Bart.

            “There is no fundamental reason for 30 years. It was picked out of a hat.”

            I’m not sure that is true. I’ve seen statistical tests for that period with respect to surface data, such as:

            http://moregrumbinescience.blogspot.com/2009/01/results-on-deciding-trends.html

          • Dr Roys Emergency Moderation Team says:

            Not that it matters, as we already know that even if there were a 30-year period lacking statistical significance, they will say it’s meaningless anyway.

          • bobdroege says:

            You know HUMPTY DUMPTY DREMTPY, that there are 30 year trends that lack statistical significance if you use the test that if the uncertainty exceeds the trend then it is not statistically significance.

            Try 1940 to 1970

            And I am not one to say that period is meaningless.

          • Dr Roys Emergency Moderation Team says:

            …barry knows what I’m talking about…

          • bobdroege says:

            I doubt it, as you don’t.

          • barry says:

            Let me quote myself from that thread:

            On statistical (non)significance and trend lines over 30 years:

            “To answer your question(?), it would be curious, but not conclusive. More study at that time might yield a firmer answer A non-significant trend line alone would not be enough…”

            “…we already have 1987 to 2016 as a 30 year trend that fails statistical significance.”

            And I asked what that meant, as DREMT kept saying such a thing is “meaningful.” I got as far as understanding that it was meaningful because it had not happened before (it had). Perhaps I missed some nuance there?

            Furthermore, I said:

            “If there was a 30-year stall in global warming, or a cooling of 30 years, then that would be a significant challenge to the notion of AGW, I believe.”

            Part of my interest in that discussion was seeing if DREMT understood why these statements are not mutually exclusive. I believe that DREMT understands this.

            This was a discussion about satellite TLT global record – satellite temps have a larger variability than surface temps, and therefore require longer periods for trend ‘x’ to achieve statistical significance. The Grumbine article I linked above is about surface temps.

            I think we almost understood each other in that thread, DREMT.

          • Dr Roys Emergency Moderation Team says:

            1) I said:

            “Not that it matters, as we already know that even if there were a 30-year period lacking statistical significance, they will say it’s meaningless anyway.”

            bobdroege childishly replied:

            “You know HUMPTY DUMPTY DREMTPY, that there are 30 year trends that lack statistical significance if you use the test that if the uncertainty exceeds the trend then it is not statistically significance.

            Try 1940 to 1970

            And I am not one to say that period is meaningless.”

            Implying that he would not consider a 30-year period lacking statistical significance to be meaningless. I linked to our discussion as I knew it not only proves my point that there are those who would (as does your response here), but it also shows that I already understood everything he had said.

            In fact, in our discussion, you made it clear that even if there was a 30-year period where the trend was calculated to be zero or even slightly negative, you would do your best to downplay that/say that was meaningless, too.

            2) “…we already have 1987 to 2016 as a 30 year trend that fails statistical significance”

            OK let’s set the record straight on this. There was some confusion about the SkS trend calculator:

            https://skepticalscience.com/trend.php

            …and what constitutes a 30-year trend. If you put 1987 to 2016 in that calculator, you do indeed get a trend that fails statistical significance…but that is actually a 29-year trend. It will run from Jan 1987 to December 2015 if you enter 1987 to 2016. You need to enter 1987-2017 to get a 30-year trend. So, to clarify, there has never been a 30-year trend that fails statistical significance in the UAH 6.0 data, as you can check by running all possible trends from 1978-2008 onwards. So yes, if over the next few years we were to get our first ever such 30-year trend, that would represent the first time that the calculated 30-year trend dipped below the level of the noise (which as we know remains steady for 30-year periods throughout the data).

            3) “This was a discussion about satellite TLT global record – satellite temps have a larger variability than surface temps, and therefore require longer periods for trend ‘x’ to achieve statistical significance. The Grumbine article I linked above is about surface temps.”

            30 years should be more than sufficient for both. 17 years was supposedly sufficient, according to Santer et al.

        • Stephen P Anderson says:

          Doesn’t matter what the trend is. According to Salby it is still random. <5% probability the trend is non random.

        • Nate says:

          ” the ~60 year periodicity”

          Arent we like 20 y overdue for the return of the peak in 60 y cycle?

          • Bart says:

            No. We hit the peak right on time about 2005. Temperatures declined, and then the big 2016 El Nino hit.

          • barry says:

            Temperatures declined from 2005 to just before 2016?

            http://www.woodfortrees.org/plot/uah6/plot/uah6/from:2005/to:2016/trend

            Not that I can see.

          • Nate says:

            ‘and then the big 2016 El Nino hit.’

            Ok fine. Remove 2016 if you like, but probably should remove 2011 La Nina year to be fair.

            Still no peak in 2005.

          • Bart says:

            Here it is, guys:

            https://tinyurl.com/y6occl9h

            It peaked in 2005 or so, and was heading down consistently with past experience until the 2016 monster El Nino hit. Whether we’ve had a regime change, or it will relax back to the prior established pattern, remains to be seen. But, a sudden regime shift is not something anyone can lay at the feet of CO2 anyway.

          • Bart says:

            “Temperatures declined from 2005 to just before 2016?”

            Pardon me. I should have said “temperatures declined consistently with the ~60 year pattern relative to the long term trend.”

          • barry says:

            Ah, I’ve never been clear that you see an underlying long term positive trend, Bart. I thought that for you it was flat but for the cycles.

          • Nate says:

            ‘Whether we’ve had a regime change, or it will relax back to the prior established pattern, remains to be seen. But, a sudden regime shift is not something anyone can lay at the feet of CO2 anyway.”

            Regime change or not, the natural variation is ongoing, as is the warming.

            Someone earlier showed proxy reconstruction of AMO going back several hundred years.

            It looked periodic for last century or so, ~ 2+ cycles, but prior to that periodicity was not apparent.

            Similar to other ‘cycles’ like ENSO, one can see brief periods that look periodic, but they have no predictive value.

          • Bart says:

            How could one not see a long term underlying trend, barry?

            But, it started long before rising CO2 could have caused it.

    • barry says:

      “At what point does an upturn or downturn become a trend?”

      First hurdle to clear is statistical significance. That’s not definitive, but a good start.

  5. Scott R says:

    This data point does not do anything to change the fact that since 2016 we are still cooling. We still have a “bearish pair” with El Nino 3.4 hitting a 0.77 in April 2017 (HADSST3), but really only holding above 0.5 for 2 months, so no official EL Nino ever declared. Shortly after that time, UAH hit +.64 in October, the aligned peak for that ENSO cycle.

    This El Nino was obviously stronger than that one, hitting a 1.32 in April of 2019. Unofficial El Nino conditions were present for 14 months in a row going by the HADSST3. Now we have a +0.61 on UAH.

    So you have MORE ENSO forcing, but a lower temperature.

    The only thing this data point proves is the importance of ENSO harmonic 3.6 off the 2016 high. What goes up fast will come down fast as the next leg aligns the 3.6 and 2.2 ENSO harmonics.

    • David Appell says:

      numerology.

      the trend since dec 2016 is +0.03 C/dec

    • David Appell says:

      the 2015-16 season had an average ONI of 1.7 C

      2018-19: 0.6 C

      much weaker, barely in El Nino territory

      https://ggweather.com/enso/oni.htm

    • Midas says:

      Why do you think “the trend since 2016” is a meaningful concept?

      • David Appell says:

        I dont. Thats why i labeled it numerology. Which is what Scott is doing

        • Midas says:

          My comment was clearly directed at him.

        • Scott R says:

          David Appell,

          I’ve already explained this business of cycles to you many times, but you keep producing linear trends as “proof” by cherry picking points in the data set. Did you know that if you have cyclical data you can actually produce an almost unlimited amount of linear trends based on what data points you select? Seriously. Try it sometime just for some mathematical fun.

          • David Appell says:

            There doesn’t seem to be an end to the mathematical games you’ll play to avoid the obvious.

          • SkepticGoneWild says:

            The moon non-rotators were more entertaining than the alarmist “the sky is falling” bunch.

          • David Appell says:

            Define “the sky is falling.”

          • SkepticGoneWild says:

            “The phrase, The sky is falling, has passed into the English language as a common idiom indicating a hysterical or mistaken belief that disaster is imminent.

            Happy?

          • Dr Roys Emergency Moderation Team says:

            Oop…you brought up the moon’s axial rotation issue again…here we go then.

            The “Spinner” argument is self-contradictory. They use math as though the moon is rotating about the Earth (they calculate a value for “orbital angular momentum” <b<and as if it were rotating on its own axis, “spin angular momentum”.

            But>/b>

            An object that is rotating about the Earth already moves as per the moon. If the moon were rotating about the Earth, and on its own axis, you would see all sides of the moon from Earth. When “Spinners” talk of the moon making two motions, they actually mean the moon is translating about the Earth and rotating on its own axis.

            A translation about the Earth is not>/b> a rotation, so their claim of “orbital angular momentum” and spin angular momentum is contradicted. They have only the latter, by definition!

            “Non-Spinners” see the moon as rotating about the Earth, and not on its own axis. “Orbital angular momentum” only, no “spin angular momentum”. And no internal contradiction.

            Thus, the “Non-Spinners” are correct.

          • Ball4 says:

            “Thus, the Non-Spinners are correct.”

            No, that’s been proven wrong long ago by Orion’s belt not fixed in the moon’s view & many other methods.

            Yet another way to show the moon rotates on its own axis is the polar, planar orbiting Diviner observation swath width each orbit is only ~3.75km. The moon rotates under Diviner each orbit affording it essentially global coverage.

            Give it up DREMT, your moon non-spinners lost this argument from the get go. And, please stop trolling about it.

          • Dr Roys Emergency Moderation Team says:

            I’ll write that out again, to sort the problems with bolding:

            The “Spinner” argument is self-contradictory. They use math as though the moon is rotating about the Earth (they calculate a value for “orbital angular momentum”) and as if it were rotating on its own axis, (“spin angular momentum”).

            But

            An object that is rotating about the Earth already moves as per the moon. If the moon were rotating about the Earth, and on its own axis, you would see all sides of the moon from Earth. When “Spinners” talk of the moon making two motions, they actually mean the moon is translating about the Earth and rotating on its own axis.

            A translation about the Earth is not a rotation, so their claim of “orbital angular momentum” and “spin angular momentum” is contradicted. They have only the latter, by definition!

            “Non-Spinners” see the moon as rotating about the Earth, and not on its own axis. “Orbital angular momentum” only, no “spin angular momentum”. And no internal contradiction.

            Thus, the “Non-Spinners” are correct.

          • barry says:

            Moon rotation argument initiated by SkepticGoneWild.

          • Dr Roys Emergency Moderation Team says:

            Yep, more proof of what I mentioned before. The moon’s axial rotation arguments are always initiated by the “Spinners”.

          • SkepticGoneWild says:

            I did not initiate any argument.

          • Dr Roys Emergency Moderation Team says:

            Sure you didn’t, “HuffmanGoneStupid”.

          • Nate says:

            “A translation about the Earth is not>/b> a rotation, so their claim of ‘orbital angular momentum’ and spin angular momentum is contradicted. They have only the latter, by definition!”

            Once again, DREMT fails at basic physics.

            Of course a translation around the Earth has orbital angular momentum, mvr.

          • Dr Roys Emergency Moderation Team says:

            I’ll write that out again, to remove the superfluous comma, and add an additional couple of definitions, in case that is helpful for some:

            The “Spinner” argument is self-contradictory. They use math as though the moon is rotating about the Earth (they calculate a value for “orbital angular momentum”) and as if it were rotating on its own axis (“spin angular momentum”).

            But

            An object that is rotating about the Earth already moves as per the moon. If the moon were rotating about the Earth, and on its own axis, you would see all sides of the moon from Earth. When “Spinners” talk of the moon making two motions, they actually mean the moon is translating about the Earth and rotating on its own axis.

            A translation about the Earth is not a rotation, so their claim of “orbital angular momentum” and “spin angular momentum” is contradicted. They have only the latter, by definition!

            “Non-Spinners” see the moon as rotating about the Earth, and not on its own axis. “Orbital angular momentum” only, no “spin angular momentum”. And no internal contradiction.

            Thus, the “Non-Spinners” are correct.

            ………….

            Angular momentum:

            the quantity of rotation of a body, which is the product of its moment of inertia and its angular velocity.

            Angular velocity:

            the rate of change of angular position of a rotating body.

          • Nate says:

            No improvement, DREMT.

            Still getting angular momentum all wrong.

            Rotation and angular momentum are not the same thing.

            An asteroid flying past the Earth still has mvr angular momentum about the Earth.

            But if it hit the Earth it could give it extra rotation.

          • Dr Roys Emergency Moderation Team says:

            Well, with no responses from anyone worth responding to, and those definitions speaking for themselves, I guess that’s that.

          • Nate says:

            = no responses from anyone who can be fooled by my fake physics.

            Hilarious!

          • barry says:

            “Yep, more proof of what I mentioned before. The moon’s axial rotation arguments are always initiated by the “Spinners.”

            Nope, not always, and maybe not even mostly, but here is yet more evidence of an AGW critic bringing in the moon rotate argument to a different discussion. As they tend to do more than others.

          • Dr Roys Emergency Moderation Team says:

            Nope, not always, and maybe not even mostly, but here is yet more evidence of a “moon does not rotate on its own axis” critic bringing in the moon’s axial rotation argument to a different discussion. As they tend to do more than others.

      • Scott R says:

        Midas I’m looking at various natural cycles on multiple time frames to come to the conclusion that the 2016 peak is a long term top. 2012 was the top of the AMO, also the arctic ice min, and we confirmed again just this year that the PDO has still been positive. That plus the super ENSO, which is the down beat of the 11 year solar cycle. That puts 2016 centered between AMO and PDO peaks with a super ENSO. I don’t see how that top is surpassed, unless I’m wrong about AMO’s top being in.

        The most significant forcer right now is the fact that we are coming off of the 3.6 ENSO wave, and will have the 2.2 and 3.6 waves combine into the power down wave on the 11 year cycle in short time. Over the next 1-2 years, we should drop to +0.1 on UAH. Eventually, we will see -0.2 again, but it is difficult to say when.

        As you might have guessed if you looked at my model on the prior post, the next wave of AMO and PDO is the power down wave also right as we head into the GSM. That’s not a coincidence. The GSM is driving AMO and PDO. They are it’s harmonics. I’m pretty sure my prediction of -0.2 will come true.

      • Richard M says:

        Midas, many of the so-called climate “experts” stated that 2016 was mainly ocean heat from AGW finally making an appearance. They claimed 90% of the warming was AGW and only 10% due to ENSO.

        So, if you believe your climate “experts” are always right then the trend from 2016 should have continued upward. The fact is was seriously downward should give you pause about the abilities of your climate “experts”.

        • Craig T says:

          “They claimed 90% of the warming was AGW and only 10% due to ENSO.”

          At the scale of 1 – 2 years? Changes over a few years are always dominated by the ENSO cycle. The experts (with or without quotes) never said 2017 would be warmer than 2016.

    • Craig T says:

      “This El Nino was obviously stronger than that one, hitting a 1.32 in April of 2019. … So you have MORE ENSO forcing, but a lower temperature.”

      How are you figuring that the 2018 -2019 El Nino is stronger than 2015-2016? The ONI index shows El Nino conditions from November 2014 to April 2016 with 5 months above 2.0. The latest El Nino started October 2018 and ended June 2019, never breaking 1.0.
      https://origin.cpc.ncep.noaa.gov/products/analysis_monitoring/ensostuff/ONI_v5.php

      The MEI index rates the last El Nino even lower. It shows the 2015-2016 El Nino as lasting 13 months hitting a high of 2.2. For 2018 – 2019 it only lists September 2018, February 2019 and March 2019 as El Nino conditions. The highest of those was March 2019 showing a MEI index of 0.8.
      https://www.esrl.noaa.gov/psd/enso/mei/

    • Midas says:

      How’s your La Nina looking? Are you going to have to switch to a new graph this month to justify its imminent arrival?
      (Note – my question is not related to this month’s UAH figure.)

      • Scott R says:

        Midas… what are you saying? That there will never be a La Nina ever again? lol

        ren and I both agree that there is no guarantee of La Nina early next year, it is only on our watch list. There is an equal chance that it holds off until the trade winds pick up in the 2020-2021 NH winter season. Did you know that forecasters at NOAA also have no idea really what ENSO will do. That is why they break it down by % chances, so they are “always right”.

        I’m using a sun-based model, and we always go into a La Nina when a new SC starts. Now there is a sun spot going on right now, but it sounds like it is more of a SC 24 spot. The sun’s polarity has not reversed yet if that is the case. That reversal could provide the boost to get the la nina started when it happens… or it could be just the increased solar wind will cause more trade winds to pick up and more upwelling.

        • David Appell says:

          How, physically, does a new solar cycle cause an La Nina?

          • Scott R says:

            David, the earth receives more energy in January then July. We can see every year that increased solar energy received causes trade winds to pick up. So of course that phenomenon exists on other time frames. Trade winds are necisary to overturn ocean waters to create La Nia. There may also be something to the magnetic field reversal on the sun, the solar wind, but I’m still researching that. Bottom line, when you put a 60 month moving average filter on the 3.4 departures, you get an 11 year period. The sun is driving ENSO.

          • David Appell says:

            Scott R says:
            David, the earth receives more energy in January then July. We can see every year that increased solar energy received causes trade winds to pick up. So of course that phenomenon exists on other time frames. Trade winds are necisary to overturn ocean waters to create La Nia

            So why don’t La Ninas happen every year?

          • Scott R says:

            David Appell,

            “So why dont La Ninas happen every year?”

            TSI is not the only determining factor controlling the trade wind departure obviously.

        • Midas says:

          Where did you pull that ridiculous straw man argument from?
          Ren has stated that there will be a La Nina by November.
          The fact that no one knows what ENSO will do was my whole point in challenging his claim.

          • Scott R says:

            I didn’t realize ren had given that date… perhaps ren would like to speak to that… actually, we already had the discussion a few threads ago that an official la nina was already off the table for this fall, and we were talking about February. You would need 3 months in a row.

          • ren says:

            For the winter of 2019/20, the solar minimum and pressure over the polar circle are more important than the Nino 3.4 value.

          • Midas says:

            ren
            More important for whom? Is that a global statement?

          • Dr Roys Emergency Moderation Team says:

            BobdesbonddesMidas, please stop trolling.

  6. DocSiders says:

    The EIA Projections for 2050 Global anual energy consumption is 900 Quads. That’s a mere 270,000,000 GWh…that’s everything…Electricity, Transportation, Aviation, Industrial, Agricultural.

    Renewables might be able to take on 150 Quads if enough Hydro is allowed to be built. Nuclear produces about 27 Quads now.

    The remaining 700 Quads are all fossil fuels that New Nuclear Plants will have to take over else energy shortages will kill more people than the climate.

    A 1 GWe Nuclear plant produces around 8,700 GWhe Annually. 700 Quads times 300,000 GWh/Quad = 210,000,000 GWh total World Energy…divided by 8700 GWh/Nuc = Over 24,000 MORE Nuclear Plants needed by 2050.

    30 years of 365.25 days is 11,000 days.

    So, we need TO COMISSION MORE THAN 2 NUCLEAR PLANTS every day from now until 2050.

    I don’t hear anybody talking about that level of Global Mobilization of resources anywhere except Dr. Roger Pielke (who is considered a Denier).

    I’m still a LukeWarm Denies, but GAT upticks like this month’s get my attention.

    • argus says:

      Because most people want to win the argument, and won’t accept facts banging them in the face.

      Democrats have to accept the rules must be loosened to build nuclear plants and quit being scared of a Trump gutting the regulatory agencies after the fact, and Republicans accept the concept of “change” and the fancy new toys to solve the problem might require tax money originally intended for expanding the empire.

    • Lou Maytrees says:

      Doc Siders,
      Vogtle 3&4 Georgia USA is on track to cost $35 Billion simply to build by 2021. Hinckley C is currently at $26 Billion w estimates at $50 Billion at completion 6 years from now.

      Just in todays money your 22,000 nuclear plants will cost almost 1000 TIMES more than the worlds present GDP of $80 Trillion.

      Exactly where will you get the capital to do that by 2050?

      • Perfecto says:

        Your math is off. At a rate of $80 billion for 5.4 GW, the cost of 24 TW is $355 Trillion, not your claimed $80,000 Trillion.

        • Lou Maytrees says:

          Perfecto,
          Simply multiply todays $35 Billion cost times 22,000 new nuclear power facilities that docsiders claimed are needed and you get a $ figure that is nearly 1000 times higher than the current World GDP of &80 Trillion.

          btw, your $355 Trillion is still more than 4 times the 2018 World GDP. So either way nuclear power can not function as a planetary power source in our current monetary system.

          • Perfecto says:

            $35 Billion x 22000 = $770 Trillion, which is about 10 times $80 Trillion, not 1000 times. Two orders of magnitude make a difference. Or would you by a loaf of bread for $250?

            As for my estimate, it would be conceivable to spend four years of GDP over many decades. And economies of scale will reduce the cost. Supposedly, China has built their two Taishan plants for a total of $7.5 Billion. At that rate, they can build 22000 nuclear plants for $82.5 Trillion.

  7. Midas says:

    Here is a graph of the running UAH average for “the last 60 months”:
    https://tinyurl.com/Last-60-months

    For those who claim it was all due to the super El Nino, here is the graph after replacing all months from Oct 2015 to Nov 2016 with the trend value for Sep 2016:
    https://tinyurl.com/Last-60-months-no-El-Nino

    • Midas says:

      That should say “with the trend value for Sep 2015”.

    • argus says:

      Unless you’re saying the super El Nino had no effect, or we’re now in a runaway scenario, this doesn’t make sense.

      • Midas says:

        So it makes no sense to knock out the El Nino to show deniers that we don’t need to include it to get the current warming?

        • Stephen P Anderson says:

          Another leftist traitor spouting off.

          • Svante says:

            Midas, you need to shift your numbers further to the right.

          • Midas says:

            Svante
            Hahaha – well said. Still wondering why presenting UAH data qualifies me as a ‘traitor’ and which group I am supposed to be showing allegiance to but am instead betraying.

          • David Appell says:

            Stephen P Anderson says:
            Another leftist traitor spouting off.

            Stephen P Anderson thinks writing stupid things like this matter in some way or another.

            We smart people see right through him.

            Just laugh at him, folks.

          • Dr Roys Emergency Moderation Team says:

            Svante, BobdesbonddesMidas, David, please stop trolling.

  8. ghalfrunt says:

    The Hinkley Point nuclear site, on the Somerset coast, should have begun powering around 6m homes well over a year ago.
    Instead, the 160-hectare (400-acre) sprawl is still the UKs largest construction site more than a decade after the plan for Britains nuclear renaissance first emerged.
    It will be at least another six years before Hinkley Point C, the first nuclear plant to be built in the UK since 1995, begins generating 7% of the nations electricity.
    The price tag is expected to exceed 20bn, almost double that suggested in 2008 by EDF Energy, which is spearheading the project alongside a Chinese project partner….

    The National Audit Office condemned the governments deal to support the Hinkley Point project through consumer energy bills in a damning report, which accused ministers of putting households on the hook for a risky and expensive project with uncertain strategic and economic benefits.
    Hinkley Point will add between 10 and 15 a year to the average energy bill for 35 years, making it one of the most expensive energy projects undertaken.
    Under EDF Energys contract with the government, the French state-backed energy giant will earn at least 92.50 for every megawatt-hour produced at Hinkley Point for 35 years by charging households an extra levy on top of the market price for power.
    The average electricity price on the UKs wholesale electricity market was between 55 and 65 per megawatt-hour last year.

    https://www.theguardian.com/uk-news/2019/aug/13/hinkley-point-c-rising-costs-long-delays-power-station

    • FandDeLego says:

      I am not quite sure what is your point here. Anyway, the delays of Flamanville, Olkiluoto and Hinkley are largely due to political and insane regulatory hurdles. Both due to accidents that happened to power plants conceived in the 50s (Fukushima was one of the oldest designs in existence). Meanwhile, both EPR in China (Taishan 1 and 2) are in commercial operation.

      One part of the solution is nuclear Fusion. But it is of course something that is still decades in the future. And that is the crux of the issue. Both the problem (warming due to fossil fuels) and solutions require thinking and planning that are utterly out of sync with politics and everyone time horizon (although I am following eagerly the development of ITER, I know that I will be dead before commercial operation of the first nuclear fusion reactor, if everyone is not back to isolated small countries powered on wood stoves by then)

      • Bindidon says:

        FandDeLego

        “Anyway, the delays of Flamanville, Olkiluoto and Hinkley are largely due to political and insane regulatory hurdles.”

        Sorry, but as far as Flamanville is concerned, this is absolutely wrong.
        Many defective welds in central, very sensitive areas have been detected.

        These problems were known since years by EDF, the company responsible for the site’s construction. They tried to silently pass over, that is absolutely irresponsible.

        And if anything would happen due to that, all people who complain about too much security suddenly and shamelessly return their jackets.

      • Bindidon says:

        FandDeLego

        “One part of the solution is nuclear Fusion.”

        In theory: YES YES YES!

        But in practice, fusion is bound to pairs having good cross-sectional properties, and that actually solely holds for D+T.

        This is a bad boy:
        – tritium doesn’t exist in nature, and therefore must be bred in blankets around the reactor’s kernel (100 ton lithium, 300 ton beryllium, 800 ton steel structure);
        – this element is as volatile as carcinogenic, nobody really knows how to safely store it, as it bypasses even some steels;
        – D+T generates nearly all its energy via few, agressive neutrons with about 14 MeV (that’s the reason why you need beryllium in the blankets as neutron replicator).

        The German scientists responsible for the pre-engineering of ITER’s successor DEMO have predicted years ago that soch a reactor would produce 60 Mio. tons of waste in a 30-year lietime.

        Jesus! That’s even worse than Superphénix or any other 4G guy.

        • Bindidon says:

          Apos for the mistake:

          “… that soch a reactor would produce 60 thousand tons of waste in a 30-year lietime.”

          • Stephen P Anderson says:

            Actually 2000 tons of waste per year isn’t miniscule from an engineering standpoint. That’s nothing.

          • Stephen P Anderson says:

            Sorrty, is miniscule.

          • Lou Maytrees says:

            Stephen P Anderson,
            So you won’t mind all that ‘miniscule’ amount of atomic waste transported to your city and dumped in your backyard eh?

          • Bart says:

            As long as you’ll accept all the mine tailings for windmills and silicon tetrachloride from solar cells for comparable power generation in yours.

            And, dead birds from the windmills. Lots and lots of dead birds.

            Here’s a clue: it wouldn’t even nearly fit in your back yard, unless you have a rather significant ranch out in Wyoming.

          • Stephen P Anderson says:

            Lou, no I’d rather continue to burn fossil fuels since they are only about 4% of CO2 emission and have no apparent affect on temperature.

          • Lou Maytrees says:

            Bart, here’s a clue.
            a) Nuclear power plants take up huge acreages also.

            b) Nuclear stacks DWARF wind towers.

            c) Your bird claims are untrue and have been debunked over and over and over again.

            d) Stephen made a claim that nuclear waste is miniscule from an ‘engineering standpoint’ so I asked him a question on it that he sidestepped.

          • Bart says:

            “a) Nuclear power plants take up huge acreages also.”

            Not even close on an erg to erg basis.

            “b) Nuclear stacks DWARF wind towers.”

            Two or three cooling towers vs. a forest of windmills.

            “c) Your bird claims are untrue and have been debunked over and over and over again.”

            Aren’t and haven’t.

            “d) Stephen made a claim that nuclear waste is miniscule from an ‘engineering standpoint’ so I asked him a question on it that he sidestepped.”

            It actually is pretty miniscule.

            All of the used fuel ever produced by the commercial nuclear industry since the late 1950s would cover a football field to a depth of less than 10 yards. That might seem like a lot, but coal plants generate that same amount of waste every hour.

          • Lou Maytrees says:

            Bart,
            ahahaha, now you change it to ‘on an erg to erg basis’.

            The article ghalfrunt posted states Hinckley C is a 400 acre site,
            well over 17 million square feet, mostly paved. That also does not include the huge amounts of water nuclear uses. Your point is moot.

            The world bird population is estimated at 23 billion. Towers don’t kill ‘lots and lots of birds’. A lot means to a large extent. Wind towers kill a miniscule (there’s that word again) amount in reality, but not a large extent, not lots and lots as you claim.
            There are approx. 400,000 wind turbines worldwide which means on average well less than 1 bird per wind turbine per year is killed by them. Lots and lots? Uh no.

            And comparing apples to oranges does not apply here. Your nuclear quote applies to size of waste, and does not include the large measures and wares necessary to wrap that amount of waste up to try and contain it from not contaminating the planet. Nuclear radiation is a much different ball game than coal waste, perhaps you’re not aware.

            So you wouldn’t mind a 100 yard field 30 feet high of 10,000 year half life nuclear radiation in your back yard either then?

          • fonzie says:

            Yeah, and besides, Bart, we’re killing off all the birds at the low end of the bell curve. (i mean, what kind of a dumb bird flies into a wind turbine anyway?) At the end of the day, we’ll end up with lots and lots of smart birds

          • David Appell says:

            Bart says:
            And, dead birds from the windmills. Lots and lots of dead birds.

            How many (per GWh)?

            How many are killed by fossil fuel power plants?

            How many are killed by cats?

            Buildings?

            Cars?

          • bdgwx says:

            SPA said: “Lou, no Id rather continue to burn fossil fuels since they are only about 4% of CO2 emission and have no apparent affect on temperature.”

            We’ve already been over this. While anthroprogenic emissions are 4% of the total emissions they are still responsible for nearly 100% of the increase. And we know that 2xCO2 yields a radiative forcing of around +3.7 W/m^2. Positive radiative forcings result in increasing temperature until a new equilibrium is established.

          • fonzie says:

            While anthroprogenic emissions are 4% of the total emissions they are still responsible for nearly 100% of the increase.

            Think again:

            http://www.woodfortrees.org/plot/esrl-co2/from:1958/mean:12/derivative/plot/hadsst3sh/from:1850/scale:0.25/offset:0.1/integral/plot/esrl-co2/from:1958/mean:12/derivative/trend/plot/hadsst3sh/from:1958/scale:0.25/offset:0.1/trend

            Ice cores tell us that CO2 was 287ppm in 1850. Add to that the 125+ppm that you see in this graph and you get 412+ ppm. Not bad for a calculation from temperatures extrapolated back one hundred years before the advent of atmospheric measurements. (actually my scale is a tad off and it should be 412ppm on the nose; remove the integral feature on the temperature series to see how i made my graph) An unprecedented rise in atmospheric CO2 concentrations can be just as readily explained by a combination of deforestation and a relatively rapid rise in temperature. It cannot be explained by human emissions which only amount to 5% of total emissions unless anthropogenic flows are treated differently than natural flows. If naturally sourced CO2 sinks at a rate of near 100%, then so also does anthroprogenically sourced CO2. This is easily comprehended when we realize that anthro CO2 has always been a paltry addition to that of natural sources…

          • bdgwx says:

            fonzie: “An unprecedented rise in atmospheric CO2 concentrations can be just as readily explained by a combination of deforestation and a relatively rapid rise in temperature.”

            No it can’t. The following…

            – 14C ratios (at least until the bomb spike)
            – 13C-to-12C ratios
            – O2 ratios
            – pH and alkalinity of ocean
            – mass accounting
            – timing

            …provide the consilience of evidence that point to a single cause…anthroprogenic release. Any one of these by themselves would be convincing and we have several of these lines of evidence.

            fonzie: “It cannot be explained by human emissions which only amount to 5% of total emissions unless anthropogenic flows are treated differently than natural flows.”

            All of our observations (like those above) are consistent with anthroprogenic release. Natural-mostly release is inconsistent with many of them. And a 5% increase in emissions integrated over time adds up quickly. It is the anthroprogenic pulse that took us from a somewhat balanced state to a very unbalanced state. And anthroprogenic emissions ARE treated differently than natural emissions because natural processes do not modulate the human emission rate like they would for the natural emission rate.

            fonzie: “If naturally sourced CO2 sinks at a rate of near 100%, then so also does anthroprogenically sourced CO2.”

            No. That’s not correct. This particular pulse of CO2 is rapid. The buffer capacity of the biosphere and hydrosphere simply cannot scrub it out at the same rate that it is being released. The same effect occurred during the PETM and other ETMx eras. The glacial cycles are also consistent with the differing time scales for pulse and depletion.

          • Bart says:

            Lou Maytrees –

            You aren’t even close.

            https://www.nei.org/news/2015/land-needs-for-wind-solar-dwarf-nuclear-plants

            ”Wind farms require up to 360 times as much land area to produce the same amount of electricity as a nuclear energy facility, a Nuclear Energy Institute analysis has found. Solar photovoltaic (PV) facilities require up to 75 times the land area.”

            ”The world bird population is estimated at 23 billion.”

            Different birds. The windmills kill the slowly reproducing and generally endangered carrion fowl and soaring raptors of the sky. We sentenced millions of Sub-Saharan Africans to death by malaria when we banned DDT, on account that it might possibly thin the eggshells of these creatures. Now it’s, “To hell with the birds! Oil is icky!”

            ”Nuclear radiation is a much different ball game than coal waste, perhaps you’re not aware.”

            Yes, coal waste is more difficult to dispose of.

          • Bart says:

            bdgwx

            14C ratios (at least until the bomb spike) – poor quality measurements before the bomb spike
            13C-to-12C ratios – assumes comprehensive knowledge of sources and sinks, as well as diffusion dynamics
            O2 ratios – model based, more assumptions regarding sources and sinks
            pH and alkalinity of ocean – tautology
            mass accounting – ridiculous
            timing – 50/50 coin toss

            None of these are dispositive. But, we can be assured that this is no coincidence – it matches in too many nooks and crannies. Odds of that happening by chance – virtually nil.

            http://woodfortrees.org/plot/esrl-co2/mean:12/from:1979/derivative/plot/uah6/scale:0.18/offset:0.144

          • Bindidon says:

            Stephen P Anderson

            I’m not talking about simple waste, here, Stephen.

            I’m talking about highly contaminated nuclear waste, which above all keeps over decades so incredibly hot that you can’t process it.

            It’s even nothing like these classical burned uranium fuel rods: they can be reprocessed after 6 years of cooling.

            It’s also nothing like burned MOX rods, which contain 8 % plutonium, and need 60 years of cooling before reprocessing.

            Tritium breeding blankets would need 500 years before reprocessing. In other words, they will never be.

          • David Appell says:

            Stephen P Anderson says:
            Actually 2000 tons of waste per year isnt miniscule from an engineering standpoint. Thats nothing.

            It is when its toxicity lasts tens of thousands of years.

          • David Appell says:

            Bart says:
            pH and alkalinity of ocean tautology

            The acidity of the ocean has increased by about 30% so far.

            How much more are you up for?

          • David Appell says:

            Bart, don’t ignore me.

            You said::
            And, dead birds from the windmills. Lots and lots of dead birds.

            How many (per GWh)?

            How many are killed by fossil fuel power plants?
            Nuclear plants?

            How many are killed by cats?

            Buildings?

            Cars?

          • fonzie says:

            None of these are dispositive. But, we can be assured that this is no coincidence it matches in too many nooks and crannies. Odds of that happening by chance virtually nil.

            Bart, you’ve got a mere 40 years of data there and odds are, as you say, virtually nil. My graph has 170 years. That would be virtually nil to the nth degree(!) Gives folks a choice. Either they can denounce ice cores or they can accept that temperature drives the atmospheric CO2 growth rate. (or, of course, the third choice — denial)…

          • fonzie says:

            bdgwx, timing is inconsistent with an anthropogenically sourced rise. CO2 concentrations rose 20ppm from 1750 to 1900. Cumulative emissions were a mere 5ppm by 1900. Whatever we were doing from 1750 to 1900 to cause that rise, you can rest assured that we’ve done a whole lot more of it from 1900 to present. Land usage could easily account for half of the total rise (or more) on the basis of that alone. Timing, on the other hand, is perfectly accounted for by a naturally sourced rise. (just look at my graph)…

          • David Appell says:

            fonzie says:
            Cumulative emissions were a mere 5ppm by 1900.

            Nope.

            CO2 rose from 180 to about 240 ppm by the industrial era.

            That was enough to eliminate the next ice age.

            Since then it’s risen further to, now, 410 ppmv.

          • bdgwx says:

            fonzie, no one is denouncing the ice core data. Afterall, it is the ice core data (among other proxies) that tell us that CO2 concentration was very stable for most of the holocene and was even locked into a relatively narrow range during most of the Quaternary period which we’ve blown past by a wide margin. For this pulse of CO2 to have occurred naturally the chances are inconceivable small that it would be timing perfectly with anthroprogenic release. And with all of the other lines of evidence considered you’d be hard pressed to find a spot for another nail in this coffin.

          • Stephen P Anderson says:

            BGDWX,
            What are you talking about? There is no “pulse” of CO2. It is a figment of your immagination. Please explain this “pulse” of CO2. One year CO2 emission is 97.1ppm and then next year it is 97.6ppm. CO2 flows through the atmosphere with a very short residence time. There is no pulse.

          • Bart says:

            David Appell –

            “How much more are you up for?”

            It’s tautological. CO2 has increased. It necessarily increases both in upper oceans and atmosphere (Henry’s law). Says nothing about the source.

            fonzie –

            Not only that, but CO2 rise has been essentially linear since the turn of the century, coincident with the “pause” in temperature rise, while emissions have continued accelerating. Concentration does not track emissions. It tracks the temperature anomaly integral.

          • Bart says:

            David Appell –

            “How many are killed by cats?

            Buildings?

            Cars?”

            Again, different birds. Small, rapidly reproducing species are not in existential danger.

          • Bart says:

            David Appell –

            “The acidity of the ocean has increased by about 30% so far.”

            Ah, the old shell game. Ph has possibly dropped from about 8.25 to 8.14, which is 1.3%. You’ll try to brazen it out by saying Ph is logarithmic, but so is reduction potential, so you haven’t a leg to stand on.

            And, 8.14 is not acidic in any way, shape, or form.

          • bdgwx says:

            SPA: “What are you talking about? There is no pulse of CO2. It is a figment of your immagination.”

            The 2000 GtCO2 that humans injected into the carbon cycle is a figment of my imagination?

            SPA: “CO2 flows through the atmosphere with a very short residence time.”

            Yes…on an individual molecule basis. This is due to the exchange or turnover that occurs as a result of the large natural ingress and egress flows. Everyone agrees with that. The mistake you’re making is conflating the residence time of individual molecules with the depletion time for a pulsed mass. These are two different concepts with different time scales. A “anthroprogenic” molecule can get exchanged for a “natural” molecule relatively quickly, but the increase in mass caused by that “anthroprogenic” molecule lingers for a much longer period of time.

          • bdgwx says:

            SPA: “What are you talking about? There is no “pulse” of CO2. It is a figment of your immagination.”

            The 2000 GtCO2 that humans injected into the carbon cycle is a figment of my imagination?

            SPA: “CO2 flows through the atmosphere with a very short residence time.”

            Yes…on an individual molecule basis. This is due to the exchange or turnover that occurs as a result of the large natural ingress and egress flows. Everyone agrees with that. The mistake you’re making is conflating the residence time of individual molecules with the depletion time for a pulsed mass. These are two different concepts with different time scales.

          • fonzie says:

            For this pulse of CO2 to have occurred naturally the chances are inconceivable small that it would be timing perfectly with anthroprogenic release.

            bdgwx, not suggesting that it did occur naturally. If ice cores are true, then obviously the rise is, in all likelihood, anthropogenic in origin. But, an anthropogenic rise could still be naturally sourced (as in land usage). AND, i made that clear in my commentary. The only legitimate claim that we have that emissions have driven carbon growth are ancient atmospheric concentrations. That’s not good enough. Anomalous warming + deforestation could just as readily account for the rise. (especially so if the anomalous warming is caused by the rise) The match of the temperature integral back to 1850 with that of ice cores + mlo virtually proves it. AND, once again, the timing is far from perfect with anthropogenic release. The mid nineteenth century saw a rise in CO2 at a rate that was 10X that of human emissions. (we’ve been cutting down trees for a lot longer time than we’ve been burning fossil fuels)…

          • Bart says:

            “A anthroprogenic molecule can get exchanged for a natural molecule relatively quickly, but the increase in mass caused by that anthroprogenic molecule lingers for a much longer period of time.”

            This is not established. It implicitly assumes sink action is weak, and treats anthropogenic and natural emissions on an uneven playing field.

          • fonzie says:

            David Appell says:
            October 2, 2019 at 7:22 PM
            fonzie says:
            Cumulative emissions were a mere 5ppm by 1900.

            Nope.

            CO2 rose from 180 to about 240 ppm by the industrial era.

            That was enough to eliminate the next ice age.

            Since then its risen further to, now, 410 ppmv.

            DA, what i meant was that cumulative emissions from 1750 were 5ppm by the year 1900. (this was the time period that i was referring to)…

          • fonzie says:

            fonzie

            Not only that, but CO2 rise has been essentially linear since the turn of the century

            Bart, puh-lease use turn of the millennium instead (you wouldn’t want to confuse a fifties era sitcom character… 👍)

        • FanDeLego says:

          – tritium doesn’t exist in nature, and therefore must be bred in blankets around the reactor’s kernel (100 ton lithium, 300 ton beryllium, 800 ton steel structure);

          It is true that it does not exist in nature, but producing it is not that difficult. Hence the fact that it has been available widely since the middle of XXth century.

          – this element is as volatile as carcinogenic, nobody really knows how to safely store it, as it bypasses even some steels;

          What are you babbling about? Tritium radioactivity is one of the least carcinogenic of any radioactive compounds used daily in technology and science. I have used tritium for years. One of our silly games a few years ago was to drink tritium to scare undergraduate students. Tritium might be volatile, but its radiation dies less than a millimeter from the emission, hence the difficulty to use it. The only really good use we had for it was imaging, where we would put photographic emulsion on direct contact with the emission.

          Oh my. I am reacting to a troll now. Sorry.

    • Lou Maytrees says:

      ghalfrunt,
      just an update to your post.

      The EDF has recently requested an additional 3 Billion Pounds upping the cost now to 23 Billion pounds equivalent to $28 Billion US.

      Also some estimates are that it will cost close to $50 Billion US on completion 6 years from now.

  9. Nate says:

    If u want nuclear, gotta figure out how to build and operate them much more cheaply then now. And figure out where to safely store the waste.

    • coturnix says:

      Why don’t you people just admit that we are doomed, climate-wise speaking? There is no viable alternative to fossil fuels, and if global warming really is going to kill us, then there is no point to waste precious resources on fighting inevitable. Just relax, embrace the climate change and enjoy it. Become a climate change embracer!

      • fonzie says:

        Because our new found obssession with our energy supply is actually a good thing for humanity. The last thing that we want to do is take our eyes off the energy ball (now that we have our eyes on it). One way or another, humanity is facing an energy crisis and the idea is to, well, embrace that crisis. Energy is the life blood of modern society and it’s high time that we recognize it as such. Energy Independence is a concept that predates the climate crisis, going way back to the oil embargo. Hopefully all this hub-bub about global warming will keep our eyes fixated on energy. Because humanity is going to need a lot more of it heading into the future. (and it won’t hurt to go full bore on energy efficiency as well)…

        • coturnix says:

          Don’t twist my words, i didn’t say to embrace crisis, i said to emrace global warming which is not an *energy* crisis. Quite the opposite, energy crisis would happen if we try fight it.

          • fonzie says:

            Weren’t twisting your words, merely making a play on ’em.

            My point is that humanity has an energy crisis even without global warming. Fossil fuels are finite which is why we will eventually need renewables (meaning ‘not finite’) anyhow. And we sure don’t want to wait until we run smack into that energy crisis flat footed. If we do that, then we’ll see the same thing that we saw under the Carter economy with things getting progressively worse thereafter (because there won’t necessarily be any ready solutions). Energy Security will be good for economics now and, hopefully, will be good for economics heading into the future…

      • Scott R says:

        coturnix,

        There is actually a very good chance that CO2 is increasing our crop yields and having a greening effect. We also see MOST of the warming limited to areas that are so cold, almost nothing grows there, and very limited warming in the tropics. Basically, the energy distribution on the earth is actually getting better in some ways as we create more habitats that humans can sustain in. Cold kills more than heat. Even if the AGW crowd is right that the co2 caused the warming (and it wasn’t a natural cycle like I believe), they have not proven co2 is doing harm to the environment, or causing more storms.

        • Bart says:

          It was always a ridiculous talking point to generate panic. The theory says temperature gradients would be reduced. Temperature gradients are what powers storms.

        • coturnix says:

          >>We also see MOST of the warming limited to areas that are so cold,

          I’m not sure that’s what climate models predict, nor what we see. Europe has warmed so much that it is even noticeable by an average person, and it is very warm for its latitude already. While the typical regional warming maps do show significant warming in some very cold places such as NE siberia and alaska, they also show lots of warming over tropical and subtropical deserts where it is already damn hot, as well as not showing much warming over eastern canada where it would be needed the most to stop the impending reglaciation.

          • Scott R says:

            coturnix,

            True… but I actually don’t believe Co2 is the #1 forcer here. I was just having conversation as a mental exercise. I’m looking at AMO and PDO cycles (which are natural) and how weather patterns are changed due to that. ENSO, AMO, PDO are responsible for almost everything we see. There are very little slices of pie left for everything else.

        • Nate says:

          “Cold kills more than heat.”

          This is a talking point, but is it true?

          Europeans generally don’t have AC. Same goes for most of South Asia.

          But I think they have had heat sources for a few millenia.

          • David Appell says:

            I just saw this story today:

            “Revealed: hundreds of migrant workers dying of heat stress in Qatar each year,” The Guardian 10/2/19
            https://www.theguardian.com/global-development/2019/oct/02/revealed-hundreds-of-migrant-workers-dying-of-heat-stress-in-qatar-each-year

            The point is coming (if it’s not already here) where outdoor workers in the tropics will be unable to function at the height of the day.

            It’s easier to get warm than to cool down, especially if you work outdoors.

          • David Appell says:

            PS: Again, 3B people live in the tropics. 4+B outside them (many of them in wealthy countries that can afford to heat and cool as they so desire).

          • gbaikie says:

            Something like…

            noun
            an afternoon rest or nap, especially one taken during the hottest hours of the day in a hot climate.
            “everyone had a siesta for a few hours”

          • Bart says:

            David – let me get this straight. You think drastically lowering our generation of CO2 is going to cool down Qatar?

          • Scott R says:

            Nate,

            There was a study done for the US showing the death rate is higher in the winter then the summer. It is therefore reasonable to assume that cold kills more than heat. There is absolutely no evidence that people in the tropics are decreasing their life expectancy due to climate change. As a whole, life expectancy has increased everywhere. (a good thing)

          • Nate says:

            “There was a study”

            Oh was there?

            And you think the US is representative of the world?

  10. Midas says:

    To show how meaningless it is to look at monthly rises and falls:
    There have been 235 falls with an average drop of 0.10038.
    There have been 240 rises with an average rise of 0.10233.
    There have been 14 months with no change from the previous month.
    The average rise is virtually indistinguishable from the average fall.
    It is the accumulation of those tiny differences over 40 years that gives us an obvious warming trend.

  11. Bindidon says:

    Again and again the same claim:

    “This data point does not do anything to change the fact that since 2016 we are still cooling.”

    This is complete nonsense.

    Everybody having a brain should be able to understand that when we compute a trend estimate for a time series starting with a very high value and ending with lower ones, the trend can only be negative.

    Thus, a UAH6.0 LT trend check with Jan 2016 as start automatically leads to an estimate of -0.60 C / decade.

    But… doing the check by starting with Jan 2017 gives us… +0.16 C / decade.

    Is that so difficult to understand?

    *
    One more time, I invite all commenters to compare the situation around the 2015/6 El Nino with that around the 1997/8 El Nino.

    The best way to do this is
    – (1) to start one year before the respective ENSO peak, and to end it now, resp. 57 months after Jan 1997,
    and
    (2) to compare the anomalies not wrt 1981-2010, but wrt the respective period’s begin, btw eliminating the level difference between the two periods.

    This is easy to do, by subtracting the respective start anomaly from all anomalies in the two periods. Each anomaly sequence then starts with 0.

    Here is the graph:

    https://drive.google.com/file/d/1y1zmzMt_1gD5jxCOH13UVYvbocYulbNz/view

    As everybody can see, there is no cooling at all when comparing the two ENSO events this way. The two time subseries behave amazingly similar.

    You see also that, when eliminating the anomaly difference between 1997/8 and 2015/6 (0.45 C), UAH’s reaction to 1997/98 is a lot stronger than that to 2015/16.

    This perfectly corresponds to the MEI index (regardless wether you choose V2 or the older series).

    MEI should be preferred over ONI, because in addition to a 6 month running average over Nino3+4 (5N-5S — 170W-120W), it integrates the pressure difference averages between Darwin and Tahiti.

    • Scott R says:

      Bindidon,

      #1. Can you admit that there is a cyclical AMO pattern?

      #2. Can you admit that there is a cyclical PDO pattern?

      #3. Can you admit that there is a cyclical ENSO pattern?

      Now… 2016 you were centered right between the 2012 AMO peak, and it turns out the 2019 PDO peak. Couple that with a super ENSO. Couple that with the modern solar maximum that had the 7 strongest solar cycles of the last 400 years. This is why 2016 is significant to me. Multiple time frame analysis tells me so.

      You keep assigning all these linear trends to data that is not linear. If you were in the auto industry, you would have to give a presentation about your failures. If you want to impress me… include the cycles in your analysis, and separate out the linear forcer for CO2.

      • Midas says:

        What do you think long-term averages are for?

        • Scott R says:

          Midas,

          The long term average of a cyclical dataset produces no useful information. It is possible that along with the cyclical forcers, there could be a linear forcer, but due to the fact that you have multiple time frames of cyclical data, it is very difficult to pull that signal out of the data. I am actually working on that right now.

      • Bindidon says:

        Scott R

        I started posting about climate on web sites around 2007.

        How many cyclomaniacs did I unfortunately have to experience, Scott R?

        You are just trying to reinvent an ancient, worn-out wheel, like so many people do.

        How boring.

        • Scott R says:

          Bindidon,

          Using the data to build models is standard practice in engineering. Climate should be no different.

          Why would the earth move from a cyclic system to a linear one (or exponential hockey stick) just because we showed up and increased CO2 from 0.03% to 0.04% of the atmosphere? Do you realize how incredibly stupid that sounds? I am open to the idea that CO2 contributes something, but how can you expect me to believe that the AMO and PDO cycles will never occur again and that all the temperature change since 1980 was due to co2 / man made gasses? I can not believe what passes for science around here, and the number of people that have no clue about cycles. Or maybe they do, but they refuse to admit it, leaving it to “the experts”.

        • bdgwx says:

          ScottR,

          The AMO, PDO, and other cycles do not directly create radiative imbalances on the planet.

          CO2, on the other hand, does create a direct radiative imbalance on the geosphere via its thermal barrier behavior. The doubling of CO2 yields approximately +3.7 W/m^2 of force at the surface.

          We all understand that there are natural cycles. And none of us are saying that they will go away. That’s not the issue.

          • Scott R says:

            bdgwx, sadly… many are not as open minded as what you just said. I was just lectured on this thread how AMO isn’t going to happen anymore, and the AMO cycle that took us down to the 1980 low is a thing of the past that will not happen anymore. While AMO PDO should not be impacting our radiative imbalance, they do impact our point in time measurement of many different things. Atmospheric temperature and ocean surface most critically. If we do not understand the cycles that MOVE energy throughout the earth system on multiple timeframes, we are not going to be able to properly calculate the man made forcers and feedbacks.

  12. Pft says:

    So the average monthly global anomaly in 2019 is 0.41 deg C while on the USA 48 its 0.08 deg C. Doesn’t seem that worrying to me.

    Can anyone explain why the USA 48 numbers are so unstable, especially this year, anomalies bouncing up and down like a yoyo, at least compared to other regions?

    • Midas says:

      The difference between highest and lowest monthly anomaly this year for the US is the 7th lowest in the 41 year record. You are seeing something that isn’t there.

    • Bindidon says:

      Pft

      Looks amazing indeed, the only region with more extreme deviations is the land area below 60S.

      Not less surprising is that adding Alaska to CONUS lets the max-min deviation difference go down from 5.6 to 4.2 C.

    • Scott R says:

      Pft in order to get USA to swing like that, you only need a heat ridge or dip of the polar vortex. Which one mostly depends on where we have high pressures situated out on the oceans. The jet stream goes around them and swings back and forth. This is a completely normal short term weather phenomenon. Nothing to worry about.

    • barry says:

      “So the average monthly global anomaly in 2019 is 0.41 deg C while on the USA 48 its 0.08 deg C. Doesnt seem that worrying to me.”

      I’m trying to figure out what you mean here, and all I can come up with is that you are probably an American and are not clear on the difference between weather and climate.

      Here’s another comparison based on UAH6.0 data.

      Global trend = 0.13 C/decade
      USA trend = 0.17 C/decade

    • Dr Roys Emergency Moderation Team says:

      barry, please stop trolling.

  13. Armando Pez says:

    Can this temperature increase be explained by a wavy polar vortex and a weak jet stream –more warm air from the south?
    https://www.noaa.gov/multimedia/infographic/science-behind-polar-vortex

  14. Armando Paez says:

    Can this temperature increase be explained by a wavy polar vortex and a weak jet stream more warm air from the south?
    https://www.noaa.gov/multimedia/infographic/science-behind-polar-vortex

  15. Cloudbase says:

    Hi Roy. Thanks for the update. Any chance you could add global oceans to your monthly departures chart. This atmospheric uptick is completely at odds to what I expected to see after watching the CDAS plots ever day. They have shown a 0.1C decline of sea surface temps over the last few months….from +0.3 to +0.2

  16. DocSiders says:

    David Appel…trying to respond to your response…but this blog software is sending this to the end of comments for some reason.
    _______________________

    Except Pielke is wrong…1 New Nuclear plant per day doesn’t provide for the new goal of Zero Carbon by 2050.

    It will require 2.2 New Nuclear plants every day…not just 1.

    So as shocking as Pielke’s report was….IT WASN’T SHOCKING ENOUGH BY HALF.

  17. The September 2019 CFSR/CDAS global mean surface temperature anomaly referenced to 1981-2010 was 0.314C compared to 0.302C for August 2019 and was the highest September since 0.383C in September 2016. That’s a rise of only 0.012C from August and I suspect that most of the surface temperature indices will show similar small changes from August.

    Graphs here:
    https://oz4caster.wordpress.com/monthly-trends/

  18. David says:

    Would you please be so kind as to advise me.During discussions the following issue arose and I seek clarification in relation to the same. From the textbook “The Earth System” by Lee R kump at Chapter 3, How the Greenhouse Effect Works it states: “Let the amount of sunlight striking the planet be equal to S/4 (The global average solar flux). The surface absorbs an amount of sunlight equal to S/4 X (1 – A)” I understand that this is where the greenhouse effect was introduced and how to derive it, I further understand that this is the starting point model from which climate science derives everything else and from which everything else is interpreted – I understand that S/4 is the incoming sunlight spread over the entire area of the earth at once and that the average of this is taken as earths temperature which I understand to be -18. My question where I seek clarification is, is this correct?

    • TheFinalNail says:

      David,

      I think your equation is an expression of the solar component of the Stefan-Boltzmann law. The 1 refers to emissivity, with 1 being perfect emissivity minus A (for albedo, or reflectivity). That’s normally estimated to be 1 – 0.3 = 0.7. Crunching the rest of the numbers gives a figure of -18C average surface temperature for earth.

      The greenhouse effect accounts for the observed difference between the expected (-18C) and observed global surface temperature (+15C), though it’s fair to say that some here dispute that (but not the host).

      TFN

      • David says:

        It seems somewhat strange to take the incoming sunlight then spread it over the entire area of the earth at once, this would dilute it. We have day and night and only one side of the earth receives sunlight, the other is in darkness so i leads to confusion when the calculations are based on taking sunlight/energy – diluting it by spreading it around the entire planet, and this isn’t how climate works, it’s a fabrication, we have warmer areas of Earth that receive increased sunlight in comparison to other ares that create tropical climates, it appears to me no consideration is given to thermodynamics either. The Greenhouse effect, we are to believe, creates it’s own climate but of course it is an impossibility. Real scientists have documented very well that doubling the level of CO2 will. at most, result in a 0.5C temperature increase.The IPCC have never considered any report from any Solar Physicists, it appears that climatologists give no consideration to the effects of the Sun which drives Earth’s climate, after all we still get four seasons and CO2 doesn’t drive those! And as for the modelling of climate change it must be remembered by the alarmists that : The IPCC in its third report (2001)

        “In climate research and modelling, we should recognize that we are dealing with a coupled non-linear chaotic system, and therefore that the long-term prediction of future climate states is not possible.”

        (Chapter 14, Section 14.2.2.2. )

  19. David Appell says:

    There doesn’t seem to be an end to the mathematical games you’ll play to avoid the obvious.

  20. Chris says:

    I checked into these numbers. When double CO2, yields can go up 60-130% and the plants have more biomass overall, but the density of nutrients changes. Some crops produce less protein per ounce and more carbohydrates, but the difference is only up to 14%. In other words, net biomass does increase and net nutrients produced increases, but the macronutrient profile shifts. That’s not a bad tradeoff. And soy beans, which are probably the dominant form of plant protein in modern nutrition, are only impacted by about 1.5%.

    https://onlinelibrary.wiley.com/doi/full/10.1111/j.1365-2486.2007.01511.x

    https://academic.oup.com/treephys/article-abstract/14/7-8-9/707/1727792

  21. Dr. Mark H. Shapiro says:

    Looks like the “Chinese hoax” argument is dead.

    • Midas says:

      Why don’t you ask these questions when UAH is cool?

    • E. Swanson says:

      ren, Your graphs are for “Zonal Mean [-90, -60]”, which is the Antarctic polar region. The Antarctic is entering Austral Spring, which historically produced the Stratospheric Ozone Hole. Recall that Ozone is a GHG. As the Ozone Hole may now be diminished with reduced CFC emissions, one might expect to see a Stratospheric warming appear compared with the relatively short period of record.

      That said, the MSU/AMSU data may be useless over the Antarctic due to the high elevations of the continent. RSS makes a point of excluding everything poleward of -70S in their TLT. The CPC data may include the MSU/AMSU data in the calculation, though not the UAH TLT.

    • MikeR says:

      Yes Ren, it does appear that the unusually intense warming of the stratosphere in the Antarctic region is affecting the satellite data.

      The September anomaly for UAH statosphere is +13.65C , which is the largest positive anomaly ever recorded, is accompanied by the largest ever negative anomaly -2.67C for the stratosphere in the tropics! Interestingly the RSS stratospheric data shows exactly the same behaviour. For TLS the anomaly +13.47C for the South polar regions -2.64C for the tropics. These are also the largest anomalies recorded for the RSS data sets.

      The same behaviour is exhibited for the previous records for both UAH and RSS (for September 2002). There appears to be a relationship between the stratospheric South Polar record heat waves and unusually cold temperatures for the tropics.

      On this basis I think Roy Spencer should stop worrying unduly about his September data – see his above comment “the tropical LS (lower stratospheric temperature) is at a record low in the tropics, a result which I do not believe”. I think it is entirely believable.

  22. Entropic man says:

    there was discussion of significant trends above.

    Dr Spencer quotes 95% confidence limits for his monthly temperatures of +/- 0.1C.

    This is due to the normal internal variability of the climate and typical of temperature datasets generally.

    A difference between two dates becomes statistically significant when their 95% confidence limits no longer overlap. That is a temperature difference of 0.2C.

    The current linear regression trend for the whole UAH record is 0.13C/decade. The minimum period over which you might reasonably expect to see a significant trend is therefore 0.2/0.13=1.53 decades. 15 years.

    Any discussion of trends over less than 15 years is therefore meaningless, because the trend is lost in the noise. In practice, the longer the time period the better.

  23. gbaikie says:

    –The linear warming trend since January, 1979 remains at +0.13 C/decade (+0.11 C/decade over the global-averaged oceans, and +0.18 C/decade over global-averaged land).–

    See that giving separate ocean and land average trend, now.
    That’s interesting.

  24. Midas says:

    Scott R

    … “we always go into a La Nina when a new SC starts”

    Solar cycle 23 began in August 1996. It began with 9 months of ENSO neutral and was followed by an EL NINO.

    The beginning of solar cycle 22 was in September 1986. This was the first month of an El Nino lasting 18 months.

    Head’s up …. false claims containing “always” are easy to debunk.

    • Scott R says:

      Midas,

      I never mentioned what the delay was. The situation is way more complex than a solar cycle starting and then instant la nina. I’m looking at the 5 year averages here. Sorry, I guess always was a poor choice of word.

      https://drive.google.com/file/d/1wxmoCO92TMuGpyHLNxpvlEhzb7qE29-S/view?usp=sharing

      • David Appell says:

        But my calculations of the 5-yr moving average of the NINO3.4 anomaly is, at present, +0.5 C, not -0.4 C.

        data source:
        http://www.cpc.ncep.noaa.gov/data/indices/wksst8110.for

        Anyway taking the 5-yr moving average of something that has cycles every 2-7 years isn’t at all physically or statistically meaningful.

        Which reinforces my claim that you are doing numerology, not science.

        • Scott R says:

          David Appell, yes the 5 year moving average is at a high point right now. This is because we just had a super El Nio cycle and its 2.2, 3.6 harmonics. Now you will see that drop as the next solar cycle starts.

          • David Appell says:

            Sorry, a 5yr moving average is too wide to say anything about an 11yr solar cycle.

            You don’t see that??

            You’re just cherry picking numbers — pulling them out of thin air, whatever you need.

            There is no physics whatsoever behind your machinations.

            You’re an astrologer, finding patterns in supposed star patterns.

            You have no science whatsoever behind you.

          • Scott R says:

            David Appell,

            How do you expect me to suppress the 3.6 and 2.2 yr harmonic cycles of the 11 year cycle without using a 5 year moving average? Do you have any idea how to suppress data to pull cycle information?

      • Midas says:

        So you get to choose your own delay, AND you use “ALWAYS” based on only three solar cycles.

        With that luxury I could “prove” just about anything I want.

        • Scott R says:

          Midas how do you figure that I’m choosing the delay? The delay is there in the recorded data. I don’t choose that. How many complete AMO cycles is AGW based on? How many complete PDO? How many complete GSM cycles is AGW based on? Talk about people in glass houses.

          • Midas says:

            That’s because AGW is ONLY a prediction of changes in the baseline that any “cycles” operate on. And the amplitude of any such “cycles” (a poor choice of word considering the lack of periodicity) is far less than the increase in the baseline.

          • Scott R says:

            Midas that is completely false. You can easily see that for example ENSO, is the #1 forcer:

            https://drive.google.com/file/d/1REud2hTHZiRYsNw_3O6dTPR4BJurHJe2/view?usp=sharing

            Then you have that cycle on top of the AMO:

            http://woodfortrees.org/plot/esrl-amo/from:1850

            AMO and ENSO are mostly responsible for how the UAH data looks.

            How much data movement is left for this supposed move of the baseline? Not much.

          • Midas says:

            Your graph displays exactly what I stated – that the baseline is rising while other “cycles” cause temperatures to oscillate about that rising baseline.

          • bdgwx says:

            ScottR, you and I both can see the cyclic behavior is flat while the temperature response has a positive linear slope. Your model is going to have to have a linear term in it. What does that term represent in your mind?

          • Scott R says:

            bdgwx,

            I do not think we have an linear trend underneath the ENSO signal in the UAH data. I believe we have another SIN function with a longer period… ie AMO and we have another function PDO with a longer period than that. There are even more terms to add, but you get the idea.

            I believe the sun is only really responsible for 2 deg c of change in central England. (we were discussing this earlier) The other 2 deg c has nothing to do with the energy level of the earth, just the distribution of energy changing via ENSO, PDO, AMO. Some times the energy is concentrated in one place… some times another. When the energy is concentrated away from the surface of the ocean and combined with a solar min, we can get really cold. When the energy is concentrated at the oceans surface when the sun is very active, we can get very warm. All together 4 deg c of variance, again speaking from central England.

            After you consider these 2 things, there is almost no pie left for man made forcings.

          • bdgwx says:

            ScottR,

            Ok sure I suppose it doesn’t have to be a linear term. It could be another sine term like you say. We’d still like to have these terms represent something meaningful like a physical process that way if something significant happens to the modulation of that process then we can adapt or tune the model to accommodate that change. And, of course, the ultimate goal is back test the model against historical data. Afterall, for it to be convincing it needs to have skill over a broad range of time periods. And for it be chosen as the prime candidate it needs to fit observations at least equally as well as what we already have.

            BTW…I’m actually okay with what you are doing here. I like doing these kinds of analysis myself.

          • Dr Roys Emergency Moderation Team says:

            bdgwx, please stop trolling.

  25. Scott R says:

    The north Atlantic keeps cooling.

    https://www.tropicaltidbits.com/analysis/ocean/natlssta.png

    The last time it was this cold was 2002. The July peak was another lower high in a rolling over dataset. Here is a longer look that doesn’t include the recent data:

    http://woodfortrees.org/plot/esrl-amo/from:2000

    It seems that you can’t keep warming the earth indefinitely with low overturning. The slow thermohaline circulation while creating warm Pacific waters, cools the Atlantic. With a negative AMO cycle, the arctic will build ice, create a feedback loop.

    You can see that the mixing has slowed by looking at the SH vs NH. During times of good mixing, the cold waters from the southern ocean can cool the planet. During poor mixing, the southern ocean cools and the rest warms.

    http://woodfortrees.org/plot/hadsst3nh/from:2007/plot/hadsst3sh/from:2007

    I’ll keep saying it… low overturning / strong El Nino isn’t a sign of global warming, it is a sign of global cooling. It is a short term gain and a long term loss. The more heat you keep right at the surface, the colder the water gets underneath, and the easier the heat is radiated back out to space and not stored for the future.

    • Scott R says:

      Who wants to celebrate if the north Atlantic hits baseline at 12z today? It’s at +.009 for the 6z. Kind of deflates the whole theory that co2 has cancelled out all natural cycles that were in play before modern times when the north Atlantic can drop by .8 deg c in a matter of 2 months. If the natural cycles are still in play, co2 can only be the “left overs” after all the natural climate change has been accounted for.

      The last time we had a monthly negative departure for the north Atlantic was during the recovery after mount Pinatubo exploded. I don’t know if this will hold for a month, continue to drop well below baseline on this move, but worth watching.

    • e. Swanson says:

      Scott R, Your graph is not for the entire North Atlantic, but for the sub-polar gyre of the North Atlantic, a relatively small fraction of the total and a region which has exhibited an on going cooling trend. The upwelling cycle in the Equatorial Pacific is a wind driven process and is not directly connected to the THC sinking in the high latitudes of the North Atlantic or the Arctic Mediterranean. There’s a massive quantity of cold waters in deeper layers of the oceans which will be available to provide cooler waters long after a postulated THC shutdown at high latitudes. THC sinking around the Antarctic are not connected to the high latitude N Atlantic sinking either.

      • Scott R says:

        e. Swanson,

        Sorry, I realize the AMO index is not the same as the north Atlantic departure. I only posted that link to give people a longer view of the rolling over. I’m still struggling with no google drive access at work. The same roll over exists in the north Atlantic HADSST3 data.

        I agree that the THC sinking at the arctic and Antarctic are independent systems to study. ENSO / the southern ocean / the sun seem to be operating together while AMO does it’s own thing. As mentioned in prior posts, I think AMO and PDO are 5th and 3rd harmonics of the GSM. While ENSO and it’s 3.6 / 2.2 yr harmonics are created by the 11 year cycle.

        • fonzie says:

          Scott, fwiw, i scantly recall that there is a direct relationship between enso and amo. When there is upwelling in the eastern pacific, there is downwelling in the north atlantic. (unfortunately, i don’t recall much more about it than that… 😖) All that i can remember is that engelbeen was explaining it over at wuwt. Not sure whether he did so in a post or it was just in the comment section…

    • barry says:

      “Kind of deflates the whole theory that co2 has cancelled out all natural cycles that were in play before modern times”

      But no one has EVER said that! What nonsense you talk.

      • gbaikie says:

        “But no one has EVER said that!”

        Da vid Ap pell says that

      • barry says:

        David has said that CO2 has cancelled out all natural cycles that were in play before modern times?

        No, he hasn’t. But it would be interesting to see you quote him, to discover how you misinterpreted something he said.

        • gbaikie says:

          Everyone knows that we in an Ice Age also known a Icehouse climate.

          David says we have left the ice age due to our recent CO2 emissions.
          Others have also made similar claims.

          And I am not including the claims made to be “effective” in their political propaganda- “We are going die! Or “The world is ending in 12 years” type of common hyperbolic gibbish.

          So David is not predicting, but rather, we have already left the global icebox climate.

          I believe he might think we are in hothouse climate. Or maybe, he thinks it’s coming in the future.

  26. Rob Mitchell says:

    I have a question for the atmospheric scientists on Dr. Spencer’s blog page. Is there anything alarming about +0.61 deg. C for the month of September? As an operational weather forecaster, I see it as a record high temperature for a particular day, but expanded over a 30-day period. Is this a “danger danger Will Robinson” event?

    Scott R, I think I understand what you are getting at. Correct me if I am wrong. Dr. Pat Michaels said there is “some” confirmation of global warming theory because the stratosphere has gotten cooler recently, meaning the troposphere is retaining more heat than normal, and not radiating its heat as rapidly to the stratosphere. But eventually, the heat buildup in the troposphere will radiate to the stratosphere, thus warming the stratosphere and cooling the troposphere. Likewise, a cooling sea surface temperature coincides with a warming lower troposphere because the ocean surface has radiated a batch of its heat to the adjacent surface above.

    Both the ocean and the atmosphere are constantly transferring heat, but never at a smooth continuous rate. Whenever a recognizable “batch” of heat gets transferred, I think climate scientists tend to raise an exaggerated alarm about it.

    • bdgwx says:

      Nah…the +0.61 anomaly for September isn’t anything to be alarmed by. Keep in mind that UAH TLT product is weighted pretty high up in the troposphere. I suspect surface datasets will show a smaller change based on what I’m seeing from reanalysis.

      Yes. A cooling stratosphere simultaneous with a warming troposphere and hydrosphere and consistent with the GHE. In fact, that single observation eliminates most other alternative hypothesis.

      No. The warming of the lower atmosphere and cooling of the stratosphere will proceed until a new equilibrium is established. Once established and assuming the energy imbalance falls back to 0 W/m^2 the system will remain in a relatively stable state with little or no change in temperature in either the troposphere or stratosphere…all other things being equal of course.

      Yes. A lot of people exaggerate the relevance of minutia like monthly changes. And yes, heat does transfer between the different mediums like the cryosphere, hydrosphere, and atmosphere. These large monthly are almost certainly primarily the result of a heat transfer process. And while the distribution of heat in the different mediums is very important to track over the long haul it is the total uptake of heat over the entire geosphere that is more important for understanding the future trajectory of the climate system. Right now the energy imbalance at the surface is about +0.6 W/m^2 (or more). That energy might move around quite a bit, but overall it continues to accumulate globally as a whole.

      • Scott R says:

        Rob Mitchell,

        You are not far off track from my thinking. Where I differ from the establishment on climate is primarily I believe that cycles in the overturning of warm / cold ocean waters is sun driven, and goes thru repeating and predictable patterns on all time frames. My understanding is that these cycles have not been interrupted at all. I’m interested in finding out if the baseline for these cycles has been changed at all. In order to figure that out, you have to take into account all timeframes. Obviously, with only a limited amount of sat records, we have to resort to proxy data to create the model. I don’t think using the AGW theory to create the model is wise. Models are best created by data, not theory. Anyways, that’s how engineers do it at the end of the day. Testing / validation / creating charts and design standards. Lots and lots of charts. No automotive system ever goes into production based on theory alone.

        The interaction between the troposphere and stratosphere is also important. There are feedbacks as the stratosphere cools, it contracts and doesn’t absorb as much sunlight. There is also the CO2 must double rule, where you have to double the CO2 to get the same change as the last double. Problem is, we still haven’t sorted out what co2 actually does because there are so many natural cycles clouding the view.

        basic equation:

        Natural climate change + man made climate change = Total change

        bdgwx why do you think the earth was in energy balance before CO2 increased? The data clearly shows massive temperature swings even on short time frames. The earth is always in a state of change. Also, even if the earth was a closed system, the energy balance between components is always in a state of flux.

        • bdgwx says:

          Scott said: “bdgwx why do you think the earth was in energy balance before CO2 increased?”

          I don’t think that…at least I don’t think it was in perfect balance or ever was. But I know it is out of balance today by +0.6 W/m^2 and that a significant contributor to this imbalance is a change in GHGs.

          • Scott R says:

            bdgwx,

            +0.6 w / m^2 where is that coming from? Is that the consensus net man made forcing component including all feedbacks?

            Are you able to break that down further at all? like X comes from Co2, Y comes from other man made gases, Z comes from heat islands? Even better if I could see the gross numbers with feedbacks.

          • bdgwx says:

            Scott, it comes from Cheng 2019 – 2018 Continues Record Global Ocean Warming and various other like works that quantify oceanic heat content. There are many sources for the break down of the imbalance but we don’t need to know the breakdown of what caused the imbalance to know that there is an imbalance. My point was mainly that there is an imbalance.

          • David Appell says:

            Scott R: Science finds that 110% of modern warming comes from anthropogenic greenhouse gases.

            (It’s greater than 100% because the climate should naturally be cooling since the 1960s, due to the decline in average total solar irradiance.)

          • Scott R says:

            Bdgwx,
            Well it is interesting to me that there is an actual number being tossed around. To get to that point, a full understanding of the component forcers and feedbacks is required. If say, they took the sea level rise and simply calculated man made forcing, that isn’t going to fly for me because it is circular reasoning. The goal of all of this is to build a useful climate model that matches past data. So far, the models have not been working because they fail to incorporate natural climate change on multiple timeframes and past data.

          • Scott R says:

            DA
            Wow that’s funny. So you are saying the amplitude of co2 warming is 10 times more than all natural factors combined? I wonder what a David Appell of 1980 would say when the earth had just finished its negative AMO stage and the poles were full of ice… even though co2 in 1980 was higher than 1940.

            Find out what Spock said about climate change 40 years ago…
            https://m.youtube.com/watch?v=mOC7ePWCHGk&feature=youtu.be

          • bdgwx says:

            ScottR, nah, the imbalance is just an observation. You don’t need to know anything about what’s causing the imbalance to be able to measure it. The imbalance is a product of the accumulation of energy in the various reservoirs. There is so much thermal mass in the oceans that they account for ~90% of the heat uptake. So measuring OHC gives us a good approximation of the total heat uptake in the geosphere. The other reservoirs are the cryosphere, atmosphere, and thin top layer of the lithosphere. Interestingly the current imbalance is consistent with estimates provided by the net effect of all known forcing agents (including CO2).

          • David Appell says:

            Scott R says:
            Wow thats funny. So you are saying the amplitude of co2 warming is 10 times more than all natural factors combined?

            Yes.

            More than that — There is no natural warming. None at all.

            If you think there is, describe it and show its radiative forcing.

          • David Appell says:

            “What’s Really Warming the World,” Bloomberg Business, 6/24/15
            http://www.bloomberg.com/graphics/2015-whats-warming-the-world/

          • David Appell says:

            Scott R says:
            I wonder what a David Appell of 1980 would say when the earth had just finished its negative AMO stage and the poles were full of ice even though co2 in 1980 was higher than 1940.

            1980 was four decades ago!

            It has nothing whatsoever to do with today’s climate.

            Smarten up, Scott, or be dismissed.

          • bdgwx says:

            ScottR, yes, the combination of all anthroprogenically modulated radiative forcings like CO2, aerosols, CFCs, etc. are likely close to 1 order of magnitude higher than those from naturally modulated radiative forcings right now.

            Refer to the IPCC AR5 Chapter 8 for a brief summary of the breakdown of the forcing agents (both natural and anthroprogenic) currently in play.

            https://www.ipcc.ch/site/assets/uploads/2018/02/WG1AR5_Chapter08_FINAL.pdf

          • bdgwx says:

            And this is why skeptics of natural-only alternatives like myself and climate scientists are so compelled by the prevailing theory. For these natural-only theories to be convincing we need 3 things to happen.

            – Explain how our understanding of the various forcing agents (like GHGs, aerosols, solar, etc.) erroneously led us to believe the athroprogenic effect was an order of magnitude greater than it really is.

            – Explain how our understanding of the various forcing agents erroneously led us to believe the natural effect was an order of magnitude less than it really is.

            – Do both of these in a manner in which you can explain observations spanning nearly all disciplines of science at least equally as well as the prevailing theory.

          • Scott R says:

            bdgwx,

            Thanks for the paper. I am actually very interested in this information. At first glace I already see problems. In figure 8.15, it says the man made forcing is 2.3 w / m^2, which is even greater than the +0.6 w / m^2 you gave me.

            Please consider this rough study I just made:

            During the last GSM, TSI was around 1360.1 and held there for a long time. The floor of the central England data set was around 7 deg c annual temperature.

            From the mid 1700s to the early 1900s, we can say TSI was averaging around 1360.6. That’s a gain of +0.5 w / m^2. The floor of the central England data set increased to roughly 8 deg c.

            The last 7 solar cycles were exceptional, and you can make the case that they averaged around 1361.1 w / m^2, a gain of 0.5 w / m^2, and also corresponded to another 1 deg increase in the floor of the central England data set to 9 deg c.

            There is simply no room for another +0.6 w / m^2 or 2.3 w / m^2. Central England should not be having any years under 10c but they are.

            Something has gone wrong on the calculation of the man made component here, because the equation is not balancing with the recorded data.

          • bdgwx says:

            ScottR, nice catch on the difference between 2.3 and 0.6 W/m^2.

            First understand that the 0.6 W/m^2 is conservative. It is likely closer to 0.7 or even 0.8 W/m^2 if you include the other reservoirs like the crysophere and atmosphere. But let’s stick with +0.6 W/m^2 for now.

            What this means is that 2.3-0.6 = 1.7 W/m^2 has already equilibriated. As the equilibrium temperature increases the imbalance decreases. It is believe that about 1.1C of warming has occurred as a result of this 1.7 W/m^2 of forcing. This gives a climate sensitivity of 1.7 / 1.1 = 0.64C per W/m^2 which is consistent with calibrations from the paleoclimate and instrumental record. The spread between 1.7 and 0.6 W/m^2 is a manifestation of the transient climate response (TCR) and equilibrium climate response (ECR). ECR is higher than TCR because it takes a few decades to burn off the imbalance. The ECR-to-TCR ratio from a radiative forcing perspective is thus 2.3 / 1.7 = 1.35 which is consistent with other lines of evidence. Even if all of these forcing agents turned off immediately we would still experience warming of up to 1.1 * 1.35 = 1.5C.

          • Scott R says:

            bdgwx,

            I don’t see how we can say that 1.7 w / m^2 has already equilibriated. We should have seen much more temperature rise for that. +1 deg c in central England for +0.5 w / m^2 is about what I see as the natural forcer based on coming out of the last GSM, and going into the current modern maximum we added another 1 deg c.

            I still don’t have any movement in the data for man made forcing. Everything is staying within the normal floors / ceilings that it should be.

          • bdgwx says:

            ScottR,

            I agree with the +0.5 W/m^2 average change in TSI from 1750 to present. But, let’s go trough-to-peak of about +1.0 W/m^2 from Maunder Minimum to the Modern Maximum (1700 to 1960) just to be on the safe side. So a +1.0 W/m^2 TSI would normalize to 1.0/4 = 0.25 W/m^2 of force at TOA. Remember, we have to divide by 4 to convert from the cross-sectional capture to the spherical capture of solar radiation. Then normalizing this to the surface so that we can do an apples-to-apples comparison we’d get 0.25 * 0.7 = +0.18 W/m^2 (note I used the standard 240/340 reduction factor here). So there you have it…the trough-to-peak integrated solar force at the surface was likely near or less than +0.2 W/m^2 from the Maunder Minimum to the Modern Maximum.

            That’s a pretty small force despite being somewhat liberal with the derivation above. So you can add on another 0.2 W/m^2 of force to my original figures but seeing as it represents less than 10% of the anthroprogenic force the final results aren’t going to change much.

            Another thing to consider is that if you are wanting +1.0C to come out of +0.5 W/m^2 of force then you’ll have to accept that the climate is extremely sensitive (+2.0C per W/m^2) to change which leads to other inconsistencies with observations both in the paleoclimate and instrumental record.

          • Scott R says:

            bdgwx,

            I’m going to have to dig in more to see how the units on my w / m^2 are somehow different than what is in the paper to force the divide by 4.

            The problem is, I see temperature movements as we came out of the little ice age with no co2 change, little TSI change. Now we have the modern maximum + humans, yet where is all the warming? The amount of warming from level 1 to level 2 looks the same as level 2 to level 3.

            Since the proxy data is located in central England, it is very possible that this is a location that is going to be a high amplitude / high sensitivity location due to the gulf stream. My goal will be to first create an accurate model for central England based on the proxy data. Then, I will write a function to convert to other locations around the world, or create a global model. Each location will have a unique function. The more data I have for a location, the more accurate the converting function will be.

    • gbaikie says:

      –Rob Mitchell says:
      October 2, 2019 at 9:35 AM
      I have a question for the atmospheric scientists on Dr. Spencer’s blog page. Is there anything alarming about +0.61 deg. C for the month of September?–
      Not vaguely alarming.
      Could be called unexpected; not something one could have predicted.
      If think it’s not unexpected, what will it be next month?

      –As an operational weather forecaster, I see it as a record high temperature for a particular day, but expanded over a 30-day period. Is this a “danger danger Will Robinson” event?”
      First it’s average temperature, not an average of daytime high temperatures. And as compared to 40 other September’s average temperature.
      Any gambler should lose against the house rules but a gamble could make $10,000 in day. Or $10,000 in a month.
      It seems if gambled every day and after 30 days made $10,000, that could seem more impressive. But not necessarily more impressive than winning $10,000 in one day.
      Of course the other factor is global temperature has been increasing, so it’s like the house making more money in some month.
      Anyways, it more unexpected for me, because continental US was quite warm in Sept, but where living in US, it just seemed colder than usual- though part of why seemed colder to me was it cloudy and wetter than typical. And if was colder, here, than the rest country must been even warmer.
      So, I would guess one could find a few States for the entire month which even more dramatically warmer.
      It might something to do with that hurricane that hit eastern Canada. But perhaps a weatherman might know if and how that was or was not the case.

  27. Dirk says:

    Reminds me of the scene in The Big Short where, after the Fed successfully got everyone with an ARM to consider selling their houses and house prices started to crash, the derivatives stayed high… for awhile. If the oceans are a large heat capacitor, with the blob retaining heat that did not come from a TSI high, then as this capacitor dissipates its heat charge the expected cooling will show- in spades. I am curious if the satellite data confirms some of the theory regarding heat being released into the atmosphere via lava flows and volcanoes under Antarctic ice…

    • Scott R says:

      Dirk,

      You are not far off. Right now, most of the population believes we are warming, or that global warming is fake, end of story. VERY few people are seeing the possibility of a cold climate crisis. This is sure the blindside many not unlike the 2008 housing crisis. Before 2008, everyone thought real estate prices only go up. Before 2022, everyone thought global temperatures only go up.

      As far as Antarctica, it is very stable with and without these volcanos. It is SO unbelievably cold there that interior stations have never recorded an above freezing temperature. The only melt comes as the ice moves to the coast and hits water, or air warmed by the ocean. If these volcanos are having any impact, it is not showing up in the sea level data as it has remained in a linear up trend.

      2324gt of new snow is deposited on Antarctica every year. Outflows are at 2306 +/- 142 gt based on the 2009-2017 average. I wouldn’t worry too much about the big error. Ice sheets are self-correcting systems. If snow picks up, melt picks up. If snow drops off, melt drops off. It’s like a conveyer belt of ice where new snow is constantly replacing old ice in the system.

      • David Appell says:

        What’s the variance (standard deviation) and error bar on your number for snow deposited to Antarctica every year?

        • Scott R says:

          David Appell,

          I took the 166mm average precipitation number off of Wikipedia which gives this for reference: Vaughan et al., J Climate, 1999.

          The land area is 13.9989 million km^2 calculated by taking 5.405 million miles * 2.58999.

          That’s how you get to the 2324gt of new snow every year.

          I have seen estimates for Antarctica size at 14.2 million km ^2. If that is the case, my total gt is actually low by about 33 gt.

    • David Appell says:

      Dirk says:
      If the oceans are a large heat capacitor, with the blob retaining heat that did not come from a TSI high, then as this capacitor dissipates its heat charge the expected cooling will show- in spades.

      a) except the ocean’s capacitance time constant is ~1500 years

      b) except the ocean continues to gain heat all the time — it has an energy imbalance of about 0.7 W/m2 since 2005, for the top half of the global ocean. That’s about 13 zetajoules per year. And accelerating.

  28. Scott R says:

    Folks… the north Atlantic has just gone under baseline for 12z. How did I know?

    https://www.tropicaltidbits.com/analysis/ocean/natlssta.png

    Instead of having a funeral for a glacier in Greenland, it looks like we are going to be having a baby shower for all the baby glaciers that are going to start growing in the NH.

  29. Ken says:

    Its hilarious to see the furious discussion regarding slight changes in temperature on the order of hundredths of a degree.

    Too bad there is no serious discussion about what actually is driving the changes in temperature.

    Too bad there is no serious discussion about what would happen if temperatures went down 1C and stayed there and why that would be better or worse than 1C rise.

    I liked the discussion about nuclear power. 24000 nuclear plants makes a heck of a lot more sense than building a gazillion wind and solar plants.

    Forget fusion; its been a pipe dream forever. Let us know when it works.

    • David Appell says:

      Too bad there is no serious discussion about what would happen if temperatures went down 1C and stayed there and why that would be better or worse than 1C rise.

      Why discuss this? There is no science to suggest this possibility — it’s just the opposite.

    • Bindidon says:

      Ken

      “24000 nuclear plants makes a heck of a lot more sense than building a gazillion wind and solar plants.”

      And what do you do with the many millions tons of highly contaminated waste these nice guys will produce?

      A big deal with Kazahkstan for example? I’ve heard there is a lot of free places in the deserts there (but dont forget to bring a few trucks of US$ notes with the rest).

      • David Appell says:

        I’m thinking we bury them just outside Stephen Anderson’s town.

        Because 2,000 t of waste is nothing, right? Even if it lasts for tens of thousands of years.

      • Dr Roys Emergency Moderation Team says:

        David, please stop trolling.

      • ken says:

        “And what do you do with the many millions tons of highly contaminated waste these nice guys will produce?”

        Recycle it. Apparently there remains 95% of the energy in spent fuel rods.

        Otherwise fire it into deep space (and irritate the aliens there).

        The other response is: what are you going to do with the gazillions of tonnes of waste from solar and wind equipment at the end of its useful life? At least with nuclear there is a half life.

  30. Scott R says:

    David Appell,

    Respectfully, the AMO cycle is what 70 years and it just went sub 0. It peaked in 2012 at +1.0037 departure. I’d hardly call that a short term variation. It is a massive reversal of an important climate forcer. You can check out the information here to see how a positive PDO and a negative AMO might impact the weather in the US.

    http://la.climatologie.free.fr/amo/amo-english.htm

    Clearly, our precipitation pattern matches +PDO -AMO currently. When the north west starts to get pounded with rain and Nebraska dries out, you will know we transferred into -PDO -AMO. Both trends will be very fresh lasting decades.

    On the other hand, AGW alarmists will be the first to point out every time we have drought, flood, wind, heat, ice berg, a single dead polar bear, that it is my fault for producing CO2… something all animal life has done on earth through all time. The more successful the life form, the more co2 it produced.

    • David Appell says:

      And what is the global temperature change between the peak and trough of the AMO, all other factors held equal?

      And why?

    • David Appell says:

      Scott: Why do you disregard warming from anthropogenic greenhouse gases?

      Do you think they don’t absorb some of the infrared radiation given off by the Earth’s surface?

      • David says:

        The ocean contains a colossal 1,500,000,000,000,000,000,000 litres of water! To heat it, even by a small amount, takes a staggering amount of energy. To heat it by a mere 1˚C, for example, an astonishing 6,000,000,000,000,000,000,000,000 joules of energy are required.

        Lets put this amount of energy in perspective. If we all turned off all our appliances and went and lived in caves, and then devoted every coal, nuclear, gas, hydro, wind and solar power plant to just heating the ocean, it would take a breathtaking 32,000 years to heat the ocean by just this 1˚C!

        In short, our influence on our climate, even if we really tried, is miniscule!

        So it makes sense to ask the question if the ocean were to be heated by greenhouse warming of the atmosphere, how hot would the air have to get? If the entire ocean is heated by 1˚C, how much would the air have to be heated by to contain enough heat to do the job?

        Well, unfortunately for every ton of water there is only a kilogram of air. Taking into account the relative heat capacities and absolute masses, we arrive at the astonishing figure of 4,000˚C.

        • David Appell says:

          Do you really think professional scientists can’t do this same calculation, and didn’t do it 100 years ago?

        • bdgwx says:

          Yes. The amount of heat taken up by the geosphere (mostly hydrosphere) is mind boggling. Fortunately there are thermodynamic principals that prevent the 300e21+ joules taken up by the ocean over the last 50 years from transferring entirely into the atmosphere.

        • Lou Maytrees says:

          David.
          Nice verbatim steal from Dr. Chemical – Mark Imisides, a chemist and biodiesel guru who labels himself as Perth’s cleaning and stain removal expert.

          You can trust him.

          LOL

          • Tim Folkerts says:

            David,

            The ocean contains a colossal ~ 350,000,000,000,000 square meters of surface area, radiating ~ 400 W/m^2 of IR, or a colossal 140,000,000,000,000,000 J every second. At this rate, the entire oceans would cool nearly 1 C in just one year! Of course, they don’t cool this quickly due to incoming radiation from the sun and the atmosphere approximately balancing out the radiation from the water.

            But this just goes to show that even relatively small changes in radiation from the atmosphere (due to, oh, I don’t know, maybe changes in GHGs) could lead to profound changes the oceans on the scale of centuries (and cause profound changes in the temperature of the top layers within years).

          • Dr Roys Emergency Moderation Team says:

            Tim, please stop trolling.

      • Scott R says:

        DA

        I don’t disregard it. I just have the total summation of all man made gasses as my number 9 forcer roughly. Lol

        Once my model is done I will be able to increase my confidence about that.

    • Tim Folkerts says:

      Scott, you linked to an article with a ~ 450 yr graph of the AMO.

      Can you honestly say you see a 70 year cycle in the data? I sure can’t.

      • Scott R says:

        Tim you made me do a double take… I looked at the charts of AMO again for the link I posted and I see a 70 year cycle. Roughly 35 years heading down and 35 years heading up repeated again and again going back to the mid 1800s when they started recording ocean temperatures. I realize the article is 5 years out of date, but the interesting thing is it shows the precipitation pattern in the US. We have most definitely switch to -AMO, +PDO.

        • David Appell says:

          We have most definitely switch to -AMO, +PDO.

          Pure, utter bullsh!t.

          The AMO is about +0.2 C. No evidence it’s going lower.

          AMO
          http://www.esrl.noaa.gov/psd/data/correlation/amon.us.data

          You’re a liar, Scott.

          It’s now bright blue — you lie.

          • PaulS says:

            David,

            It depends what definition you use for AMO. The traditional definition which you’ve linked, using a linear detrending from the mid-19th Century, is I think widely recognised now to be nonsense. No-one thinks the historical forced response has been linear so how can it be meaningful to detrend linearly? But anyway, according to that definition we probably won’t see negative AMO again until after forcing stabilises because until then warming will proceed above the historical linear trend from the mid-19th Century.

            For me probably the most sensible purely empirical AMO definition is to subtract a global SST average from the North Atlantic SST average, as Geert Jan van Oldenborgh has setup at Climate Explorer. By that definition AMO has been largely negative since 2014. Of course, this coincides with a big surge upwards in global average temperature which rather brings into question the supposed strong dependence of global temperature on AMO.

            Another representation of AMO which seems to be gaining some popularity is to look solely at the sub-polar North Atlantic (say 50-60N). This is a region which is special because it is expected, and observed, to exhibit little trend due to rising greenhouse gases. And therefore it could be used without any detrending to perhaps demonstrate North Atlantic unforced variability. The AMO by this definition turns out to actually be very similar to that produced by the global SST detrending, again showing AMO to have been negative since 2014.

        • ren says:

          Scott R, I agree with you. A cycle of about 60-70 years is associated with a change in the strength of the polar vortex. We are now in a negative phase.

        • Tim Folkerts says:

          Scott,

          Look at the *next* graph, going back a few hundred more years. Any 70 cycle you might see recently is completely indistinguishable in the longer record — the data go up and down differing amounts at differing intervals.

          That means that we should not trust any future predictions of this oscillation.

          • Scott R says:

            Tim Folkerts,

            The AMO and PDO forcer (plus many more) are combining together to make the ocean temperature data set. One is the 5th harmonic, one is the 3rd harmonic. Because of this, the waves occurring at the 70 year interval will all be unique.

          • Tim Folkerts says:

            Scott,

            The long-term data for AMO shows no 3rd nor 5th nor any other harmonic pattern. (From your link above)
            The long-term data for PDO shows no 3rd nor 5th nor any other harmonic pattern.
            https://en.wikipedia.org/wiki/Pacific_decadal_oscillation#Reconstructions_and_regime_shifts
            Both seem to shift quasi-randomly.

            If there is no long-term pattern for either of these in the past, why are you so sure there is a long-term pattern going forward?

            It is certainly possible that shifts in either or both could be occurring, and could impact global temperatures. But there is simply no evidence that you have presented (nor that I have seen elsewhere) that says these patterns for AMO and PDO are predictable into the future.

          • Tim Folkerts says:

            Just for fun, here is a similar analysis from ~ 10 years ago. Some of their conclusions:

            “The cool phase of the PDO is now [2010] entrenched and ‘global warming’ (the term used for warming from 1977 to 1998) is over. ”

            “Global cooling began in 1999 and should last for several decades because in 1999 the Pacific Ocean switched from its warm mode to its cool mode.”

            http://scienceandpublicpolicy.org/images/stories/papers/reprint/multidecadal_tendencies.pdf

          • Scott R says:

            Tim,

            Please look at my basic model again. Reminder, this only has the GSM 3rd and 5th harmonic forcers. Look how well the data lines up. The GSM causes these unique patterns of energy distribution on the earth. It has nothing to do with the solar forcing itself. I’m honestly not sure why, but it does. Once I add other forcers to this, the model will be very accurate.

            https://drive.google.com/open?id=1fCwbclHobjJekPZbke3Enz2Zv63Nlgse

          • Tim Folkerts says:

            Scott, once again …

            1) A straight line fits considerably better than your oscillating function.
            2) This paper also had a great fit using PDO & AMO. It failed miserably into the future.

            You have done a crude exercise in curve fitting. There is no physical basis. It fits poorly. You can improve your fit considerably by tweaking the parameters, but it is still not as good as the linear fit.

            Adding even more parameters will just compound these weaknesses.

          • Scott R says:

            Tim Folkerts,

            There is nothing linear about the earths climate. The earth physically moves in repeating patterns. The sun discharges energy in repeating patterns. If climate change on the earth was linear, exponential, after 4 billion years of running that, the earth would have either burned up, dried up, become all water with no land or became a frozen rock by now. Every data set that appears to be linear is really just a sin function, but the period is so great that the data can be represented by a linear trend for short term forecasts. Couple that with multiple timeframes of SIN patterns. That’s the reality. The earth’s climate isn’t random, it isn’t linear, it’s cyclical.

          • Tim Folkerts says:

            Scott,

            The climate moves in some clearly repeating patterns — all linked to the precision of astronomy. Like …
            * day/night
            * seasons
            * precession
            * Milankovitch cycles
            Far, far into the future, I can accurately predict these cycles.

            A few other cycles are fairly periodic and predictable. Sunspots, for example, have *approximately* an 11 year cycle. But the period and amplitude vary in ways that cannot be accurately predicted even one cycle ahead. (And the link to climate is tenuous).

            And then there are ‘cycles’ like PDO and AMO and El Nino, that are basically unpredictable even a few years out.
            *there is no fixed amplitude to the cycles.
            *there is no fixed period to the cycles.
            *there is no fixed shape to the cycles.

            To pretend that these unpredictable cycles are predictive of the future is, frankly, an oxymoron.

            PS I am not claiming that the climate is linear. But there is reason to expect an upward trend (CO2) so some sort of ability to shift teh baseline should be built into any model. Your model *assumes* that there can be no long-term shift, and hence will never be able to deal with changes in the baseline.

          • Dr Roys Emergency Moderation Team says:

            Tim, please stop trolling.

  31. Bindidon says:

    Bart says:

    “And, dead birds from the windmills. Lots and lots of dead birds.”

    That was really the best, most cynic comment in the field since years.

    1. A interesting stat for you:
    https://www.sibleyguides.com/conservation/causes-of-bird-mortality/

    Do you see the huge bar next to ‘wind turbines’ ?

    2. A further info:

    “Between 365 and 988 million birds die from crashing into windows in the United States each year, according to a new report. That may be as much as 10 percent of the estimated total bird population of the country.”

    WashPost, 03.02.2014.

    *
    3. Do you know, Bart, that North America has lost three billion birds compared to the 1970s?

    https://www.nationalgeographic.com/animals/2019/09/three-billion-birds-lost-north-america/

    C’mon Bart, stop your nonsense.

    • Bart says:

      Again with the old switcheroo.

      One more time: we are not worried about small, rapidly reproducing birds. We are worried about the environmentally critical carrion fowl, soaring raptors, and insect-eating bats. Those are the species directly threatened by the windmills, and many of them are already endangered.

      • Midas says:

        A denier pretending to be a greenie …. now that’s hilarious!

        • Bart says:

          I am an avid ornithophile.

        • Bart says:

          You should be worried, too. These creatures fill an important ecological niche. And, what are you trading them for? A bunch of useless, intermittent power that can never be self-sustaining? Why?

          • Midas says:

            So the vast vast vast majority of human-related bird deaths don’t matter? And you haven’t provided any proof that the existence of these species is threatened by windmills …. no blog ‘proofs’ please.

          • Dr Roys Emergency Moderation Team says:

            BobdesbonddesMidas, please stop trolling.

      • David Appell says:

        Bart,

        Again: Numbers per GWh?

        Number of bird deaths from fossil fuels, per unit of power?

        By cats?

        From cars?

        From buildings?

        • Nate says:

          Bart ‘cares’ deeply about the detrimental effects of energy sources he opposes for political reasons.

          He cares little about the much larger detrimental effects of energy sources he likes.

          The mercury in all fish high on the food chain all came from coal burning.

          The hundreds of thousands of human deaths per year that can be attributed to lung damage from FF air pollution.

          The vast areas of of Appalachia that are permanently scarred from coal mining, and can be easily seen from space.

          The vast areas of Alberta that is polluted by runoff from tar-sand mining and processing.

          The large damage from large oil spills.

          Etc, etc

          All energy sources have detrimental effects. The question is what are the RELATIVE magnitudes of these?

          • Bart says:

            Your solar and wind power do not help with these things. Lots of mining and toxic chemicals and emissions involved there, too. If you wanted to go nuclear, I’d be for it, but you don’t.

          • Nate says:

            “Lots of ”

            Very informative!

        • Bart says:

          Again (sigh): not the same birds.

  32. Midas says:

    Have Mike Fl#nn and JDH#ffm#n been blocked?

  33. Dan Pangburn says:

    According to the alarmists, water vapor increase depends only on temperature increase of the liquid surface water and has increased 0.88% per decade. Actual measurements show it to be 1.54% per decade. This proves WV, not CO2, drives temperature. WV increase is self-limited. http://globalclimatedrivers2.blogspot.com

  34. Chris says:

    The ~65 year AMO cycle is just a rough estimate. Some of the negative / positive AMO phases have lasted 70 years:

    https://agupubs.onlinelibrary.wiley.com/doi/10.1029/2004GL019932

    • David Appell says:

      60-yr trend for NO.AA global surface temperature

      = +0.16 C/decade

      = 0.95 C of warming over that time.

      • Bart says:

        So?

        You seem to miss the point. The long term trend was locked in well before the purported run-up in CO2 concentration. The deviation from that long term trend is, or was until very recently, cyclical.

        The apparent acceleration in warming of the latter decades of the 20th century was merely the positive portion of the cycle, and not due to rising CO2 as the narrative claims. In the 2000’s, it petered out, and we have been in a holding pattern, with departures wholly due to the PDO.

  35. David says:

    “Spreading sunshine over the entire surface of earth at once, the foundation of climate physics” Every single climate scientist that produced reports for the IPCC based their calculations on flat earth psychics and yet expect to be taken seriously.

    http://funnel.sfsu.edu/courses/gmo405/reading/TheEarthSystem_3rdEd_Chpt3_KumpKastingCrane_2010.pdf

  36. David says:

    When it comes to calculating the amount of sunlight that hits the earth yes, half of it is in darkness, not that you need physics to tell you that, although physics may help you determine that by spreading it over the entire surface of the earth at once you are diluting it.

  37. David says:

    Point of fact, the graph proves a decline from 1998 and 2016, so we have a cooling and not a heating.

  38. David says:

    That’s quite ironic – you are asking what you refer to as a fool to provide the evidence of what the IPCC report states even though I provided the reference for it, clearly your inability to find it is indicative of your own stupidity but nonetheless here it is. You cannot believe for a moment it states what it does can you? It utterly destroys your alarmist concept of reality – Well, cupcake, that is how it is, suck it up!

    Please do not try throwing pathetic numbers at me, I may be inclined to post the fudging of the numbers evidence all the way back to climategate to the present day.

    Now back to the subject matter.. “NON-LINEAR”

    In climate research and modelling, we should recognize that we are dealing with a coupled non-linear chaotic system, and therefore that the long-term prediction of future climate states is not possible.

    https://archive.ipcc.ch/ipccreports/tar/wg1/505.htm?fbclid=IwAR3hEnrlDDYJUTtUAm-OclRBlvzLAtuK2v9Z6gJyjWnI9lYBBeyt5mWA_yU

    • David Appell says:

      David, you’re saying a lot of crap above, and not responding to any questions about it.

      • David says:

        It would appear you are getting angry? Now you nor your insulted ego have the capacity to do anything about that so it may benefit you to use a more polite tone in your discussions with me.

        You allege I post a lot of crap but I have posted a quote from an IPCC report, now if you consider that to be crap so be it but it is obvious from the above that you requested that I quote the IPCC in full, which I did and additionally I provided the relevant section from the report for your consideration, having read and verified that the report does in fact state “In climate research and modelling, we should recognize that we are dealing with a coupled non-linear chaotic system, and therefore that the long-term prediction of future climate states is not possible.” You do not come back an acknowledge the fact so let me just rub it into your arrogant face, it states ” NON-LINEAR “, You then come back and attempt to change the subject matter by returning with Bulls testicles of which I have no interest. So in conclusion – unless you have anything more to add that moves this discussion forward in any meaningful manner:

        1. IPCC Climatologists fundamental basis of flat earth physics is used for their Greenhouse “theory”.

        2. CO2 magically creates it’s own climate.

        3. The IPCC has never considered any solar physicists reports within any of their own published reports. Despite the fact that it is the Sun that drives Earth’s climate.

        4. The IPCC accept and have clearly stated that “In climate research and modelling, we should recognize that we are dealing with a coupled non-linear chaotic system, and therefore that the long-term prediction of future climate states is not possible.”

        5. The above statement by the IPCC smashes your concepts and disrupts your own reality so much that your only response is one of significant cognitive dissonance.

        6. You now wish to discuss ancient climate having lost every single point you have raised having been faced with facts.

        7. You acknowledge, accept and defend the fact that climate scientists use flat earth physics.

        I have to ask, are you a very special kind of stupid ? Flat Earth Physics! LOL.

        • David Appell says:

          I’m not going to try to respond to all this scientific crap.

          Pick one.

        • Midas says:

          (1) What do you see as the mathematical difference between half the earth collecting sunlight for half a day and the entire earth collecting sunlight for a full day?

          (2) A statement that can’t be addressed due to its deliberate meaningless nature. Keep comments scientific if you expect them to be addressed.

          (3) You can’t factor in something that is not predictable. No solar scientist knows what the sun will be doing. Yet they DO know that the difference between the forcing of the Maunder minimum and that of the 20th century high point equates to a temperature difference of only 0.4C. (You will now deliberately conflate the short-lived Maunder minimum with the much longer lasting little ice age.)

          (4) Again, why did you misrepresent the IPCC by terminating the quote early?

          (5) mere bluster

          (6) more bluster

          (7) a repeat of (1)

          • Midas says:

            Actually, I stated (1) incorrectly. I’ll see if you can figure out what I meant.

          • bobdroege says:

            Man, averages give me a headache too.

          • gbaikie says:

            “Midas says:
            October 3, 2019 at 12:25 AM
            (1) What do you see as the mathematical difference between half the earth collecting sunlight for half a day and the entire earth collecting sunlight for a full day?”

            What is average temperature of a house that has the furnace on 6 hours a day.

            Earth is not equally heated for 12 hours and cooled for 12 hours, rather Earth has peak hours of sunlight.

            If there is no mathematical difference, it would not matter when you heated a house or heated a planet.

            Let’s say you only heated a house only between the hours of 9 am and 3 pm every day {including in summer}.
            Same heat added for 6 hours per day at same time of day.
            And to measure the temperature of your house, you measure when it’s the warmest and the coolest and average the numbers.

            Would measuring it such a fashion be good way to measure the average temperature of your house?

            What happens if picked different hours of having the furnace on, say 9pm to 3 Am. Would that change the average temperature.

            Or at say if had thermostat which only turned on furnace when temperature dropped to some temperature {but total must equal 6 hours a day.

    • bobdroege says:

      Just because this statement is true

      “In climate research and modelling, we should recognize that we are dealing with a coupled non-linear chaotic system, and therefore that the long-term prediction of future climate states is not possible.”

      Doesn’t mean that the future global temperature is not predictable within a defined margin of error.

      It means that future climate states like ENSO, AMO, and PDO among other climate states are not predictable.

      It certainly does not mean that predicting that if you increase CO2 in the atmosphere the climate is going to respond by warming is not possible.

      • David Appell says:

        bobdroege says:
        Doesnt mean that the future global temperature is not predictable within a defined margin of error.

        This sure looks quite predictable:

        http://www.dandebat.dk/images/1466p.jpg

        And if it’s not — how it that any better?

      • Aaron S says:

        Bdgwx and Dave,
        Do you think orbital forcing can fully explain the climate cycles or CO2 patterns? (https://www.researchgate.net/figure/Graph-depicting-orbital-variations-solar-energy-changes-and-resulting-glacial-cycles-as_fig2_264397551).

        There is clearly an internal dynamic that drives the periodicity of climate beyond orbital paramaters (look at 400k yr peak vs solar forcing in the link).

        Regarding that nature paper: yes if you assume the CO2 sensitivity is correct and their model is correct, then they explain the transition. But those are big IFs.

        “The long-term CO2 decrease leads to the initiation of Northern Hemisphere glaciation and an increase in the amplitude of glacial-interglacial variations, while the combined effect of CO2 decline and regolith removal controls the timing of the transition from a 41,000- to 100,000-year world.”

        Isn’t there a clear decoupling between CO2 and climate that is inconsistent with the nature paper? Consider, last interglacial (~120k yr ago) CO2 peaked under 300 and Earth had >6m higher sea-level indicating significant loss of land ice and significant global warming. The global warming clearly occurred without CO2 to explain the obvious warming to create such a large transgression. Whats up with that?

        Climate research could be like red meat, Piltdown man, String theory, Mitochondrial Eve, Lamarckism…. Science is not infallible. Models are a hypothesis and uncalibrated models are a real risk. The best data to describe the causal relationship between CO2 and warming for climate sensitivity is occurring right now between Satellite data and atmospheric CO2. It is showing lower sensitivity then almost all of the climate papers use- so only history can judge their validity. It is not to say that feedbacks to CO2 don’t have a lag, but again that is a hypothesis to be tested, and is inconsistent with the last intergalcial 120k yr ago.

        Personally, I think science journals that publish climate models with high CO2 sensitivity are about like a religious book at this point. Social science no doubt is a belief system- such a shame, Climate science is getting close because they are so reliant on uncalibrated climate models.

        • David Appell says:

          Aaron S says:
          Do you think orbital forcing can fully explain the climate cycles or CO2 patterns?

          No, of course not.

          It if could, scientists would have said so long ago, and there’d be a million papers about it.

          So many deniers have no clue at all about how scientists and science works.

          • Bart says:

            I am waiting to see that you do. You seem to think it consists of imagining what you think is real, and then collecting evidence consistent with your preconceived view.

          • Midas says:

            Bart
            The denial methodology in a nutshell.

          • Dr Roys Emergency Moderation Team says:

            BobdesbonddesMidas, please stop trolling.

        • bdgwx says:

          Orbital cycles are certainly important but they can’t FULLY explain the glacial cycles nevermind the rest of the paleoclimate record.

          • Aaron S says:

            So in summary, Orbital cycles are important but there are other natural drivers that control major climate cycles (both timing and amount of temperature change). I believe that we all agree.

            So the difference is that I have not eliminated one of those other poorly constrained mechanisms from contributing to the ~1C warming last century.

          • barry says:

            How hard did you try?

          • Dr Roys Emergency Moderation Team says:

            barry, please stop trolling.

    • Midas says:

      Why did you choose to terminate the quote at that point?

      • Dr Roys Emergency Moderation Team says:

        BobdesbonddesMidas, please stop trolling.

        • Midas says:

          Here you go again with that BS. With the departure of the other two, these types of comments (and your name itself) remain the largest source of trolling in this forum. Perhaps you would care to explain how asking why he changed the gist of a comment by terminating the quote early can be construed at trolling.

  39. Lou Maytrees says:

    “This makes September, 2019 the warmest September in the 41 year satellite record.”

    ruh roh

      • David Appell says:

        Why doesn’t this matter?

        • Loydo says:

          It will morph into the next stage of denialism.

          1. Not happening.
          2. Happening, but natural.
          3. Caused by us, but a good thing.
          4. Too late to fix, why weren’t we warned?

          I think the latest data point will bump a lot up to a 3. The idealogical backflip from 3 to 4 is going to be the difficult step, the Barts of this world will be tearing themselves apart. How sad.

          • Aaron S says:

            Loydo,

            You say
            “It will morph into the next stage of denialism.

            1. Not happening.
            2. Happening, but natural.
            3. Caused by us, but a good thing.
            4. Too late to fix, why weren’t we warned?

            I think the latest data point will bump a lot up to a 3.”

            It is hard to argue moderate warming is not a good thing given the continental configuration with so much of the land mass currently so far North and at a sub optimal latitude for biodiversity. The fear for Earth is from the extreme IPCC base case and the half above that. If we calibrate the models to the data, then looks like we are in for a 1.5C total warming. My bet is luke warming, and I am okay with that.

            Climate science has become a political ideology, you can tell because if it were empirical or logical, the progressive left would want to transition to nuclear (and ideally depleted nuclear technology) not useless wind and solar. All wind and solar do is assure a future with hydrocarbons. Ie the sheep follow the ideological leaders instruction and the instruction is what is in the best interest to grow wind and solar for the people invested in it.

          • Midas says:

            EVERYTHING conservatives believe is based on an ideology.
            The ideology that the only thing that matters is their little cubicle of space-time.

          • Stephen P Anderson says:

            Midas,

            What is conservative ideology?

          • gbaikie says:

            –Stephen P Anderson says:
            October 3, 2019 at 9:39 AM
            Midas,

            What is conservative ideology?–

            Depends.
            If government wants to share your lawn.
            Then, it’s “get off my lawn”.

            With Iran, they used to be a large empire.
            So, a conservative Iranian ideology want to be return to greater empire.
            Same with the Russians. And the Chinese.

            But with western conservatives, generally the ideology points towards maintaining “social institutions” {govermments/churches/clubs/etc and broadly social systems which help organize and maintain society}.

          • Midas says:

            Did you choose not to read my comment where I explained the core conservative ideology about which all of their other ideologies are based?

          • Midas says:

            …. for SPA …

          • Stephen P Anderson says:

            Midas,
            I can’t say that I follow every comment you post on this blog. Difficult to believe I know.

          • Midas says:

            So you didn’t read my comment that you replied to.
            Thanks for admitting to trolling.

          • Dr Roys Emergency Moderation Team says:

            BobdesbonddesMidas, please stop trolling.

      • David Appell says:

        Bart says:
        Meh.

        Naked denialism in its purest form.

    • Midas says:

      Hahaha – two years ago you people were blaming warm months on the fact that there LOTS OF hurricanes. Apparently you are permitted to make up any BS that sounds good.

    • Dr Roys Emergency Moderation Team says:

      BobdesbonddesMidas, please stop trolling.

  40. captain droll says:

    Well well well ! Let’s check:
    1 SOI still negative
    2NINO34 and NINO12 have just crawled back into positive territory (goodbye La Nina)
    3 Global average SSTs slowly rising
    4 Warmest September UAH value on record
    and
    5 It appears several abusive denialist trollers have, at last, been banned from this site.

    What a beautiful morning!

  41. ren says:

    The temperature of the south eastern tropical Pacific remains low and there is little chance of change. This means wind along the equator in the Eastern Pacific Ocean.
    https://www.ospo.noaa.gov/Products/ocean/sst/anomaly/anim.html
    https://www.ospo.noaa.gov/data/sst/50km_night/2019/sstw.9.30.2019.gif

  42. David Appell says:

    Bart, do you know about the spectral evidence for AGW?

  43. Mackey says:

    Warming from CO2 doubling, according to the true experts, to be only 0.5degC.

    https://www.sciencetalks.nl/the-physics-of-doubling-co2-full-version/?fbclid=IwAR1DlDJ22yc_uk_5vq1cS_XtisOkyGgJfwOciJdU5ltA3IpQjCcLMJjvDKg

    Decline in solar activity from solar cycle 21,22,23,24 and predicted to decline through 25, 26 and 27, we crossed the threshold for a Grand Solar Minimum already which is defined by several declining solar cycles.

    Where do you get off that the 00.04% OF co2 actually does anything?
    of which only 00.01% mankind is responsible for, how could you possibly believe that has more of an impact on climate than the Sun? You sit arguing over ridiculous figures and graphs rather than consider the obvious reason for climate that being the sun.

    Being as it is the Sun that drives climate unless you are a solar physicist you are not even qualified to have an opinion. – go a find a solar physicist that agrees with your notion that CO2 in anyway drives climate, you won’t find one.

    None of you have any idea what the solar irradiance was 400 years ago, you have no idea what the albedo percentage was back then that resulted from the increased cloud cover caused by cosmic rays.

    You write as if you know something because you quote figures, reports and papers, you’re repeaters – you do not contribute you simply repeat and then argue over that.

    For 4.5 billion years the Sun has driven earths climate. CO2 has had no noticeable effect on climate in 600 million years, until 30 years ago, when carbon tax was invented.

    You stupid people.

    • studentb says:

      Some interesting statistics.

      If you plot the UAH monthly data and find the best linear fit to the data, then extrapolate to the year 2100, the warming then would be about +1.4 degC.

      However, if you find the second order polynomial fit (i.e. a non-linear fit taking into account that the rate of warming may be accelerating), the warming at 2100 could be about +2.0 degC.

      Maybe some comfort for the luke-warmists?

    • Loydo says:

      “Decline in solar activity from solar cycle 21,22,23,24 and predicted to decline through 25, 26 and 27, we crossed the threshold for a Grand Solar Minimum already which is defined by several declining solar cycles. Blah, blah blah…”

      Arm wave much?

      Despite that the temps keep on a climbin’. Even according to this site – the coolest outlier. Maybe the human caused 40% increase in CO2 concentration is a thing after all.

    • Bindidon says:

      Mackey

      Oh thanks for the nice insult.

    • Bindidon says:

      Mackey

      And apart form your stupid insult: what lets you think that Frans van den Beemt is right?

      My guess: his meaning perfectly matches your narrative.

      You are yourself nomore than a gullible, naive follower of such people.

      Another repeater…

    • barry says:

      It’s such a relief to get the down low from the “true experts.”

      But disconcerting when the trues experts turn out to be just one guy.

      I’m sure his view is oracular. Anything that goes against the status quo is perforce the truer truth, amIright?

    • Dr Roys Emergency Moderation Team says:

      barry, please stop trolling.

  44. Mackey says:

    Here is a scientific report from a Solar Physicist who states solar activity will decline throughout the next three solar cycles. She has stated we will experience Maunder Minimum conditions, so the earth is not going to get getting any warmer during the next 35 years , it’s going to be getting colder and that is because it’s the Sun that drives climate!

    Do want to disagree with her?

    https://www.nature.com/articles/s41598-019-45584-3

    • Loydo says:

      When do you expect your cooling to kick in?

        • Mackey says:

          “The forecast for the next solar cycle says it will be the weakest of the last 200 years. The maximum of this next cycle measured in terms of sunspot number, a standard measure of solar activity level could be 30 to 50% lower than the most recent one. The results show that the next cycle will start in 2020 and reach its maximum in 2025.” (NASA)

          https://www.nasa.gov/feature/ames/solar-activity-forecast-for-next-decade-favorable-for-exploration

        • Midas says:

          You’re not going to justify cooling by referring to just one country are you?

        • Loydo says:

          Um, in case you hadn’t noticed, we’re not talking about the weather or even the seasons.

          “When do you expect your cooling to kick in?”
          Let me re-phrase this for you.

          When do you expect your cooling to to have taken the global anomaly back into the blue?
          https://www.nsstc.uah.edu/climate/2019/september/tlt_201909_bar.png

          • gbaikie says:

            “When do you expect your cooling to to have taken the global anomaly back into the blue?”

            Good question, but is question about the blue of around 2012 or 2008, or asking reversing the +100 year trend, require a much longer period of blue.
            Obviously something like 2008 is not possible within a year because 2008 blue lasted more than a year.

            It’s seems something like 2008 blue in possible within several years, though quite possible it does not begin within the next year. A spike {but not necessarily the beginning of 2008 blue] is fairly likely within a year.
            And not getting something like a 2008 blue within 10 or 20 years is
            unlikely, as is it unlikely starting a 2008 blue next month and it being much longer {and much deeper] than 2008 blue- if that happenned it would be extending the pause, rather we are condition similar to the Little Ice Age. Or I think any thing like the Little Ice age requires 50 to 100 year to “begin”. Or can’t be in a Little Ice Age, Ie, cooling the entire ocean and lowering of sea levels within 50 years.

          • gbaikie says:

            re:” Or cant be in a Little Ice Age, Ie, cooling the entire ocean and lowering of sea levels within 50 years.”

            If humans want cool conditions like the Little Ice Age, and want to spend about 1 trillion dollar, we could do it within 50 years.
            It’s possible to do it within 10 years. But turning on dime with 1 trillion dollar of investment capital, requires huge management skills {not chance a government could do it- merely having a government fund it, would be political miracle, never seen before- much harder in every respect than the Apollo program}> Or 20 years would be easier, if it involves a government funding it.
            {Of course the US private sector is what allowed US to beat the Soviets to the Moon. Or that was the type of capability that the Soviets lacked or how the Soviets started in the lead, but predictably, lost.}

    • Bindidon says:

      Mackey

      Oh nooo! How is that possible?

      One more novice commenter coming around with the old Zharkova double dynamo stuff, thinking we wouldn’t know anything about that lady…

      Mackey: I propose that you search for Dr. Leif Svalgaard, Bob Weber or Javier (who regularly publishes guest posts at WUWT and Climate Etc.

      These people have contradicted Zharkova’ ‘predictions’ to the bone marrow.

      And feel free to start with this:

      Zharkova et al 2019, A Science Disaster
      http://landscheidt.info/?q=node/346

    • bobdroege says:

      Apparently you disagree with her because she is not predicting cooling due to the impending solar minimum!

      “Based on the growth rate of 0.5 C per 100 years for the terrestrial temperature since Maunder minimum, one can anticipate that the increase of the solar baseline magnetic field expected to occur up to 2600 because of SIM will lead, in turn, to the increase of the terrestrial baseline temperature since MM by 1.3 C (in 2100) and, at least, by 2.53.0 C (in 2600).”

    • barry says:

      Every months someone waltzes in here with a prediction of imminent cooling.

      Every now and again one of these wishful thinkers will be right for some period of time, because temps go up and down even if the underlying trend is warming.

      Wiser heads recognise the noise that obscures the signal.

      • Stephen P Anderson says:

        Barry,

        Pretty silly statement. The Earth is four billion years old. No one knows when the trend is going to change. Only that it will. And, it will be random.

      • bdgwx says:

        SPA, so one of the fundamental tenants of science is that you construct hypothesis and ultimately theories that make predictions so that they can be tested and falsified. The ability to make predictions is also what makes the theory useful. So aside from the fact that your model can’t be tested or falsified it also wouldn’t be useful. So why should we choose your model?

  45. Midas says:

    Why is Chrome showing this site as “not secure”?

    • barry says:

      Perhaps because it’s not secure? How many other browsers did you test to see if Chrome produced an anomalous result?

  46. Aaron S says:

    I’m thinking the PDO is in a positive phase and El Nino is dominating.

  47. Mackey says:

    I am familiar with those who attempted to get her paper retracted somewhat unsuccessfully I might add, and I also refer you to her response that rebutted those unsuccessful attempts: (Nice try though)

    ⦁ The summary of the paper results.

    First of all, let us summarise what we have reported and at what stage the Solar Inertial Motion (SIM) and the variation of the Earth distance from the Sun came into the paper text.

    The facts we found in the paper without any reference to solar inertial motion (SIM):
    ⦁ Our summary curve derived from the solar magnetic field measured by ground-based observatory WSO and applying PCA as described by Zharkova et al, 2015, SR, was expanded to 120 thousand years (Fig. 1).
    ⦁ After we presented the summary curves for 10 thousand years, we found that each 5 grand cycles were repeated many times (Fig. 2, top plot).
    ⦁ Then we run over the summary curve an averaging filter of 1000 years, suppressing the large oscillations of 11 year cycle. This helped us to detect the oscillations of the baseline (zero-line) of magnetic field with a period of 2000-2100 years (see Fig. 2, bottom plot). Note, these oscillations by one and half order of magnitude lower than the summary curve 11 years oscillation (compare axis Y for these two curves).
    ⦁ In the past 120 000 years there were about 60 these baseline oscillations (combination of Fig. 1 and Fig. 2).
    ⦁ In order to understand a nature of these oscillations we tested the current cycle of 2000 years and discovered that its minimum was during a Maunder Minimum and it is growing now until 2600 as shown in Fig.3.
    ⦁ As also shown in our Fig. 3, the current 2000 year cycle correlate very closely with Solanki curve, which in our plot we simply divided by factor 10 to separate it from our curve as they are virtually inseparable.
    Our curve also follow the general trend of solar irradiance derived by Lean et al, 1995, 1998, 2000
    ⦁ Lean, J., J. Beer, and R. Bradley. 1995. Reconstruction of Solar Irradiance Since 1610: Implications for Climate Change. Geophysical Research Letters, v.22, No. 23, pp 3195-3198, December 1, 1995.
    ⦁ Lean, J., and Rind, D. 1998. Climate forcing by changing solar radiation. Journal of Climate 11, 30693094.
    ⦁ Lean, J. 2000. Evolution of the Sun’s Spectral Irradiance Since the Maunder Minimum. Geophysical Research Letters, Vol. 27, No. 16, pp. 2425-2428, Aug. 15, 2000.

    Fig. 1. Solar irradiance since 1610 as reconstructed by Lean et al (1995) and Lean (2000). The thin line indicates the annual reconstructed solar irradiance, while the thick line shows the running 11 average.

    ⦁ Furthermore, this current curve of baseline magnetic field oscillation over 2000 years is also found to correlate very closely with Akasofu’s baseline temperature variation (increase from 18 to 20 century) ( a straight line) (see Fig.3 in our paper). Note, a straight line in the Akasofu curve is over-plotted with real temperature variations showing sharp maxima and minima caused by various terrestrial and solar activity processes.

    Solar Inertial Motion and its link to baseline magnetic field oscillation
    Secondly, we discuss the relation of the baseline magnetic field variations to solar inertial motion (SIM)
    Only after we established the features reported in items 1-7 above and shown in Fig. 1-3, we started looking what can cause them. This is when our attention came to solar inertial motion (SIM) and the numerous papers on it from 80s until recently (see the list of authors and citations from their papers below).
    ⦁ Hence, we discovered from the papers of many authors who did SIM calculations that the Sun moves within a circle of 4.3 solar radius (696 000 km), that results in the magnitude of the maximum displacement of the Sun from a focus of the terrestrial orbit (supposedly to be in the centre of the Sun) of about 0.02 AU. Again, we used what people calculated for SIM decades before us (see the list of authors and citations from their papers below).
    ⦁ Furthermore, we found, again from the papers by others investigating SIM, that Sun moves in the SIM circles which radius increases like in a cone shown in Fig. 4 (right plot). Hence its radius of SIM is at first small (when it is minimum of 2000 cycle) and for 1000 years it is increasing in time approaching the maximum radius (and baseline magnetic field oscillation) near the base of the cone.
    ⦁ Then the SIM starts returning back to the smaller circles (Fig. 4 right plot) for another 1000 years approaching minimum of the circle of SIM, that also coincides with the minimum of a baseline magnetic field oscillation.
    ⦁ The only thing we did is some general analysis and evaluation how would change the Sun-Earth distance, and thus, magnetic field and/or solar irradiance if the Sun moves closer or further from the different parts of the Earth orbit. This is also would be valid for the orbits of other planets.
    ⦁ Given a close correlation between the solar irradiance curve by Solanki et al, 2011 and by Lean et al, 1995-2000 (Fig. 1) and the temperature increase on the Earth this allowed us to logically link the items 1- 7 items with items 8 – 12.

    ⦁ About Solar Inertial Motion (SIM)
    As you see, so far we did not calculate SIM, we used the calculations by others, which we thought are known to all the scientists given the numerous papers published about 20- 60 years ago (see Appendix 1 for some references and citations from the papers).
    However, as the discussion in Pubpeer below our paper has shown, this was not the case for some contributors. On this reason, we have investigated the process of SIM very closely and found a few very important points about SIM, which can help to resolve the puzzle and answer some specific comment the Deputy Chief Editor of Scientific Reports wanted us to clarify.
    ⦁ First point we discovered is that each author investigating SIM stated that SIM is not a Keplers motion (Jose, 1965, Newhall et al, 1983), it is a different motion caused by perturbations by gravity from larger planets (see also Appendix 1).
    For example, here are a citation from Newhall et al, 1983, A&A, 125, 150 https://ui.adsabs.harvard.edu/abs/1983A%26A…125..150N/abstract who stated in the paper (and we cite) The first study was published by Jose (1965). He noticed this sentence in Newtons Principia (see Cajori (1934)):. . . since that centre of gravity centre of mass of the solar system) is continually at rest, the Sun, according to the various positions of the planets, must continually move every way, but will never recede far from that centre.
    Hence, Solar inertial motion is not following Keplers law, it is a different kind of perturbation motion following Newtons law of gravitation.
    ⦁ Second point we discovered is that the SIM is defined by at least 4 large planets: Jupiter (J), Saturn (S), Uranus (U), Neptune (N) (see Appendix 1).

    ⦁ Third point we discovered is that most researchers believe that the planets rotate about the barycentre while the Sun wobbles about it. This also applicable to other stars (see the link below and citation of the text from it).
    For example, NASA webpage, which includes only the effect of Jupiter https://spaceplace.nasa.gov/barycenter/en/ also describes the motion about the barycentre Sun-Jupiter (see Fig. 2)

    Fig. 2. Barycentre of the motion of Jupiter around the Sun and the Sun about the barycentre (as accepted by NASA and JPL ephemeris).

    Moreover, the NASA webpage clearly states that (and we cite)
    our entire solar system also has a barycenter. The sun, Earth, and all of the planets in the solar system orbit around this barycenter. It is the center of mass of every object in the solar system combined.
    Our solar systems barycenter constantly changes position. Its position depends on where the planets are in their orbits. The solar system’s barycenter can range from being near the center of the sun to being outside the surface of the sun. As the Sun orbits this moving barycenter, it wobbles around.
    This wobbling effect is used in detecting exoplanets. Detecting a star’s wobble is one way to find out if there are planets orbiting it. By studying barycentersand usingseveral other techniquesastronomers have detected many planets around other stars!

    As you can see the NASA page clearly states that all the planets rotate about the barycentre while the Sun wobbles about it as well.

    ⦁ Fourth point we discovered is about the essential difference between how the JPL ephemeris are calculated for the Earth+Moon (and Venus) motion about the Sun and about the barycentre.

    With a help of specialists, we obtained and plotted the JPL ephemeris for the rotation of Earth+Moon system in the 1800-1900 about the Sun (cyan curve) and about the barycentre of the solar system in 19th century (magenta line) (see Fig. 3, top plot below).

    It is clearly seen that the Earth and Venus orbits oscillate with the variable orbit parameters about the barycentre, while their orbits remain nearly constant in a rotation about the Sun.

    Fig. 3. Earth orbits (top) and Venus orbits (bottom) about the Sun (Earth – cyan line, Venus red line) and about the barycentre (Earth – magenta line, Venus black line). Y axis shows the orbit aphelion (top) and perihelion (bottom).

    We checked the document how the JPL ephemeris are calculated for the Earth orbits about the Sun following Folkner et al, 2014, The Planetary and Lunar Ephemerides DE430 and DE431, IPN Progress Report 42-196 February 15, 2014. It states (and we cite) The modelled accelerations of bodies due to interactions of point masses with the gravita- tional field of non-spherical bodies include: (a) the interaction of the zonal harmonics of the Earth (through fourth degree) and the point mass Moon, Sun, Mercury, Venus, Mars, and Jupiter; (b) the interaction between the zonal, sectoral, and tesseral harmonics of the Moon (through sixth degree) and the point mass Earth, Sun, Mercury, Venus, Mars, and Jupiter; (c) the second-degree zonal harmonic of the Sun (J2) interacting with all other bodies.

    This confirmed our suspicion that for the Earth orbit about Sun the JPL ephemeris are calculated considering the effects of only Moon, Mars, Venus, Jupiter and 300 asteroids and did not include not of the other three large planets Saturn, Neptune and Uranus required to account for SIM (see Appendix 1).

    The joint perturbation of these four planets (Jupiter, Saturn, Uranus and Neptune) would further affect the rotation of the Earth about the Sun, surely deviating from the semi-SIM Earth orbits presented in the comment 15 and 72 below our paper. We envisage that the newly calculated Earth orbits will be closer to the orbits about barycentre including SIM shown in Fig. 3 by magenta line.

    We appreciate that integration of all contributions to the Earth orbit is a complex task, especially for the Earth+Moon system. However, the fact is that the Earth rotation about the Sun has not been done consistently because these JPL ephemeris calculations of the Earth orbit about the Sun did not include into the integration the effects of Uranus, Neptune and Saturn in addition to Jupiter already included. However, Uranus, Neptune and Saturn together with Jupiter define the real position of the barycentre of the solar system and the Earth motion about the Sun.

    ⦁ Fifth point we discovered is that even for the JPL ephemeris of the Earth+Moon motion about the Sun with the effect on by large planet Jupiter (and some smaller planets) we managed to show that the the distance between the Earth and Sun keeps decreasing from 1700 to 2600 by about 0.004 au (induced only by gravitation from Jupiter).

    Even for these cyan JPL orbits with only Jupiter effects, which seems to be unperturbed we calculated the variations of the Earth-Sun distance over the period of 1700 to 2600 shown in Fig.

    Fig. 4. Earth-Sun distance variations in time for the Earth rotation about Sun derived from JPL ephemeris for the Earth+Moon rotation about the Sun.

    It can be seen that this distance is steadily increasing since 1700 until 2600 by a magnitude of up to 0.004 au.

    So even in the current JPL approach to the Earth orbits affected by Jupiter the Sun still moves closer to the Earth in the next 600 years, as it did in the past 400 as we suggested in the paper.

    Moreover, if all large planets are added to the Earth motion about the Sun, this would add a further displacement of the Earth to/from the Sun during the period of 2000 years, similar to that shown for Jupiter in Fig.4 above. And the summated displacements by all four planets can easily reach larger magnitudes close to those we evaluated in the paper.

    ⦁ Addressing the specific concerns 15 and 72

    Now we will address the specific concerns highlighted in the letter and comments 15 and 72 from pubpeer, for which we needed to do some additional research above using JPL ephemeris.

    Cont…

    • Mackey says:

      Editor. Specifically, concerns have been raised regarding the interpretation of how the earth-sun distance changes over the time frames presented in your article. In particular a concern has been noted that, despite the fact that it is true that the distance of the Sun in related to the Solar System barycentre (SSB) does vary, the Earth also moves around the SSB in a commensurate fashion ensuring that the semi-major axis of earths orbit around the Sun remains approximately constant over the time frames discussed your paper.

      Answer. (see section II above). The statement that the Earth distance to the Sun is approximately constant is not exactly correct. What Dr. Rice et al suggest that our planet Earth orbit wobbles together with Sun just to keep the distance from the Sun to Earth constant is a very puzzling suggestion, to say the least. We addressed this concern in two ways.

      First, we used the JPL ephemeris for the rotation of Earth+Moon system about the Sun (cyan curve) and the JPL ephemeris for their about the barycentre of the solar system in 19th century (magenta line) (see Fig. 3 above).

      It is clearly seen from Fig. 3 that the Earth and Venus orbits oscillate about the barycentre with the variable orbit parameters as we suggested, while their orbits remain nearly constant in a rotation about the Sun. This difference is caused by the missed effects on the Erath orbit calculation about the Sun caused by three larger planets: Saturn, Neptune and Uranus (see the points 1- 4 discussed in the section about SIM in section II).

      Second, in point 5 we presented the Earth-Sun distance plot in Fig. 4 derived from the current JPL ephemeris for Earth orbit about the Sun considering only large planet Jupiter over the time of 2000 years from 1700 till 2600.

      So even in the current JPL approach to the Earth orbits affected by Jupiter the Sun still moves closer to the Earth in the next 600 years, as it did in the past 400 as we suggested in the paper.

      Moreover, if all large planets are added to the Earth motion about the Sun, this would add a further displacement of the Earth to/from the Sun during the period of 2000 years so that the summated displacements induced by all four large planets can easily reach larger magnitudes close to those we evaluated in the paper.

      ⦁ Editor. I appreciate that you have already engaged in a discussion on some of that on PubPeer. We note that some of the concerns raised there remain unaddressed – we hope you can respond specifically to criticism included in PubPeer comment #15:
      https://pubpeer.com/publications/3418816F1BA55AFB7A2E6A44847C24#15
      Comment 15
      It seems pretty clear that there is an assumption here that a difference in the relative position of the Sun with respect to the SSB directly translates to a change in the Earth-Sun distance which is simply not true. Even if you ignore basic principles of orbital dynamics which tell us why the key orbital parameters of the Earth remain effectively constant on these timescales any simulation dataclearlydemonstrates the absence of evidence for the claims of changing peri and apo-apsis made here.
      I attached what I hope is another way for Dr Zharkova to visualise what Dr Rice is trying to convey.

      This figure shows the per-orbit (Earth orbit) averaged position of both the Sun and the Earth with respect to the solar-system barycentre at 0,0 for the years 2019-2059. the Sun is undergoing the same motions as the paper describes, and indeed it does so with a maximum magnitude of approximately the claimed 0.02 AU. What the author has neglected is the fact that the exact same motion is seen by the Earth such that, on these timescales, the Earth-Sun distance at any time is unchanged. NB. In case it isn’t clear the reason why the two do not exactly overlap is simply because the Earth series shows the centre of the orbit but the Sun is located at a focus of the orbit.
      The source for this is JPL Horizons ephemerides which I think we can agree is an extremely reliable simulation for this timeseries. Incidentally, this dataset also agrees with the established rate of change of the eccentricity of the Earth’s orbit.
      Authors answer to the comment 15.
      The author suggests that the Earth plant wobbles its orbit along with the Sun, which follows SIM. I doubt that the Earth orbit is wobbling orbit as it is shown in this comment.
      This wobbling happens (we refer to section II, points 1 and 2) because the calculations presented in this comment 15 were done considering the point mass of Earth, Sun, Mercury, Venus, Mars, and Jupiter (Folkner et al, 2014, The Planetary and Lunar Ephemerides DE430 and DE431, IPN Progress Report 42-196 February 15, 2014) and not considering other three large planets (Saturn, Neptune and Uranus) required for the correct calculation of barycentre position and SIM .
      This approximation is not consistent with solar inertial motion as per document describing the JPL ephemeris calculated for the Earth orbits about the Sun. We are confident that if included into JPL ephemeris, the joint perturbation of these four planets would affect the rotation of the Earth about the Sun deviating from these semi-SIM Earth orbits presented in this comment and flowing closer the orbits about the barycentre shown in Fig. 3 by magenta line.
      Therefore, the answer to this comment is that the presented calculation of the Earth+Moon orbit about the Sun is not consistent with SIM as it does not consider the other 3 large planets besides Jupiter.
      This is why their Earth orbit in this comment follows the wobbling Sun in its SIM instead of moving on its own orbit about a barycentre as one would expect according to NASA webpage (section II, point 3) and our logical arguments.

      ⦁ Editor. the comment #72:
      https://pubpeer.com/publications/3418816F1BA55AFB7A2E6A44847C24#72

      Comment 72
      This is a truly fascinating discussion thread. However, there is a huge problem of people talking past each other. It is quite clear that Dr. Zharkova is not addressing the primary objection being raised. But it is not at all clear whether this is because she does not understand the objection or because she refuses to recognize it.
      It seems clear that Dr. Zharkova believes the earth’s orbit is fixed with respect to the solar system barycenter, and so when the sun moves with respect to the solar system barycenter this changes its distance to earth. Others suggest that, as succinctly stated elsewhere,”the Earth travels around the solar system barycentre with the Sun, not independently of the Sun.”
      Perhaps Dr. Zharkova can explain the theoretical or empirical basis for her view, which is clearly contradicted by the simulations already described above in#15.
      Full quote: “The Earth orbits the Sun-Earth two-body barycentre, which is close to the centre of the Sun because of the enormous mass ratio. The Sun-Earth system orbits the SS barycentre, mostly affected by Jupiter with a period of 12 years effectively a three-body system. The Sun-Earth system has an orbital period of 1 year, the (Sun-Earth) Jupiter system has an orbital period of 12 years, and since the Sun-Jupiter mass ratio is about 1000 it is only a perturbation on the Sun-Earth two-body system. So the Earths distance from the Sun does not change with an orbital period of 12 years, as your Mercury6 calculation showed correctly. It is incorrect for that paper to claim that since the Earth orbits the SS barycentre, whilst the Sun also does so, and then claim that because the Suns motion exhibits changes in position of up to 0.02 AU relative to the SS barycentre, this must lead to changes in solar radiation received at Earth. The Earth travels around the SS barycentre with the Sun, not independently of the Sun.”
      Perhaps a cartoon would help focus the area of disagreement. See below.
      Source = quoted comment on ATTP website (https://andthentheresphysics.wordpress.com/2019/07/07/nature-scientific-reports/).
      Answer to comment 72.
      I am addressing now the primary objection raised about the solar inertial motion (SIM) being not Keppler motion but the perturbation caused by gravitational force as stated by Jose (1965) and Newhall et al. (1983) (see items 1-4 in section II above) and considered by all other authors listed in Appendix 1.
      Similar to the answer to the comment 15, the answer to this comment 72 is that the presented calculation of the Earth+Moon orbit about the Sun is not consistent with SIM as it does not consider the other 3 large planets besides Jupiter.
      This is why the Earth orbit shown in this comment on the right follows the wobbling Sun in its SIM instead of moving on its own orbit about a barycentre as NASA website and logics would suggest, wherever it is for the position of the four large planets.
      I doubt that the Earth orbit is such a wobbling one as it is shown in this comment. It might take time to run the planet orbit simulation consistent with SIM that proves this point but it will prove that the Earth does not follow the Sun as it is shown in this comment (and cyan line in Fig. 3 above), but moves on the orbits close to magenta ones shown in the Fig. 3.
      Furthermore, we have shown that the distance between Earth and Sun affected only by large planet Jupiter (in addition to Moon, Mars and Venus) is decreasing since 1700 by about 0.004 au (see section II item 5). This distance is expected to decrease even faster if the effects of the other three large planets (Saturn, Neptune and Uranus) are considered. This definitely, would increase the solar irradiance to the Earth over the next few centuries.

      • Mackey says:

        Another point towards the increased solar irradiance at the Earth because of SIM is related , to the detected variations of Earth axis towards the ecliptics plane as reported by Newhall et al, 1983. They reported the noticeable variations of the inclination of the Earth axis to the ecliptics that derived from JPL ephemeris even in the current approximation.
        We hope that we have fully answered the comments by the Editor and bloggers in Pubpeer.
        We also validated our results linking the change of solar irradiance and terrestrial temperature with the changes of the baseline magnetic field over 2000 years without involving any mechanisms explaining this link.
        We provided the evidences that the explanations of these links by SIM including a variable distance of the Earth from the Sun and inclination of the Earth axis to the ecliptics caused by SIM at different phases is very probable. We explained where the discrepancy occurred in the simulation of the Earth orbits about the Sun and about the barycentre presented by bloggers and those, which should be done consistently to include the effects of four large planets (Jupiter, Saturn, Neptune and Uranus) of the Earth orbit.
        Sincerely Yours,

        Valentina Zharkova

        Professor of Mathematics
        University of Northumbria
        UK

        Appendix 1. General comments about SIM derived from the papers.

        ⦁ From Fairbridge and Shirley, 1987, Solar Phys. 110, 191 https://ui.adsabs.harvard.edu/abs/1987SoPh..110..191F/abstract

        We employ the JPL long ephemeris DE-102 to study the inertial motion of the Sun for the period A.D. 760 2100. Defining solar orbits with reference to the Sun’s successive close approaches to the solar system barycenter, occurring at mean intervals of 19.86 yr, we find simple relationships linking the inertial orientation of the solar orbit and the amplitude of the precessional rotation of the orbit with the occurrence of the principal prolonged solar activity minima of the current millenium (the Wolf, Sprer, and Maunder minima). The progression of the inertial orientation parameter is controlled by the 900-yr great inequality of the motion of Jupiter and Saturn, while the precessional rotation parameter is linked with the 179-yr cycle of the solar inertial motion previously identified by Jose (1965).

        Solar inertial motion is not following Keplers law, it is a different kind of motion, a precession kind.

        ⦁ From Charvatova, JASR, 2007 https://ui.adsabs.harvard.edu/abs/2007AdSpR..40.1026C/abstract:
        The solar inertial motion (SIM) means the motion of the Sun around the barycentre or centre of mass of the Solar System. It has been studied since 1965 (Jose (1965), Fairbridge and Shirley (1987), Juckett (2000)). The significant properties of the SIM due to the giant planets (Jupiter (J), Saturn (S), Uranus (U), Neptune (N)) have been found in our Institute: e.g., Bucha et al. (1985), Jakubcova ́ and Pick (1987), Charva ́tova ́ (1988, 1990a,b, 1997a,b, 2000) and Charva ́tova ́ and Strˇesˇt ́ık (1991, 1994).
        The SIM is the significant phenomenon: The Sun moves inside the circular area which diameter is 4.34 rs (or 0.02 AU (Astronomical Unit) or 3.106 km), rs is the solar radius. When the Sun moves along the trefoil, the motion area is reduced up to 3.5 rs. The Sun returns at the trefoil part of its orbit always after 179 years. The ordered parts of SIM last about 50 years. The intervals of disordered (chaotic) SIM last about 130 years and differ one from another. (VZ comment do we really to believe that the Earth has the similar chaotic orbits?)

        Fig. 1 an example of SIM within the square of size 10^-2 AU showing a circle motions of the sun within 4.3x Rsun.
        ⦁ From Charvatova, 2009, New Astronomy https://ui.adsabs.harvard.edu/abs/2009NewA…14…25C/abstract

        See also https://motls.blogspot.com/2011/06/interview-is-climate-change-caused-by.html
        Relations between the solar inertial motion (SIM) and solar var- iability have been studied for more than 40 years. The SIM is the motion of the Sun around the centre of mass of the Solar System due to variable positions of the giant planets (J Jupiter, S Saturn, U Uranus, N Neptune). The first study was published by Jose (1965). He noticed this sentence in Newtons Principia (see Cajori (1934)):. . . since that centre of gravity (center of mass of the solar system) is continually at rest, the Sun, according to the various positions of the planets, must continually move every way, but will never recede far from that centre. The SIM studies have been made by means of statistics, by means of spectral analyses, by means of studying a behavior in the basic exceptional formations (e.g. during the trefoil intervals (Charvátová (1990b)), etc.
        Further investigations of the relations between the SIM and solar (also solar-terrestrial) variability were published, e.g. in Fairbridge and Hameed (1983), Bucha et al. (1985), Jakubcová and Pick (1987), Fairbridge and Shirley (1987), Charvátová-Jakubcová et al. (1988), Charvátová (1988, 1990a,b, 1995a,b,c, 1997a,b,, 2000, 2006, 2007), Charvátová and Strˇeštík (1991, 2007), Landsc- heidt (1999), Shirley et al. (1990), Shirley (2006), Zaquarashvili (1997), Juckett (2000, 2003), Paluš et al. (2000, 2007) and Wilson et al. (2007).
        Charvátová (1988, 1990a,b, 1997a) divided the SIM into two basic types : the ordered ones in a trefoil according to the JS motion order and the other disordered (chaotic). (VZ comment: If the Earth would wobbled orbits like these we could have much conditions on the Earth). (Note: the conjunctions of the planets J and S occur once every 19.86 years, with each successive conjunction advancing by 117.3 in a prograde direction.) In case of the ordered trefoil motion, the Sun orbits the centre of mass of the solar system along a loop (arc) about once every 10 years (JS/2). The Sun always returns to the ordered trefoil SIM after 178.7 years and this type of motion lasts about 50 years. The most disordered parts of the SIM correspond with the pro- longed (Grand) decreases of solar activity, over the last millennium known as the Spörer, Maunder and Dalton minima.

        ⦁ Paper by Richard Mackay, 2007, Journal of Coastal Research SI 50 955 – 968 ICS2007 (Proceedings) Australia ISSN 0749.0208 http://faculty.fgcu.edu/twimberley/enviropol/envirophilo/fairbridge.pdf

        Evidences that SIM is affecting the Earth directly.
        ⦁ Newhall et al, 1983, A&A, 125, 150 have calculated the planet orbits for 40 years and reported the change of the Earth eccentricity during this period, that is consistent with the magenta curve in Fig. 2. They also reported the noticeable variations of the inclination of the Earth orbit to ecliptics that is a consequence of the SIM.
        They stated in the paper The first study was published by Jose (1965). He noticed this sentence in Newtons Principia (see Cajori (1934)):. . . since that centre of gravity (center of mass of the solar system) is continually at rest, the Sun, according to the various positions of the planets, must continually move every way, but will never recede far from that centre.

        Solar inertial motion is not following Keplers law, it is a different kind of motion.
        ⦁ Fairbridge and Sanders, 1987, reported the change of inclination of the Earth axis to ecliptics (obliquity) during SIM motion of the Sun (that can cause the variations of terrestrial temperature).
        ⦁ Fairbridge and Shirley, 1987 described dynamical functions of SIM (Table III) and presented different types of the solar orbits gained during SIM. These orbits are so variable that it would be very strange if the Earth would follow these wobbling orbits.
        ⦁ Charvatova, 2007 reported that SIM is closely correlated with the geomagnetic index aa as per image below (top image in the figure below) and solar activity index (bottom image).

        Fig. 2 The links of SIM with the geomagnetic index aa (top image) and solar activity index of sunspots (bottom image).

        • Mackey says:

          Bindidon

          You simply was not expecting that was you? At this point in time you are on your knees. don’t try your BS with me.

          • Bindidon says:

            Mackey

            You can’t imagine how sad I am of arrogant, egocentric people like you, filling dozens of pages with their redundant teachy stuff.

            Why don’t you keep that off this site? Who needs that here, apart from yourself?

          • Mackey says:

            After Valentina addressed the issues raised on Pubpeer your Geoff Sharp significantly toned himself down, I could of course go back to Pubpeer and copy all of the issues raised by him but her response dealt with all of the issues raised during the attempt to get the paper retracted. Sharp is at liberty to produce his own paper of course but Valentina fully addressed all of the issues raised in her response, following which Sharp continued to seek clarification on a few minor issues that he failed to comprehend to which Valentina did not feel it necessary to respond to – it appears the Editor was also of the same view as the paper was not retracted.

            Do you think Sharp will produce a paper that contradicts Valentina’s? Because until he does, which he cannot I suggest you’re stuck with this: https://www.nature.com/articles/s41598-019-45584-3
            And NASA’s https://www.nasa.gov/feature/ames/solar-activity-forecast-for-next-decade-favorable-for-exploration
            And this https://www.swpc.noaa.gov/products/predicted-sunspot-number-and-radio-flux

            You appear to want to disagree with Solar physics, NASA and NOAA, You really are on the losing side with those flat earth climatologist.

    • barry says:

      Nobody need this copy/paste spam.

      Link to the references, provide a brief summary and let the conversation ensue. Overquoting merely indicates that you don’t have the chops to explain what’s going on.

      1 hour videos are crap, too. Make your point, reference it succinctly, and don’t imagine for a second that anyone will be impressed by reams of text. Reams of text indicate that the commenter hasn’t got the understanding to make it digestible themselves.

      Next…

      • Mackey says:

        I made my point, Valebtina responded in full to all the issues raised. No one asked you to read it, if you don’t want to read great, disappear somewhere else. I am interested in the reams of text, I am interested in her response.

        It’s almost as if none of you are normal human beings, I am sure it’s just an office set up by the Jesuits, for the most part you’re all just a needle injury.

      • barry says:

        If your point is that she responded, well done. A link would have sufficed.

        If your point is that her responses successfully rebut the challenges, then you have not made that point at all.

      • David Appell says:

        barry says:
        1 hour videos are crap, too. Make your point, reference it succinctly

        Yes. Thank you. Videos aren’t a substitute for data, evidence and research.

      • Dr Roys Emergency Moderation Team says:

        barry, David, please stop trolling.

  48. Midas says:

    I just picked one US state – Kansas because it is almost dead center, and compared their monthly temperature anomalies with the monthly AMO index. I got a correlation of only +0.04.

    I’ll do this again with global, US, UK and Australian data when I have time.

    • Scott R says:

      Midas,

      The recorded temperature data has stacked forcers from multiple time frames. You will have to look for that 80 period forcer by suppressing ENSO. You can see the AMO signal clearly in the Detroit, MI data. (my home town) The winter data is irrefutably tied to the AMO cycle, even better than summer.

      • Scott R says:

        *70 period forcer I meant

        • Midas says:

          WTF is a “70 period forcer”?

          • Scott R says:

            A complete cycle lasting 70 years which has some influence on the climate.

          • Midas says:

            Apparently you like to invent your own terminology.

            To “suppress” other variables is to artificially bolster the correlation. If it was possible to remove every variable from the calculation except the one you are interested in, in theory you would always get a correlation of -1, 0 or 1. The whole point of correlation is to find the contribution of that factor compared to other variables. Apparently you think ENSO goes away when the AMO switches state.

            For your climate division (Michigan 10 – Southeast lower) the correlation is +0.17.

          • Scott R says:

            Oh for crying out loud Midas. You can use moving averages to look for cycles on various time frames. There is NOTHING wrong with that. I do not do that to drown out the other smaller cycles and ignore them. I do that to identify the forcer. By doing this, you can split a data set into several forcers and write a function that represents the data more accurately. If you don’t identify the higher timeframe forcers, you will not correctly fit your lower time data to a function of any kind. Your model will not work for very long.

            You can see the relationship between Detroit and AMO more easily if you put a moving average on the Detroit data. Something between 5 years and 20 years. ENSO has a very high amplitude and must be filtered out to see AMO.

          • Midas says:

            No there is nothing wrong with moving averages. Extracting a signal is fine. But once higher frequency signals have been filtered out, the correlation coefficient is no longer representative of the true correlation.

  49. barry says:

    That long term cooling is always around the corner, and these new warm temps are nothing at all I tell you.

    This drum beat has no interesting variation.

  50. barry says:

    A few days after the New Year, we will have the temps for every month from January 2017 to December 2019.

    3 years that didn’t include the 2016 el Nino. Indeed, the end of 2016 was a mild la Nina, and 2017/18 was another la Nina, followed by a mild el Nino 2018/19.

    Now, I’m offering a bet.

    I bet the 3 years following the 2016 el Nino, but not including that el Nino, will be the warmest 3 years in the UAH instrumental record.

    An easy bet of US$100. I will honour it. Honouring one’s word matters to me.

    Any takers? Salvatore? Scott R?

    Anyone?

    If not, would any coolist out there make an alternative bet?

    Money talks so much more forcefully than blog screed. It separates the BS artists from the serious.

    I don’t think any one of the AGW critics and coolists are serious. I think they are BS artists.

    • barry says:

      Hmm, maybe one or two AGW critics are sincere. Maybe. It’s often easy to spot who is sincerely arguing and who is not, but not always.

      • Scott R says:

        barry,

        I’m not even sure what you are trying to bet on. Are you trying to say 2020-2022 will be warmer than 2016-2019?

        I’m honored that you thought of me for this bet, however, I do not bet on the weather. lol

        I do not have all the answers, but I do feel my experience with data and systems is relevant. I’m here to learn from people that agree with me and disagree, and honestly I have learned a lot so far as I dive into this rabbit hole. Hopefully the result will be I come away with a better foundation for my own current opinion, or perhaps I change my mind about certain things. I hope to build a real model that fits as much recorded temperature data / proxy data as possible.

        • gbaikie says:

          –Im not even sure what you are trying to bet on. Are you trying to say 2020-2022 will be warmer than 2016-2019?–

          No, he want to bet the 2016-2019 {somehow excluding El Nino} will be warmest 3 year period of the 40 year record.
          Or it looks like in this 3 year period Sept 2019 was the second warmest month. Though it’s possible Oct, Nov, and/or Dec could be warmer than Sept 2019.
          Considering the Sept 2019 spike, there good chance next month might be as warm or warmer. But also possible Oct could fall thru the floor, either way he could win the bet. And either way, it proves nothing.

      • barry says:

        Gents, 3 years is 2017 to 2019. It’s in the very first line of my post.

        No 2016 el Nino included, just the 3 following years, of which we have 3 months left to complete.

        The 3 years so many skeptics say have been a cooling.

        I’m betting that by the time we get the December anomaly, the last 3 years – without the al Nino year of 2016 – will be the warmest in the record.

        $100?

        If this bet doesn’t please, any of the coolists out there can make their own. If it’s reasonable, I’ll take it up.

        This isn’t about crass money-making. This is about people demonstrating that they seriously believe what they say.

        If you don’t seriously believe what you say, then that’s fine, too.

        • barry says:

          The warmest 3-year period in the UAH6.0 global lower troposphere temperature record, to be precise.

          Because people denying recent warming – the pausists and the statistical non-significantists for example – have been saying any warming is all due to the 2015/16 el Nino.

          So let’s exclude that anomaly and stick with the last 3 years.

          Takers?

          • David Appell says:

            Today I heard the most recent warming is from the positive phase of the PDO.

            No mention that temperatures now are much higher than during the last positive phase of the PDO (about 1980-2000).

    • Bindidon says:

      barry

      Of course I agree with your bet offer!
      Makes now US$ 200…

    • Bindidon says:

      Of course: barry and I we consider only the existing record, and not what will happen in three years.

      • barry says:

        I’m willing to bet that if the 2016 el Nino year is excluded from the calculations, the 6 years from Jan 2017 to Dec 2022 will be the warmest 6-year average in the UAH6.0 global lower tropospheric temperature record.

    • Dr Roys Emergency Moderation Team says:

      barry, DA, Bindidon, please stop trolling.

  51. James Waldo says:

    I’m a professional scientist and I have a deep interest in this and other earth sciences. I don’t normally post on forums like this because it’s mostly fruitless to argue with strangers on the internet…or anywhere for that matter.

    My feeling is that, for the most part, we’re all missing the larger picture here. It’s important to realize that there is an effort to cast any perturbation in climate as man-made and then to predict dire outcomes. We argue the minutiae of tenths of a degree variation in trends, but it’s unimportant. It doesn’t matter if the trend is warming or cooling. Either way, the effort to link it to humans will be made. The real argument is a political one. It’s not possible to exert control over global policy and economies without the specter of a global threat.

    What better bogeyman is there than climate? It’s essentially invisible to observation to the average person who then has to rely on the reports of the ‘experts’. The ‘experts’ trumpet what devastation is actively occurring in places that the average person can’t personally verify. We’re all expected to trust the ‘experts’ who have a track record of about 0 for 100 correct predictions. When we don’t trust the ‘experts’ then the jackals descend upon us to deride us and ruin us in some way.

    In closing, keep up the good fight. You’re the only ones standing in the way of the true global threat.

    • Eben says:

      The communists socialists and globalists latched on the global warming as a new vehicle for taking over the control of energy production and thus the whole economy , destroying the free market and capitalism

    • Midas says:

      There is nothing in your comment which suggests that your claim of being a scientist is truthful.

    • gbaikie says:

      “I dont normally post on forums like this because its mostly fruitless to argue with strangers on the internetor anywhere for that matter.”

      Well if there is someone wrong on the internet, it could be a problematic situation:
      https://tinyurl.com/y5n2uxgp

      Or a giant bowl of cherries.

      “We argue the minutiae of tenths of a degree variation in trends, but its unimportant. It doesnt matter if the trend is warming or cooling. Either way, the effort to link it to humans will be made. The real argument is a political one. Its not possible to exert control over global policy and economies without the specter of a global threat.”

      The short {hundred year} trend is warming.
      And it’s very true that it’s “not possible to exert control over global policy and economies”
      {but it is part of a crazy dream/solution}.
      And if one could have a bit of control over global policy and economies, can’t we do something about Iran stoning people or murdering gays or something. Also I doubt many people like what Chinese govt is doing to the people of Hong Kong.
      But also long list of stuff without trying to force everyone to use solar panels and wind mills {which almost nobody on the planet wants}.
      But anyhow, “Hey, let’s stop stoning women”, probably doesn’t involve the “specter of a global threat”. Probably most Iranians might agree it would be a good direction to go.
      And getting rid of slavery, a bit harder, but could be doable with a bit patience and persistence.

    • bdgwx says:

      We argue the minutiae of tenths of a degree variation in trends, but it’s unimportant.

      A tenth of a degree is huge in the context of the global mean temperature trend in units of C/decade.

    • Dr Roys Emergency Moderation Team says:

      DA, BobdesbonddesMidas, bdgwx, please stop trolling.

  52. gbaikie says:

    Third try:

    It’s probably dead, Jim.

    –Disulfur Dioxide, the Solar Cycle and Cosmic Rays in the Venusian Atmosphere —
    https://tinyurl.com/y34k4d8h

    Also:
    –Study co-author, UWM planetary scientist Sanjay Limaye, notes, The difference between Earth and Venus is that on Earth most of the energy from the sun is absorbed at ground level while on Venus most of the heat is deposited in the clouds. —

    • gbaikie says:

      It wouldn’t post and chopped up. And sort of missed the whole point:

      ” Subsequent UV light irradiation (365 nm) depletes syn-OSSO and anti-OSSO and yields a fourth isomer, syn-OSOS, with concomitant dissociation into SO2 and elemental sulfur.

      Not everyone is convinced, however. There are still holdouts for cloud-dwelling organisms”

  53. Jesus says:

    < snip >

    THAT was weird.

  54. Scott R says:

    Dr Spencer,

    I’m very impressed that you have the cross-checks in place to find this type of thing. When a new error type like this comes up, do you check the entire data set to make sure there are no other similar cases?

    I believe you have the most accurate global temperature data on the planet. Regardless of which way the adjustments take this month’s and last months number, having the most accurate data is critical to formulating models so we can make predictions and set public policy (if needed). Please take your time and thank you for your efforts.

    • bdgwx says:

      I’d be willing to bet the adjustments will take the last 2 month’s lower. And that looks like a legit correction that needs to happen. I think it’s important for people to realize that this doesn’t mean the UAH dataset isn’t trustworthy. Stuff happens. The important thing is that Spencer and Christy are committed to fixing it. I can certainly commend them for that.

      • bdgwx says:

        Hmm…with the RSS data and the information about a SSW in the SH it’s possible the UAH was correct afterall.

      • Dr Roys Emergency Moderation Team says:

        “I think it’s important for people to realize that this doesn’t mean the UAH dataset isn’t trustworthy.”

        Funny…because arguably people may not have been thinking that at all, until you said it…

        …which is, of course, why you said it.

        bdgwx…a subtle troll.

  55. jesus asks says:

    How does a planetary atmosphere act as a heat pump that is driven by an environment that is radiatively interacting with but also simultaneously radiatively equilibrated to the atmospheric system?

    (Watch how none of these fools can answer the question).

    • barry says:

      Are you speaking of a fictional planetary atmosphere? Because Earth’s atmosphere doesn’t operate as a radiative heat pump. A better analogy would be that it acts as an insulator.

      • gbaikie says:

        Jesus didn’t say radiative heat pump.

        Earth’s convectional/evaporative heat pump is the tropical ocean, Jesus did say …”that is driven by an environment that is radiatively interacting with but also simultaneously radiatively equilibrated to the atmospheric system?”

        Which I guess he referring the high levels of water vapor in the tropical ocean region {due to a constant high average temperature of the tropical ocean surface waters].

        • Jesus says:

          NO planetary atmosphere can act as a heat pump that is driven by an environment that’s radiatively interacting with but also at the same time radiatively equilibrated to the atmospheric system.

          • Jesus says:

            The laws of thermodynamics make it physically impossible. So where do you go from here?

          • gbaikie says:

            –Jesus says:
            October 4, 2019 at 12:06 AM
            The laws of thermodynamics make it physically impossible. So where do you go from here?–

            Solve the impossible?
            Basics, anything transparent, reflects to some degree.
            Gases are transparent.
            Atmospheres reflect sunlight. Atmospheres reflect radiant energy.

            Some people might think that if cover Mars completely with say 10 meter of snow. That would cool Mars.
            I think it would warm Mars.
            I realize that people might think that this would be impossible.
            So, let imagines having Mars completely with 10 meter depth of snow {frozen H20 and say it’s perfect powder snow for skiing- and by the way I think Olympus Mons could great place to ski} actually causes Mars to become colder than it is now. Or covering Mars completely should have some effect of either warming or cooling. And if you think it will be cooling, how much cooling do you imagine the snow will cool?
            Now, obviously, if put snow which is only -10 C, it will be a warming effect, so going to say snow temperature put there is average global temperature of Mars. And there is some dispute about this temperature, to make it simple, say all snow added is -60 C. And it seems if start will snow at -60 C, it’s going to make the average global temperature be -60 C.
            So question is, over time, how much colder than -60 C will Mars global average temperature become?

            As suggestion one might ask how much of the -60 C snow will evaporate in the first year?
            And you might ask if instead of globally covering Mars with -60 C snow. What happens if just have dump truckload snow {at -60 C} on Mars surface. And one should aware that Mars polar regions evaporate many dump trucks of frozen ice {much colder than -60 C] every Martian year.

        • barry says:

          Who here is saying that the atmosphere acts like a heat pump? I don’t see anyone on this blog doing that, so are you talking to yourself or what, Jesus?

          As I said, the better analogy is to see the atmosphere as an insulator. And it operates as an insulator with incoming solar radiation and upwelling infrared radiation. Different gases in the atmosphere are opaque to different wavelengths of the EM spectrum. That is the radiative action. Convection is also part of the mix.

          • Jesus says:

            It was clearly pointed out that Earth’s convectional/evaporative heat pump is the tropical ocean.You either deny that is the case or you answer the dam question to which you decided to comment on.

          • barry says:

            You’ve forgotten your own question.

            How does a planetary atmosphere act as a heat pump that is driven by an environment that is radiatively interacting with but also simultaneously radiatively equilibrated to the atmospheric system?”

            You were asking how the atmosphere, not the ocean, acts as a heat pump. My answer – it doesn’t.

            Up to you if you want to keep discussing, but it isn’t going to work if we can’t remember and stick to the point.

          • Stephen P Anderson says:

            It absolutely does. You’re not an engineer are you?

          • Tim Folkerts says:

            Stephen P Anderson says: “It absolutely does [act as a heat pump].”
            Stephen P Anderson says: “Well, technically not a heat pump”

          • barry says:

            A heat pump transfers thermal energy from a cold place to a warmer one, using an external energy source to do so. It’s a powered device that reverses the natural flow of heat.

            The atmosphere is definitely not a heat pump. To describe it as such stretches the meaning of heat pump beyond the breaking point.

          • Dr Roys Emergency Moderation Team says:

            “…but does act as a heat engine.”

            Tim, your quotation ran out of gas for some reason, at an important point. Don’t worry, I finished it off for you.

          • Tim Folkerts says:

            DREMT

            A heat engine takes an amount heat from a hot reservoir, Q(h), converts some of it into mechanical work, W, and rejects a smaller amount to a cold reservoir, Q(c).
            Q(h) Q(c) = W
            The earth’s atmosphere and oceans do not do this.

            There are convective cycles, but there is no “heat pump” nor is there a “heat engine” as those terms are commonly defined.

            My quotation “ran out of gas” at that point to emphasize one problem with terminology, and to avoid dealing with yet another problem with terminology.

          • Dr Roys Emergency Moderation Team says:

            “My quotation “ran out of gas” at that point to emphasize one problem with terminology, and to avoid dealing with yet another problem with terminology.”

            Yes, I’m sure that’s what it was, Tim.

    • Tim Folkerts says:

      Jesus,

      Could you clarify what you mean by “heat pump”? Are you referring to this?
      “A heat pump is a device that transfers heat energy from a source of heat to what is called a heat sink. Heat pumps move thermal energy in the opposite direction of spontaneous heat transfer, by absorbing heat from a cold space and releasing it to a warmer one. A heat pump uses external power to accomplish the work of transferring energy from the heat source to the heat sink.”

      If that is what you mean, then haven’t seen anyone treating the atmosphere as spontaneously moving net thermal energy from colder areas to warmer areas.

      If that is not what you mean, then tell us how you are defining “heat pump”.

      • gbaikie says:

        –Tim Folkerts says:
        October 4, 2019 at 4:47 AM
        Jesus,

        Could you clarify what you mean by heat pump? Are you referring to this?…–
        Jesus can provide his answer.
        But in meantime:
        Any heat pump requires difference of temperature, or I guess more precisely, a difference of entropy, but I prefer a difference of temperature, as seems to me to be mostly right {or most obvious} and it seems simpler as far as I am concerned.

        And roughly with anything like a planet, there is difference between temperature of the equatorial region and the polar region. And between night and day.
        What doesn’t have a heat pump is the Moon {though I would not rule any kind of insignificant type of heat pumps on the Moon, ie something involving lunar dust or other things}.
        The Venus polar vortexes are sign of a planetary heat pump.
        Or if Earth lacked a ocean, but had an atmosphere, it would have a planetary heat pump.
        But Earth’s ocean improves or is a dominant aspect of Earth’s heat pump.
        And one aspect of the Earth ocean being a “good heat pump” is it’s near constant high average temperature. Or it works day and night.
        Though there is also a day and night heat pump in the tropics- going from day to night in longitudinal direction- El Nino/ ENSO is a related aspect of this.
        Another aspect of the tropical heat engine involves movement of oceanic water {poleward and in longitudinal direction}.
        But the magic sauce of the tropical ocean heat engine is water vapor. One might call this a steam engine, though probably better to call it a cold steam engine.

        Now, the Moon doesn’t have a radiant heat pump or you will have define what such radiant heat pump is. And likewise Earth doesn’t have a radiant heat pump. But Earth has what one could call lids which inhibit radiant energy, and the Moon is lacking such lids.

        • Tim Folkerts says:

          gbaikie,

          That is exactly the sort of misunderstanding and difference in terminology that needs to be clarified.

          As commonly used, a “heat pump” is a mechanical device, where work is done (usually by using electrical energy) to move thermal energy OUT of a cool region and INTO a warm region. The normal mode is the opposite of an air conditioner
          * AIR CONDITIONER. Removes thermal from a cool room and transfers it to the warmer air outside
          * HEAT PUMP. Removes thermal energy from the cool air outside and transfers it to the warmer air inside.
          (Often heat pumps can be run in reverse to serve as air conditioners, too)

          What you (and Jesus) are describing is simple convection. You could just call it “convection”. Or maybe “heat transfer cycle” or “thermal piplines”.

          By using a word (“heat pump”) in an unconventional manner, you invite confusion. Ask any HVAC contractor. Ask Home Depot. Ask any physicist or engineer. Ask Google. They will all tell you the same answer.

          This gets back to the original challenge:

          “How does a planetary atmosphere act as a heat pump that is driven by an environment that is radiatively interacting with but also simultaneously radiatively equilibrated to the atmospheric system?

          (Watch how none of these fools can answer the question).”

          Of course no one will be able to answer adequately, because the atmosphere is NOT a “heat pump”! The question itself is ill-posed in ways that the poster doesn’t even understand.

          • Stephen P Anderson says:

            Well, technically not a heat pump but does act as a heat engine.

          • Tim Folkerts says:

            A heat engine takes an amount heat from a hot reservoir, Q(h), converts some of it into mechanical work, W, and rejects a smaller amount to a cold reservoir, Q(c).
            Q(h) – Q(c) = W

            The earth does not do this. At the largest scale, Q(h) ≈ 340 W/m^2 enters the atmosphere from the sun, and Q(c) ≈ 340 W/m^2 leaves the atmosphere to space. Nothing is converted to mechanical work.
            Q(h) – Q(c) = 0

            I suppose you could call the atmosphere a heat engine with efficiency 0 (ie no heat is converted to work), but that is not really an engine. That is just an object conducting/convecting/radiating heat from warm to cold.

            And just to head off an objection that someone is sure to raise, convection does not count as a heat engine. Yes, some energy can go into setting up convection cycles, which involves ‘work done on the atmosphere’ , but
            1) this work averages to zero over the long term.
            2) this work is internal to the engine, not work extracted from the engine.
            Either of these negates the atmosphere as a heat engine. (Ditto for the oceans.)

          • gbaikie says:

            “Of course no one will be able to answer adequately, because the atmosphere is NOT a “heat pump”! The question itself is ill-posed in ways that the poster doesn’t even understand.”
            And:
            “A heat engine takes an amount heat from a hot reservoir, Q(h), converts some of it into mechanical work, W, and rejects a smaller amount to a cold reservoir, Q(c).
            Q(h) – Q(c) = W

            The earth does not do this.”

            Earth’s tropical ocean may not be the same as heat pump or heat engine. If you say Earth is mostly warmed because it has natural mechanisms which create heat {or cold} by some kind a heat pump, that would be misleading.
            And if say Earth is acts by some like a combustion like piston engine or turbine engine, that could also be misleading.

            But I would say the warmth of tropical ocean does power the Earth’s climate system. And I would say the cold polar region is also part of what “drives” climate.
            And the warm and cold reservoirs interact due gravity and buoyancy of denser and lighter of atmospheric and oceanic masses which are influenced spin of Earth and changing gravitation forces upon Earth of the Moon orbiting it. And this tidal force, and the radioactive heat, and the heat from impact collision of Earth formation, powers tectonic plate movement and volcanic eruption. And Earth orbits the sun and warms the surface of the Earth and surface of the tropical region which is 40% of the entire Earth surface receives more 1/2 of the energy of total sunlight reaching the entire Earth surface,
            And about 80% of the surface of the tropics is ocean. And the ocean absorbs more sunlight than land surface does.
            And the unevenness of the heat added by sunlight, powers the global climate. And that what powers the climate might as act engines. Or they need “a fuel” to “work”.
            A hurricane needs warm water as a “fuel” to power them.
            But there elements of climate which act like somewhat like a heat pump.
            If someone says:
            “Earth’s atmosphere acts like a gigantic heat engine, working on many of the same principles as your car’s engine. Fuel— in this case, energy from the sun— is used to do work.”
            https://www.smithsonianmag.com/science-nature/climate-change-altering-global-heat-engine-180954079/

            That seems like fairly good way to say it, but if one said:
            Earth’s atmosphere acts like a gigantic heat pump… that certainly could be misleading in a number of ways.

            But if someone were to says Venus atmosphere acts like a gigantic heat pump that could be pretty good way to describe it, because it helps explain why the famously hot surface, is hot.
            {Though I don’t any one making a heat pump which heat anything that hot- and it does not seem like a practical way to get such high temperatures.}

            Whereas “things” that act as heat pumps in Earth’s climate don’t have such an obvious effect or aren’t really the big picture type thing.

          • Tim Folkerts says:

            gbaikie (and others),

            The atmosphere pumps heat around by convection — but it is not a “heat pump” in the technical sense.
            The atmosphere is powered by heat and temperature differences that make the atmosphere move — but it is not a “heat engine” in the technical sense.

            So if people want to throw around vague terms like “heat pump” in a vague discussion, I don’t usually object. But if people throw around technical challenges in a technical discussion, they really need to use the technical meanings of “heat engine” and “heat pump”.

          • gbaikie says:

            –Tim Folkerts says:
            October 7, 2019 at 10:12 AM
            gbaikie (and others),

            The atmosphere pumps heat around by convection but it is not a heat pump in the technical sense.–

            In technical sense of making cold, warmer.
            Earth has heat pumps, but they are minor aspect of Earth. And major aspect if you think Venus rocky surface air temperature is important.

            Or Earth heat pumps are relevant, if wondering about air temperatures in basin of dried out Mediterranean sea :
            https://en.wikipedia.org/wiki/Messinian_salinity_crisis

            Or if you interested in weather of Alberta, Canada.
            Or interested in all the aspects regarding the warming effect of clouds on Earth.

          • gbaikie says:

            “The atmosphere is powered by heat and temperature differences that make the atmosphere move but it is not a heat engine in the technical sense.”
            Well, engine is moving trillions of tonnes of water and air, or moving around far mass than any human designed engines. Or more mass than total all human made engines which humans have ever been made.

            And if work at it, one can see a more broader aspect of heat pump as applies to Earth.
            A heat pump can keep a room at constant temperature {with thermostat, and turning off and one]
            Earth atmosphere mass also keep surface air closer to constant temperature. The air cools less at night and warms less during the daytime because this heat pump. One say it’s passive heat pump, and not about making air colder or hotter, but rather preventing change in temperature, or as commonly said the atmosphere is thermal mass and has a lapse rate which changes air temperature [cooler- by about 6.5 C] per 1000 meter elevation. Or if measure air temperature at 2000 meter elevation, it’s going to be about 13 K more at sea level.
            Or roughly the whole atmosphere column warms and cools in unison, or if surface air cools, air 1000 meter up, cools. There is some delays or interruptions, but basically that way it works, and it is fairly predictable.

          • Nate says:

            Tim,

            Don’t you think the winds, water cycle, hurricanes, general circulation, etc are all examples of solar driven heat engines on Earth?

            And some of these are doing work for us (hydro power, wind power).

  56. Starwars says:

    bcwp zs Starwars youtube.com/watch?v=KgUoGsWrFEs

  57. Entropic man says:

    An interesting update of the Earth’s energy budget for those interested in the science.

    Note that the energy imbalance has increased from 0.6W/m^2 in previous data to 0.9W/m^2.

    https://blog.hotwhopper.com/2019/10/a-short-primer-on-global-energy-flows.html?showComment=1570190841616

    • Ball4 says:

      The 0.9 imbalance was also shown in TFK09 in the period 3/2000 to 5/2004.

      An updated imbalance (net TOA flux) of 0.71 +/- 0.10 for the period 7/2005 to 6/2015 is given from cites in Loeb et. al. 2018 p.904 3). Reasons for the variability from p.917 Summary:

      “CERES TOA fluxes exhibit pronounced interannual variability driven primarily by ENSO. SW TOA flux variations in the Arctic are noteworthy and are tied to changes in sea ice coverage….In addition, pronounced cloud optical depth retrieval differences occurring as a result of a correction to MODIS calibration changes in (EBAF) Ed4.0 accounts for some of the difference (from a prior period).”

      • Entropic man says:

        Which translates to decreased albedo as the Arctic sea ice extent decreases, plus a calibration update. Any numbers for the two changes?

        • Ball4 says:

          Some summary numbers but not what I perceive you are asking about – mostly just numbers/discussion of various LW/SW ups/downs & updated calibration issues you can dig into, if interested.

          My guess Loeb et. al. paper is discussing comparison of charts showing CERES observed LW, SW in the period vs. period charts of Arctic sea ice coverage varying & near surface global median temperatures varying with ENSOs for which they find more interesting “pronounced interannual variability” than other system noise in the period.

        • Dr Roys Emergency Moderation Team says:

          Ball4…I didn’t think you were an “imbalance-r”. I thought you liked your GHE delusion flavored with a “it just redirects heat from one part of the atmosphere to the other” twist? I thought you only believed the lower parts of the atmosphere warmed at the expense of the upper parts cooling. How does that square with the idea of an “imbalance”, which would surely mean the whole planet is warming?

          • Ball4 says:

            DREMT has trouble thinking & connecting the dots.

            DREMT writing “the lower parts of the atmosphere warmed at the expense of the upper parts cooling” are atm. temperature effects due added well mixed ppm CO2.

            DREMT writing “the idea of an “imbalance”, which would surely mean the whole planet is warming” are effects from processes like “changes in sea ice coverage” SW influencing net TOA flux and ENSOs influencing global LW in the period observed.

            Reading the paper I cited will help DREMT better connect the dots if DREMT has accomplished the pre-req.s. to comprehend the specialist lingo therein. BUT DREMT is too busy trolling, please stop.

          • Dr Roys Emergency Moderation Team says:

            OK, so…just saying my name a lot and blabbering. No actual explanation.

  58. David says:

    Presentation by Professor Nir Shaviv on 4 April 2018, on the The Cosmic Ray Climate Link, From Geological Timescales to 20th Century Climate Change.

    The 20th century has seen a notable temperature rise, generally attributed to the greenhouse effect of anthropogenic gases, and a future “business as usual” policy is generally believed to be catastrophic. However, significant evidence indicates that the sun plays a major role in climate change. Shaviv reviews the evidence which proves the existence and quantifies the physical mechanism linking between solar activity and climate galactic cosmic ray ionization of the atmosphere and its effect on cloud cover. In particular, Shaviv argues that the link operates on geological time scales, linking our galactic motion to long term climate variationsand that once the link is taken into account, a much more consistent picture for 20th century global warming is obtained. In it, climate sensitivity is low and future climate change is benign.

    https://www.youtube.com/watch?v=p9gjU1T4XL4&fbclid=IwAR3hMqUW4fH9ZZ0Q47Dp-MtDelNd1mgBIinD7ck3wrfTbpUqlnJSWNFqIIY

    • Bindidon says:

      David

      It is the umpteenth contribution concerning solar influence.
      Thanks.

    • bdgwx says:

      The GCR hypothesis was already on shaky ground and yet everyone said wait until the CERN CLOUD experiment results are released before nailing up the coffin. So we waited. And in 2016 Dunne et al published their results.

      https://tinyurl.com/y2zh9mzf

      Also, if you wouldn’t mind can you explain the GCR hypothesis to us? Pretend like we don’t know and we’re hearing it for the first time. I want to see which direction you are going to go with your explanation and how you link GCRs to global temperatures.

    • Entropic man says:

      Unfortunately the CLOUD research at CERN disagrees with Shaviv.

      https://www.sciencealert.com/cosmic-rays-could-influence-cloud-cover-on-earth

      I qoute

      “Recent research carried out at CERN by Gordon and others suggests that particles released by human beings and trees are likely to be much more influential in terms of affecting cloud cover than showers of particles from space.

      “In the climate of the last few thousand years, [cosmic rays] can make no appreciable difference to overall cloud-seeding particle concentrations in the atmosphere or to temperature,” Gordon told Ryan F. Mandelbaum at Gizmodo.”

    • Midas says:

      David
      Brazen of you to show yourself after yesterday being caught red-handed copy-pasting someone else’s comment from the internet and trying to pass it off as your own.

    • Dr Roys Emergency Moderation Team says:

      Bindidon, bdgwx, Entropic man, BobdesbonddesMidas, please stop trolling.

  59. Entropic man says:

    Dr Spencer

    Look at the comparison with RSS on the first graph here.

    https://moyhu.blogspot.com/p/latest-ice-and-temperature-data.html

    UAH has been running about 0.2C cooler than RSS for the last six months. Since you are both using the same microwave data, this is probably due to the different algorithms.

    If there was a problem with the last two months of UAH overeading, you would expect UAH to be closer to RSS for August and September, which hasn’t happened.

    Perhaps those unusual TP and LS readings are genuine. Do they look unusual in the RSS output?

  60. Scott R says:

    Dr Spencer look at these last readings…

    TLS south pole

    2016 1 -0.2637
    2016 2 -0.1496
    2016 3 -0.6967
    2016 4 -0.8543
    2016 5 -0.1993
    2016 6 0.2578
    2016 7 -0.1750
    2016 8 0.1391
    2016 9 2.2815
    2016 10 1.5037
    2016 11 2.3453
    2016 12 1.0496
    2017 1 -0.3289
    2017 2 -0.3172
    2017 3 -0.7509
    2017 4 -0.6123
    2017 5 -1.3073
    2017 6 -1.4126
    2017 7 -1.0103
    2017 8 1.9791
    2017 9 4.1531
    2017 10 2.4791
    2017 11 2.4672
    2017 12 0.1563
    2018 1 -0.1096
    2018 2 -0.5786
    2018 3 -0.7614
    2018 4 -0.5205
    2018 5 -0.1616
    2018 6 -0.9328
    2018 7 -0.8261
    2018 8 -2.0162
    2018 9 -1.7954
    2018 10 -3.6958
    2018 11 -2.7435
    2018 12 -0.2545
    2019 1 -0.3221
    2019 2 -0.4948
    2019 3 -0.0664
    2019 4 -0.6406
    2019 5 -0.8695
    2019 6 0.1205
    2019 7 -0.3228
    2019 8 1.0220
    2019 9 13.4656

    TTS south pole

    2016 1 -1.2543
    2016 2 -0.4184
    2016 3 -0.3813
    2016 4 -0.5001
    2016 5 0.1441
    2016 6 -0.2212
    2016 7 -0.0800
    2016 8 0.2013
    2016 9 1.3628
    2016 10 1.9386
    2016 11 3.2404
    2016 12 1.8043
    2017 1 0.1435
    2017 2 -0.0315
    2017 3 -0.3995
    2017 4 -0.1844
    2017 5 -0.2464
    2017 6 -1.2466
    2017 7 -0.8291
    2017 8 0.6782
    2017 9 1.6295
    2017 10 2.3670
    2017 11 2.8720
    2017 12 0.8579
    2018 1 0.2462
    2018 2 -0.1652
    2018 3 -0.3975
    2018 4 -0.2213
    2018 5 -0.1750
    2018 6 -0.4350
    2018 7 -0.2714
    2018 8 -0.8161
    2018 9 -0.9947
    2018 10 -1.8855
    2018 11 -0.9929
    2018 12 -0.1222
    2019 1 -0.6023
    2019 2 -0.0639
    2019 3 0.1446
    2019 4 -0.0800
    2019 5 -0.3561
    2019 6 0.3413
    2019 7 -0.2111
    2019 8 0.2898
    2019 9 6.2248

    • Scott R says:

      Tropics TLS:

      2016 1 -0.2597
      2016 2 -0.3792
      2016 3 -1.2817
      2016 4 -1.0959
      2016 5 -1.0379
      2016 6 -1.1857
      2016 7 -1.1519
      2016 8 -1.0632
      2016 9 -1.3431
      2016 10 -1.0894
      2016 11 -1.2884
      2016 12 -1.0843
      2017 1 -0.5377
      2017 2 -0.5373
      2017 3 -0.0743
      2017 4 -0.0629
      2017 5 -0.0083
      2017 6 -0.2278
      2017 7 -0.7488
      2017 8 -1.2121
      2017 9 -1.4526
      2017 10 -0.8545
      2017 11 -0.7151
      2017 12 -0.6220
      2018 1 -0.3341
      2018 2 -1.4495
      2018 3 -1.1240
      2018 4 -0.2548
      2018 5 -0.1682
      2018 6 -0.2929
      2018 7 -0.3887
      2018 8 -0.0525
      2018 9 -0.0887
      2018 10 -0.4759
      2018 11 -0.7900
      2018 12 -1.0472
      2019 1 -1.2063
      2019 2 -0.3176
      2019 3 -0.0837
      2019 4 -0.4332
      2019 5 -0.4787
      2019 6 -0.5630
      2019 7 -0.7826
      2019 8 -0.9252
      2019 9 -2.6358

      Unless a massive energy transfer just took place from the tropics to Antarctica. Could that be a possibility? We did have that stratospheric warming last month.

  61. Entropic man says:

    The September RSS TLT is just out.

    First graph here:-

    https://moyhu.blogspot.com/p/latest-ice-and-temperature-data.html

    It has also bounced up 0.2C compared with last month.

    That suggests that the change is in something common to RSS and UAH; either genuinely unusual temperatures or a sensor glitch.

  62. Entropic man says:

    Copernicus also give September 2019 as a new record.

    https://www.washingtonpost.com/weather/2019/10/04/earth-just-experienced-its-hottest-september-heads-record-books/

    Be interesting to see what the other surface datasets show.

  63. Scott R says:

    Ren,

    Look at this… the minor peak of the UAH was October 2017. At that time, there was an energy transfer from the tropics to Antarctica:

    Tropics TLS:

    2017 7 -0.7488
    2017 8 -1.2121
    2017 9 -1.4526
    2017 10 -0.8545
    2017 11 -0.7151

    TLS south pole

    2017 7 -1.0103
    2017 8 1.9791
    2017 9 4.1531
    2017 10 2.4791
    2017 11 2.4672
    2017 12 0.1563

    TTS south pole

    2017 8 0.6782
    2017 9 1.6295
    2017 10 2.3670
    2017 11 2.8720
    2017 12 0.8579
    2018 1 0.2462
    2018 2 -0.1652

    Once the energy is transferred to Antarctica, the global temperature goes into free fall. I think UAH is about to drop.

    The same thing happed in 2016. You can see the energy transfer to Antarctica, and the global temperature plummet.

    If the number of these transfers has been decreasing, it could help explain the inverse relationship I’m seeing between HADSTT3 southern ocean and HADSTT3 globe. It is a function of the number of SSW events I think.

  64. Eben says:

    Never thought global warming would be this much fun

    https://youtu.be/oBJlzD0BFXI

    • David Appell says:

      Here’s more fun: European bookmakers are putting Greta Thunberg as the favorite to win next Friday’s Nobel Peace Prize:

      https://thehill.com/blogs/blog-briefing-room/news/464278-odds-place-greta-thunberg-as-frontrunner-for-this-years-nobel

      • Midas says:

        Much as she’s doing a good service, that would be utter BS.

        • David Appell says:

          Just wondering, why do you think so?

          • Midas says:

            It should be given to someone who has actually contributed to the peace of a region, as the name suggests, not someone who is favored simply because she gets attention from the mainstream media.

          • David Appell says:

            I don’t think she gets attention from the media in a vacuum. I think she gets attention because

            (1) she speaks truth to power, which takes bravery, and
            (2) she is galvanizing the younger generation, her generation, who have a special concern about climate change that old people don’t.

          • Midas says:

            I’m sure that’s all true, but simply speaking out should not get you a prize. It first has to be shown that it’s made a difference. If all we get is activism without results then I’m sure there are better options out there who have achieved results in their endeavors.

            And I’m afraid I’m with the deniers on this one – I don’t believe Al Gore should have received the prize. But at least he’s benign – many of the recipients are criminals.

          • David Appell says:

            Thanks. What here would constitute “results?” Actual reductions in CO2 emissions?

            Personally I think she’s an immensely brave person who is and already has made a difference. Not sure if she should get the Peace Prize this year or next, but few people have ever had such an impact in less than a year, attracted as much attention for the strength of her cause, or garnered as many people, and for such an important cause.

            Cheers.

          • Dr Roys Emergency Moderation Team says:

            Personally, I don’t think she’s a very good actress. The emotion in her recent speech was not believable and seemed to be turned on almost immediately, no natural progression to it.

          • Stephen P Anderson says:

            Greta Thunberg and Mother Teresa can share the podium.

          • Midas says:

            DREMT
            You’ve never met and had a conversation with someone with Aspbergers, have you.

          • Dr Roys Emergency Moderation Team says:

            Why, are they particularly known to be bad actors?

  65. Paul. says:

    If as suggested CO2 acts as an insulator thus trapping greenhouse gases then what cools the atmosphere? Clearly the answer is the Polar Vortex, in it is regards to that to which I now write.

    GREAT ARCTIC OUTBREAK OF FEBRUARY 1899.POLAR VORTEX AND LOW SOLAR ACTIVITY TO BLAME.

    The Great Arctic Outbreak of February 1899 occurred during the solar minimum between weak solar cycles 13 and 14 these were the previous comparably weak cycles to the one weve just experienced, cycle 24.

    The Great Arctic Outbreak of February 1899 as it became known, is one of the most widespread North American cold snaps in recorded history. It was described in a 1988 academic article as a benchmark with which to compare similar events.

    Research has linked low solar activity with colder temperatures in the lower latitudes (Mikhal Schwander, et al, 2017) https://www.clim-past.net/13/1199/2017/cp-13-1199-2017.pdf
    and the sun is currently going through its deepest solar minimum in well-over 100 years.

    The lowest-ever recorded temps in many cities were set during the Great Arctic Outbreak of February 1899, but 2019 has started to oust many of these. Ive listed a few below:

    Feb 8, 2019: Prince Albert broke a -42.8C record that was set in 1899, with a new record of -44.8.
    Feb 8, 2019: -43C tied Willistons, ND all time record low set in 1899.
    Feb 06, 2019: In Lansing, Michigan the highest the temp got was 3 degrees, beating the record of 5 degrees from 1899.
    Jan 31, 2019: Green Bay tied its low of -26C from 1899.
    Jan, 2019: Milwaukee smashed a daily record that had stood since 1899 by six degrees, with a low of minus -21.

    Being as it is a decline in solar activity that results in intensification of the Polar Vortex and hence results in extreme periods of cold, why is it that the effects of declining solar irradiance reduces the climate temperature and the greenhouse effect takes second place to solar irradiance? What happens to the trapped warm greenhouses gases during these periods? What is the rate of heat dispersal during these periods?

    When solar activity again increases the Polar Vortex disperses – as it does every summer so it is clear that it is solar radiance that drives climate and not CO2 unless it is suggested CO2 drives the Polar Vortex.

    https://www.meteociel.fr/modeles/gfse_3d.php?mode=2&lat=40.75&lon=-109.25&ech=69&zoom=6

    • David Appell says:

      Paul. says:
      If as suggested CO2 acts as an insulator thus trapping greenhouse gases then what cools the atmosphere?

      Radiation escaping to space from higher up in the atmosphere. Which means AGW => stratospheric cooling.

      • Paul. says:

        David Appell say:

        “Radiation escaping to space from higher up in the atmosphere. Which means AGW => stratospheric cooling.

        Is your suggestion therefore that winter, i.e – colder climate – in either hemisphere is brought about by radiation escaping to space from higher up in the atmosphere and not as a result of earths orbital obliquity around the Sun resulting in intensification of the polar vortex?

          • Paul. says:

            David Appell says: “No”

            David Appell does not suggest that winter, i.e colder climate in either hemisphere is brought about by radiation escaping to space from higher up in the atmosphere.

            If that is not your suggestion, as you have stated, do you agree that winter, i.e colder climate in either hemisphere is brought about as a result of earths orbital obliquity around the Sun resulting in intensification of the polar vortex?

          • David Appell says:

            Paul: I’m not playing dumb games.

          • Dr Roys Emergency Moderation Team says:

            Well, I don’t know about that…

          • David Appell says:

            I don’t go around telling people to shut up.

          • Dr Roys Emergency Moderation Team says:

            No, you do far worse…you appeal to Dr Spencer to try to get them banned.

          • David Appell says:

            I commented today that a vicious anti-Semite should be banned. As he should be. Yet Roy has let his comment stand for at least a day now.

            You can dismiss the GHE when you can disprove the copious evidence for it. Buy you don’t even try. Nor have you been blocked. Stop whining.

          • Dr Roys Emergency Moderation Team says:

            I’m not talking about the anti-semite. You appeal to Dr Spencer to try to get regulars here banned. That’s worse than going around telling people to shut up. Stop whining.

    • Eben says:

      to create a slow down in thermal transfer you need to employ a thermal insulator , CO2 is anything but , it does the exact opposite ,CO2 is a thermal conductor, it facilitates heat transfer.

      • David Appell says:

        CO2 absorbs heat at certain wavelengths, and then emits it in a random direction.

        That’s what an insulator does, such as a blanket you sleep under or a coat you wear.

      • Eben says:

        The climate shysters always say exactly only one half of the story that the CO2 absorbs IR and transfers the heat into the air by bumping into surrounding molecules as if it was one way street , in reality the process works just as well in the opposite way by CO2 absorbing heat from air and radiating it away as IR
        The nonsense theory of CO2 acting as some kind of blanket is invented by academics who never design and build anything functional and have no idea how things work in real life

  66. Paul. says:

    David Appell Says: That stratospheric cooling cools the atmosphere, although he does not disagree that winter, i.e colder climate in either hemisphere is brought about by as a result of earths orbital obliquity around the Sun resulting in intensification of the polar vortex. By the same measure David Appell must therefore agree that colder hemisphere climates result from a reduction in solar irradiance.

    My questions to Ms Appell are therefore rather a simple.

    If a decline in solar irradiance results in a polar vortex that results in colder climates across respective hemispheres and an increase in solar irradiance results in the dispersal of those polar voracious and results in an increase in warmer climates then could Mr Appell explain to me how solar irradicance is not the dominant driver of Earth’s climate regardless of high or low levels of CO2?

  67. David Appell says:

    If a decline in solar irradiance results in a polar vortex…

    1) define “polar vortex.”

    2) show what science supports your claim about the decline in solar irradiance.

    • Midas says:

      Even if there were science to back up their claims, what they don’t get is that proper climate science predicts a similar outcome. They need to get their conditional probabilities right …

      P(polar vortex | their explanation)

      … is not the same as …

      P(their explanaton | polar vortex)

    • Paul. says:

      Mr Appell,

      I am deeply shocked – as will be others reading this – that you should need to ask me to define what a polar vortex is and even more shocked – (steps back in amazement) – that you should ask me to provide the science to you that as a result of earths orbital obliquity the respective hemispheres receive less solar irradiance, that results in a polar vortex. Good God man do you not know what causes the four seasons, is this where we are at with you? Is this indicative of the level of intelligence we are dealing with here? Do you not realise others reading this will be leaning back in their chairs laughing in disbelief and what you are asking for ?

      • Midas says:

        That is NOT the cause of a “polar vortex”, properly called the jet stream. Is is caused by the difference between polar temperatures and sub-polar temperatures IN THE SAME HEMISPHERE. And it requires the earth’s spin to exist. It does NOT require the earth’s axis to be tilted. The seasons simply cause a shift in its average latitude between summer and winter. Perhaps you shouldn’t question other people’s intelligence until you do some proper reading.

        • Midas says:

          To clarify – the jet stream is the boundary of the cold air mass. Some people refer to the boundary as the “vortex” while others refer to the cold air behind it.

        • Paul. says:

          Midas,

          So here we are – now two of you have no idea of what you are attempting to write about. Thank God other people are reading this!

          Are you attempting to suggest that polar voracious exist during the summer? No, you have just very clearly read the wrong information, so let me provide the correct information: What is the polar vortex?

          “The polar vortex forms every winter because of the temperature difference between the equator and the poles. In the polar stratosphere, sunlight basically gets cut off during the late fall and early winter – and that makes it really cold, while the equator remains quite warm.

          A jet forms to balance this temperature difference. This jet is what we call the polar vortex or the polar night jet. It flows in a complete circle around the pole, 10 kilometers or a little over six miles above the Earth’s surface.”

          “sunlight basically gets cut off during the late fall and early winter” “sunlight basically gets cut off during the late fall and early winter” “sunlight basically gets cut off during the late fall and early winter”

          https://earth.stanford.edu/news/polar-vortex-science-behind-cold#gs.85d68a

          • Paul. says:

            * “polar voraciou” should be “polar vortices” (My bad).

          • Midas says:

            If you read the NOAA description (you know – the people actually responsible for studying weather and climate) you will see that it lasts all year long high in the Arctic and merely expands southwards during the winter.

            But thanks for agreeing with a site that attributes changes in the polar vortex to increased CO2 and planetary warming. It’s good to know you agree with them that it has nothing to do with solar activity.

          • Paul. says:

            Midas,

            As anyone who reads this can clearly see what I have done is identified what causes a polar vortex, that being the lack or reduced solar irradiance. Strangely enough the same thing that causes winter, i.e a colder climate.

            My confirmation as to what causes a polar vortex cannot be taken as an agreement for anything other than that.

            Anyone else reading this will see that it is solar activity/solar irradiance or lack of that causes and drives the polar vortex and your rather bizarre attempt to suggest that I agree with someone else’s opinion that is contrary to my own is laid bare for all to see.

            It is somewhat obvious that you had no prior knowledge or understanding of what a polar vortex is or what drives climate so in this respect I am glad that you have been schooled and educated to the point where you cannot disagree with the fact it is indeed driven by a nearly perfect sphere of hot plasma, with internal convective motion that generates a magnetic field via a dynamo process. that’s called the SUN!

          • Midas says:

            So when you link to sites, you are permitted to cherry pick which part of the link to believe?

          • Dr Roys Emergency Moderation Team says:

            That’s right, yes. You can take whatever you want from any source, and disagree with whatever parts you want. All is “permitted”. Freedom of thought and expression…isn’t it great?

          • Midas says:

            You clearly meant freedom of BELIEF.
            What then is the point of him linking to this source? All he is saying then is “Here is someone who BELIEVES what I believe.”

          • Dr Roys Emergency Moderation Team says:

            Why is it with you people that everyone “clearly means” something other than what they said?

        • Paul. says:

          Midas,

          Let NASA Jet Propulsion Laboratory educate you, and you will take note that at 0:34 seconds, “THE REASON IT GETS SO COLD IS THAT THIS IS A REGION THAT GETS NO SUNLIGHT AT ALL FOR THE ENTIRE WINTER SEASON”

          No sunlight equals diminished solar radiation which equals cold climate. Because of course – it is the Sun that drives Earth’s climate!

          https://www.youtube.com/watch?v=6KEkSfgHJNk

          • Midas says:

            Saying that the polar vortex exists in summer is not saying it gets as cold in summer in winter. I have not made such a claim.

          • Paul. says:

            Midas,

            If you wish to suggest I am cherry picking NASA Jet Propulsion Laboratory videos from Youtube then the answer is absolutely yes, did you not attempt to cherry pick from NOAA?

            Regardless of empty words the facts are clear, you displayed no understanding of what causes a polar vortex, and hence you had even less understanding of what drives Earth’s cold climate during winter as the above comments substantiate rather dramatically.

            At no time did I ever allege that you made the claim that it gets as cold in summer as it does in winter, clearly you are deluded.

            Now lets move the conversation forward, Do you agree or disagree with the facts stated in the NASA Jet Propulsion Laboratory video, i,e. “THE REASON IT GETS SO COLD IS THAT THIS IS A REGION THAT GETS NO SUNLIGHT AT ALL FOR THE ENTIRE WINTER SEASON”

            If you disagree then state why you disagree.

          • Midas says:

            The reason that it gets so cold IS that the area gets no sunlight AND that the jet stream generally contains that cold to the Arctic.

            But ‘kinks’ develop in the jet stream which cause cold air to leak further south at some longitudes and warm air to be carried further north at other longitudes. This has always happened.

            When the jet stream weakens, these kinks become more frequent and larger.

            The strength of the jet stream is dependent on the temperature gradient between the Arctic and the areas further south. As the Arctic is warming faster than the rest of the planet, that temperature gradient is lessening, causing the jet stream to weaken.

          • Paul. says:

            I am struggling to comprehend the notion that it is necessary for me to provide to you this information but nonetheless:

            “Over the course of a year, the angle of tilt does not vary. In other words, Earth’s northern axis is always pointing the same direction in space. At this time, that direction is more or less toward the star we call Polaris, the North Star. But the orientation of Earth’s tilt with respect to the sun – our source of light and warmth – does change as we orbit the sun. In other words, the Northern Hemisphere is oriented toward the sun for half of the year and away from the sun for the other half. The same is true of the Southern Hemisphere.”

            https://earthsky.org/earth/can-you-explain-why-earth-has-four-seasons

          • Midas says:

            And no – the cherry picking refers to the Stanford link, where you accept their definition for the “polar vortex”, yet choose to deny their reason for it.

          • Midas says:

            Your new comment is basic science. There is nothing I have said which would suggest that I don’t understand the origin of the seasons. Try to avoid arguing against a straw man.

          • Paul. says:

            Ah so by your statement “The reason that it gets so cold IS that the area gets no sunlight” So you must now agree that sunlight equals solar irradiance and being as there is little to no solar irradiance that equals a cold climate, that the Sun or solar irradiance causes a colder climates in their respective hemispheres and equally an increase in solar irradian equals a warmer climate, now, do you agree or disagree with the above if you disagree then specify exactly what you disagree with and state your reason for disagreeing. Isn’t education a wonderful thing ! I like the notion that you can accept the fact that as a result of little to no solar irradiance the climate gets colder, although that’s a rather basic fact you originally had trouble with.

          • Midas says:

            Stop being a child. At no point did I disagree with that. Are you now going to factor in the 0.1% difference in TSI between the Maunder minimum and the peak of the 1980s and claim it to be significant?

          • Paul says:

            Err no you cannot really get away with stating :

            Midas says:
            October 5, 2019 at 4:09 AM
            Your new comment is basic science. There is nothing I have said which would suggest that I dont understand the origin of the seasons. Try to avoid arguing against a straw man.

            October 4, 2019 at 10:47 PM
            That is NOT the cause of a polar vortex, properly called the jet stream. Is is caused by the difference between polar temperatures and sub-polar temperatures IN THE SAME HEMISPHERE. And it requires the earths spin to exist. It does NOT require the earths axis to be tilted. The seasons simply cause a shift in its average latitude between summer and winter. Perhaps you shouldnt question other peoples intelligence until you do some proper reading.

            What you said that made it perfectly clear that you had no understanding was ” It does NOT require the earths axis to be tilted. The seasons simply cause a shift in its average latitude between summer and winter.”

            As you NOW understand it does require that the earth is tilted, as in away from the Sun for a colder sun driven climate and towards the Sun for a warmer climate – isn’t this fun ?

          • Paul. says:

            Oh please it’s a little early to be talking TSI and Maunder minimum , is that 0.1% by proxy or by Carbon 14 ? Anyway we really should stick to the subject matter, but.. saying that ..how much does the TSI drop during winter when the Sun is tilted away from the Sun and that polar vortex kicks in ? We will move forward in due course once outstanding issues are agreed upon. Solar irradiance results in climate, agreed or disagree ??

          • Midas says:

            You just can’t help the childish tone, can you.

            No it does not require the axis to be tilted. As your link stated, it is caused by the temperature difference between the poles and the equator, NOT by the temperature difference between the two hemispheres as you claimed. Are you now going to deny another claim from your own link?

            “is that 0.1% by proxy or by Carbon 14”

            Carbon 14 IS a proxy. Do you even know what a proxy is? There are ONLY proxies for TSI before the instrument record.

          • Paul. says:

            Actually, being as you are now educated in respect of what causes and drives the seasons we can agree that solar irradiance is the main driver of Earth’s climate can’t we ?

          • Midas says:

            So you are just going to ignore my previous post and return to the trolling.

          • Paul. says:

            We shall get to your proxy C14 proxy data in due course. I would like you to remember that other people are reading this. You sate:

            “No it does not require the axis to be tilted.” Is that what she wrote? Yes.. that IS what she wrote..

            Earth has seasons because our planet’s axis of rotation is tilted at an angle of 23.5 degrees relative to our orbital plane the plane of Earth’s orbit around the sun. The tilt in the axis of the Earth is called its obliquity by scientists. As a result of the tilt the Northern hemisphere tilts away from the Sun during winter, this results in low solar irradiance, which results in a polar vortex, clearly if there was no tilt away from the Sun there would be no reduction in solar irradiance, (I cannot believe I am having to explain this, I know people are laughing out there at the stupidity of it). So yes it does require the Earth’s axis to be tilted at 23.5 degrees relative to our orbital plane.

            Do you agree or disagree that Earths axis has to be tilted in order for the poles to be tilted towards and away from the Sun?

          • Midas says:

            Who is “SHE”?

            The “polar vortex” is NOT just cold air. It refers to the fact that the cold air is trapped north of the jet stream. When the polar vortex enters the US, it is the JET STREAM which has kinked to the south, allowing the cold air to fall in behind.

            The JET STREAM is NOT caused by summer/winter temperatures, it is caused by temperature difference between the Arctic and the lower latitudes ALL YEAR ROUND.

            Without the jet stream, the US would be subject to PERMANENT cold air from the Arctic.

          • Paul. says:

            “She” is you!

            I do not need you to explain to me what a polar vortex is, I am fully aware of what it is and what it does.

            By your comment : “October 5, 2019 at 4:04 AM
            The reason that it gets so cold IS that the area gets no sunlight”

            You now agree that the Sun drives cold climates and chimate change.

          • Midas says:

            There is nothing in what either you or I have said which would suggest that the sun drives climate CHANGE.

            And eff knows why you would refer to me as “she”.
            Was that supposed to be some sort of an insult – ie. are you a sexist pig?
            Sorry – stupid question – you’re a conservative – of course you are.

          • Paul. says:

            Midas states

            “October 5, 2019 at 7:18 AM
            There is nothing in what either you or I have said which would suggest that the sun drives climate CHANGE.”

            But

            By your comment : October 5, 2019 at 4:04 AM
            The reason that it gets so cold IS that the area gets no sunlight

            You agreed by virtue of that statement that the Sun drives cold climates and climate change. No sunlight equals cold, that proves sun is the main driver of cold, when you take the sun away it gets cold, pretty dam basic isn’t it? When climate changes from hot to cold we call that climate change, what else would you call it ? So by virtue of your statement you did say that. You would have to be somewhat lacking in intelligence to disagree. If the sun was removed from the equation we would have a frozen earth. I was informing the other readers of what you said and I rfered to you as a she because you are a female.

            Now why would you mention the word pig? Are you attempting to insult Muslims? Sexist ? Am i sexist.. No I don’t believe I am, I was merely referring to what you said i.e. Did she say that? Conservative ? Well I have had difficultly in not insulting your stupidity so that is rather conservative of me if that’s what you mean?

            NASA stated the Sun is the main driver of climate on Earth – you know that right? Why have you had so much trouble trying to agree? What else do you think drives earths climate the core? Flux Capacitor? Cow farts? No honestly what is it other than the Sun that could drive Earths climate, all four seasons? Where is your head at ?

          • Midas says:

            You appear to be arguing that changes from summer to winter represent climate change.

          • Midas says:

            And you continue to conflate the concepts of CLIMATE with climate CHANGE.

          • Bindidon says:

            Paul

            Did you never ask yourself why, if it’s cold only when there is no sunshine, the minimal temperatures in the winters increase faster than those in the summers?

            You of course will see this only when building departures from the mean over e.g. a 30-year period.

            Simply because when looking at absolute temperatures and sorting them down, you obviously will see only (boreal or austral) summer temperatures.

            Look at all GHCN daily weather stations located in the NH (to avoid scrambling with the inverted SH); there are, in the sum for 1880-now, about 37000, and for 1979-now, about 15000 per year on average, distributed over about 1700 2.5 degree grid cells.

            Now take the down sort of an anomaly time series generated out of these stations, e.g. wrt the mean of 1981-2010, and check for the usually colder months in the NH (Nov, Dec, Jan, Feb, Mar, Apr).

            The top10 of the sort

            2016 3 1.21
            2016 2 1.18
            2015 12 1.13
            1939 12 1.09
            2007 1 1.02
            1899 11 0.93
            2016 4 0.90
            2006 12 0.79
            2015 11 0.78
            2010 4 0.77

            contains only such months, and 8 of them belong to this century; the top20 has 17, 13 of them belonging to this century; the top100 still has 53, 44 of them belonging to this century.

            I don’t have the time series for the remaining stations located in the SH (probably 6000), but they won’t behave very different.

            Maybe you think a bit about this?

          • Paul. says:

            Bindidon, what is the origin of the data you attempt to rely upon ?

            Midas, you have lost every argument now please stop trolling me!

          • Bindidon says:

            Paul.

            “… what is the origin of the data you attempt to rely upon ?”

            Wow! A bit arrogant, huh?
            Why don’t you google for ‘GHCN daily’ by your own?
            Is that too difficult for you?

            https://tinyurl.com/mlsy22x (tinyURLd because of the ‘d c’ syndrome)

            Hint: don’t click on the ‘all’ directory (that results in your browser displaying ovder 100,000 lines).

          • Paul. says:

            You expect me to consider data sets that you know full well have been tampered with? You’re crazy!

          • Bindidon says:

            Paul.

            “You expect me to consider data sets that you know full well have been tampered with? You’re crazy!”

            Here you give a good proof of your thorough ignorance, and also of the known fact that arrogance and ignorance do pretty good coexist.

            GHCN daily is one of the rawest data sets you can obtain.

            I contains even errors due to undiscovered transitions from Celsius to Fahrenheit in station records. No one would be dumb enough to tamper such raw data!

            I stop communication here, because you don’t know what you talk about.

            One Robertson per blog is well enough.