A follower of our UAH global lower tropospheric temperature (LT) dataset named “JJ” emailed me asking about what might be considered a spurious feature in the dataset.
The feature is most easily seen if you plot the monthly global time series of Land-minus-Ocean (hereafter “L-O”) temperature anomalies. The result seems to show a step-up of about 0.16 deg. C in May of 1998.
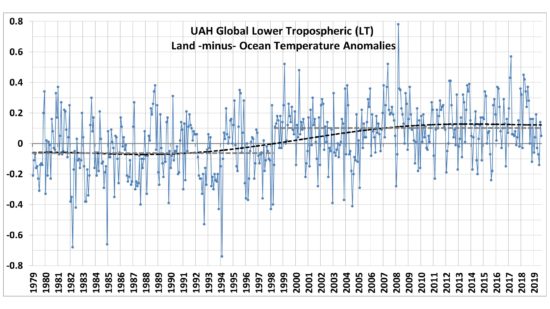
The year 1998 is key for our dataset because that is when the first (NOAA-15) Advanced Microwave Sounding Unit (AMSU) came online, which initiated the transition from the older Microwave Sounding Units (MSU, the last of which was on the NOAA-14 satellite).
AMSU did not have exactly the same channel frequency selection as the MSU, so the nominal layers of the atmosphere sensed were slightly different. Most importantly, the AMSU channel 5 has a weighting function that senses somewhat more of the surface and lower troposphere than MSU channel 2. If one did not account for this fact, the AMSU’s greater surface sensitivity would produce higher temperatures over land and lower temperatures over the ocean (after a global-average intercalibration between MSU and AMSU was performed). [The reason why is that these channel frequencies are not sensitive to changes in sea surface temperature, because the microwave emissivity decreases as SST increases. The effect is small, but measurable.]
But since these are through-nadir scanners, each view angle relative to the local vertical measures a slightly different layer anyway, which allows us to match the AMSU and MSU measurements. When we developed Version 6 of the dataset, we found that the 50-60 GHz oxygen absorption theory used to find the view angle from AMSU5 that best matches MSU2, the resulting temperature anomalies over land were still too warm relative to the oceans. This meant that we had to perform an empirical (data-dependent) rather than theoretical matching of the AMSU and MSU view angles.
The way we gauged the match between MSU and AMSU is how the temperature anomaly patterns transition across coastlines: we required that there should be little discernible change in that pattern. Before our optimized matching, the land anomalies were noticeable warmer than the ocean anomalies as features crossed coastlines. But after optimization in our Version 6 dataset, here’s the LT anomaly map for last month (October 2019), which shows no evidence for land-vs-ocean artifacts.
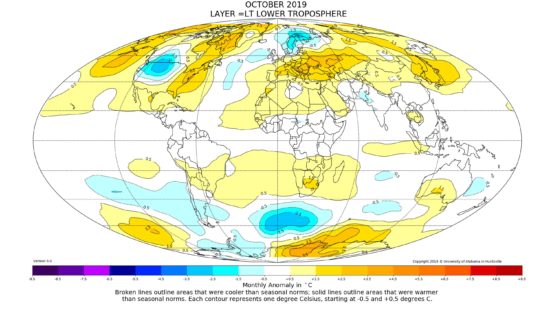
Nevertheless, adjustments like these are never perfect. So, the question remains: Is there a spurious change in the L-O temperature difference occurring in 1998?
Evidence that the L-O change in 1998 is real
There are a few lines of evidence that suggest the May 1998 step-up in L-O temperatures is real.
First, if the effect was due to the introduction of AMSU in 1998, it would have occurred in August, not in May (3 months earler). Also, the effect should have been gradual since for almost 4 years after August 1998 the LT dataset is half MSU (NOAA-14) and half AMSU (NOAA-15), after which it becaume 100% AMSU.
But a more important piece of evidence is the effect of El Nino and La Nina on L-O. During El Nino, the ocean airmasses warm more than the land airmasses (especially in the tropics), so that L-O tends to be more negative. Up until the 1997-98 super El Nino a period of greater El Nino activity existed, after which a shift to more La Nina activity occurred. (This is probably also what caused the extended global warming ‘hiatus’ after that El Nino event.)
I statistically regressed the L-O values in Fig. 1 against 3-month running averages of the Multivariate ENSO Index (MEI), and removed that estimate of the ENSO influence from the data. The resulting ENSO-adjusted time series in shown in Fig. 3.
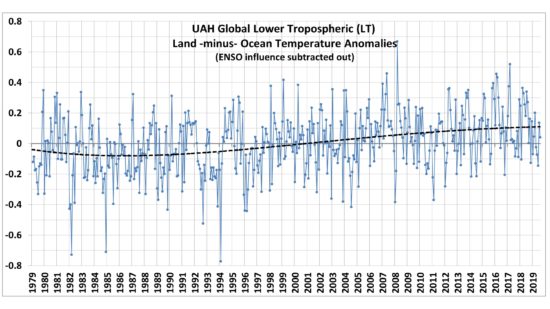
Note the step-up in mid-1998 is much less evident, and the 5th order polynomial fit to the data is smoother with a more gradual transition in L-O over the 41-year satellite record.
But that’s not the only thing going on during this period that affects the L-O values. There were two major volcanic eruptions (El Chichon in early 1982, and especially Pinatubo in mid-1991) that caused more cooling over land than ocean, causing temporarily enhanced negative values in L-O. Since these events are not as easily correlated with an index like MEI is with ENSO, I simply removed the data from 1982-83 and 1992-93 in Fig. 3 and replotted the results in Fig. 4.
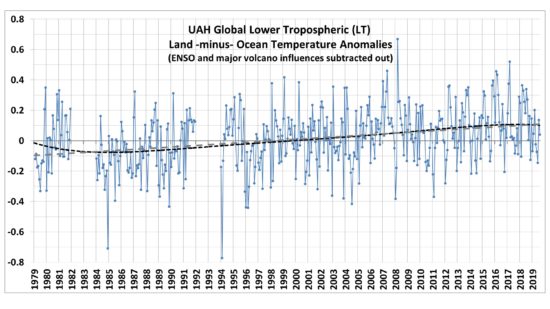
Now we see that the 5th order polynomial fit to the data comes quite close to the linear trend (dashed gray line), which suggests that the step-up in 1998 in L-O was real, and related mostly to a change in ENSO activity before versus after the 1997-98 super El Nino, and with the major volcanic eruptions in 1982 and 1991 contributing to the seemingly spurious feature.
The remaining upward trend in L-O is simply the land airmasses warming faster than the ocean, as would be expected for any warming trend, whether natural or human-caused.
There remains what might be a spurious feature during 1980-81 in Fig. 4, which would most likely be related to our ad hoc correction for MSU channel 3 drift during that time. This, however, should have little influence on the land and ocean trends as evidenced by the trend line fit (dashed gray line) in Fig. 4.
Roy,
I seem to recall another step-up appearing after the 2016 super El Nino. Has this been verified as well? If so, it seems like a strange and interesting characteristic of nature that has yet to be explained.
If there is a step-up on global average temperature, it might well also exist in Land-minus-Ocean temperature difference, since they have different trends.
La Nina events are periods when solar energy enters the thermal reservoir of the ocean; El Nino events are when this heat is transferred to the surface and thence the atmosphere on it way back into space.
This is a process of energy through-put and should not be seen a net zero climate “oscillation”. This is a word game played by mainstream climatologists based on the arbitrary assumption that all long term rise is AGW and anything else must be net zero internal “oscillation”.
All of the multitude of XXO “oscillations” are detrended by definition.
This precludes, a priori, any contribution to long term trends by changes in ocean currents or ENSO. The result is predetermined by arbitrary definition, not by scientific investigation.
For this reason I think any attempt to subtract these oscillations is flawed. It also seems to preclude the possibility that vulcanism, events like Mt P produce a climate response in ENSO. It is possible that cooler post 1991 period increased absorbed solar through less cloud and dumped it out in 1997/8 . After the initial blip, Mt P also made TLS cooler implying more solar making it into the troposphere. This all contributes to the warming which gets spuriously attributed to AGW.
I would caution against simplistic subtraction. All these events are mutually interactive and cannot be added as independent “oscillations”.
In figure 10 in this article on the tropical response to Mt P, it showed that there was a cumulative warming starting shortly after the eruption which continued to the end of the ERBE data.
https://climategrog.wordpress.com/2015/01/17/on-determination-of-tropical-feedbacks/
There is a marked dip in that curve in the early part of 1998, so ERBE data may give some corroboration of this anomaly discussed here.
link to fig 10 mentioned above;
https://climategrog.files.wordpress.com/2014/04/tropical-feedback_resp_ci.png
the dip seems to be the first 4 months of 1998 and this analysis was based on tropics only. Globally averaged effect may be later, I have seen various claims of between 3 and 9 mo lag for max correlation with ENSO.
Chaotic oscillations are not net zero. In fact the average also oscillates chaotically.
A post 2016 step up is not apparent yet by the old eye-crometer, looking at the first graph above, but might become apparent with time if it is real.
As has been pointed out, in a gradually warming trend punctuated by occasional peaks (eg el Nino events), the following periods can look like step-ups when they aren’t.
http://www.drroyspencer.com/2013/11/the-magical-mystery-climate-index-luis-salas-nails-it/
Thank you barry for that link to comments 6 years ago. It contains this classic from Salvatore:
“I am quite confident that if prolonged quiet solar conditions continue going forward that the global temperature trends will be down. In fact I expect to see this trend in global temperatures to set in within 6 months of the ending of the maximum of solar cycle 24, which is not that far off.”
LOL !
I miss Salvatore. He has the courage of his convictions and seldom, if ever, responded to sarcastic comments directed at him in kind.
Hi Roy,
I’ll start by letting everyone know that I’m the “JJ” you mentioned at the beginning of this post.
I would like to thank you for posting about this apparent step up in the “Land minus Ocean” time series, but this is NOT what I was asking you about. Frankly, I don’t even understand why you shifted this to “Land minus Ocean” and are focusing on the 1998 step change.
I was asking you about the “Ocean minus Globe” time series, and in particular the step-up in Jan82 and the subsequent step-down in Jan94. I feel that this may be significant because the step up and step down occurs at the exact beginning and end of the time period you used for your regression.
If we look at the entire early part of the “Ocean minus Globe” time series, we see another interesting feature. When you look at “Ocean minus Globe” from Dec1978 to Jan1997 what you see is basically this….
\__||__/
The elevated section in the middle is the period Jan82 to Jan94 with the three years before and the three years after being virtually mirror images of each other. The complete symmetry of this period also concerns me.
While I appreciate all the effort you’ve put into this post, it doesn’t really address what I was asking you about.
The special characters I used in my previous comment didn’t show up and it makes my representation look completely wrong. If I use asterisks to denote high points then it would be this….
**\__|**************|__/**
A difference between “Ocean” and “Globe” is a weird thing to plot because “Globe” contains “Ocean”. So, what you are really asking about is “Land-Ocean”, and I have shown in my final graph is that there is nothing spurious-looking after accounting for ENSO and the major volcanic eruptions. Did you even read what I wrote?
Ocean minus Globe basically means Land inverted.
> what you are really asking about is Land-Ocean
well apparently not, and not the years he mentioned, did you even read what he wrote? 😉
The whole idea of ocean – land seems laden with problems anyway, not least it has significant hemispherical bias, not to mention the questionable value of “averaging” temperatures across different media having noted that land changes much quicker.
As a physicist, I’d like to know what value you attach to such a physically unreal average. It’s hard to think it can be related to radiation in some sort of energy balance equation since it is not related to energy.
If some energy came out of the ocean ( due to a strong El Nino for example ) it would have a greater effect on land which has a less specific heat capacity. Thus land-ocean would rise. So I agree it probably does not indicate an instrumental fault.
skeptical:
Maybe you are looking at random, perfectly normal, temperature variations, and seeing a “pattern” that you think is abnormal ?
We only have 40 years of near global coverage average temperature data, from UAH, and far from global coverage from the surface measurements / infilling guesses, before 1979.
Looking at 40 years of data, we have all sorts of unusual, unexplainable temperature “patterns”, and no way of deciding what “normal” climate change is.
Although we have no idea what a “normal” global average temperature is … we do know it has been colder for most of the past 100,000 years … and if we had any sense, we would enjoy our Holocene inter-glacial period … before it ends.
I would suggest, based on proxy-based temperature reconstructions, that a change of +1.0 degrees C. in a century, either warming or cooling, is nothing unusual.
Unfortunately, we can’t expect every decade to have a change of exactly 0.1 degrees C.
.
.
The attention given to a single global average temperature is propaganda.
That single number hides important details that make global warming less scary:
Most warming is in the northern half of the Northern Hemisphere, most warming is during the coldest six months of the year, most warming is at night, and there’s no obvious CO2 related warming affecting all of Antarctica — just some local warming near the underseas volcanoes — warming patterns that could not be caused by CO2 changes.
The details are FAR more important than a global average temperature that no one lives in
Even more important to me, is the temperature in southeastern Michigan, where I live.
It was cold when I moved here in 1977, and 2019 may be the coldest year yet !
I demand our fair share of global warming, or someone will be sued !
The coming climate change “crisis” is the biggest science fraud in world history.
No one living on this planet has the ability to predict the climate in 100 years.
Not even whether it will be warmer, or cooler.
Therefore, the claim of a coming crisis is just an opinion, coming from people who have grossly over-estimated global warming in the past.
IClimate scaremongering, since the 1970s, would be even worse without the UAH temperature data, which puts some limit on the magnitude of surface data “adjustments”
( obvious science fraud, that keeps changing climate history, and creates more global warming out of thin air. )
It would be nice if someone could respond to this article I found on the web:
https://www.msn.com/en-us/weather/topstories/photos-from-space-reveal-what-climate-change-looks-like-from-melting-arctic-ice-to-rampant-california-fires/ss-BBWqqYp?ocid=spartandhp
Once again, I am not seeing into this. Here in the Upper Midwest we had a very average summer temperature wise. It was rather wet but then again, we get wet summers and dry summers.
On this very same news source there was another article this morning claiming that next week’s cold blast could break records going back 170 years. Can they really have it both ways?
Best Regards,
Fred M. Cain
How do you respond to such cherry picked propaganda? So many half truths! Ice is being “shed” at an increasing rate. Calving of glaciers is a function of snow/ice accumulation higher up. More ice shedding = more ice accumulation upstream. Fires are doubled in last several years but are an order of magnitude down over a century. Etc.
Dr. Spencer, The UAH LT v6 is a weighted combination of your three channels, that is, MT, TP and LS.
Did you test each channel to determine which exhibited the step shown in your first figure? Also, your suggestion that the step might be related to ENSO and the 1998 El Nino, did you test only the tropical land vs. ocean data, which might be most impacted by a change from the El Nino?
A related question in my mind is this. As I understand it, your V6 MSU processing bins data into 1×1 deg grids, which are later down scaled into 2.5×2.5 grids, which was the grid size used with the earlier versions. Why didn’t you stay with the 1×1 deg grid and process the higher resolution AMSU data into that same grid, which would have enhanced the distinction between land and ocean grid boxes and thus improve the resolution of the later division into land and ocean portions of the LT, etc?
(1) The three channels’ weighting functions overlap, and I did not examine them separately because the question was sufficiently answered without doing that. (2) Our binning of the data is done on a 2.5 deg. grid, I don’t know where you got 1 deg. In my experience, higher resolution would not substantially affect results such as these.
Dr. Spencer wrote:
In your APJAS (2016) paper pre-print, you wrote:
Thus it appears to me that you did have a data set with a 1×1 deg grid at some point in the processing.
Another question: Why did you all “smear” the MSU data in both latitude and longitude, or, just in longitude? The scan separation of the MSU ground track at low latitudes appears to be about 180 km (S, C & G 1990), which would appear to fit into a 1 deg. latitude spacing. Things get interesting at the highest latitudes as the ground track becomes east/west instead of nearly north/south, but then the tracks from successive passes are very close together.
Global surface temperature alone has little value to understand what is really going on with the climate. Climate change and its effects are very complex.
It is interesting that 2016 el nino did not have the same step in L-O as the 97 98 one, but had a similar super el nino status and step up in UAH L Trop global data set (so far in the couple years of data after). I wonder if it was the warm Pacific decadal oscillation (PDO) plus super 97 98 el nino or the transition from warm PDO to a cool PDO (more la nina) coeval with 97 98 super el nino that caused the difference in L-O rather than the super el nino itself?
The implication could be the next 15 yrs after 2016 step up in UAH global temp might be different than the “hiatus” that occurred after 97 98 because the longer period PDO is in a different phase. Perhaps a warm PDO will produce more warming in the next decade.
Good a new hypothesis for me to watch for!
” Climate change and its effects are very complex.”
So is reading chicken entrails… I give both about the same chance to predict the future
More from Dr. Ed Berry:
https://edberry.com/blog/climate-physics/agw-hypothesis/climate-alarmists-use-junk-science-to-promote-their-agenda/
Ah, Ed Berry. Yet another AGW annihilator. The Climate Stupiditists really have their work cut out them these days, closing their eyes and ears to all the new papers completely demolishing their pathetic religion published every other month. It’s great fun watching bad people lose.
N
O
G
H
E
The absorppption and emmission of infrared by gas molecules in the atmosphere is the one and only physical property necessary ane sufficient for the greenhouse effect.
So sorry charlie
It continues to survive all debunking attempts.
I said “AGW annihilator” not “GHE annihilator”. Ed Berry isn’t writing about the GHE. Wrong again, blob (and what you said about the GHE was wrong, anyway).
N
O
G
H
E
Ed Berry !
That arm-chair warrior who is based at his home address?
Who is so clever he has to remind us that “In high school, I scored a perfect 800 on the SAT exam while finishing in half the allotted time.”
Who got his BS degree (well done!) back in 1957- that makes him over 80 years of age in my book.
LOL
https://www.drroyspencer.com/2019/11/on-the-1998-apparent-step-up-in-uah-land-minus-ocean-lower-tropospheric-temperatures/#comment-404816
N
O
G
H
E
I like his #2 though, deforestation can not release any carbon, very reassuring.
#2
https://www.drroyspencer.com/2019/11/on-the-1998-apparent-step-up-in-uah-land-minus-ocean-lower-tropospheric-temperatures/#comment-404816
N
O
G
H
E
Thanks, very reassuring.
#3
https://www.drroyspencer.com/2019/11/on-the-1998-apparent-step-up-in-uah-land-minus-ocean-lower-tropospheric-temperatures/#comment-404816
N
O
G
H
E
Was it wrong?
“(and what you said about the GHE was wrong, anyway).”
How so, in your own words.
Can’t do it can you?
You said, “The absorppption and emmission of infrared by gas molecules in the atmosphere is the one and only physical property necessary ane sufficient for the greenhouse effect.”
That’s what’s known as a “motte and bailey” argument. It’s obviously easy for you to defend the idea that there are gases which absorb and emit infrared. That’s the “motte”. The “bailey”, the weaker position, is that an increase in these gases will necessarily result in warming.
You are trying to conflate the two. We see that a lot, from you people. “Does CO2 absorb IR?”, is a question that often gets asked, as if that’s the end of it. Dav.id App-ell used to do that, all the time.
It’s also the fallacy of confusing necessary and sufficient conditions. Absorp-tion and emission of IR is a necessary, but not a sufficient condition, for observing any so-called “Greenhouse Effect”
People see through this sort of thing now. Sorry, blob, you’ll have to try harder.
The bailey’s still pretty stout
https://www.nature.com/articles/nature14240?utm_source=commission_junction&utm_medium=affiliate
No cracks there, apparently your saps have been hoisted with their own petard.
So you’re going to pretend Feldman et al has never been discussed here before?
Last time I was told that the increased DWLWIR had no effect.
Very reassuring.
http://www.drroyspencer.com/2015/04/answering-ron-baileys-question-what-evidence-would-persuade-you-that-man-made-climate-change-is-real/#comment-187550
Here’s one of the earlier discussions. It has been brought up continually since, and debunked a dozen times already (most commonly linked to by Dav.id App-ell, as he was always one to play the game of bringing up stuff, and asking questions, that had already been debunked/answered, in the hope that people would stop bothering to repeat themselves, so it would look like they had no response). This one involves Kristian…your favorite, Svante, so I guess yes, you will have to be very reassured.
That’s right, there’s Kristian arguing what I just said.
OK, Svante.
N
O
G
H
E
Yeah, that one
Looks like Kristian lost that one.
The Bailey’s still stout, or is the Bailey’s in the stout.
I like a shot of Bailey’s in my stout.
Sorry if I haven’t read every thread on this site, but do you have a better debunking than that one?
Seems they are all the same, they get eaten by the alligators in the motte, before they even get to the Bailey.
Incorrect, but if you want to keep on searching, just Google “site:drroyspencer.com Feldman”.
Have fun.
N
O
G
H
E
Well then I would guess the Feldman paper has been retracted cause it’s wrong.
Well maybe not.
But you still won’t say what is wrong with it in your own words.
try that
Here’s a question
If I tattooed No GHE on my body, would you swallow it?
Gross, and weird.
If Feldman’s all you need, good for you.
Most people questioning the GHE realize that your obsession with changes in radiation, and associating that with temperature change, is mistaking cause and effect. Hence we see the Feldman paper as little more than a novel way to look at the spectrum of GHGs in the atmosphere.
Generally speaking, I can’t usually be bothered to repeat discussions that were had four years ago, so will just link to them, or encourage others to search for them.
Most people here seem to want to have the same conversations over and over again, month after month, year after year. I persevered with some conversations for a while, but eventually you realize it’s pointless going over the same things time and again. Just link back, instead.
All discussions about the GHE have been had, by now, at some point or other, some place or other. Those defending it, lost, and have been in denial ever since.
N
O
G
H
E
DREMPTY,
I took your advice and googled exactly what you posted
The first reply linked to a discussion here that had nothing to do with the Feldman paper. It was not a discussion of that paper just the usual tripe about no greenhouse effect.
“Most people questioning the GHE realize that your obsession with changes in radiation, and associating that with temperature change, is mistaking cause and effect.”
I’ll remind you that it doesn’t take a change in radiation for the greenhouse effect, and if you can’t summarize your objection to the greenhouse effect in a couple sentences, because you can’t be bothered, means you haven’t debunked it yet, nor have you linked to someone else’s debunking.
Links to drivel are still links to drivel and you still demonstrate that you don’t understand it.
Yes, we don’t need to discuss that again.
Interesting though that even the seasonal variation in CO2 back radiation was measurable.
Not really, Svante, no.
blob…whatever you say. I’m sure the enhanced Greenhouse Effect doesn’t have anything to do with changes in radiation. It’s never been about radiation, at all. What a ridiculous thing for me to say. The Greenhouse Effect is all about changes in the amount of ice cream.
You people will literally say anything.
Good luck to you all.
N
O
G
H
E
Dr Roys Emergency Moderation Team says:
“Not really, Svante, no.”
How do you explain those CO2 forcing variations (red, W/m^2) then?
You do agree that the CO2 variations (grey, ppm) are seasonal, don’t you?
Figure 4: Time-series of surface forcing.
https://tinyurl.com/y2ee7k3t
I meant “no, not really, it’s not interesting”.
N
O
G
H
E
Yeah, the result was expected.
Oh, absolutely. And, if you understood my comment about mistaking cause and effect, completely irrelevant. If you didn’t understand, read number 3), here:
https://tallbloke.wordpress.com/2019/01/17/nikolov-zeller-reply-to-dr-roy-spencers-blog-article/
Don’t be expecting a discussion about it, your education is not my responsibility. It’s your journey, and everybody has got to start somewhere.
N
O
G
H
E
Yeah, we sure don’t need to discuss Zeller and Volokin again.
Or Nikolov and Rellez.
Fine with me.
N
O
G
H
E
Drempty,
I am afraid your statement says it all
“It’s never been about radiation,”
Surely you are joking?
Maybe someone can tell my why the lapse rate depends on moisture?
“Surely you are joking?”
I was mocking you. Wow you’re dumb.
N
O
G
H
E
Good point though, radiation is a minor player at the surface, the GHE puts a lid on convection so everything inside the kettle must warm to restore TOA balance.
A point that nobody made…
N
O
G
H
E
DUMBSHIT
“I was mocking you. Wow you’re dumb.”
And an asshole
Calm down, blob. I didn’t ask you to start obsessively stalking me and jumping in on my comments. If you don’t like what you see in the mirror, don’t blame me. All I do is respond to people in the way I’ve been treated.
N
O
G
H
E
Swing and a miss!
If you can’t figure it out, study up.
What a joke! A crap paper in a crap journal that has only published 12 articles in 3 years.
And the author reckons human greenhouse gas emissions do not affect atmospheric concentrations! It takes a special type of crack-pot denialist to run this line.
No meaningful rebuttal to his new paper, then.
N
O
G
H
E
Arple, go away you dimwit! You aren’t even as smart as Dr. Berry’s jockstrap.
Oh, is that what you do Dr Empty Asshole?
Go back and search your history and see who started with the insults.
Clue, It wasn’t me, asshole.
You think your insults start with me, clown?
Science challenges authority every day.
As I learned in Calculus, step functions are not continuous functions.
All real world models are continuous.
Therefore the step change is just an artifact, it is not real.
They are also seen in the surface proxy record.
Dr Spencer,
You wrote :
“The remaining upward trend in L-O is simply the land airmasses warming faster than the ocean, as would be expected for any warming trend, whether natural or human-caused.”
This is true over a period of a few months and this is clearly seen on this graph: http://www.woodfortrees.org/plot/uah6/plot/uah6-land
This inertial effect already disappears on annual averages.
How do you explain that an inertial effect can reappear over multi-year periods?
I would add that since the inertial effect decreases over time, in the medium or long term, it is the tropospheric amplification effect that should dominate and therefore the warming should be greater on the oceans than on the land.
If you’re interested in truth:
The Plot Against the President by Lee Smith
https://www.amazon.com/Plot-Against-President-Congressman-Uncovered/dp/1546085025/ref=sr_1_1?crid=13EOBNRM4MPT1&keywords=the+plot+against+the+president&qid=1573395851&sprefix=the+plot+agains%2Caps%2C180&sr=8-1
LOL – If you’re interested in fiction, paranoia, right wing propaganda, and something completely off-topic, this book is for you.
The deep state, another word for sensible people.
It is sourced from the Congressional record and witness testimony.
Don’t know if this adds to the topic, but UAH has a lower trend since 1998 than the surface records and RSS TLT. Some radiosonde data match UAH 1998 TLT trend better. A lower trend makes the 1998 to 2014(ish) period look like a step instead of a general rise with punctuated peaks either end of the period.
AIRS has published the latest results of surface skin anomalies, based on satellite-borne infrared intruments, giving results closer to the surface records: but the data only go back to September 2002.
https://iopscience.iop.org/article/10.1088/1748-9326/aafd4e/pdf
The AIRS data appears to provide independent support for the GISTEMP surface data. Over the relatively short period covered, the AIRS data has a s lightly greater warming trend.
Of course, there will be some around this blog who would take issue with these results, since one author is G. A. Schmidt.
And Roy Spencer said the UAH record is consistent with AIRS, so we have to conclude that UAH and GISTEMP confirm each other, right?
Has anyone looked at temperature trends at various altitudes in terms of percentage change?
For example, if the global average at 2 meters is 288 Kelvin, an increase of 2.88 Kelvin represents a temperature change of +1%, whereas 1% warmer at say, 4000 meters, would be significantly less than 2.88 Kelvin.
If this idea has any merit it might help explain the discrepancy between TLT and surface trends.
@Bobdroege
Moist air is more buoyant than dry air.
If I understand correctly, this means that moist air that has risen and come to rest at 5000 meters altitude might be the same temperature as drier air that has risen and come to rest at 4000 meters……hence a different lapse rate.