
 Home/Blog
A follower of our UAH global lower tropospheric temperature (LT) dataset named “JJ” emailed me asking about what might be considered a spurious feature in the dataset.
The feature is most easily seen if you plot the monthly global time series of Land-minus-Ocean (hereafter “L-O”) temperature anomalies. The result seems to show a step-up of about 0.16 deg. C in May of 1998.
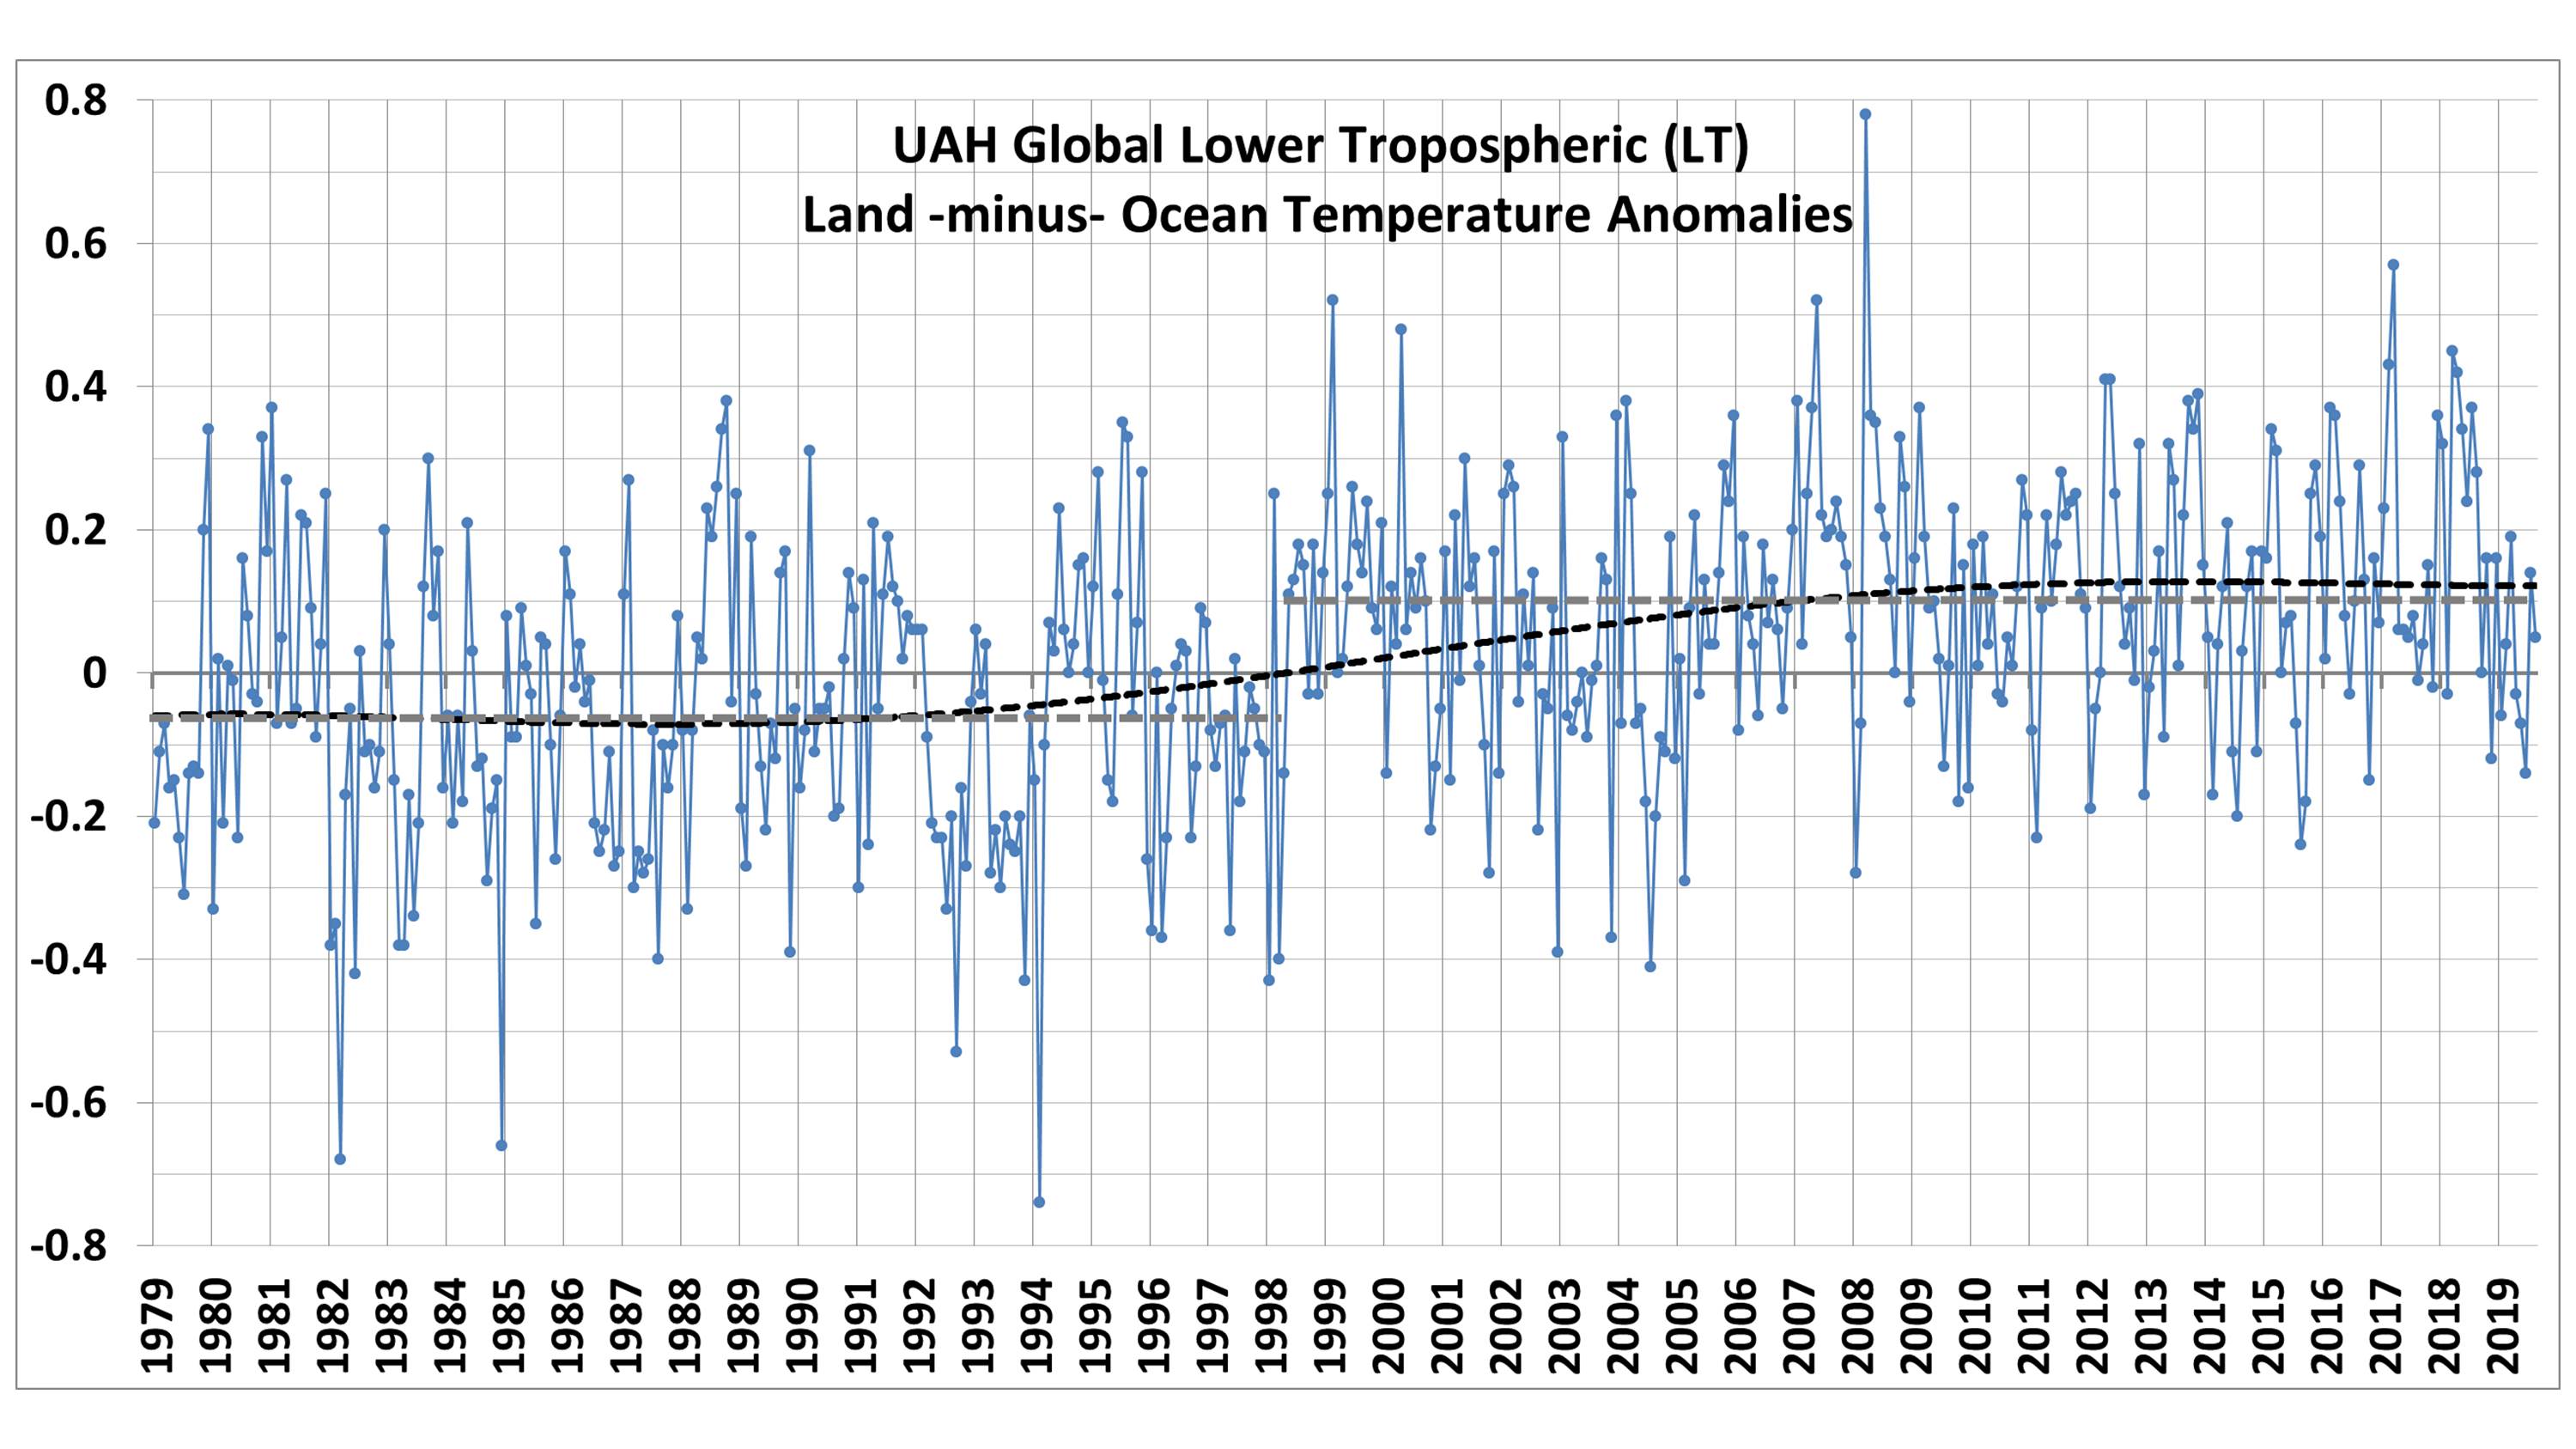
The year 1998 is key for our dataset because that is when the first (NOAA-15) Advanced Microwave Sounding Unit (AMSU) came online, which initiated the transition from the older Microwave Sounding Units (MSU, the last of which was on the NOAA-14 satellite).
AMSU did not have exactly the same channel frequency selection as the MSU, so the nominal layers of the atmosphere sensed were slightly different. Most importantly, the AMSU channel 5 has a weighting function that senses somewhat more of the surface and lower troposphere than MSU channel 2. If one did not account for this fact, the AMSU’s greater surface sensitivity would produce higher temperatures over land and lower temperatures over the ocean (after a global-average intercalibration between MSU and AMSU was performed). [The reason why is that these channel frequencies are not sensitive to changes in sea surface temperature, because the microwave emissivity decreases as SST increases. The effect is small, but measurable.]
But since these are through-nadir scanners, each view angle relative to the local vertical measures a slightly different layer anyway, which allows us to match the AMSU and MSU measurements. When we developed Version 6 of the dataset, we found that the 50-60 GHz oxygen absorption theory used to find the view angle from AMSU5 that best matches MSU2, the resulting temperature anomalies over land were still too warm relative to the oceans. This meant that we had to perform an empirical (data-dependent) rather than theoretical matching of the AMSU and MSU view angles.
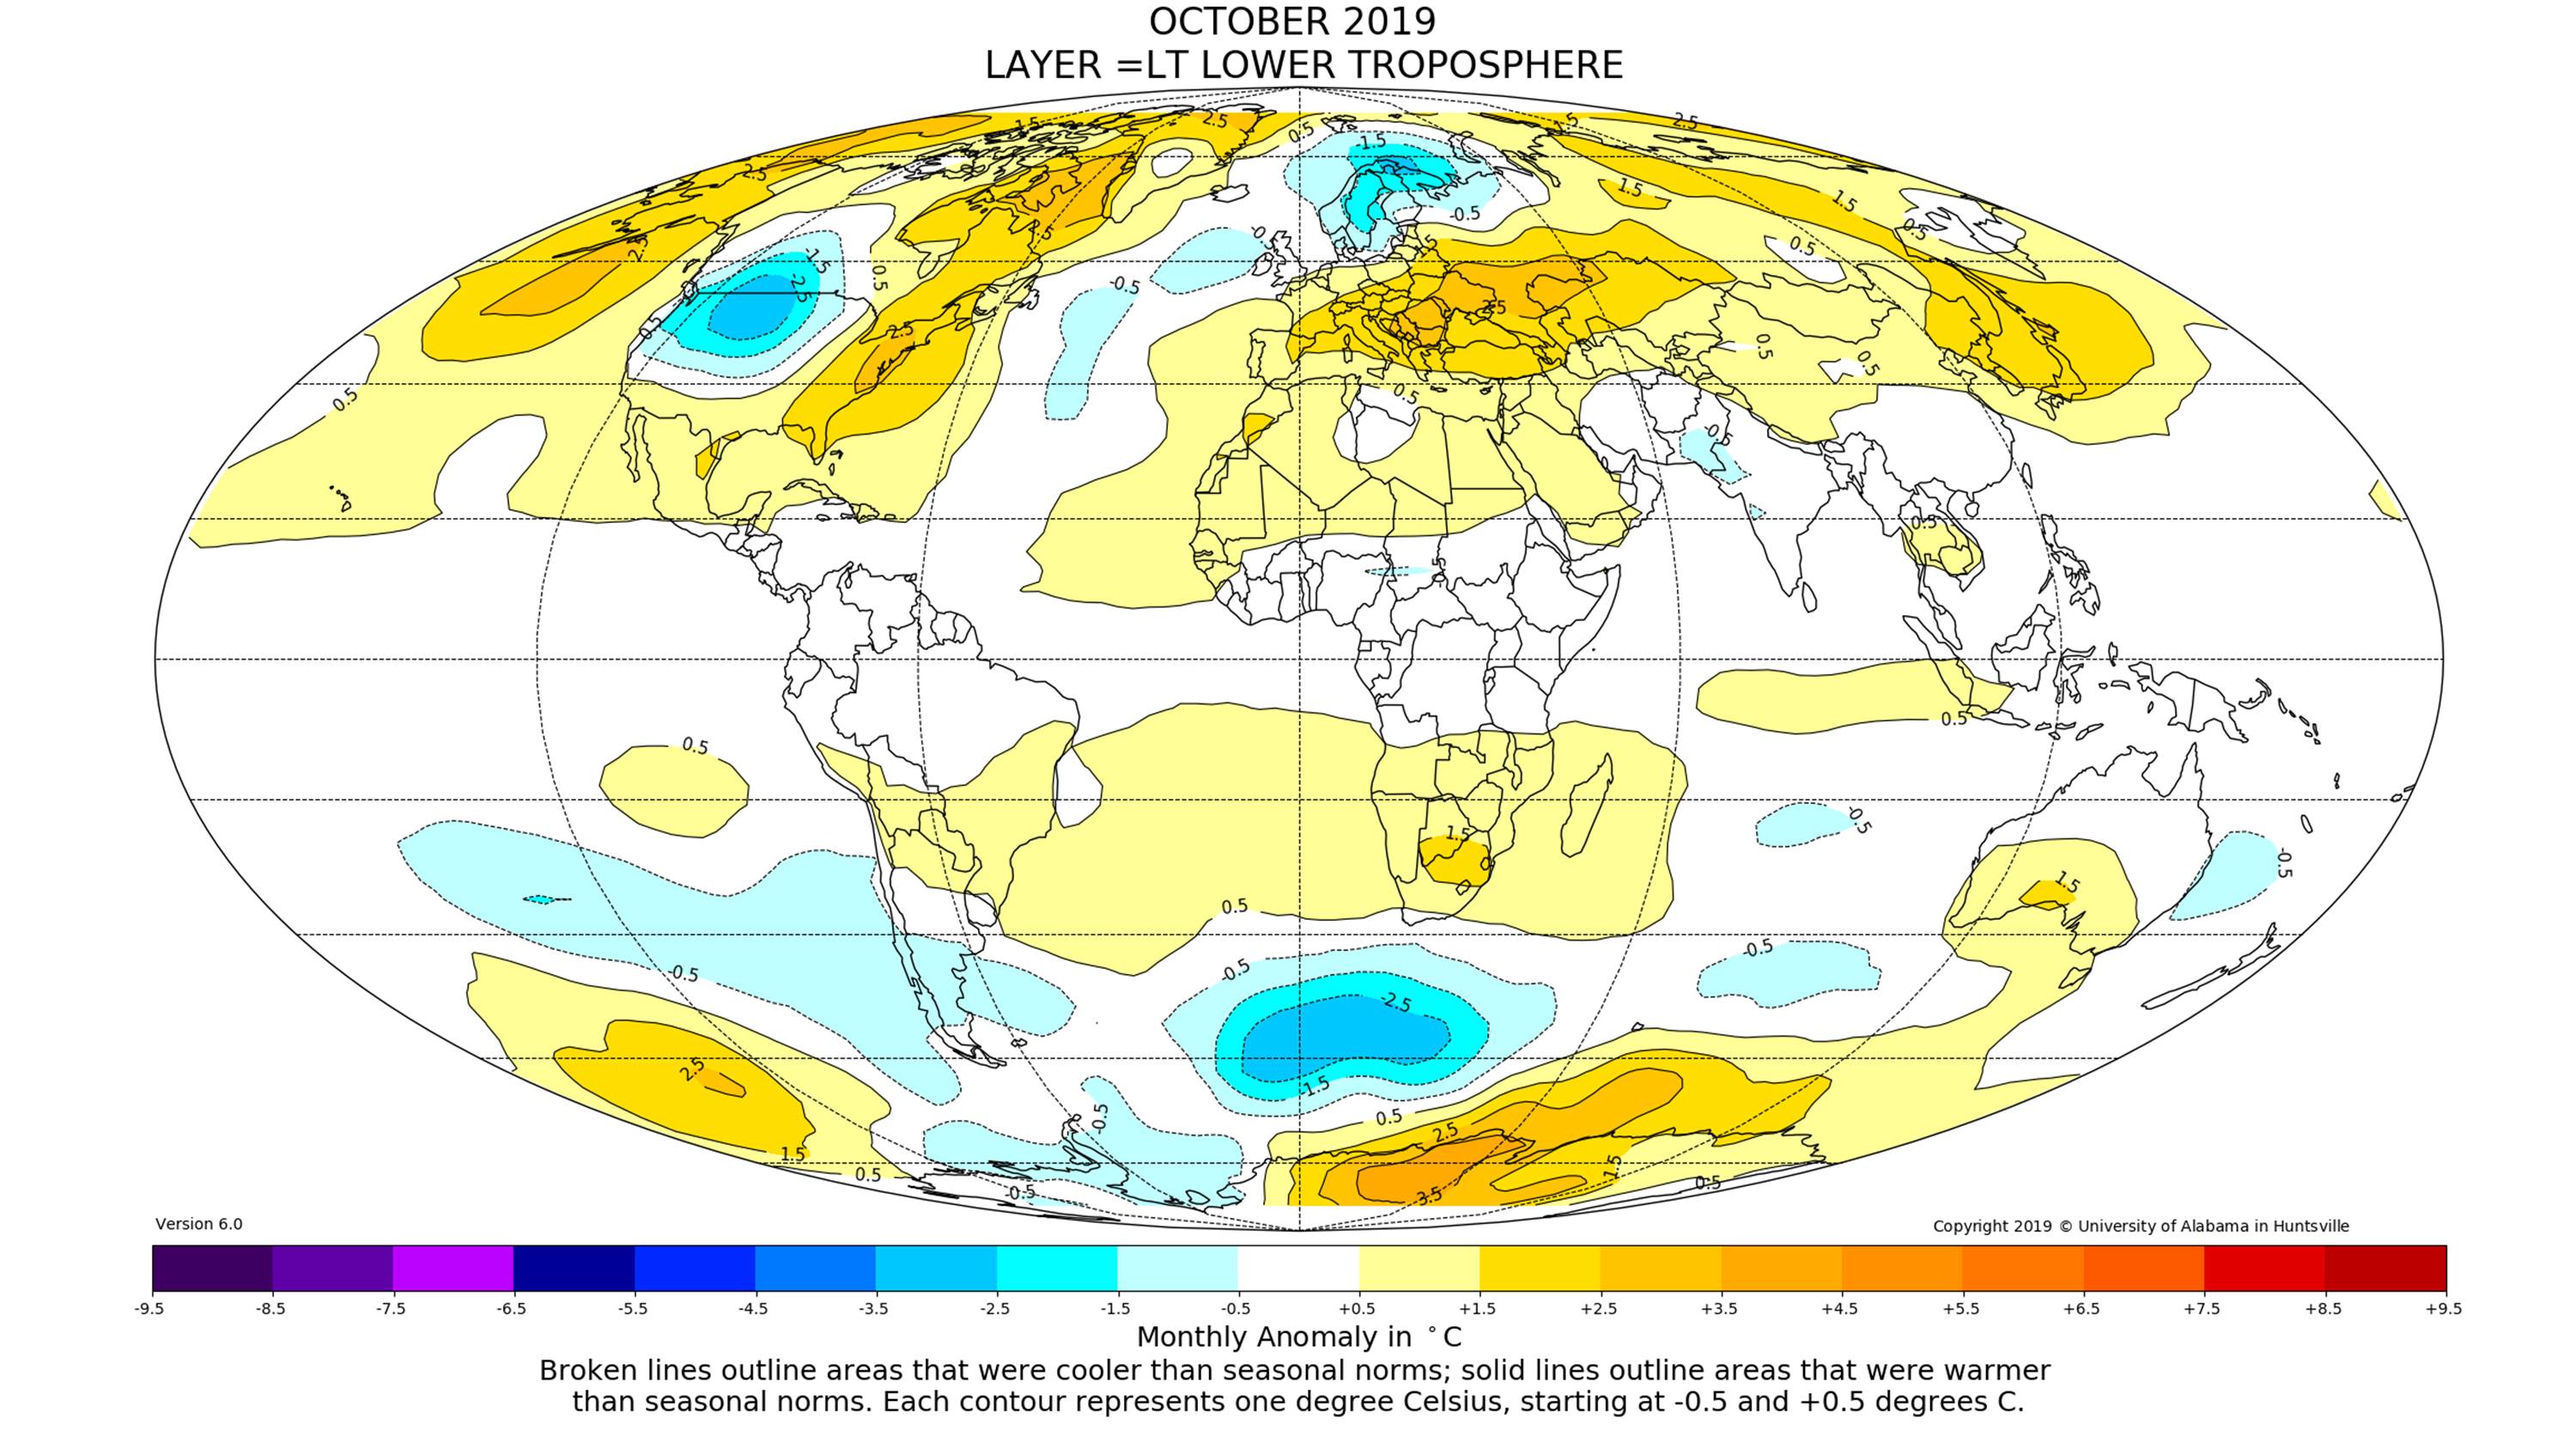
The way we gauged the match between MSU and AMSU is how the temperature anomaly patterns transition across coastlines: we required that there should be little discernible change in that pattern. Before our optimized matching, the land anomalies were noticeable warmer than the ocean anomalies as features crossed coastlines. But after optimization in our Version 6 dataset, here’s the LT anomaly map for last month (October 2019), which shows no evidence for land-vs-ocean artifacts.
Nevertheless, adjustments like these are never perfect. So, the question remains: Is there a spurious change in the L-O temperature difference occurring in 1998?
Evidence that the L-O change in 1998 is real
There are a few lines of evidence that suggest the May 1998 step-up in L-O temperatures is real.
First, if the effect was due to the introduction of AMSU in 1998, it would have occurred in August, not in May (3 months earler). Also, the effect should have been gradual since for almost 4 years after August 1998 the LT dataset is half MSU (NOAA-14) and half AMSU (NOAA-15), after which it becaume 100% AMSU.
But a more important piece of evidence is the effect of El Nino and La Nina on L-O. During El Nino, the ocean airmasses warm more than the land airmasses (especially in the tropics), so that L-O tends to be more negative. Up until the 1997-98 super El Nino a period of greater El Nino activity existed, after which a shift to more La Nina activity occurred. (This is probably also what caused the extended global warming ‘hiatus’ after that El Nino event.)
I statistically regressed the L-O values in Fig. 1 against 3-month running averages of the Multivariate ENSO Index (MEI), and removed that estimate of the ENSO influence from the data. The resulting ENSO-adjusted time series in shown in Fig. 3.
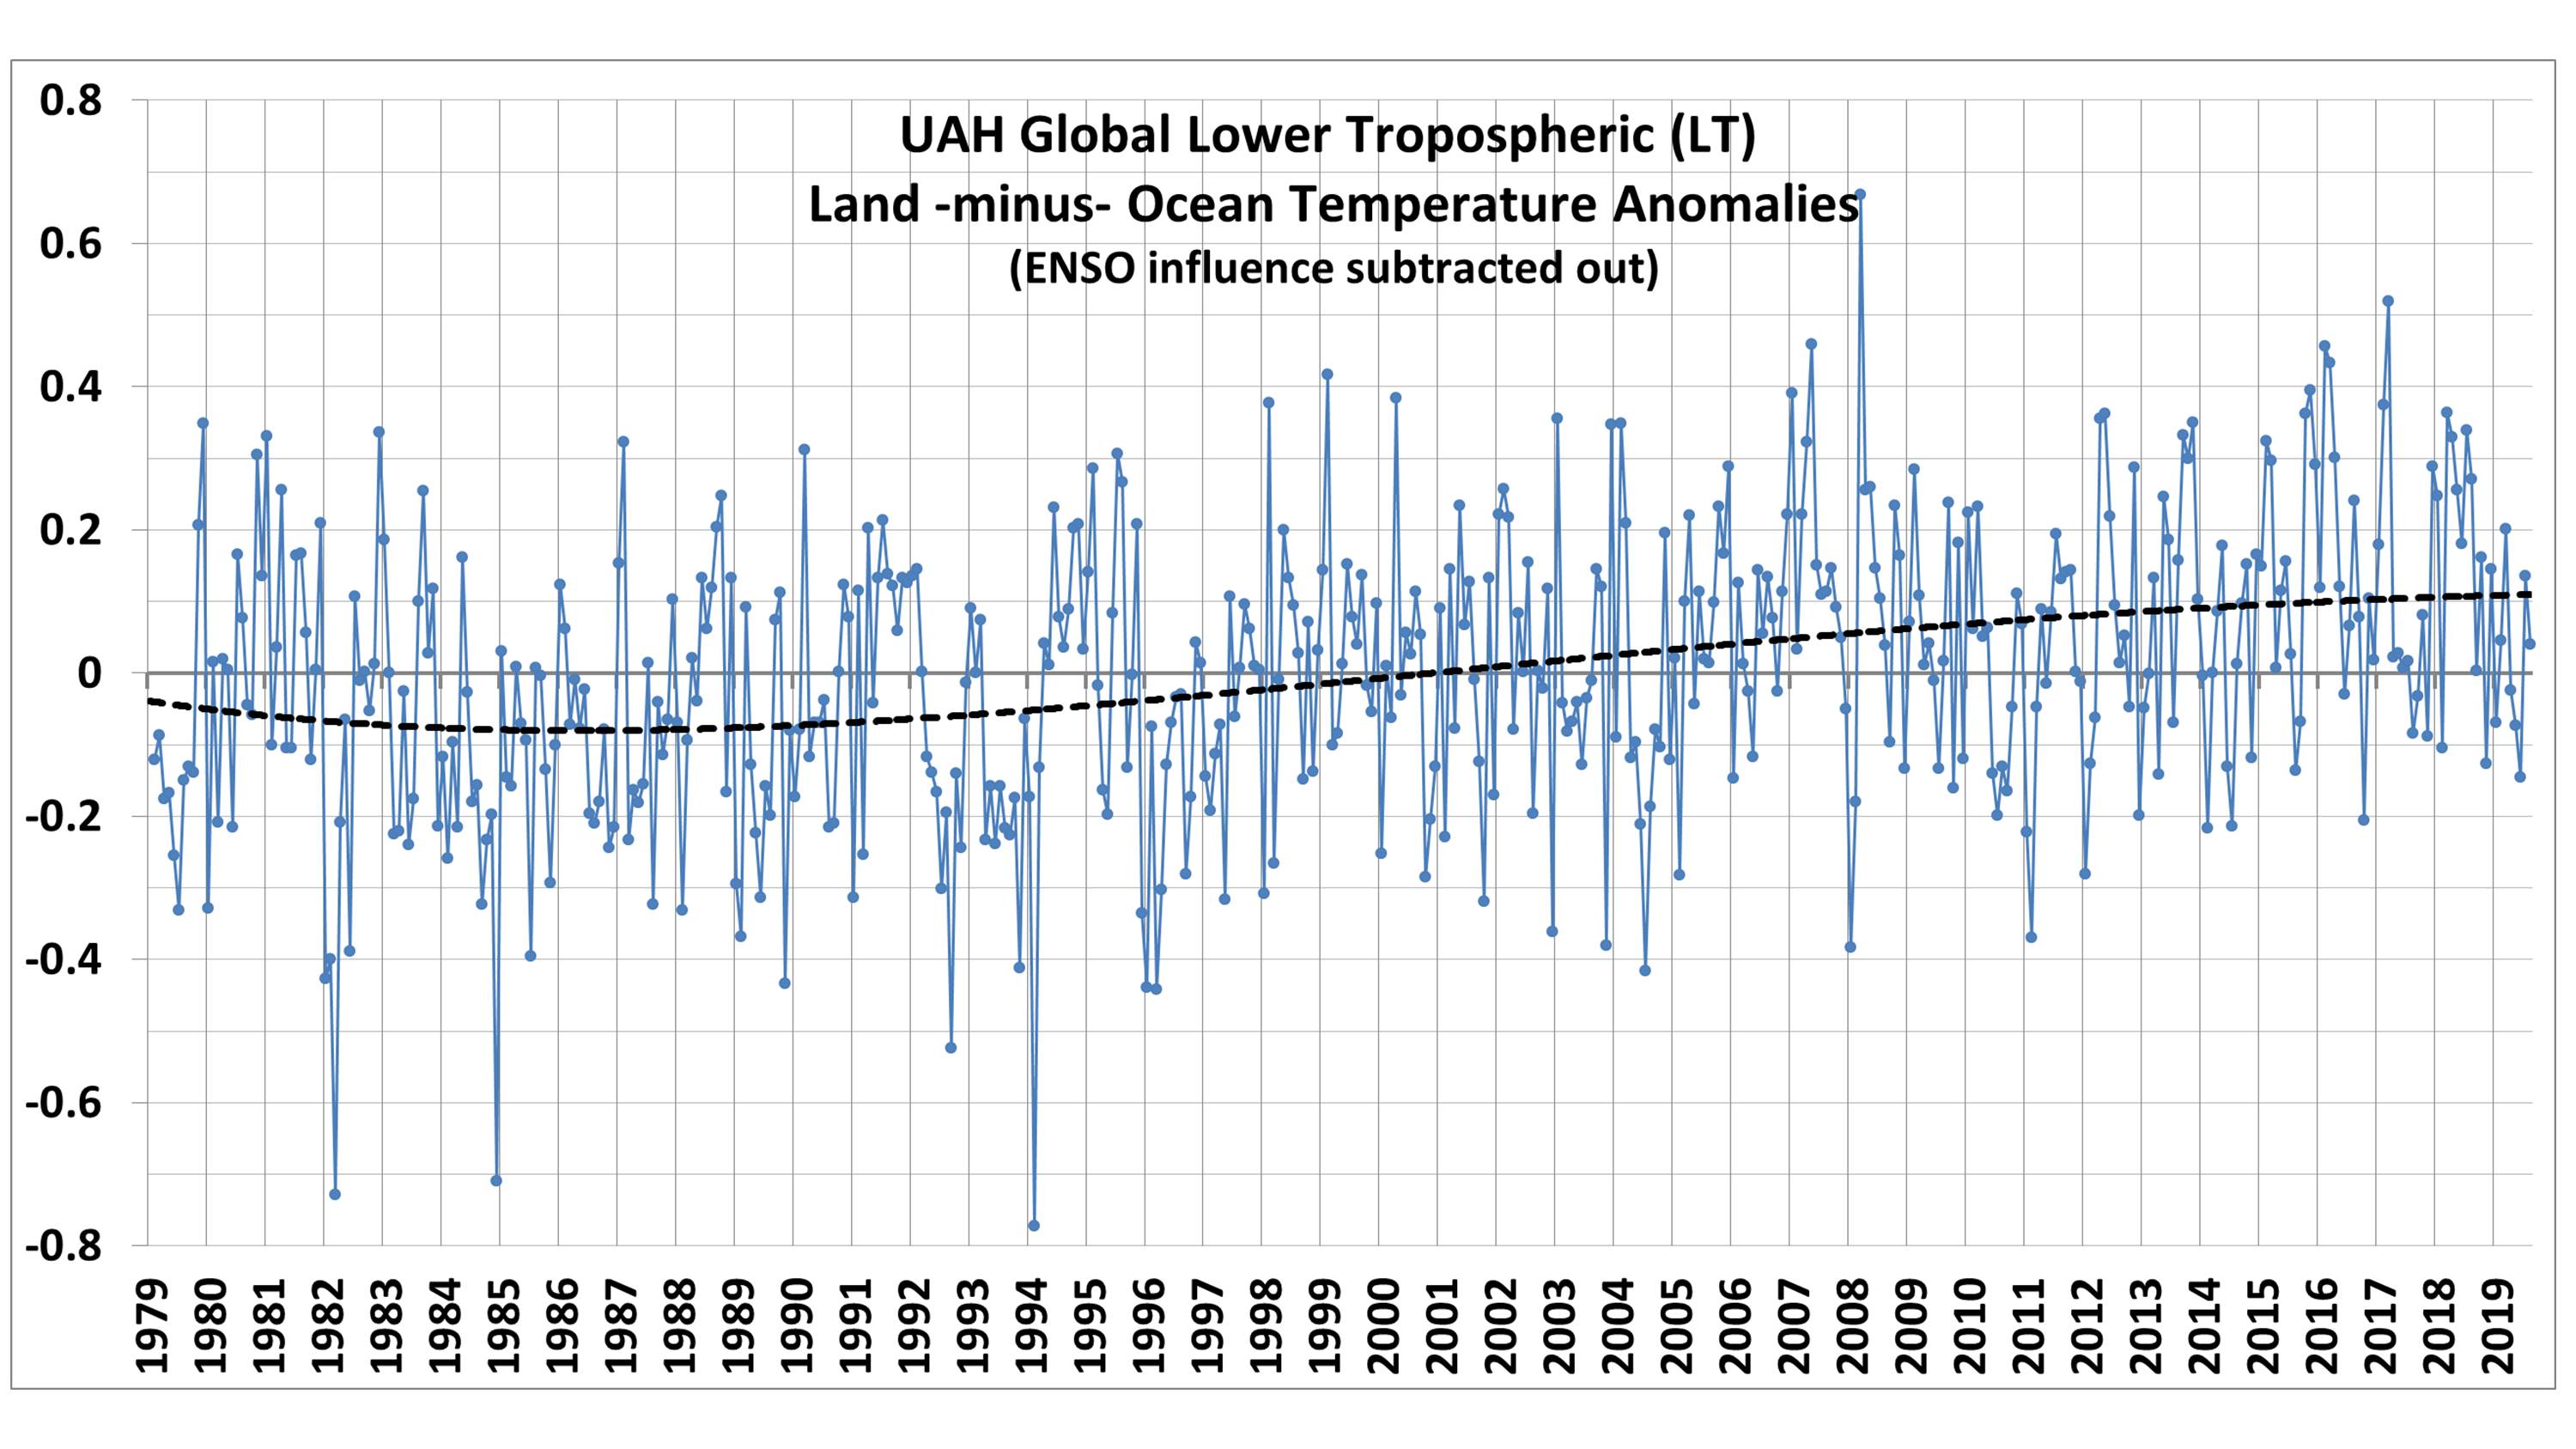
Note the step-up in mid-1998 is much less evident, and the 5th order polynomial fit to the data is smoother with a more gradual transition in L-O over the 41-year satellite record.
But that’s not the only thing going on during this period that affects the L-O values. There were two major volcanic eruptions (El Chichon in early 1982, and especially Pinatubo in mid-1991) that caused more cooling over land than ocean, causing temporarily enhanced negative values in L-O. Since these events are not as easily correlated with an index like MEI is with ENSO, I simply removed the data from 1982-83 and 1992-93 in Fig. 3 and replotted the results in Fig. 4.
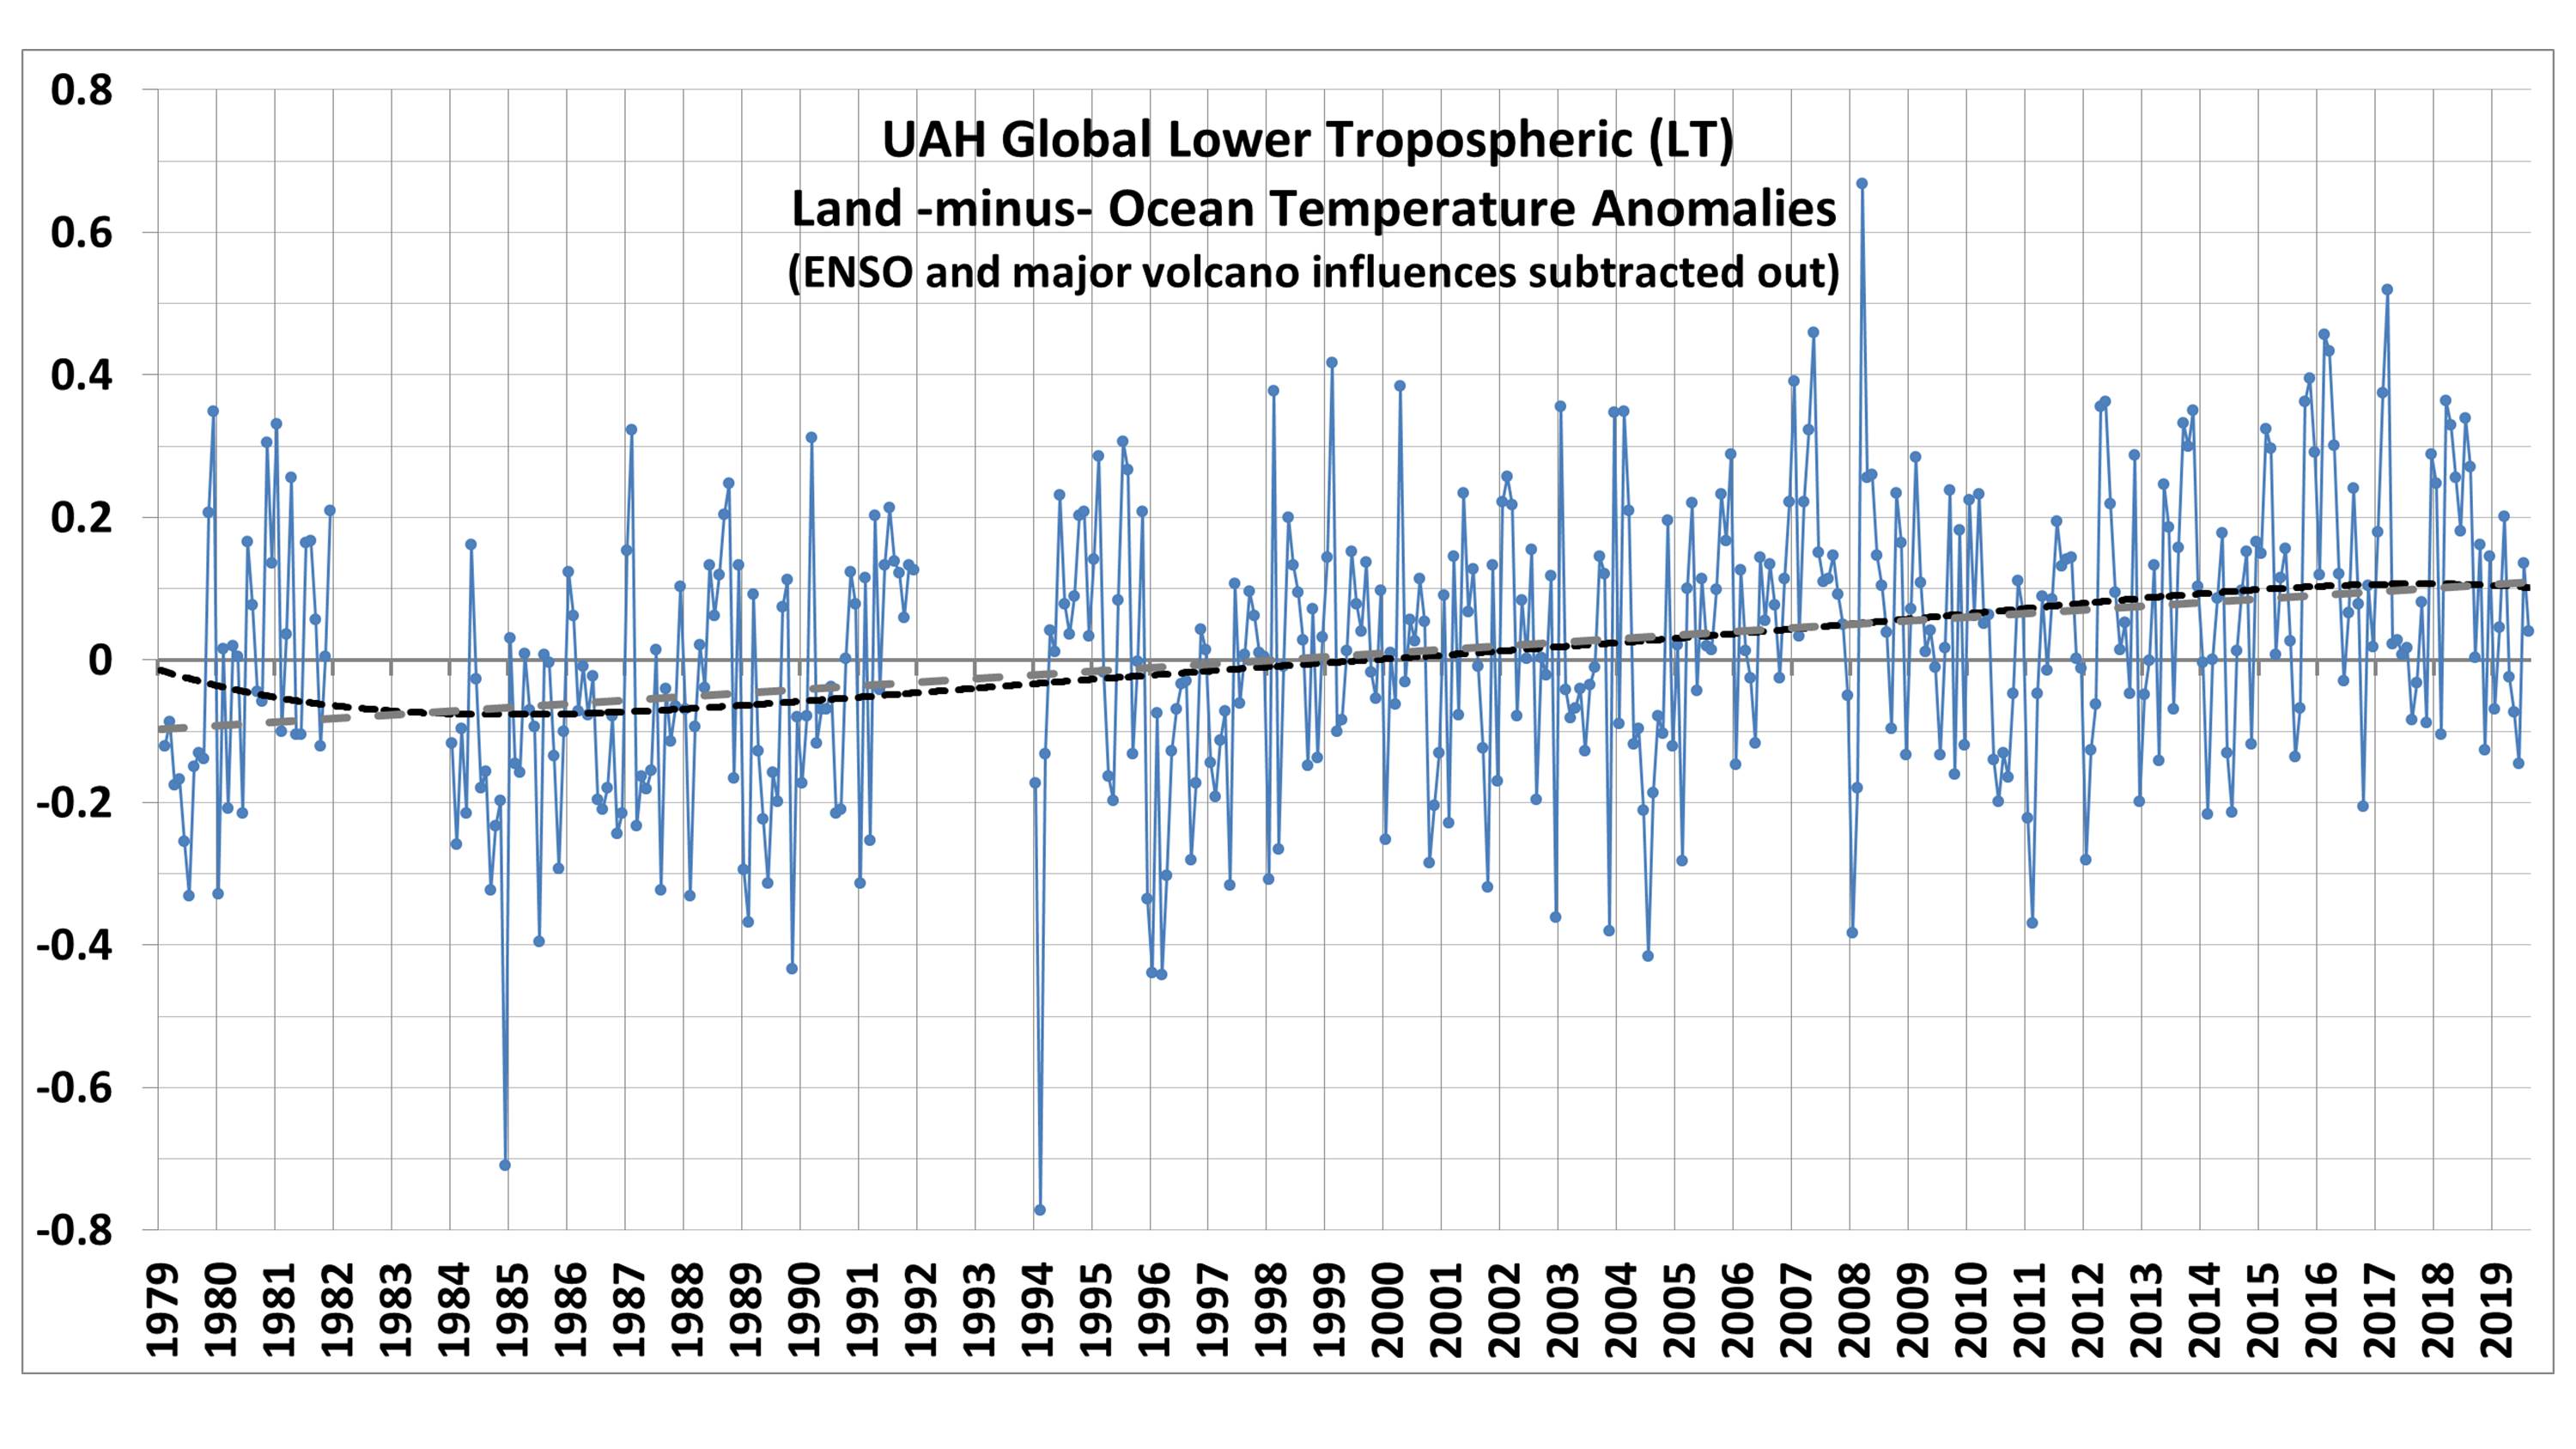
Now we see that the 5th order polynomial fit to the data comes quite close to the linear trend (dashed gray line), which suggests that the step-up in 1998 in L-O was real, and related mostly to a change in ENSO activity before versus after the 1997-98 super El Nino, and with the major volcanic eruptions in 1982 and 1991 contributing to the seemingly spurious feature.
The remaining upward trend in L-O is simply the land airmasses warming faster than the ocean, as would be expected for any warming trend, whether natural or human-caused.
There remains what might be a spurious feature during 1980-81 in Fig. 4, which would most likely be related to our ad hoc correction for MSU channel 3 drift during that time. This, however, should have little influence on the land and ocean trends as evidenced by the trend line fit (dashed gray line) in Fig. 4.


