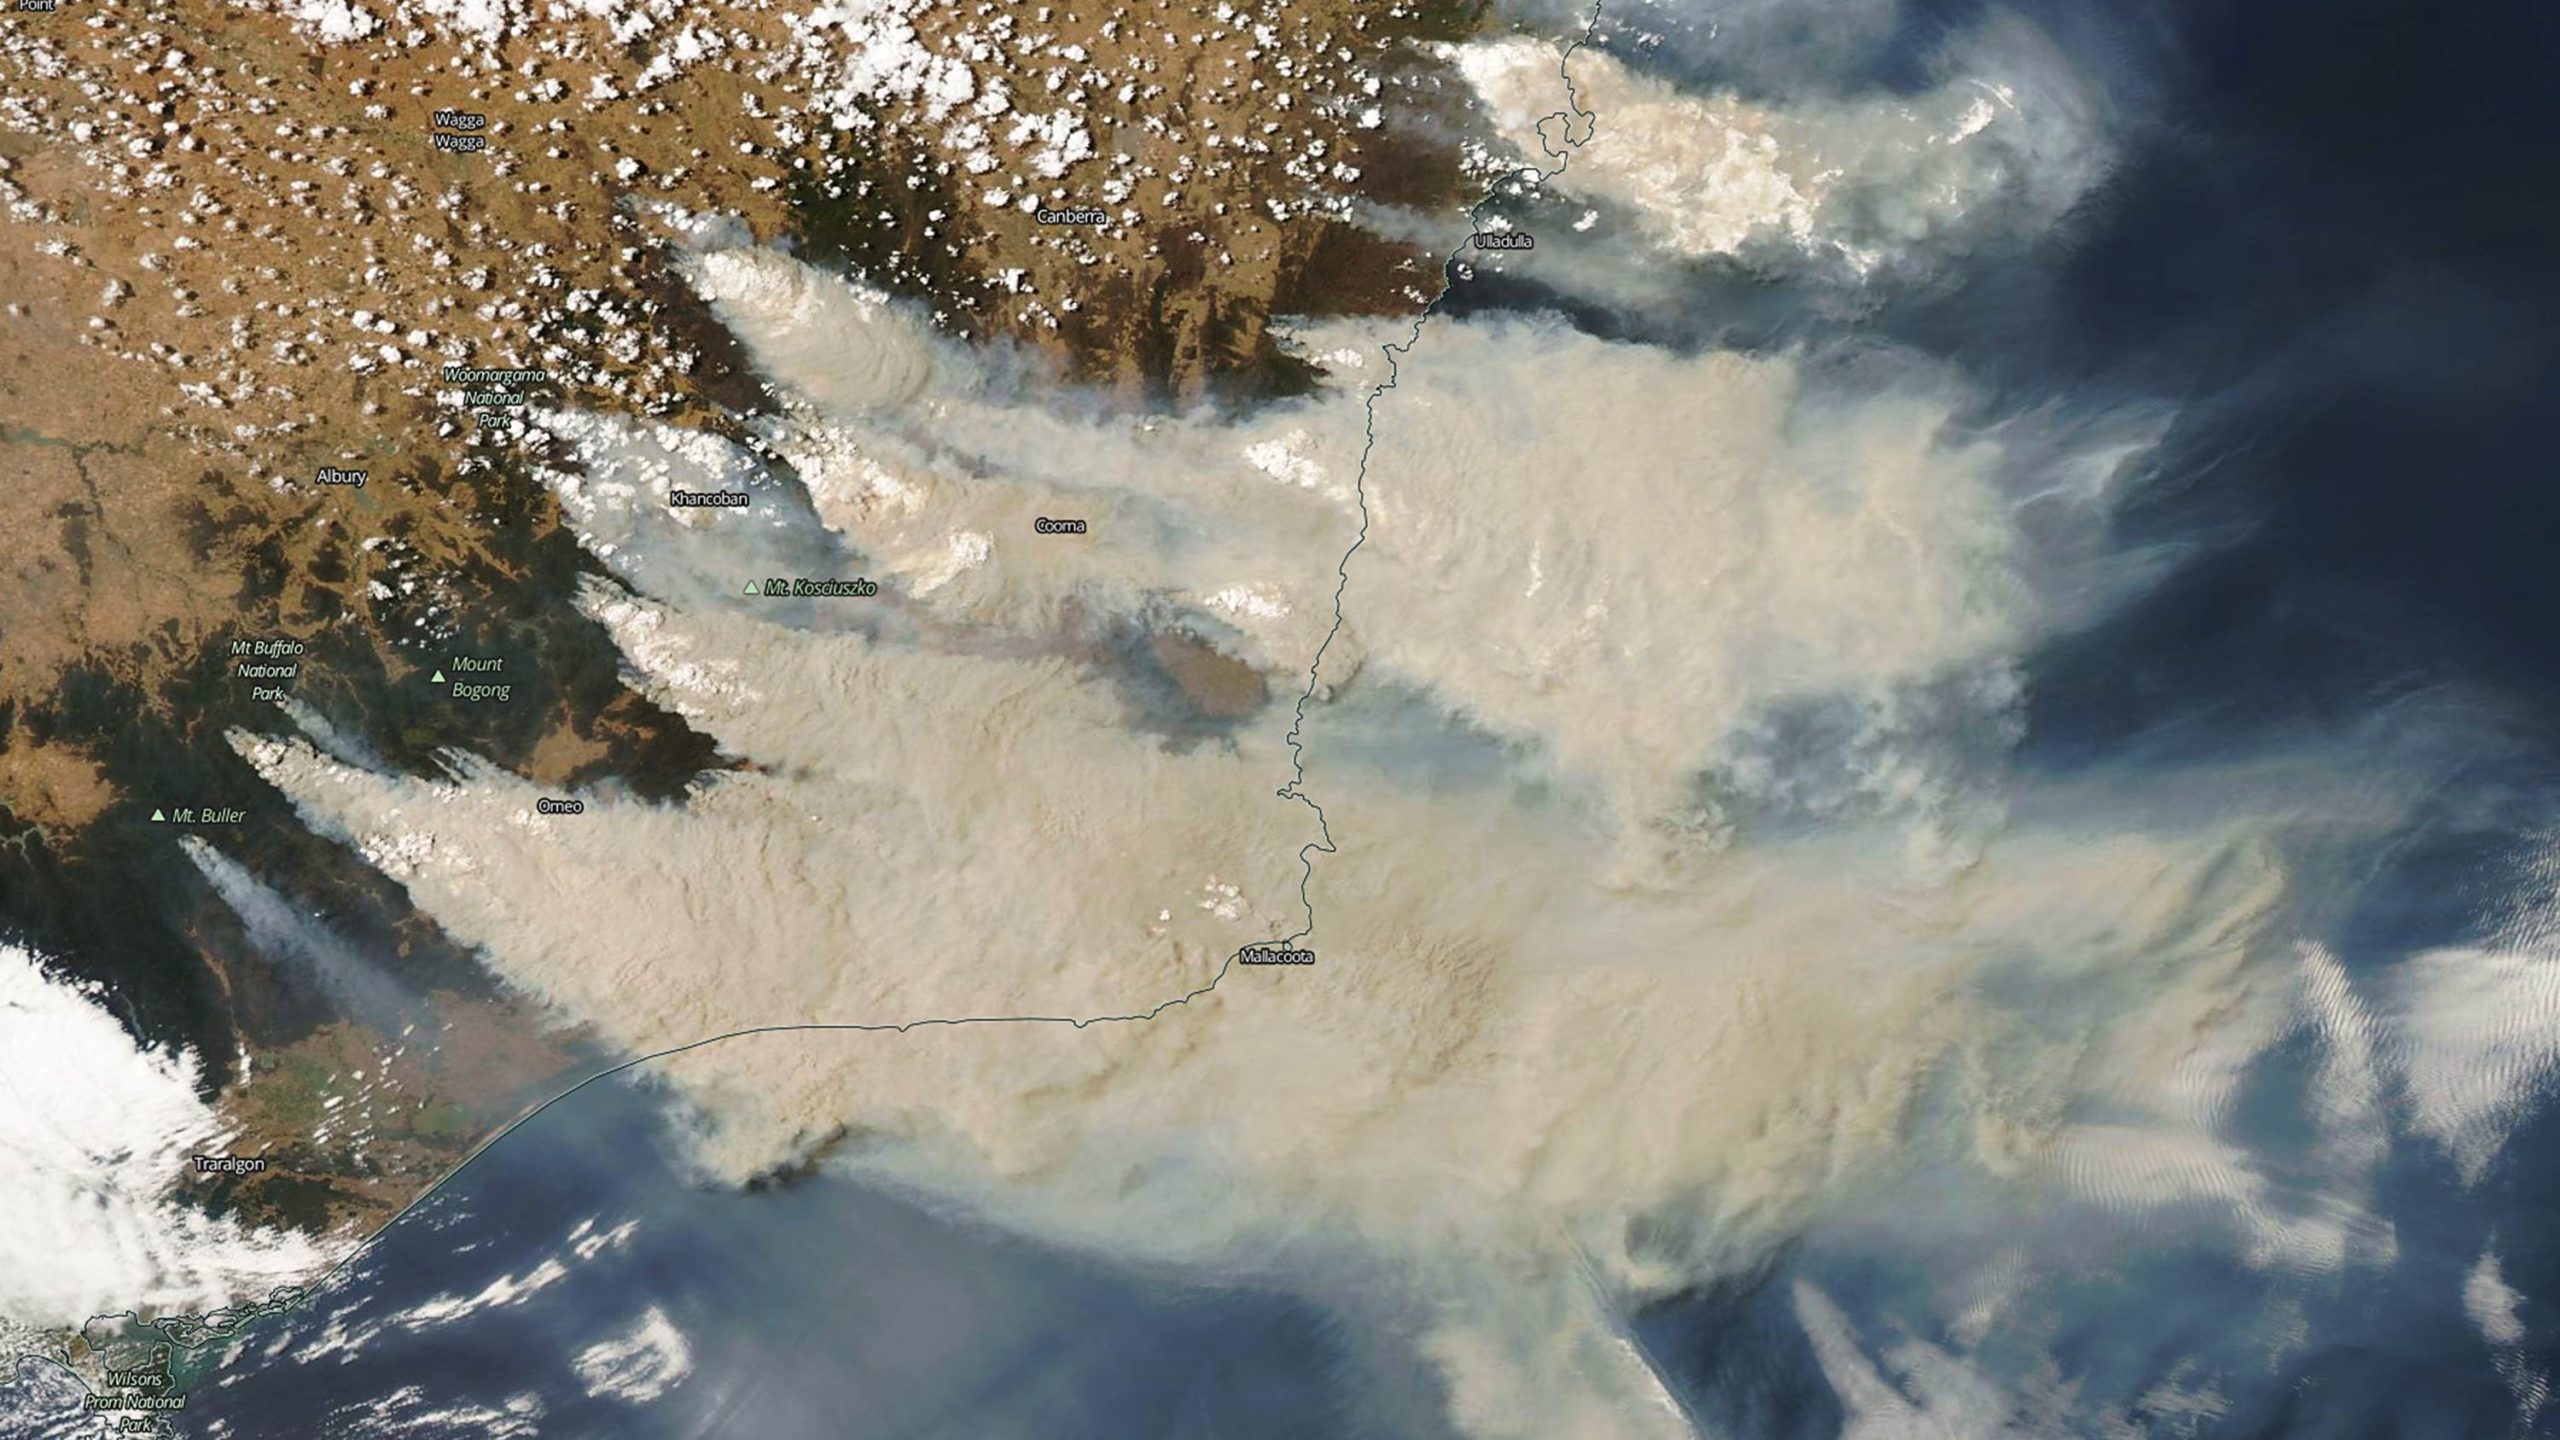
Summary Points
1) Global wildfire activity has decreased in recent decades, making any localized increase (or decrease) in wildfire activity difficult to attribute to ‘global climate change’.
2) Like California, Australia is prone to bushfires every year during the dry season. Ample fuel and dry weather exists for devastating fires each year, even without excessive heat or drought, as illustrated by the record number of hectares burned (over 100 million) during 1974-75 when above-average precipitation and below-average temperatures existed.
3) Australian average temperatures in 2019 were well above what global warming theory can explain, illustrating the importance of natural year-to-year variability in weather patterns (e.g. drought and excessively high temperatures).
4) Australia precipitation was at a record low in 2019, but climate models predict no long-term trend in Australia precipitation, while the observed trend has been upward, not downward. This again highlights the importance of natural climate variability to fire weather conditions, as opposed to human-induced climate change.
5) While reductions in prescribed burning have probably contributed to the irregular increase in the number of years with large bush fires, a five-fold increase in population in the last 100 years has greatly increased potential ignition sources, both accidental and purposeful.
Historical Background
Australia has a long history of bush fires, with the Aborigines doing prescribed burns centuries (if not millennia) before European settlement. A good summary of the history of bushfires and their management was written by the CSIRO Division of Forestry twenty-five years ago, entitled Bushfires – An Integral Part of Australia’s Environment.
The current claim by many that human-caused climate change has made Australian bushfires worse is difficult to support, for a number of reasons. Bushfires (like wildfires elsewhere in the world) are a natural occurrence wherever there is strong seasonality in precipitation, with vegetation growing during the wet season and then becoming fuel for fire during the dry season.
All other factors being equal, wildfires (once ignited) will be made worse by higher temperatures, lower humidity, and stronger winds. But with the exception of dry lightning, the natural sources of fire ignition are pretty limited. High temperature and low humidity alone do not cause dead vegetation to spontaneously ignite.
As the human population increases, the potential ignition sources have increased rapidly. The population of Australia has increased five-fold in the last 100 years (from 5 million to 25 million). Discarded cigarettes and matches, vehicle catalytic converters, sparks from electrical equipment and transmission lines, campfires, prescribed burns going out of control, and arson are some of the more obvious source of human-caused ignition, and these can all be expected to increase with population.
Trends in Bushfire Activity
The following plot shows the major Australia bushfires over the same period of time (100 years) as the five-fold increase in the population of Australia. The data come from Wikipedia’s Bushfires in Australia.

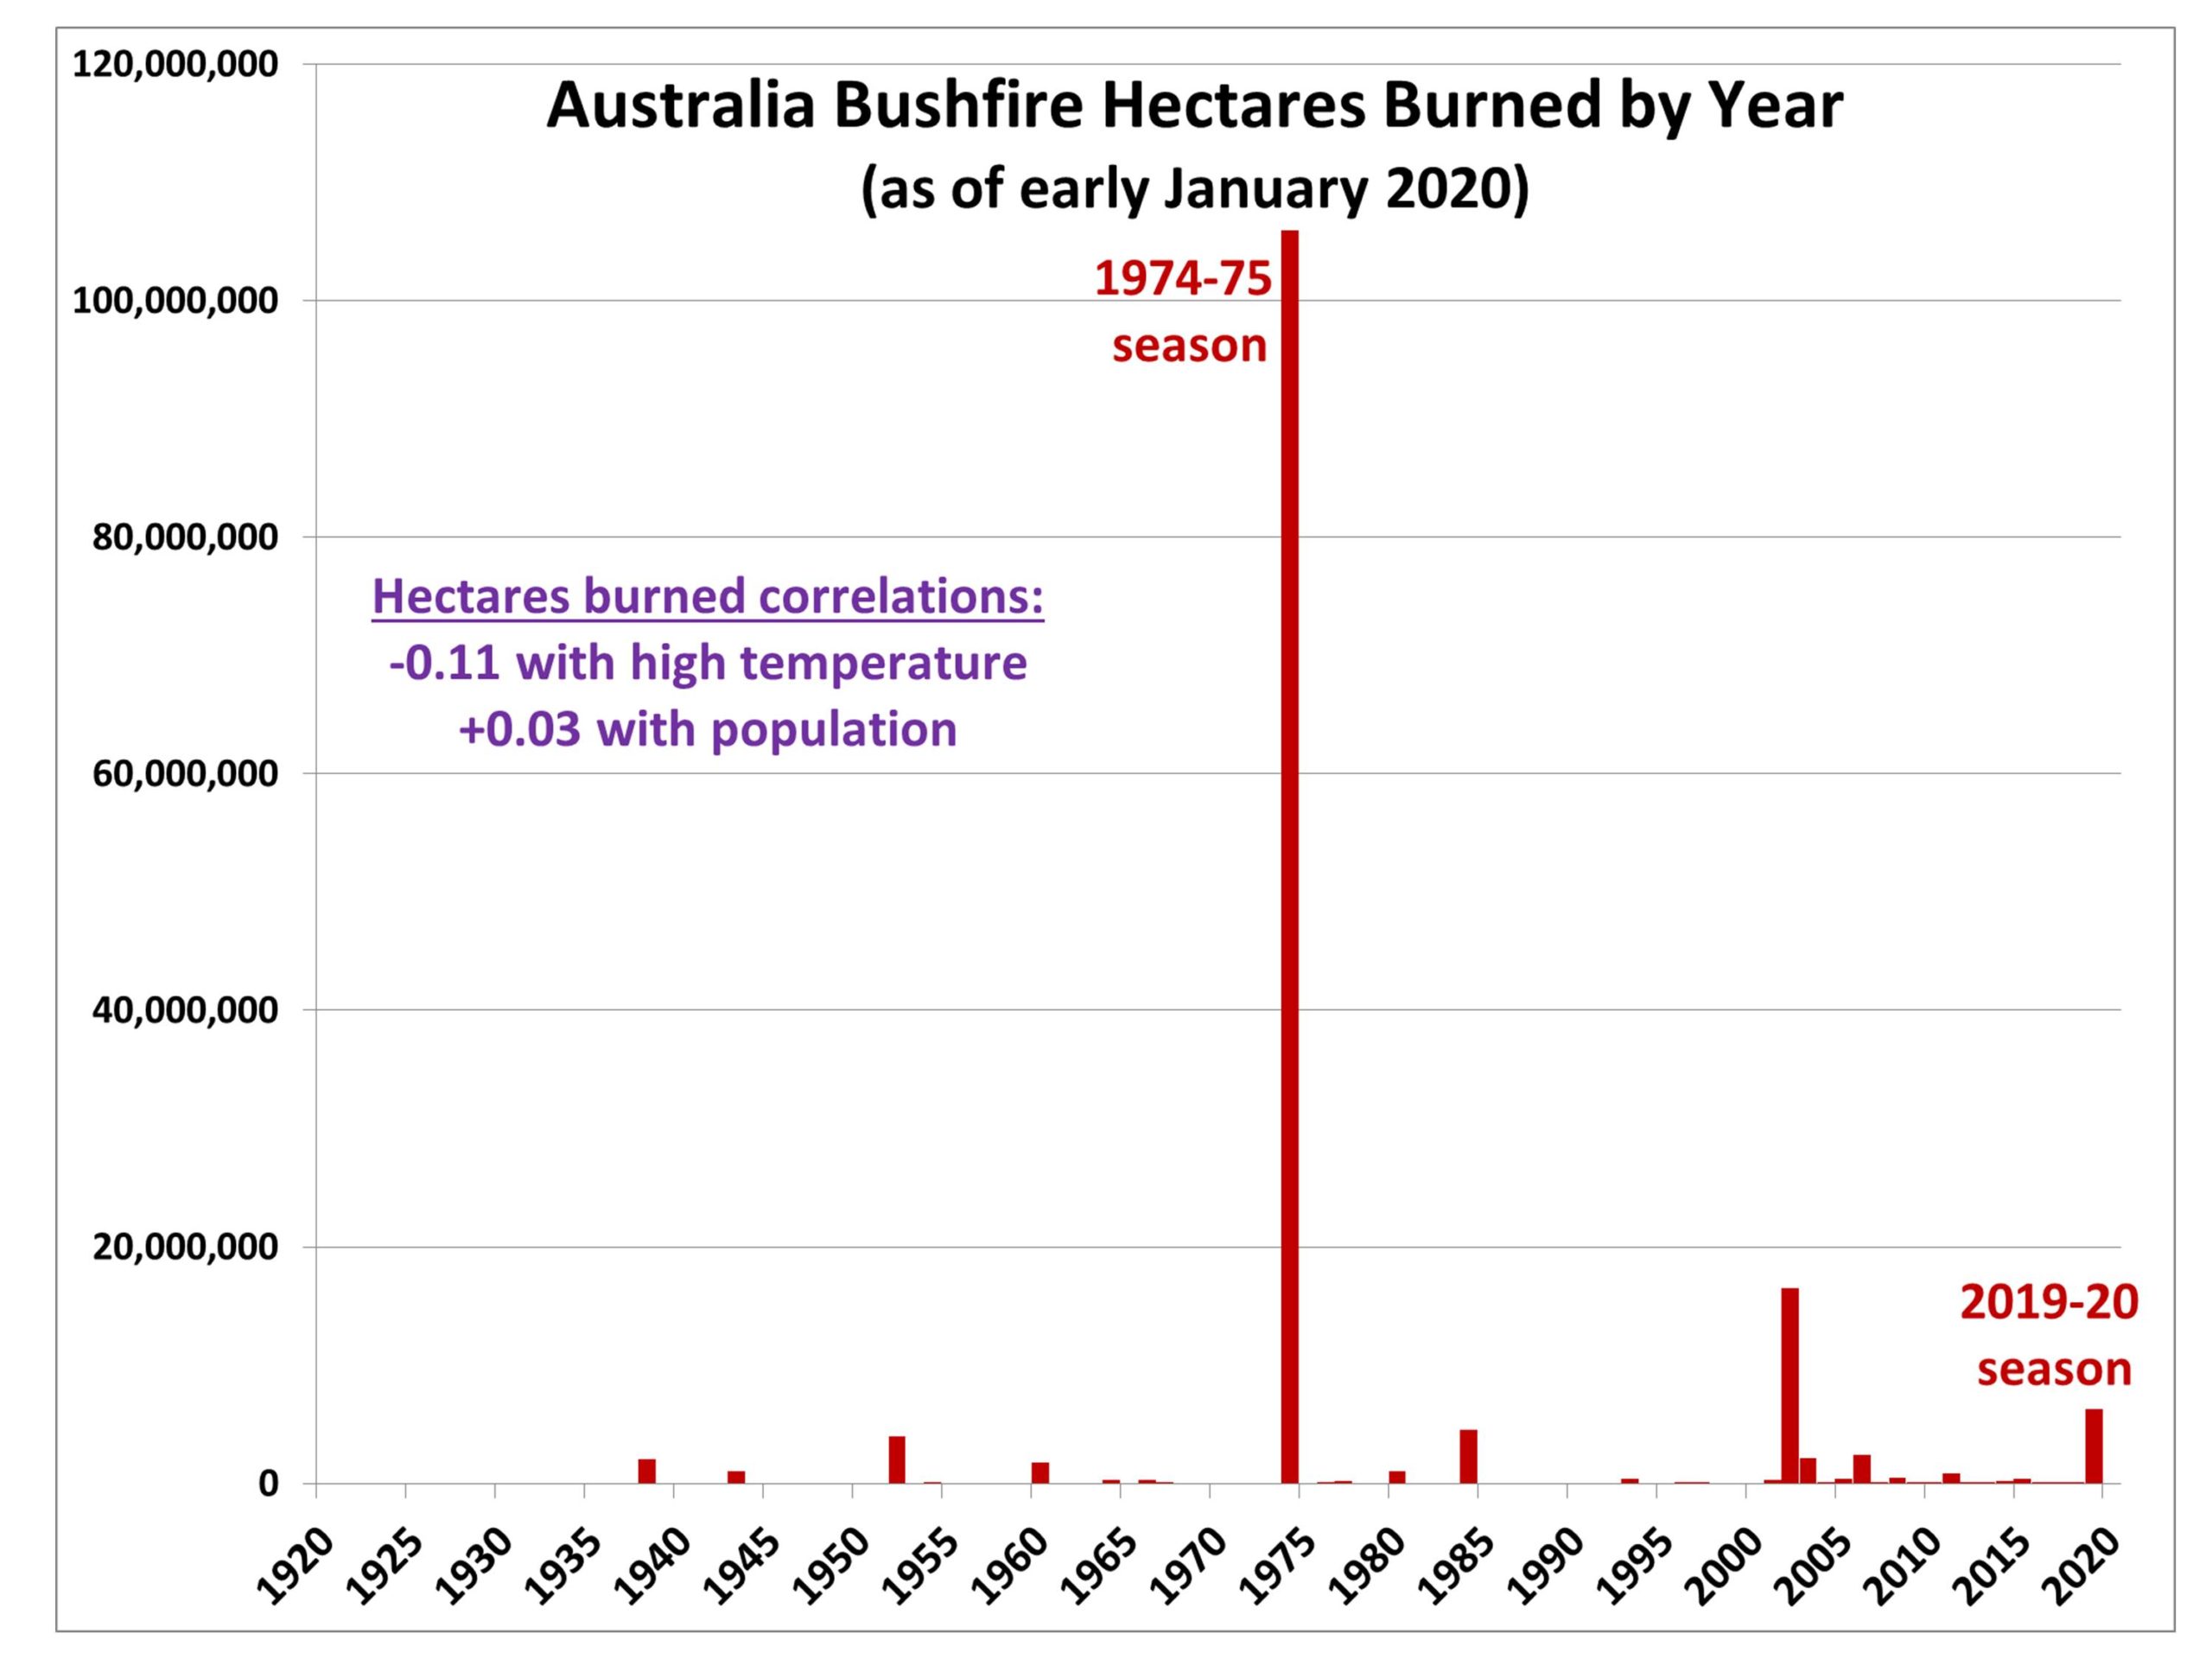
As can be seen, by far the largest area burned occurred during 1974-75, at over 100 million hectares (close to 15% of the total area of Australia). Curiously, though, according to Australia Bureau of Meteorology (BOM) data, the 1974-75 bushfires occurred during a year with above-average precipitation and below-average temperature. This is opposite to the narrative that major bushfires are a feature of just excessively hot and dry years.
Every dry season in Australia experiences excessive heat and low humidity.
Australia High Temperature Trends
The following plot (in red) shows the yearly average variations in daily high temperature for Australia, compared to the 40-year average during 1920-1959.

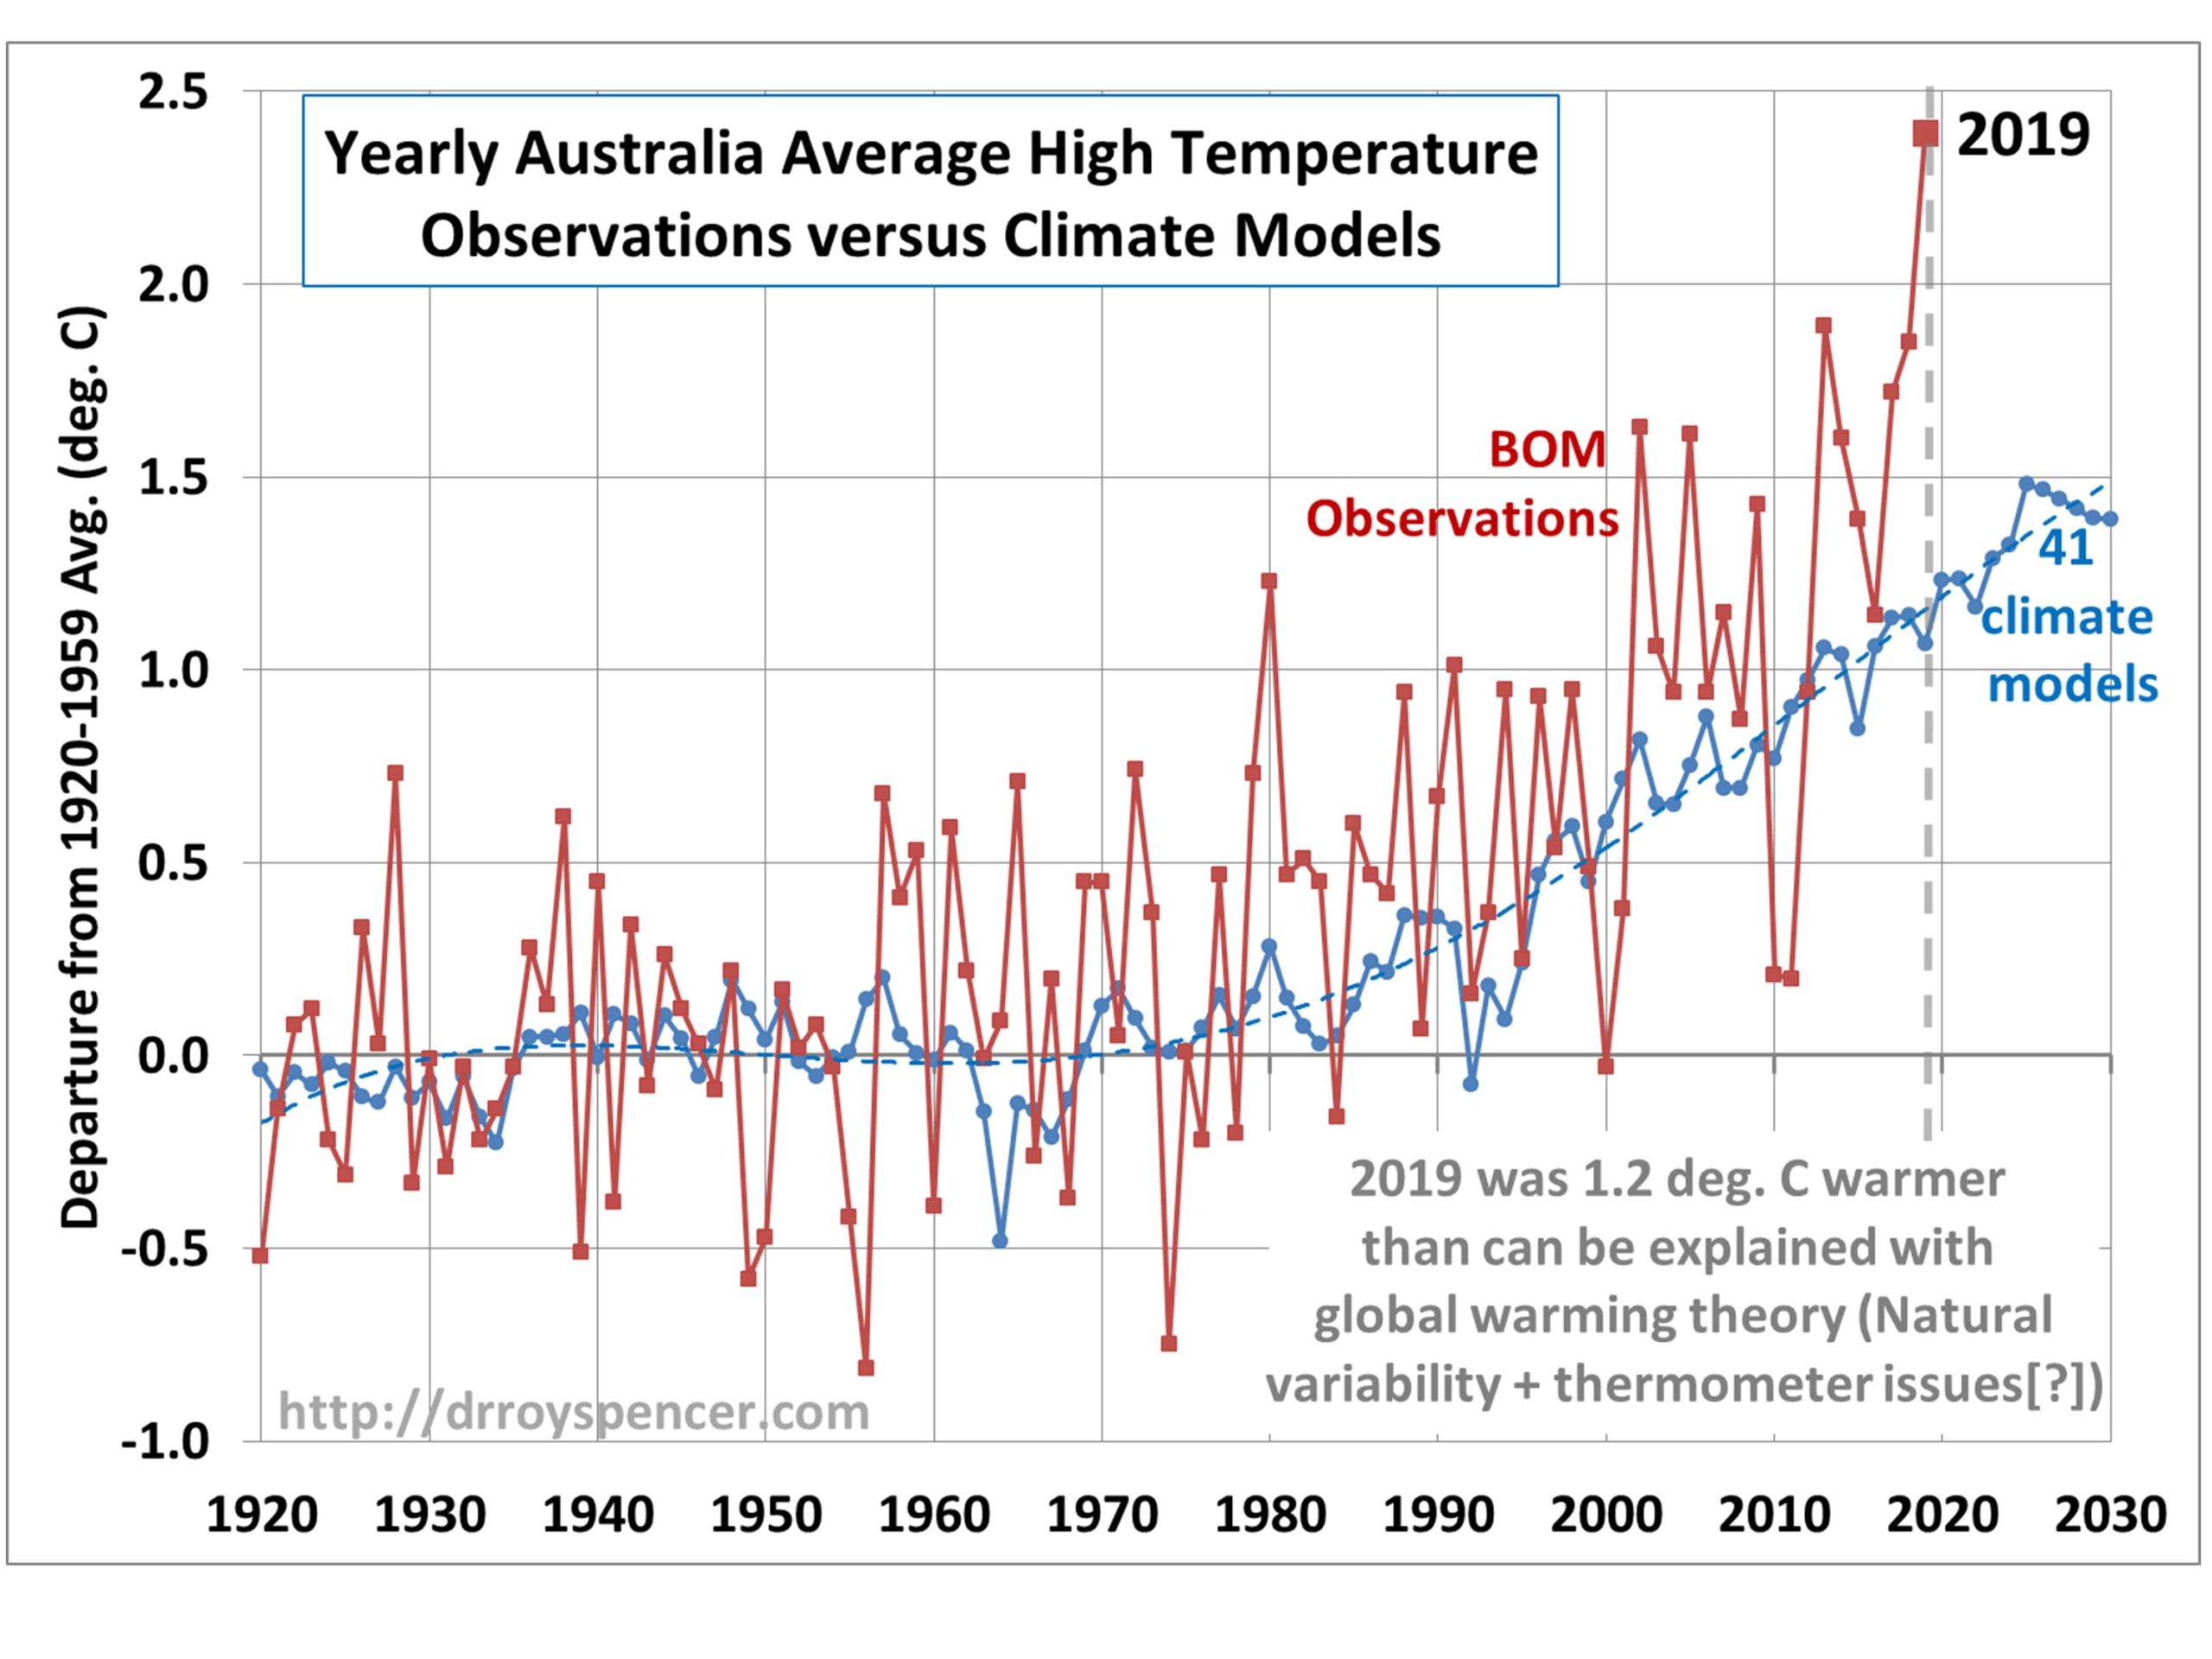
Also shown in Fig. 2 (in blue) is the average of 41 CMIP5 climate models daily high temperature for Australia (from the KNMI Climate Explorer website). There are a few important points to be made from this plot.
First, if we correlate the yearly temperatures in Fig. 2 with the bushfire land area burned in Fig. 1, there is essentially no correlation (-0.11), primarily because of the huge 1974-75 event. If that year is removed from the data, there is a weak positive correlation (+0.19, barely significant at the 2-sigma level). But having statistics depend so much on single events (in this case, their removal from the dataset) is precisely one of the reasons why we should not use the current (2019-2020) wildfire events as an indicator of long-term climate change.
Secondly, while it is well known that the CMIP5 models are producing too much warming in the tropics compared to observations, in Australia just the opposite is happening: the BOM temperatures are showing more rapid warming than the average of the climate models produces. This could be a spurious result of changes in Australian thermometer measurement technology and data processing as has been claimed by Jennifer Marohasy.
Or, maybe the discrepancy is from natural climate variability. Who knows?
Finally, note the huge amount of year-to-year temperature variability in Fig. 2. Clearly, 2019 was exceptionally warm, but a good part of that warmth was likely due to natural variations in the tropics and subtropics, due to persistent El Nino conditions and associated changes in where precipitation regions versus clear air regions tend to get established in the tropics and subtropics.
Australia Precipitation Trends
To drive home the point that any given year should not be used as evidence of a long-term trend, Australia precipitation provides an excellent example. The following plot is like the temperature plot above (Fig. 2), but now for precipitation as reported by the BOM (data here).

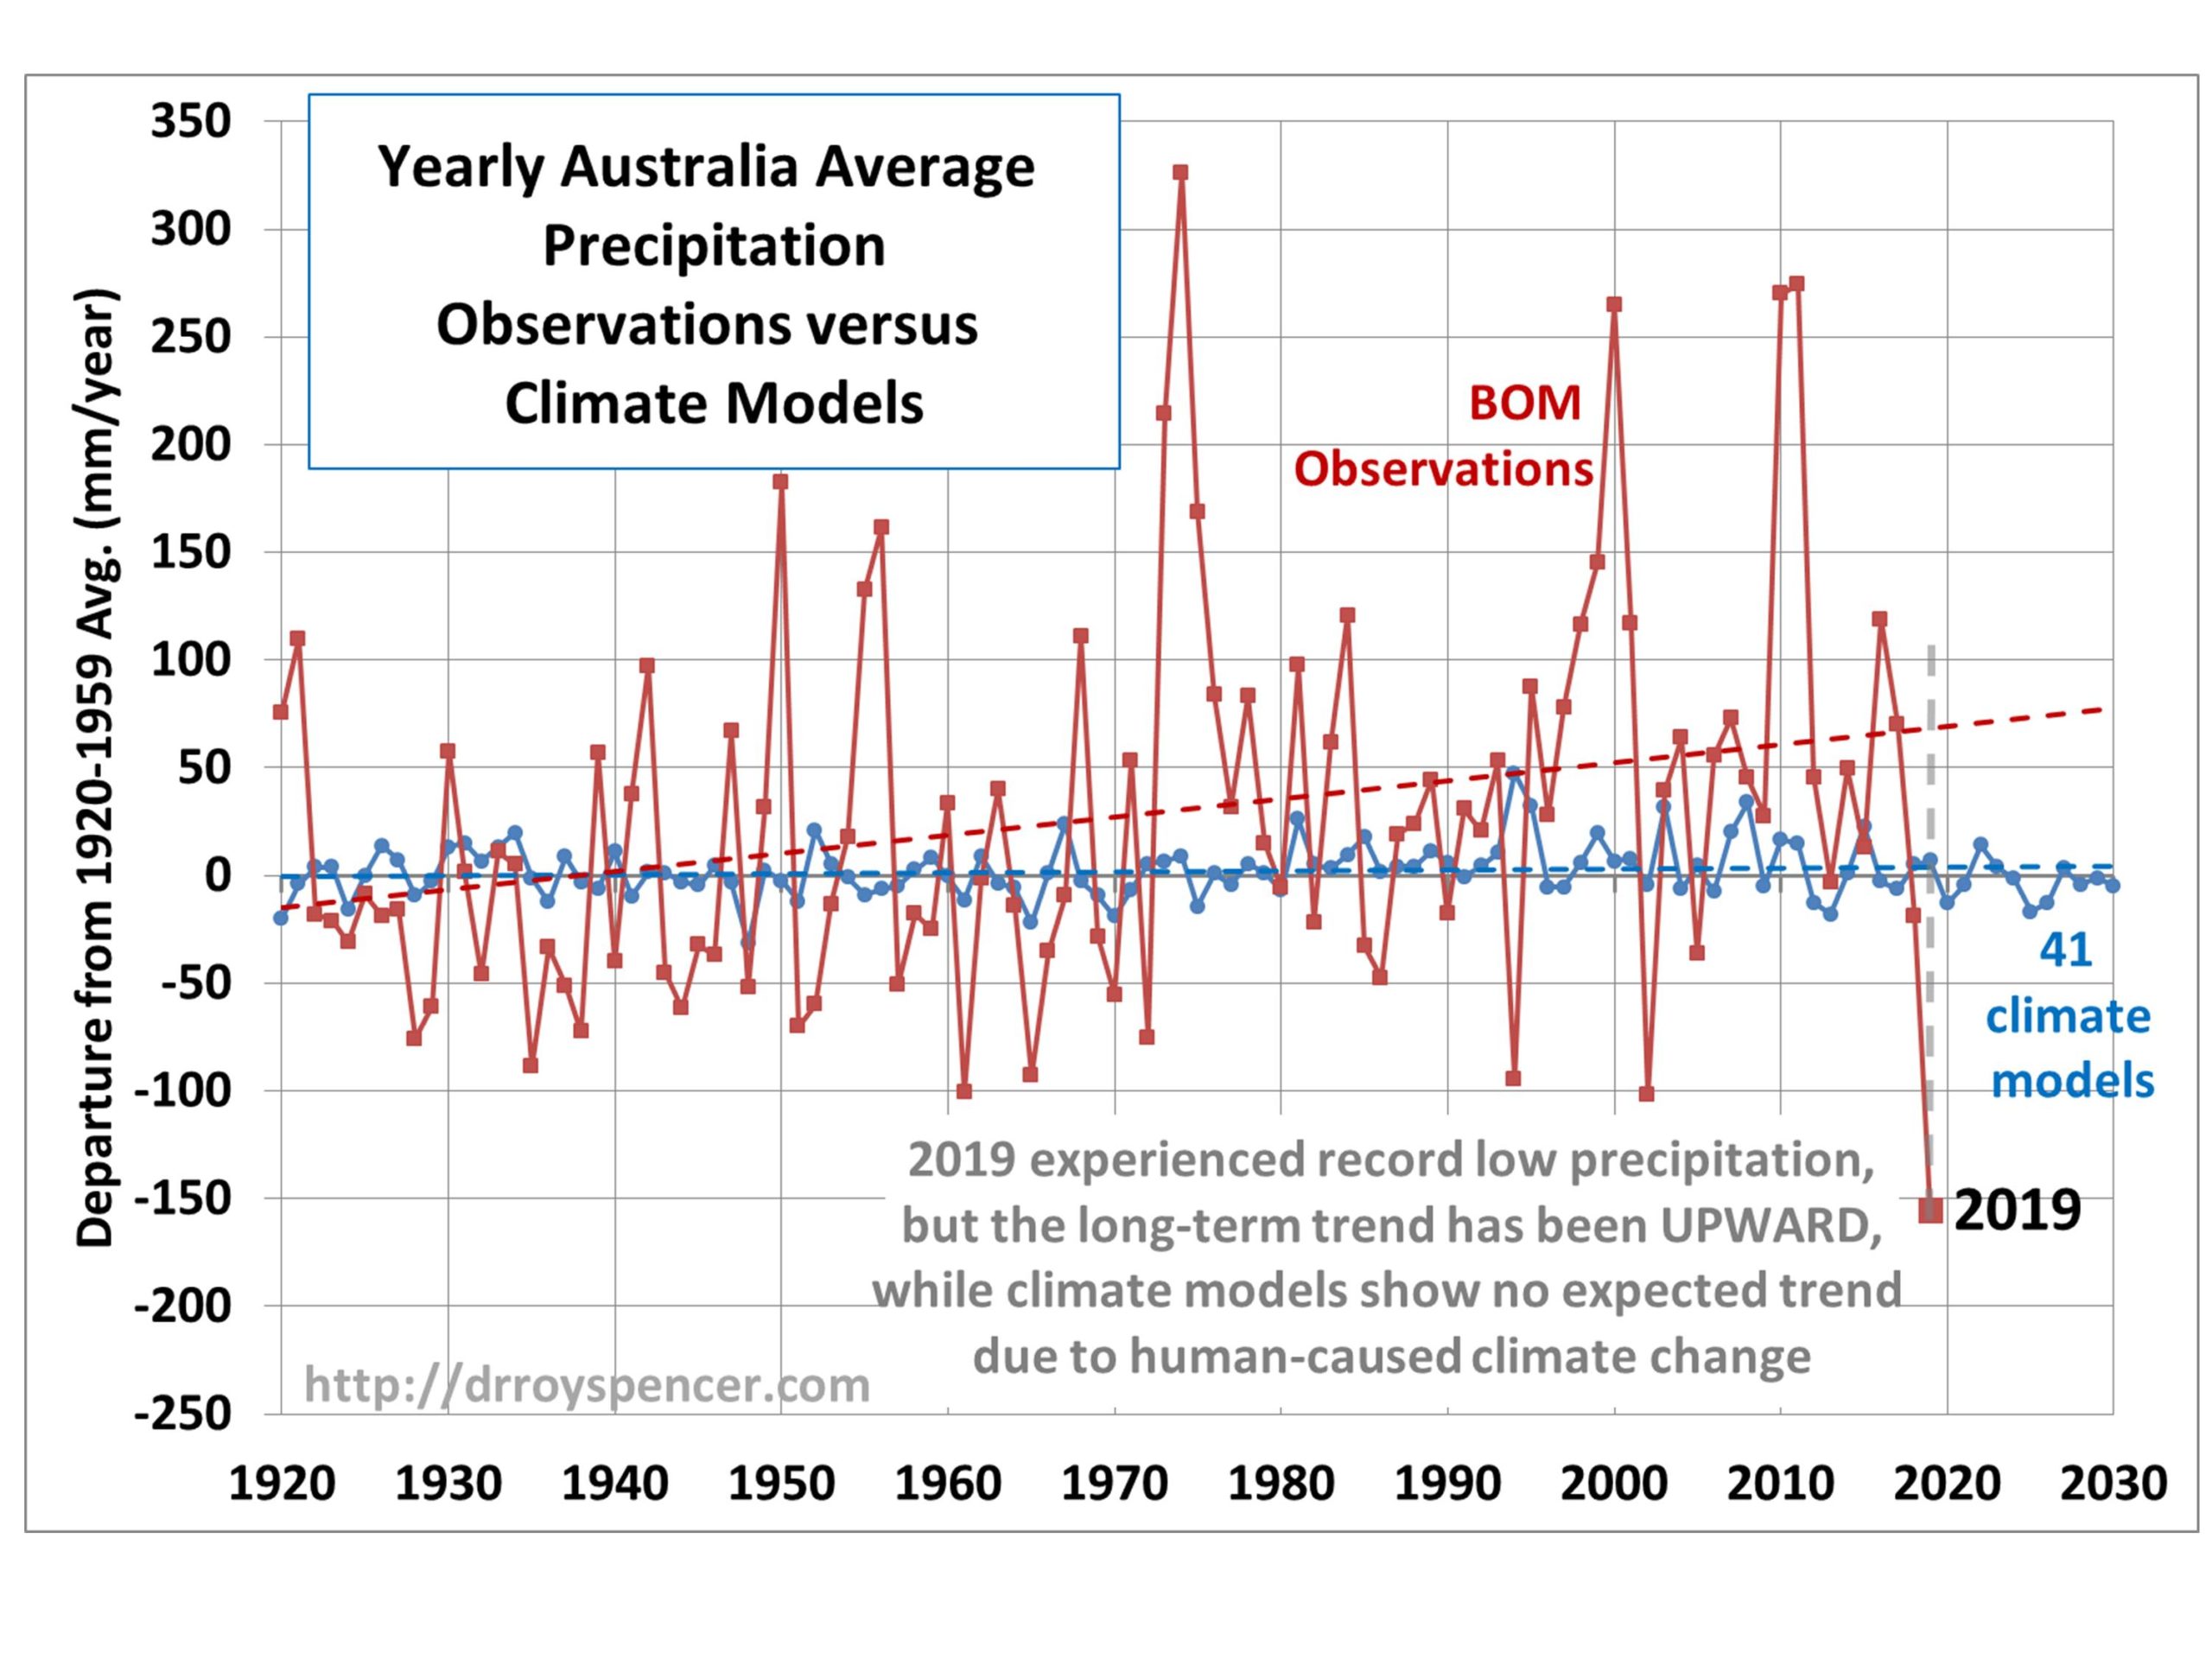
We can see that 2019 was definitely a dry year in Australia, right? Possibly a record-setter. But the long-term trend has been upward (not downward), again illustrating the fact that any given year might not have anything to do with the long-term trend, let alone human-induced climate change.
And regarding the latter, the blue curve in Fig. 3 shows that the expectation of global warming theory as embodied by the average of 41 climate models is that there should have been no long-term trend in Australia precipitation, despite claims by the media, pseudo-experts, and Hollywood celebrities to the contrary.
It should be kept in mind that wildfire risk can actually increase with more precipitation during the growing season preceding fire season. More precipitation produces more fuel. In fact, there is a positive correlation between the precipitation data in Fig. 3 and bushfire hectares burned (+0.30, significant at the 3-sigma level). Now, I am not claiming that hot, dry conditions do not favor more bushfire activity. They indeed do (during fire season), everything else being the same. But the current 2019-2020 increase in bushfires would be difficult to tie to global warming theory based upon the evidence in the above three plots.
Global Wildfire Activity
If human-caused climate change (or even natural climate change) was causing wildfire activity to increase, it should show up much better in global statistics than in any specific region, like Australia. Of course any specific region can have an upward (or downward) trend in wildfire activity, simply because of the natural, chaotic variations in weather and climate.
But, contrary to popular perception, a global survey of wildfire activity has found that recent decades have actually experienced less fire activity (Doerr & Santin, 2016), not more. This means there are more areas experiencing a decrease in wildfire activity than there are areas experiencing more wildfires.
Why isn’t this decrease being attributed to human-caused climate change?
Concluding Comments
There are multiple reasons why people have the impression that wildfires are getting worse and human-caused climate change is to blame. First, the news tends to report only disasters… not a lack of disasters. The desire for more clicks means that headlines are increasingly sensationalized. The media can always find at least one expert to support the desired narrative.
Second, the spread of news is now rapid and it penetrates deeply, being spread through social media.
Third, an increasing number of environmental advocacy groups seize upon any natural disaster and declare it to be caused by increasing CO2 in the atmosphere. The hyperbolic and counter-factual claims of Extinction Rebellion is one of the best recent examples of this.
This is all against a backdrop of government funded science that receives funding in direct proportion to the threat to life and property that the researcher can claim exists if science answers are not found, and policy is not changed. So, it should come at no surprise that there is political influence on what research gets funding when the outcome of that research directly affects public policy.
My personal opinion, based upon the available evidence, is that any long-term increase in wildfire activity in any specific location like Australia (or California) is dominated by the increase in human-caused ignition events, whether they be accidental or purposeful. A related reason is the increasing pressure by the public to reduce prescribed burns, clearing of dead vegetation, and cutting of fire breaks, which the public believes to have short term benefits to beauty and wildlife preservation, but results in long term consequences that are just the opposite and much worse.
Recent news reports claim that dozens of people have been arrested in Australia on arson charges, a phenomenon which we must assume has also increased by at least five-fold (like population) in the last 100 years. Accidental sources of ignition also increase in lockstep with the increasing population and all of the infrastructure that comes along with more people (vehicles, power lines, campfires, discarded matches and cigarettes, etc.)
So, to automatically blame the Australian bushfires on human-caused climate change is mostly alarmist nonsense, with virtually no basis in fact.
https://www.youtube.com/watch?v=-4OBcRHX1Bc&t=1491s
Roy
What seems more likely is a climate shift in the mid 1970’s – to a new mean and increased variance. That may have an anthropogenic trigger. It occurred in a dry century.
https://i0.wp.com/www.bom.gov.au/tmp/cc/rranom.aus.0112.24060.png
https://watertechbyrie.files.wordpress.com/2014/06/vance2012-antartica-law-dome-ice-core-salt-content-e1540939103404.jpg
https://journals.ametsoc.org/doi/full/10.1175/JCLI-D-12-00003.1
Here’s a comment I made on fire at Judith Curry’s site.
https://judithcurry.com/2020/01/04/week-in-review-science-edition-116/#comment-907086
However – removing my original comment on this here seems so far from justified that I am unlikely to return.
Regards
Oh Noes! don’t go away mad!
Bravo Zulu!
So, to automatically blame the Australian bushfires on human-caused climate change is mostly alarmist nonsense, with virtually no basis in fact.
A Google News Search on [Australia fires] and a subsequent word search on each article for “Climate” finds the following from the first page:
The devastating bushfires across Australia have cemented the fact that the country is on the front lines of a major climate-linked disaster,
VOX
Dickman said that because Australia often sees the effects of climate change before other parts of the world, these fires could be a preview of what’s to come globally.
CBS
Now the effects of climate change are making that scenario even less likely, and this bushfire season and drought are but a herald of things to come.
The Atlantic
Many have also called attention to the affects of climate change and global warming for accelerating the spread of bushfires.
ABC News
Fueled by drought and extreme heat, the bushfires have burned across the country since September, killing 24 people and destroying more than 1,000 homes.
NBC News
Apocalyptic wildfires may force a climate reckoning for Australia’s conservative leader
Washington Post
human-caused climate change has made this year’s season particularly catastrophic, experts say.
USA Today
The bushfires follow a three-year drought that experts link to climate change and that has left bushland tinder-dry.
Reuters
‘ Australia often sees the effects of climate change before other parts of the world, these fires could be a preview of whats to come globally.’
Fair
For those parts of the world sensitive to drought.
And that don’t do adequate prescribed burning in the cool months.
Except Australia has been getting wetter, last year notwithstanding!
Last year the severity of the drought was due to an unusually strong Indian Ocean Dipole, in conjunction with a Sudden Stratospheric Warming over Antarctica, both of which are naturally reoccurring events:
https://notalotofpeopleknowthat.wordpress.com/2020/01/05/australia-drought-the-indian-ocean-dipole-sudden-stratospheric-warming/
Yes they are naturally recurring events but because of the fact that they came on to of the strong trend of global warming they caused unprecedented damage.
‘Australia is getting wetter’
IMO, the obvious connection to climate change is that Australia is significantly warmer (~ 2 C) than 50 y ago.
There can be no doubt that added warmth will exacerbate drying of brush and make fires worse during dry periods.
“Indian Ocean Dipole” positive IOD events linked to drought in Eastern Australia
No one should be surprised that in a warming world, regional climate (weather patterns) may change.
“In 2008, Nerilie Abram used coral records from the eastern and western Indian Ocean to construct a coral Dipole Mode Index extending back to 1846 AD. This extended perspective on IOD behaviour suggested that positive IOD events increased in strength and frequency during the 20th century.”
@Nate – “IMO, the obvious connection to climate change is that Australia is significantly warmer (~ 2 C) than 50 y ago.”
Unfortunately, you are incorrect. That’s an artifact of data tampering of historic temperature sets. If you use raw data sets, almost all of Australia has cooled. Tony Heller covers it here: https://www.youtube.com/watch?v=WppbuIoyXdg
Nick, ‘hats an artifact of data tampering of historic temperature sets. If you use raw data’
Counterargument to that propaganda meme here:
https://tamino.wordpress.com/2020/01/06/bushfire-and-homophobia/
With respect, people who combine Heller’s quite an important point on tendential changes on the interpretation of raw measurement data with homophobia don’t quite invite me to read why I’m not woke enough.
Bushfires are caused by rain (rebuilds fuel), CO2 (helps growth), dry weather, hot weather, lack of previous burns (rain, fire supression, lack of controlled burning), and ignition like smoking, arson.
Trying to sell solar power is an ultimate idjt response here. You didn’t do that, congrats on that.
I just noted a prn site has typosquatted this address. Somebody please cancel the Intar webz.
‘Homophobia’ just a play on words.
He is talking about homogenization, and that there is nothing wrong with this, while not doing it causes errors, as he demonstrates.
As an young Australian who lived through the 1974/75 period I can tell you with certainty that global warming driven climate change was not even considered as an hypothesis.
At the time we were headed into an impending ice age.
1974/75 were not years of drought – In January 74 Brisbane flooded after a wet spring and a tumultuous downpour in the mountains surrounding the city of 51 inches over a few days. Brisbane city received 25 inches of rain from Thursday 24 January to about midnight Friday. On Saturday a large area of suburbia resembled a lake.
In December 1974 Cyclone Tracy destroyed Darwin in the Northern Territory.
There were 21 cyclones in Queensland and the Northern Territory during 1974 and 1975.
Anyone who says there is any evidence for any sort of claim about wild weather is simply ridiculous.
The 1974/75 wildfire season burnt more than 10 times the current devastation.
The reason today is so horrendous is due to no or insufficient hazard reduction burning due to green policies.
I know this for fact as I was a local government Environmental Health Officer until 2001 and I tell you green policies preventing forest management became entrenched in local government and State government in the early 1990’s.
Of course I have immense sympathy for those who have lost everything but the extra 75 molecules of CO2 in every million molecules of air have nothing to do with this.
CO2 does not start wildfires ! Blame oxygen if you must blame some atmospheric gas.
40+°C temperatures do not start wildfires !
In 1968 I was sitting for an examination in technical drawing in November – the temperature in the non air conditioned exam room on the ground floor of a two storey school building was well over 40°C.
It is the hottest day I personally remember at ~27° S on Queensland’s east coast. The next I remember was November 1980 where 39°C was recorded. I was water sampling that day and the water temperature in Olympic sized swimming pools was over 35°C.
The IR from an extra 75 molecules of CO2 in every million molecules of air have nothing to do with any of this.
“The 1974/75 wildfire season burnt more than 10 times the current devastation.”
Given all that rain, how do you think that happened? Was it months later?
Nate,
Over half the area that burned was in the Northern Territory.
Steve,
Every picture tells a story .
Here are two of them. Neither fits Dr Roy’s narrative.
http://www.bom.gov.au/climate/history/temperature/
http://www.bom.gov.au/climate/history/rainfall/
The point is that anyone with even half a brain no longer believes the BOM. UAH satellite temperature records show that last year was the 4th hottest year since 1979 when the UAH satellite data set begins, yet the BOM suggests it is the hottest year ever. According to the BOM the year 1998 was +0.96 °C above the 1961-1990 average and last year was nearly 0.6 degrees warmer that that. But according to the NASA Satellites, this year was a tenth of a degree cooler than 1998. Why does the BOM avoid this data and continue to manipulate the ground based data to support a thesis for which they will not provide the data nor the method. Don’t sound like the scientific method to me, sounds more like propaganda to me.
Alessandro,
“The point is that anyone with even half a brain no longer believes the BOM”
Your stated requirement for half a brain was very non specific. It depends on whether the half you have is the cerebral cortex responsible for logical thinking or the other half, the limbic cortex (lizard) brain. From your comment, it is very clear which half is lacking.
Yes, this was the 4th highest temperature for the lower troposphere as measured by UAH. The five highest being 2017, 1998, 2016, 2019 and 2018.
The trend for UAH for Australia is 0.19C per decade.
In contrast for the BOM surface data the five highest were 2019, 2013 ,2005, 2018, 2017 the trend for 1979-2019 is 0.22C per decade.
As was so perceptively pointed out by Ken Stewart in 2015, the differences between UAH and BOM data depend strongly on rainfall.See
https://kenskingdom.wordpress.com/2015/11/20/why-are-surface-and-satellite-temperatures-different/
Consequently the difference between the UAH and the BOM data for 2019 is totally unsurprising.
As for your ridiculous statement,
“Why does the BOM avoid this data and continue to manipulate the ground based data to support a thesis for which they will not provide the data nor the method. Dont sound like the scientific method to me, sounds more like propaganda to me.”
There are several hundred pages of documentation (15 separate documents and Python code ) that can be downloaded by anybody at any time at
http://www.bom.gov.au/climate/data/acorn-sat/#tabs=Methods
http://www.bom.gov.au/climate/data/acorn-sat/#tabs=Expert-review .
So Alessandro why don’t you just read these documents before going into “full zombie argument” mode. Who do you think you are? Tony Heller?
NASA: Study Confirms Climate Models are Getting Future Warming Projections Right
https://climate.nasa.gov/news/2943/study-confirms-climate-models-are-getting-future-warming-projections-right/
So is NASA right or wrong?
As Dr Roy has often noted, the surface and troposphere temps do not need to agree on rankings.
One reason for that is that a strong El Nino produces a much larger spike in the troposphere than at the surface.
The BOM are the last I’d listen to considering all the changes (read here: removal) they have made/ are making to historical weather data.
So long as you realize that the accusations against the BOM are brought to you by organizations, like the IPA, and their media friends, who have a political mission that benefits from the BOM getting it wrong.
This is like getting your health and safety information on tobacco from the tobacco companies, or on lead from the leaded gasoline companies, or on a drug from the drug company.
History tells us that is unwise.
Nate: you say that ‘this is like getting your health and safety information on tobacco from the tobacco companies, or on lead from the leaded gasoline companies, or on a drug from the drug company.’
Drug companies and health care professionals take the issue of drug safety very seriously indeed.
The following link to a World Health Organisation (WHO) publication should be of interest:
https://www.who.int/medicines/areas/quality_safety/safety_efficacy/ConsumerReporting.pdf?ua=1
Carbon,
Big Pharma assured us Opioids were not addictive and encouraged them to be prescribed much more.
Unfortunately many listened.
Sirs, I am living om the other side of the globe, but I am very interested in the cause of the bushfires in Australia. Many suggestions are made, including climate change. I believe that we are living in a rather warm period, but I am not sure about the cause of the warming and whether this will be a long lasting trend or just natural variability of the climate. Coming back to the bushfires, I saw an article about the problems in Murray/Darling bassin in respect to water management. The population in this area has shown an exponential growth with an accompanying growth of the demand of drinking water. The rivers are polluted and the water level of the rivers is becoming low. In Holland we are always concerned about the level of ground water. I am pretty sure that the level of water in this area has dropped substantially. The result will be that the soil is dry and consequentially warmer, and when the roots cannot reach the ground water the trees will become dryer and therefore more expos to fire. I missed this possible explanation for the unusual large and intense fires. I am interested in your opinion on this matter.
While Climate Change may have a small role to increase the temperature which may increase the hazard, the real hazard is allowing the fuel build up.
Proper management of the forest to reduce fuel load and provide fire breaks would drastically reduce both the size of subsequent fires and their ability to spread.
Money spent (by Australia) to reduce CO2 will do nothing in any short or medium term (as in decades). Money spent on forest management will have immediate results.
The fire authorities around the country think that mitigating CO2 should be part of hazard reduction. So do the vast majority of scientists. So who should we be listening to, exactly?
So who should we be listening to, exactly?
Your common sense.
Ok.
In a record hot and dry year to try to blame explosive bush fires on a possible spike in arson is not common sense.
Or to try to find other scapegoats is not common sense.
Well my common sense tells me that you rely on experts unless you know better than them.
I live in Australia and have listened to many “fire authorities” I will take notes when they talk about fire fighting, preparation for bushfires including fuel reduction. But when they move out of their lane and get into climate change they are often just another hysterical voice with nothing to back their alarmism. Worse they are actually suggesting that funds and effort be expended on measures that can have no affect on bushfires. Our own chief scientist has said so (but is very quiet at present..not a good career move!) If you tally the IOD and other variable weather phenomena, fuel loads, human ignition (arson,stupity bad luck) a severe drought (our own climate scientist Pitman said could not be attributed to climate change), then bad luck of dry lightening, what proportion do we set aside for climate change? Furthermore if Australia spends a few hundred million dollars to add to our growing tally of wind turbines and solar panels what affect would that have in reducing bushfires? The practical answer is of course no affect whatsoever. We should play our part in reducing emissions (even if the action is futile) to be a good world citizen and we do pull our weight when one considers the population and the nature and size of the country. A far more sensible approach at present would be to fix all the practical problems that presented themselves in this bushfire season…….lets start with fuel and forest management, preparation of buildings and property (some farmers were forbidden to prepare their properties by local (usually) green councils. More dams would help and better coordination of all the players noting that we did pretty well for such a massive event.
“Local council restrictions make prescribed burning ‘almost impossible’.”
https://youtu.be/KCgDsY-XvIA
Probably the most important factor has been the trend by the Australian government to progressively tighten the regulations banning the removal or thinning of indigenous vegetation.
Even the areas near homes are covered by the regulations, with heavy fines for those who violate the rules. As in the U.S., the fuel load has been increasing dramatically, but in Australia, many of the covered species are much more volatile than our species.
https://aic.gov.au/publications/rpp/rpp109/illegal-native-vegetation-clearing
The fire chiefs around the country are saying that the windows to do back burning are shortening. I get my information on policy problems and physical causes from them, and from researchers and scientists who study these things. Where are you getting your inormation from?
What about the Indian Ocean Dipole?
https://notalotofpeopleknowthat.wordpress.com/2020/01/05/australia-drought-the-indian-ocean-dipole-sudden-stratospheric-warming/
For whatever reason, the IOD is trending toward a dryer Eastern Australia
https://en.wikipedia.org/wiki/Indian_Ocean_Dipole
I think the reason is called weather!
The IOD is more often in the dry phase last few decades, so climate..
The IOD has only been monitored since 1999, far to short a period to detect trends.
http://enformtk.u-aizu.ac.jp/blog/2019/09/03/how-strong-is-the-2019-iod/
The IOD is poorly understood, and it maybe that it runs on multi decadal cycles, like AMO and PDO.
There is certainly no evidence that recent strengthening has anything to do with global warming at all
The IOD time series shown in my website is derived from a particular dataset which is available only since 1999. This dataset is of SST estimated by satellite measurements through microwave radiometry, which allows better sampling because the estimates are not affected by the presence or absence of clouds. IOD timeseries have been constructed from other datasets, for example ship-based observations. Most studies consider the period after 1950’s because SST is reasonably sampled since this period.
As per my analyses, there are no significant long term trends in IOD behaviour since the 1950’s. The strong 2019 IOD had a strong influence on rainfall and temperatures over Australia during that year, and is a climatological driver for the ongoing forest fires. Further, the strength of 2019 IOD is not related to global warming in my understanding.
OK,
“only been monitored since 1999”
‘In 2008, Nerilie Abram used coral records from the eastern and western Indian Ocean to construct a coral Dipole Mode Index extending back to 1846 AD. This extended perspective on IOD behaviour suggested that positive IOD events increased in strength and frequency during the 20th century.’
Abrams et al 2015 :
Instrumental records provide a reliable representation of IOD behaviour since 1958, while coral reconstructions currently extend the IOD history back to 1846. Large fluctuations in the number and intensity of positive IOD events over time are evident in these records, but it is unclear to what extent this represents multidecadal modulation of the IOD or an anthropogenically-forced change in IOD behaviour.
Ok fine.
‘Australian average temperatures in 2019 were well above what global warming theory can explain, illustrating the importance of natural year-to-year variability in weather patterns (e.g. drought and excessively high temperatures).’
So you are saying we should be trusting the accuracy of the models???!
The graph shows a strong warming trend for Australia since 1970. Those are the data and consistent with the global pattern.
The accurate modeling of it is a separate issue, IMO.
And yet there are at least 2 occasions where Australia’s BOM has doctored the temperature data. These magicians have somehow been able to cool the past 100+ years on.
If only they could work this magic right now.
And how about the fact that these same shysters have removed all trace of one of the most historically significant weather events reliably recorded from public view to support their temperature meddling.
Of course I am referring to the world record Marble Bar heatwave from the 1920’s.
160 days where the maximum temperature exceeded 37.8 C and over 40 for a significant portion of that – today 2 or 3 days over 40 C is a heatwave of unprecedented proportion.
I have been to many of these places.
“Of course I am referring to the world record Marble Bar heatwave from the 1920’s.
160 days where the maximum temperature exceeded 37.8 C and over 40 for a significant portion of that – today 2 or 3 days over 40 C is a heatwave of unprecedented proportion.”
This is no longer the case. The ACORN homogenisation process has reduced the 160 days at Marble Bar to 128 days by cooling 8 March 1924 below 37.8C. There were 160 days above 37.8C from 31 October 1923 to 7 April 1924, but in ACORN there are 153.
ACORN is touted as world-class and its cooling adjustment of every day of temperature observations in the early 1900s is said to produce a precisely accurate representation of actual temperature trends over the past 110 years.
That being the case, the 160 days have been “corrected” and the world record heatwave of consecutive 100F days is no longer held by Australia but by America due to 154 such consecutive days recorded in Death Valley in 2001. The US is unaware that it it can now boast another world record.
Details at http://www.waclimate.net/very-hot-days-marble-bar.html
It’s also worth exploring http://www.waclimate.net/very-hot-days-eastern-australia.html for a comparison of original RAW and adjusted ACORN frequency of very hot 40C+ days 1910-2017 in eastern Australia and specifically the drought/bushfire zones, and their correlation with November-April rainfall recorded at long-term ACORN stations in the area (start year 1910).
Within the southern Queensland and all NSW drought areas as recorded at the 20 ACORN stations, there’s been almost no long-term change in hot season rainfall, with RAW data showing very hot 40C+ days down from 14.61pa in 1910-1963 to 12.48pa in 1964-2017 (but up from 10.34 to 11.78 in ACORN). Annual rainfall in those time periods has dropped by an average 20mm per year (737.0mm to 717.6mm), while annual average maxima have increased by 0.22C in RAW and 0.41C in ACORN.
There was a rainfall increase from the 1940s to the 1990s and a reduction to pre-1940 levels since then, and the last four years have been particularly dry (although there have been 10 drier four year periods since 1910).
“Heatwave of consecutive 100F days is no longer held by Australia but by America due to 154 such consecutive days recorded in Death Valley in 2001. ”
Clearly the BOM is unpatriotic…
Eli Rabbett is not having a Bar of it.
Eli has gone down under for the winter and is safely ensconced in his well insulated burrow. He has informed me that the old record for number of consecutive days greater than or equal to 39 degrees C (102.2 F) has gone, see –
https://www.farmonline.com.au/story/5980916/rabbit-flat-smashes-national-heat-record/ .
Must be just the Urban Heat Island effect as the population doubled in the 70s. See –
https://en.m.wikipedia.org/wiki/Rabbit_Flat,_Northern_Territory .
p.s. I wonder what the Death Valley record is for days above 102 F? Maybe there’s hope for this little Aussie battler.
To get more exposure, perhaps you could try to convert your post into a response to the piece at https://quillette.com/2020/01/08/lessons-from-australias-bushfires-we-need-more-science-less-rhetoric/. (“But conservatives must also wake up. It is hypocritical to complain about science denial when it comes to the reality of biological sex or gender differences while at the same time denying that the predictions made by climate scientists years ago are generally coming true.”)
(Send it to [email protected].)
What many would consider an even-handed piece actually begged the question, which is whether any benefits of reducing carbon-dioxide emissions would justify the harm in increased cost, fuel poverty, etc.
Instead of promoting Jennifer Marohasy’s nonsense, why not try to clarify it:
https://tamino.wordpress.com/2020/01/06/bushfire-and-homophobia/
Rune Valaker
Wow! You were quicker by… 6 minutes!
Jennifer Marohasys data were logical and clearly explained.
What YOU have promoted, at the link, is nonsense.
Data polluted by significant revisions to the raw data (ACORN ! and ACORN 2 in the past decade alone), cooling past temperatures.
In addition, the use of electronic probes that record ONE SECOND TEMPERATURE PEAKS create global warming ‘out of thin air’, versus much slower reacting mercury thermometers.
Jennifer Marohasy attempted to include only mercury thermometer data to avoid that equipment change warming bias.
Also, the Australia BoM has played games with “hottest days” data to the extent that they have made fools of themselves ( I assume BoM is your favorite organization, Valaker? )
My report on the subject makes clear the arbitrary BoM data tampering:
https://elonionbloggle.blogspot.com/2019/12/tuesday-was-australias-hottest-day-on.html
Rune Valaker, it is YOU who have promoted nonsense, not Jennifer Marohasy.
You should be ashamed of yourself.
Whatever differences we might have in how to compare present and past temperature records over time, I would hope everyone could agree that showing a plot that excludes the recent temperature in support of an argument that some previous year might have been hotter is egregiously misleading.
What nonsense Mark B.
Using modern electronic probe one second T-max highs would have been misleading when compared to 1930’s data, from slow reacting mercury thermometers.
I believe there was also an artificial warming bias from a switch to a much smaller Stevenson Screen box between the 1930s and now.
Those two equipment changes will create modern warming out of thin air, yet the biggest bias is most likely repeated historical temperature “adjustments” — cooling the past and ignoring record high temperatures in 1896
The Australian BoM is a corrupt, politically biased organization, with little or no interest in unbiased real science.
Science fraud in support of the “coming global warming crisis” is a standard operating procedure for the BoM.
Richard,
According to the Weather Observers Handbook the time constant for a Stevenson screen is about 4 to 17 minutes depending on wind speed so the 1 second claim is just unadulterated b.s..
Here is the reference-
https://tinyurl.com/uq6v7fr
MikeR
Well, if the BOM would respond to criticism instead of stonewalling questions it would be easier to believe. The electronic devices have their shortcomings and if the BOM is not open about them, it means they have something to hide.
Wert,
What particular shortcomings have you identified? The 1 second response time is not an issue considering they are in Stevenson screens that have response times in the order of minutes.
As for other quality control issues such as calibration, linearity of the devices etc. you can read all about it at –
http://www.bom.gov.au/climate/data/acorn-sat/#tabs=Methods
http://www.bom.gov.au/climate/data/acorn-sat/#tabs=Expert-review .
Also information can be found among the very detailed answers to 22 FAQs here.
http://www.bom.gov.au/climate/data/acorn-sat/#tabs=FAQs .
Among that, and the numerous references contained within, you should be able to find the information you require.
The BOM are such terrible stonewallers aren’t they? However seek and thee shall find.
To Mike R.
The real question, which you have deliberately evaded, is whether or not electronic sensors in their own enclosures are providing different T-max measurements than mercury thermometers in various Stevenson Screens (large, small, wood, plastic).
The answer is YES.
The differences between the two very different measurement devices is at least in
a +/- 0.5 degree C. range, with higher readings from electronic sensors much more common than lower readings.
Here is a summary of a study on the subject:
https://notrickszone.com/2015/01/13/weather-instrumentation-debacle-analysis-shows-0-9c-of-germanys-warming-may-be-due-to-transition-to-electronic-measurement/
The response lag of a large size Stevenson Screen box containing mercury thermometer(s) is the slowest, especially when there is little or no wind
The response times you quoted from the link were most likely biased by assumptions deliberately selected to estimate a worst case response time:
(1) An instant step change in the temperature
(2) A sunny day
(3) Little or no wind
It seems that with electronic sensors, different countries are using different methodologies, such as one second readings averaged over one minute, ten second readings averaged over five minutes, readings every five minutes, etc.
After multiple adjustments, homogenization, infilling, and whatever other science fraud the BoM applies (such as ignoring late 1800s heat records, a logical person should have near zero confidence in surface temperature “data”.
You , I suppose, just LOVE the BoM surface temperature data ?
Richard,
If you want to examine whether the BOM has issues with Tmax and changes in the size if the Stevenson enclosures then you need to actually read a number of documents. These can be found on the BOM site.
To make it easy I have links and tables of contents that explains in details the issues that you are referring to,
From October 2018,
http://www.bom.gov.au/research/publications/researchreports/BRR-032.pdf
3. Homogenisation methods. page 5
3.1 Detection of inhomogeneities – use of multiple detection methods in parallel. page 5
3.2 The adjustment procedure in ACORN-SAT. page 7
3.2.1 The percentile-matching (PM) algorithm overlap cases, page 8
3.2.2 The percentile-matching algorithm non-overlap case. page 10
3.2.3 Monthly adjustments. page 13
3.2.4 ‘Spike’ adjustments. page 13
3.2.5 Overall summary of adjustments. page 14
3.2.6 Second round of homogenisation. page 14
3.2.7 Observation time adjustments. page 15
3.3 Adjustment methodological changes in ACORN-SAT version 2. page 16
3.3.1 Removal of rounding biases. page 16
3.3.2 Detection of date shifts. page 16
3.3.3 Adjustment of negative diurnal ranges. page 17
3.3.4 Transition from large to small thermometer screens. page 17
4. Evaluation of other potential systematic issues. page 19
4.1 The transition to automatic weather stations. page 19
4.2 Potential changes in response times with changes in automatic weather station
probes. page 21
5. Sensitivity and uncertainty testing. page 22
5.1 Parallel station sets used in uncertainty testing. page 22
5.2 Sensitivity of adjustments to choice of reference station. page 23
5.3 Sensitivity of adjustment to number of reference stations used. page 24
5.4 Sensitivity of adjustment to choice of reference period. page 25
5.5 Comparison of daily and monthly adjustments. page 27
6. Magnitude of adjustments. page 27
7. Comparison of version 1, version 2 and AWAP. page 29
8. Case studies. page 33
8.1 Unrepresentativeness of overlap period. page 33
8.2 Variable inter-site relationships during high-rainfall periods in arid region. page 34
9. Conclusion. page 35
10. References. page 36
There are about 40 references that could provide more details.
From 2012
http://www.bom.gov.au/climate/data/acorn-sat/documents/ACORN-SAT_Observation_practices_WEB.pdf
Some history 1
Observation process 2
Units of measurement 2
Time and timeliness of observation 2
Manual data records 3
Transmission of observations 3
Reading manual thermometers 4
Automated platinum-resistance digital thermometers data 4
Exposure of instruments 5
Screen maintenance 7
Inspections 7
Infrastructure for surface air temperature measurements 8
Metadata 8
Instrument shelter 9
Supply and field use of in-glass thermometers 14
Supply and use of platinum-resistance thermometers for field use 16
Traceability and verification of SAT measurements 23
There are also dozens of articles concerning the Expert Review in 2011 and Technical Reviews in 2015, 2016 and 2017. These can also be found here –
http://www.bom.gov.au/climate/data/acorn-sat/#tabs=Expert-review .
‘The Australian BoM is a corrupt, politically biased organization, with little or no interest in unbiased real science.’
according to the coal and mining industry allies in Australia.
I guess we should believe them…?
Nasty Nate:
The BoM is a monopoly.
They “adjust”, infill, and delete temperature data at will.
They homogenize so no one can figure out what they have done at any single weather station.
Their so called “climate change (junk) science” is nothing more than repeated wild guesses about the future climate, that have been consistently wrong for many decades.
The coal and mining industries are not monopolies, and do not provide temperature data to the public.
In fact, much of the coal is exported to China, and burned there, giving the Chinese reliable, constant, inexpensive electricity.
The Chinese use the energy from Australian coal to manufacture solar panels, sold to Australia (and elsewhere), so that Australia will have intermittent, unreliable, expensive electricity.
All the coal mined in Australia is burned somewhere on this planet, so the CO2 emissions are the same whether the coal is burned in Australia or China !
Nate, only a leftist like you could come up with such a Forrest Gump energy plan — can you explain it to me ?
Richard,
‘They homogenize so no one can figure out what they have done at any single weather station.’
Homogenization is standard practice and useful.
If you prefer to get your ‘science’ and ‘information’ from organizations whose mission is neither science nor public service, but instead politics and profit, like the IPA, their corporate sponsors, and their media mouth-pieces, that’s up to you.
Personally I prefer to get my science and facts from organizations whose missions are only science and public service.
The idea that these fires could have been prevented by fuel reduction burns has been dismissed by all leading fire fighting officials. If you look at the images, only a fool would claim that reducing leaf and grass litter on the forest floor would have had any effect. The fires spread like crazy through the forest CANOPY. In effect, I could have done a preventative burn yesterday and it would have had no effect on the enormous fire front bearing down in my bush property.
Secondly, even assuming that fuel reduction burns have some effect, it is a fact that the ability to do so in Australia is limited by the number of days in the year when it is safe to do so. In other words, increasing temperatures and drought have a DOUBLE WHAMMY effect.
Thirdly, as for the other points raised – I don’t yet have time to tackle them – other than to note that here in Australia we are aware of a concerted effort by powerful right-wing/coal mining interests to undermine the link between climate change and bushfires. The Murdoch controlled media is the leader here and has been continually caught out spreading fake news and downright lies. It is verging on the criminal.
Also, the conservative government here has been found seriously derelict in its duties to take advice and action on bushfires. The prime minister has been demonstrated to be a fool in the eyes of the world. People here despair at the gross stupidity that is on show.
Michael Jackson
Neither am I an Australian, let alone would I live there and would have had experienced what happened in this country this year.
But I nonetheless can only agree to what you wrote, as it perfectly underlines what I read here today (link provided by commenter MikeR):
https://www.abc.net.au/news/2019-12-20/hazard-reduction-burns-bushfires/11817336
It is really interesting to note that
– on the one hand, Roy Spencer (and in the background John Christy) tell us how inaccurate the models are when compared to UAH’s data
but
– on the other hand, they tell us that ACORN surface temperatures are inaccurate when compared to model output.
In my native tongue we love to say: “Deux poids, deux mesures.”
*
I prefer to follow real science, e.g. Grant Foster’s explanations concerning the pretended difference between ACORN’s raw and homogenised data, with as example the Australian Rutherglen station, a repeated target of Dr Marohasy’s incompetence:
https://tamino.wordpress.com/2020/01/06/bushfire-and-homophobia/
*
Before we start a comprehensive, fair discussion about the role of climate change in this season’s bush fires, we should at least manage to avoid relating to incompetent observation.
In Figure 2 Dr Spencer is using the ACORN surface temperature anomaly which is a homogenized. I don’t think there’s anything wrong with that selection as there is with Marohasy’s.
Spencer’s point that 2019 was unusually warm even acknowledging global warming which is true and relevant enough. It might be more informative if there were standard deviation regions about the model line, but that’s nitpicking.
From the Introduction to the Streton Royal Commission Report on the 1939 fires:
In the State of Victoria, the month of January of the year 1939 came towards the end of a long drought which had been aggravated by a severe hot, dry summer season. For more than twenty years the State of Victoria had not seen its countryside and forests in such travail. Creeks, and springs ceased to run. Water storages were depleted. Provincial towns were facing the probability of cessation of water supply. In Melbourne more than a million inhabitants were subjected to restrictions upon the use of water. Throughout the countryside, the farmers were carting water, if such was available, for their stock and for themselves. The rich plains, denied their beneficient [sic] rains lay bare and baking, and the forests from the foothills to the alpineheights, were tinder. The soft carpet of the forest floor was gone; the bonedry litter crackled underfoot; dry heat and hot dry winds worked upon a land already dry, to suck from it the last, least drop of moisture. Men who had lived their lives in the bush went their ways in the shadow of dread expectancy. But though they felt the imminence of danger they could not tell that it was to be far greater than they could imagine. They had not lived long enough. The experience of the past could not guide them to an understanding of what might, and did, happen. And so it was that, when millions of acres of the forest were invaded by bushfires which were almost Statewide, there happened, because of great loss of life and property, the most disastrous forest calamity the State of Victoria has known.
These fires were lit by the hand of man.
Seventyone lives were lost. Sixtynine mills were burned. Millions of acres of fine forest, of almost incalculable value, were destroyed or badly damaged. Townships were obliterated in a few minutes. Mills, houses, bridges, tramways, machinery, were burned to the ground; men, cattle, horses, sheep, were devoured by the fires or asphyxiated by the scorching debilitated air. Generally, the numerous fires which during December, in many parts of Victoria, had been burning separately, as they do in any summer, either “under control” as it is falsely and dangerously called, or entirely untended, reached the climax of their intensity and joined forces in a devastating confluence of flame on Friday, the 13th of January.
On that day it appeared that the whole State was alight. At midday, in many places, it was dark as night. Men carrying hurricane lamps, worked to make safe their families and belongings. Travellers on the highways were trapped by fires or blazing fallen trees, and perished. Throughout the land there was daytime darkness. At one mill, desperate but futile efforts were made to clear of inflammable scrub the borders of the mill and mill settlement. All but one person, at that mill, were burned to death, many of them while trying to burrow to imagined safety in the sawdust heap. Horses were found, still harnessed, in their stalls, dead, their limbs fantastically contorted. The full story of the killing of this small community is one of unpreparedness, because of apathy and ignorance and perhaps of something worse.
Steel girders and machinery were twisted by heat as if they had been of fine wire. Sleepers of heavy durable timber, set in the soil, their upper surfaces flush with the ground, were burnt through. Other heavy wood work disappeared, leaving no trace. Where the fire was most intense the soil was burnt and destroyed to such a depth that it may be many years before it shall have been restored by the slow chemistry of Nature. Acres upon acres of the soil itself can be retained only by the effort of man in a fight against natural erosive forces.
The speed of the fires was appalling. They leaped from mountain peak to mountain peak, or far out into the lower country, lighting the forests 6 or 7 miles in advance of the main fires. Blown by a wind of great force, they roared as they travelled. Balls of crackling fire sped at a great pace in advance of the fires, consuming with a roaring, explosive noise, all that they touched. Houses of brick were seen and heard to leap into a roar of flame before the fires had reached them. Some men of science hold the view that the fires generated and were preceded by inflammable gases which became alight. Great pieces of burning bark were carried by the wind to set in raging flame regions not yet reached by the fires. Such was the force of the wind hat [sic], in many places, hundreds of trees of great size were blown clear of the earth, tons of soil, with embedded masses of rock, still adhering to the roots; for mile upon mile the former forest monarchs were laid in confusion, burnt, torn from the earth, and piled one upon another as matches strewn by a giant hand.
There had been no force to equal these in destructiveness or intensity in the history of settlement of this State, except perhaps the fires of 1851, which, too, came at the culmination of a long drought.
Roy it is a pleasure see a cool analytical analysis. It is a shining beacon in a forest of misinformation being disseminated for political and ideological reasons.
Peter
“It is a shining beacon in a forest of misinformation being disseminated for political and ideological reasons.”
Yesterday night I saw within an article published by the French newspaper Le Monde this graph reproducing an analysis of NASA satellite data:
https://drive.google.com/file/d/1vCafQptuZ1IYYof1iCJ9eYycuCjAALKG/view
Is that in your opinion misinformation too, Sir?
I forgot to mention that the graph represents the number of fire starts. I suppose that everybody will have understood that.
As presented by you of course it is misleading, and in fact meaningless.
MJ – While I mostly agree with your first 2 points, your third is unsupportable, based solely on opinion and your personal bias.
Thought I’d link some studies I’ve found which align their conclusions closer to Spencer’s than the image the mainstream media and green groups are pushing:
“Here we utilize a satellite based “active fire” (AF) product to statistically analyze 2001–2015 variability and trends in Australian fire activity and link this to precipitation and large‐scale atmospheric structures…it is found that Australian fire activity is decreasing (during summer (December–February)) or stable, with high temporal and spatial variability.”
https://agupubs.onlinelibrary.wiley.com/doi/full/10.1002/2016JD026312?fbclid=IwAR3P65jY-xz3RmuQkBDiNSVdN39DVZDAlwJqxhOGN4ABJK2Y3TmHtMbd_Ns
“The last 15 years of satellite observations indicate a decrease of the global amount of burned area…”
https://agupubs.onlinelibrary.wiley.com/doi/10.1029/2019GL083469
Thank you Richard. Convincing.
CF,
not just my opinion.
The prestigious Financial Times writes:
The scale of the countrys wildfire emergency has few precedents. But it has been exacerbated by a regrettable lack of leadership from the prime minister, Scott Morrison. Beyond Australias shores, his government stands as a reproach to any leaders tempted to follow its lamentable response to the deepening threat of climate change.
Since land management and fire services are State & Territory responsibilities, the attacks upon the Prime Minister of the Federal government constitute a significant missed target.
Something like say, kicking into an open goal and having the ball fly over the bar instead of into the net, or landing a try short of the try line instead of over it.
Check out the New York Times article:
https://www.nytimes.com/2020/01/08/world/australia/fires-murdoch-disinformation.html
Wow, the misinformation reported in the Murdoch newspapers sounds strikingly similar to many of the talking points posted here.
I wonder if people realize how often they are being misinformed and manipulated by their news sources, for the benefit of some corporate interests.
https://www.google.com/amp/s/amp.abc.net.au/article/11701132
So this from, let’s say, the mirror image of the “Murdoch Press” is in error also?
Ok sure. And same source has this:
https://www.abc.net.au/news/science/2020-01-14/climate-change-ocean-warming-2019/11863056
And this
https://www.abc.net.au/news/2020-01-11/australias-fires-reveal-arson-not-a-major-cause/11855022
Another bit of fake news about arsonists, designed to minimise the role of climate change:
On Wednesday morning, Mr Trump Jr shared an article by The (MURDOCH-OWNED AND DESPISED) Australian that claimed 183 alleged arsonists had been arrested since the start of the bushfire season to his 4.2 million followers.
Within the article, however, there are a number of issues, including that most of the arsonists were actually arrested for bushfire-related offences, such as discarding a lit cigarette or failing to comply with total fire bans, not deliberately lighting fires.
In a statement on Monday, NSW Police Force said they had charged only 24 people with allegedly deliberately lighting bushfires since the beginning of the season.
Dr. Spencer
Great post! What is needed and missing, though, is something you mentioned WRT California: a long term trend for the hot – dry – windy index. That would go a long way in quantifying a climate change connection.
This point is VERY important:
[Bushfires (like wildfires elsewhere in the world) are a natural occurrence wherever there is strong seasonality in precipitation, with vegetation growing during the wet season and then becoming fuel for fire during the dry season.]
Therefore:
a) look for precipitation trends in the wet seasons. Higher points to greater fire risk.
b) look for trends in the The Hot-Dry-Windy (HDW) Fire Weather Index during the dry season. Again, higher points towards greater fire risk.
C) The combination of the two trends would explain a lot.
As they say in Oz about Oz, “It’s as dry as a pommie’s (English man’s) bath mat”.
“So, to automatically blame the Australian bushfires on human-caused climate change is mostly alarmist nonsense, with virtually no basis in fact.”
!!! surely you are joking !!!
You have made a basic error in assuming the record of fires represents the change in propensity for fires when all it does is reflect the fact that improvements in monitoring, manpower, training, equipment and warning systems over time should lead to a decrease -all else being constant. Except that it is not constant.
Dowdy (2017) calculated values for Australia from daily data 1950 to 2016. He noted that:
“Statistically significant long-term changes are generally positive in sign (i.e., increases in FFDI values over these time periods). Relatively widespread regions of increased FFDI values occur in some cases, such as for the more recent time period in southeast Australia during the SON season
i.e. the independently derived index for propensity has increased.
That is not “no basis in fact”.
Michael Jackson, please cite your references for your statement ”
The idea that these fires could have been prevented by fuel reduction burns has been dismissed by all leading fire fighting officials.” Having spent plenty of time on the fire line I can’t imagine any professional fire fighter saying anything along those lines.
Australia has gone overboard on protecting indigenous trees and shrubs to the extent that they will fine people for creating a less fire susceptible zone around their own residences.
In the U.S. we face the same issue. The environmental groups effectively shut down our forest products industry in the late 1970s, and we quit thinning and harvesting. While the USFS does little in the way of forest management now, they do take an inventory of all forest ownerships once per decade. Their efforts show that we have 60% more merchantable timber today than we had in 1953, much of it beginning to stagnate and experiencing the insect and disease issue that follow. The acres burned in the U.S. are now starting to increase. In the 1920s, the acres burned were 5 times what we experienced in 2017 and 2018. If we don’t seriously start to reduce our nation’s forest fuel load we will experience the levels of the 1920s again. Fuel load is the big kahuna in this issue!!!
‘Their efforts show that we have 60% more merchantable timber today than we had in 1953, much of it beginning to stagnate and experiencing the insect and disease issue that follow.’
Really a forest can stagnate?
In my area, New England, farms have become less sustainable over time. There used to be cigar tobacco grown here for example.
Thus the land has reforested, back to what it was before the colonists arrived and cleared the land.
Not sure why thats a bad thing?
“I can’t imagine any professional fire fighter saying anything along those lines”
From Steve Warrington, Chief Officer of the CFA (Vic):
“The Country Fire Authority’s chief officer Steve Warrington said there was a “fair amount of emotion” around the issue.
“We’ve had fire down the landscape here that has had burns go right through it [during colder months] and it hasn’t slowed it at all,” he said.
The emotive argument is not supported that fuel reduction burning will fix all our problems.
Some of the hysteria that this will be the solution to all our problems is really just quite an emotional load of rubbish, to be honest.”
From his counterpart in NSW
“That’s a sentiment echoed this morning by New South Wales Rural Fire Service Commissioner Shane Fitzsimmons, who shot down the common misconception that “green tape” is making hazard reduction harder.
“Our biggest challenge with hazard reduction is the weather and the windows available to do it safely and effectively,” Mr Fitzsimmons said in an interview on Sunrise.”
“Sure, there’s environmental and other checks to go through but we streamline those. There’s special legislation to give us clearance and to cut through what would otherwise be a very complex environment.””
The NSW guy without messed up characters:
“That’s a sentiment echoed this morning by New South Wales Rural Fire Service Commissioner Shane Fitzsimmons, who shot down the common misconception that “green tape” is making hazard reduction harder.
“Our biggest challenge with hazard reduction is the weather and the windows available to do it safely and effectively,” Mr Fitzsimmons said in an interview on Sunrise.”
“Sure, there’s environmental and other checks to go through but we streamline those. There’s special legislation to give us clearance and to cut through what would otherwise be a very complex environment.””
A few historical records that may put the current situation into perspective. Also the population has increased, therefore more people are affected. Satellites observe the whole continent and news is instantly available. The Federation drought in the late 19th early 20th century was the worst ever.
https://www.australiangeographic.com.au/topics/science-environment/2011/11/the-worst-bushfires-in-australias-history/
http://romseyaustralia.com/fireall.html
https://cfs.sa.gov.au/site/about_cfs/history_of_the_cfs/bushfire_history.jsp
https://www.canyonleigh.rfsa.org.au/australian-bush-fire-history
https://trove.nla.gov.au/newspaper/article/249824272/27153558
“High temperature and low humidity alone do not cause dead vegetation to spontaneously ignite.”
Some years ago, I was staying in the Best Western Royal Plaza Hotel, Marlborough, Mass, in a room overlooking the car park.
One morning I could see a fire engine in the car park, and it was dousing fires around a couple of small trees, which had recently been given a fresh load of bark mulch around the base.
As I was watching, the mulch around another of the trees started burning, and the firemen went over to douse that one as well. I’ve no idea if there was some fire-starting agent involved (broken glass, perhaps?)
This occurred in May, when the weather had very recently turned hot.
https://en.wikipedia.org/wiki/Spontaneous_combustion
In the right circumstances, things can spontaneously ignite on their own absent a human starting it. Although it often takes a human to create the conditions for it to happen. That said, spontaneous combustion, to my understanding, would be more a risk factor when “recent moisture” gets paired with extreme heat.
Which is why farmers are generally careful to ensure their hay is properly dried before they bale it. Without any appreciable moisture content in the core of the bale, the risk for ignition is much lower.
Off topic, sorry… but you guys may want to check out the global ocean SSTs. They are crashing.
https://www.tropicaltidbits.com/analysis/ocean/global.png
It would seem that the north Pacific blog has disappeared in less than 1 week.
https://www.tropicaltidbits.com/analysis/ocean/cdas-sflux_ssta_global_1.png
north Pacific blob that is lol
DR Healy:
[In the U.S. we face the same issue. The environmental groups effectively shut down our forest products industry in the late 1970s, and we quit thinning and harvesting. While the USFS does little……]
How come you ask for citations and references, then make claims that appear to have originated at your local tavern?
Here’s the reference: http://www.fia.fs.fed.us/program-features/rpa/ 2012 RPA Resource Tables Tabs 18 and 19
It is very interesting to see a location which is warming faster than climate models. I wonder..
Yes, when that is the case you are supposed to believe the models more than the data..;)
For some more context, here is a composite map of all the burned areas over one month.
https://bigthink.com/strange-maps/australia-bushfires-photo
Too bad the satellites weren’t available in 1975 for comparison.
For context, it would be interesting to see how much of Australia has burned relative to a bad year for the continental United States.
Sorry to say that composite was created over a period of 35 days from records spanning much greater than any one season.
Also, it purports to show bushfires in desert areas, so cannot be regarded as any valid indication of the current state of the continent.
The current season’s fires are confined to the Eastern States and for Victoria only the south-east corner of the State.
Dear Mr Spencer, Thank you for this synthesis.
somme additional information:
You write :
“Curiously, though, according to Australia Bureau of Meteorology (BOM) data, the 1974-75 bushfires occurred during a year with above-average precipitation and below-average temperature.”
The phenomenon doesn’t seem that “curious”.
In fact, the two years preceding the 74-75 fire season were heavy rainfall years. according to the australian Bureau of statistics, here: https://www.abs.gov.au/Ausstats/[email protected]/0/6C98BB75496A5AD1CA2569DE00267E48
“lush growth of grasses and forbs following exceptionally heavy rainfall in the previous two years provided continuous fuels through much of central Australia and in this season fires burnt over 117 million hectares or 15 per cent of the total land area of this continent.”
So excess rainfall has allowed vegetation to grow above ordinary levels in central Australia during the two previous years, in areas where population density is very low, so most of the 74/75 fires were without human casualties.
Excellent comment.
For people lacking the distance needed to interpret events regularly coming and going, hete is a pretty view on the Northern Pacific Blob, just a few years ago:
https://tinyurl.com/s33w2aw
Perfect La Nina conditions!
Thus no, the Great Cooooling is not planned for tomorrow.
And La Nina still is quite a bit lazy…
https://tinyurl.com/vqdd8a9
Bindidon,
How does posting a picture of a full on La Nina from 10 year ago prove that the north Pacific blob is still healthy? The warm pool of water that has been there is gone. The global ocean has just taken a nose dive in a matter of days. Please explain how that fits into the physics of CO2 without natural cycles. ie if GHGs caused the blob, how can it disappear?
As for the eventual La Nina, it is still coming.
Scott R
“As for the eventual La Nina, it is still coming.”
Certainly not as long as El Nino predictions by JMA look like this:
https://tinyurl.com/sh2bu7f
The graph looked like that 12 months ago already.
Bindidon,
You can not win this argument with me based on more el nino activity during a solar minimum. I never said when la nina will start… just that it is timed as we start a new solar cycle. If the new solar cycle doesn’t start due to the GSM, that delays the la nina. Are you saying we will never get a la nina ever again due to GHGs?
The low pressure invading the Midwest this weekend is what broke up the north Pacific blob. One good low pressure system is all it took. The blocking high has been wounded.
Go to Jan 17th 6z. Two more low pressure systems attack what is left of the north Pacific warm pool.
https://www.tropicaltidbits.com/analysis/models/?model=gfs®ion=npac&pkg=mslp_pcpn_frzn&runtime=2020010912&fh=6
The climate change blame game continues ad infinitum ad nauseum. If it’s not causing wildfires in the Australian outback then it’s causing hurricanes to strengthen or move slower. If hurricanes don’t get your attention, then climate change is strengthening the polar vortex. If record-breaking cold doesn’t convince you, then move onto bleaching coral reefs. In the end, the eco-alarmists simply choose whatever local/regional anomaly is currently newsworthy and just plugs it into the narrative. By the way, what ever happened to the disappearance of the Arctic ice caps predicted by Al Gore in “An Inconvenient Truth?” As of today’s reading, they are at 94% of the 30 year norm! Also as of today, we now have just 4,019 days left to save the planet, as per the dire predictions of a certain first-year Congresswoman. Don’t forget to mark your calendars!
Bravo
That is why we have to through it in their faces every time the natural cycle takes it the other way. It is not intellectually sound to say man made gases cause warm weather, cold weather, dry weather and wet weather all at once. And extreme weather… don’t forget that one. It took a low pressure system to break up the blocking high in the Pacific. So extreme weather now causes ocean cooling… but supposedly CO2 caused the blocking high, and also causes extreme weather. It is hilarious until you realize these folks are in charge of our education system, and the majority of governments everywhere around the earth, want to extract our energy rights, turn us into slaves via taxes. Pretty much we live in the scientific dark ages.
Sadly, I retired from a tenured position because today’s average college student is not prepared to benefit from the college experience. They come to our classrooms being taught what to think, not how to think. Most don’t read, don’t write, and don’t care. In the 1700s we had The Enlightenment. Today, we have The Bewilderment.
@DR Healy
Your reference relates to this claim, which I did not disagree with:
[Their efforts show that we have 60% more merchantable timber today than we had in 1953, much of it beginning to stagnate and experiencing the insect and disease issue that follow.]
********
But my problem was with the nonsense below:
[In the U.S. we face the same issue. The environmental groups effectively shut down our forest products industry in the late 1970s, and we quit thinning and harvesting. While the USFS does little]
In the USA, 84% of wildfires in the United States that required help by firefighters between 1992 and 2012 were a result of something humans have done. See this well documented report with maps, graphs, and tables:
https://www.pnas.org/content/114/11/2946
Title of the Research Article
Human-started wildfires expand the fire niche across the United States, by Jennifer K. Balch and others
One subheading:
“Human-Related Ignitions More Than Tripled the Length of the Wildfire Season”
PNAS = Proceedings of the National Academy of Sciences
Thanks for the orientation.
May I recommend to additional check this website:
https://www.aic.gov.au/publications/bfab
Social science information, necessary to know that lots of the hysteria is result of a boring life in rural AU with beer, joint and campfire.
And Im sure there are stories, that should be told about campfires gone wrong and guilt.
Joachim Hochmuth
“Social science information, necessary to know that lots of the hysteria is result of a boring life in rural AU with beer, joint and campfire.
And Im sure there are stories, that should be told about campfires gone wrong and guilt.”
Thus when I understand you right, you think that of the over 60,000 fire starts of this year, a vast majority was initiated by arsonists and frustrated, drunk rural people. Right?
Na Sie haben aber astreine Vorstellungen. Oh Mann.
DR Healy
I’m all but a specialist here, neither about Australia let alone about Australian bush fires.
*
In the 1960’s, a fire scientist devised a way to forecast the potential danger imposed by bush fires in forested areas of Australia, the Mcarthur Forest Fire Danger Index (FDDI):
https://tinyurl.com/osgdxlv
Later on, somebody from the same corner explained that below an FDDI of 50, you can explain bush fires by fuel, but that above 50, you move to bush fires explained by temperature.
And exactly that is told by the specialists: they couldn’t even cleanup anymore. That happened in 2009 already, if I have well understood.
*
But I agree that to blame climate on every event related to temperature, bush fires included, is hard to accept, unless you come up with irrefutable explanations.
An example: I found 4 GHCN daily stations in NSW & Victoria with data for 1939, 1974 and 2019 (Sydney Obs & Airp, Essendon Airp and Cape Otway), and generated a daily average for these three years:
https://tinyurl.com/vvhpv6y
Yes, 2019 looks a lot warmer than 1939 and 1974. That has been clearly demonstrated by Grant Foster, who debunked Dr Marohasy’s claim on 1939 being warmer than 2019.
But it is not quite convincing. And above all, a descending sort of the daily average for all years between 1939 and 2019 does not support very well the warming as primary cause:
2009 38 38.78
1969 8 38.17
1968 31 37.92
1942 4 37.18
1941 360 37.18
1993 15 36.30
2016 348 36.03
1939 13 35.90
2018 6 35.75
1953 355 35.72
2019 is not even in the top 10, let alone any of its Oct, Nov or Dec days.
Yes again, anomalies would tell us more than absolute values. But we then would see this in the monthly anomalies already:
1908 1 3.59
2015 10 3.37
1894 11 3.06
2019 1 2.93
2009 11 2.93
2005 12 2.93
1940 3 2.86
2013 9 2.81
1902 11 2.79
1867 10 2.74
Here you see for 2019 no more than a January, on par with lots of other years.
Thus, there must be other climatic forces than what is made visible by a simple trace of daily high temperatures.
And drought plus temperature doesn’t explain everything either: somewhere above, commenter Vincent Benard gave an plausible resumee on the cause of these really severe bush fires in 1974.
Last not least: Australian bush fire smoke went over the Pacific, and reached Chile, Argentina and even Brazil. Did that ever happen before?
The black Thursday (1851 5 million hectares) and Black friday (1939 2million hectares) were larger and more intense than these fires. Like black Saturday on a much greater scale. Its been been fuel load plus local pyro convection that have made these quite severe. But the real fire storms occur when a strong dry cold front and jet stream interact, drawing down ultra dry stratosphereic air with 100kph winds.
“(Sydney Obs & Airp, Essendon Airp and Cape Otway)”
This isn’t where the bushfires were. All those places are close to the sea. On 4th Jan, for example, when it rose to 35.9°C in Sydney, it reached 48.9°C in the western suburb of Penrith.
Nick
I know! But… I was too lazy for an inspection of what ACORN could provide in puncto daily data. There are many more GHCN daily stations in NSW+Vic, e.g., yes yes,
ASN00067113 -33.7195 150.6783 24.7 PENRITH LAKES AWS
but, unfortunately only for
ASN00067113 -33.7195 150.6783 TMAX 1995 2019
ASN00067113 -33.7195 150.6783 TMIN 1995 2019
Only these four I chose had data in 1939 as well.
Please, Nick, feel free to do the same job at home using more accurate data…
I wish you all the best at moyhu.
Jean-Pierre
Debunking by Grant Foster?
Yes Gerald, that is why it was such a mismatch and the employee of the right wing think tank (IPA*) Marohasy was so far out of her depth.
Part 2 of the demolition job by Grant Foster can be found here-
https://tamino.wordpress.com/2020/01/09/trend-australia-trend-summer-trend-temperature-trend/ .
* for the funding of the IPA see https://en.wikipedia.org/wiki/Institute_of_Public_Affairs .
Just an interesting footnote regarding the IPA. They have had a long association (since 1994) with the tobacco industry. Their funding includes British American Tobacco and a recent board member included a representative of Philip Morris International.
Further information about the connections can be found here –
https://www.tobaccotactics.org/index.php/Institute_of_Public_Affairs .
Perhaps this is why Marohasy was so phelgmatic about bushfire smoke.
Maybe these fires are an attempt to re-introduce Australians to the joys of smoking with a brand new Eucalyptus flavour. Also New Zealand and possibly South America are other avenues that are being explored, see –
https://www.dw.com/en/smoke-from-australia-fires-reaches-south-america/a-51923046 .
That tobacco connection is interesting, another example of what Naomi Oreskes found in the “Merchants of Doubt”:
https://tinyurl.com/p3hykrp
These are simple market failures where a naive understanding of economics confuses rectification with socialism, when in fact there are market oriented ways to restore Pareto optimum:
https://tinyurl.com/kdp4zd9
Here’s a recent interview by Andrew Bolt with retired CSIRO scientist David Packham.
This scientist was the recognised expert on fires and the causes and he clearly states that removal of massive fuel loads is the first priority.
To think that we could make a difference by reducing co2 emissions is absolute nonsense and ignores the fact that China, India and developing countries have increased global co2 levels by about 60 ppm since 1989.If anyone is really concerned about co2 emissions they should take their protests to China etc. Good luck with that because you’ll need it.
Look up the data for yourselves and Wiki even provide a graph for countries c02 emissions since 1970. Here’s the Chapman interview link.
https://www.youtube.com/watch?v=E6RrgBrb6R8
Neville
1. “… This scientist was the recognised expert on fires and the causes and he clearly states that removal of massive fuel loads is the first priority.”
Thus you tell us that a retired CSIRO scientist having worked in an institution permanently denigrated by ‘skeptic’s e.g. at WUWT, has a deeper and more relevant fire experience than e.g. people like
– Victoria’s Country Fire Authoritys chief officer Steve Warrington,
and
– New South Wales Rural Fire Service Commissioner Shane Fitzsimmons!
Very interesting. This shows again how quick ‘skeptic’s are ready to ‘forget’ their negative mind whenever that fits to their narrative.
*
2. “… and Wiki even provide a graph for countries c02 emissions since 1970.”
This, Neville, is a far too simple approach.
Everybody knows since decades that in both China and India, an important part of CO2 emissions resulting from coal burning is due to export, mainly toward USA, Europe and Japan (the rest: peanuts).
The fact has been pretty good analysed and explained ten years ago by Steven J. Davis and Ken Caldeira:
Consumption-based accounting of CO2 emissions
https://www.pnas.org/content/107/12/5687
Here you see, even without reading the article, how a consumption-based evaluation of worldwide CO2 emissions looks like:
https://tinyurl.com/yx62ylgv
Apart from the fact that nearly everything imported from China and India is cheaper than inland production or imports from elsewhere, there is NO valuable reason to import from these two major exporters!
If the USA, Europe and Japan would have relied on own production instead, you would see a posteriori to what ridiculous amounts the CO2 emissions by China and India would be reduced to.
Bin, The public has been falsely indoctrinated about the causes of climate change. A deeper penetration into the science confirms that CO2 is a follower of climate change, not a cause. The irony is that reducing the use of fossil fuels, which is the agenda of many, will have no effect on climate. https://watervaporandwarming.blogspot.com
“watervaporandwarming.blogspot.com”, brilliant!
Jesus Pangburn!
What I wrote has nothing to do with CO2 ideology, let alone with yours, which is even dumber.
Could you finally stop shedding your irrelevant stuff like a dog on every tree?
Bin, My analysis has nothing to do with ideology. If you had looked, you might have known better.
Robert Mitchell
“Black friday (1939 2 million hectares) … larger” ???
Where did you get that from?
Black friday in 1939 was only a short period.
How can you pretend that 1939’s bush fires were larger than what Australia experiences right now, with over 10 million hectares burnt inbetween, just because the fires were quicker at work?
Nate, you increasingly sound like a stuck record
David Guy-Johnson
I still have a few heavily stuck LPs at home, all over 40 years old.
Nevertheless, their contents are so interesting in the long run that I sometimes prefer to listen to them rather than to intact records.
Ok. Here’s a convincing discussion from someone else on the link between temp, rainfall and fires in California.
https://tamino.wordpress.com/2018/11/17/temperature-rainfall-and-california-wildfire/
You’re kidding I presume. Take some time to do your own research, and you will find the statement factual. Timber harvests from federal lands declined precipitously since the late 1970s. Remember the spotted owl and the marbled murulet, cases in point. I left the field of forestry then because the mills I purchased stumpage for were shutting down. We now have a small fraction of the wood processing facilities that existed in the early 1970s.
Please explain for me why the U.S. imports $20 billion worth of wood products annually, while we let our forests burn, to say nothing of the hundreds of thousands of jobs we eliminated.
Please take some time to study the history of this issue. Having lived through it, I find it an appalling waste of resources and manpower.
How has climate change affected wildfire frequency and severity? To find out, just weigh the relevant trends:
Temperature
– max
– min
– mean
Wind
– speed
– duration
– direction
Humidity
Precipitation
Fuel load
– quantity
– type
Be sure to factor in the timing and location of all the above.
******
Good luck!
Nice article Roy. There are many reasons why we are having a bad season and it irks me seeing the media just outright blame our emissions on them.
According to scientists over here the Indian Dipole is responsible for the staggering conditions we have been experiencing especially in December. The monsoon was also late so no rain for the North.
@DR Healy
[In the U.S. we face the same issue. The environmental groups effectively shut down our forest products industry in the late 1970s]
********
[According to the American Forest and Paper Association (AF&PA), the U.S. forest products industry employs about one million workers and accounts for approximately six percent of the total U.S. manufacturing GDP, placing it roughly on par with the automotive and plastics industry. The forest products industry is among the top ten manufacturing sector employers in 48 states and generates over $200 billion a year in sales and about $54 billion in annual payroll.]
http://www.fs.fed.us
[Domestic roundwood harvest increased from 1950 through the mid-1980s, peaking at 15.6 billion cubic feet (ft3) in 1989, and has remained steady until the recent economic downturn when roundwood harvest declined to 10.5 billion ft3 by 2009. Roundwood harvest increased to 11.1 billion ft3 by 2011.]
http://www.fia.fs.fed.us
@Roy Spencer,
Such lies and propaganda as always,
Yes the fires in 1974 burned more than 2019 and yes rainfall was high and temps low that year. The reason for the fires was exactly this. The rain fell in dry areas and this led to grassland growth. These large area fires burned a lot of that grassland.
The 2019 fires are completely different because they are burning rainforest, temperate forests, wet forests – wooded fires that burn extremely hot hence the apocalytic images compared to grass fires.
Rainfall predictions. I agree they aren’t predicted to change on an annual basis, but every prediction predicts heavier rain followed by periods of flood followed by extended dry periods associated with the warming climate. That is devastating for farmers and ecosystems alike
But hey this is Dr Roy Skeptic – where lies are dressed up as fact on a daily basis! Seriously Dr Spencer, you know nothing about Australia so leave your uneducated lies off!
I agree they aren’t predicted to change on an annual basis, but every prediction predicts heavier rain followed by periods of flood followed by extended dry periods associated with the warming climate.
Look again at the graphic.
The models obviously fail at capturing the variability of precipitation, but they also do not predict any increase in that variability.
We all have confirmation bias, and I’m certainly no different.
But I submit that those imagining that this event has anything to do with increased CO2 are only confirming their imagination.
Confirmation bias…yes:
So you look at an annual resolution and expect to see within year rainfall variability and rainfall intensity variability. And how do you propose a model predicts exactly when a drought will occur and for how long? We can’t even predict El Nio with estimates between every 3-7 years (they’ve been even more frequent recently):
https://www.climate.gov/news-features/understanding-climate/el-ni%C3%B1o-and-la-ni%C3%B1a-frequently-asked-questions
Well done mate. Maybe stick to what you know – ramming your head into the sand and yelling EVERYTHING IS OK as loud as you can.
But just incase you’re interested in learning some science:
https://www.csiro.au/en/Research/OandA/Areas/Assessing-our-climate/State-of-the-Climate-2018/Australias-changing-climate
“Australias weather and climate continues to change in response to a warming global climate. Australia has warmed by just over 1 C since 1910, with most warming since 1950. This warming has seen an increase in the frequency of extreme heat events and increased the severity of drought conditions during periods of below-average rainfall.”
“As the climate warms, heavy rainfall is expected to become more intense, based on the physical relationship between temperature and the water-holding capacity of the atmosphere. For heavy rain days, total rainfall is expected to increase by around 7 per cent per degree of warming. For short-duration, hourly, extreme rainfall events, observations in Australia generally show a larger than 7 per cent increase. Short-duration rain extremes are often associated with flash flooding.”
Keep talking on things you have no idea about though. it makes you look smart…to your skeptic friends with shares in fossil fuels.
I keep waffling on the California wildfire issue.
According to Cliff Mass, the most severe wildfires tend to occur during Santa Ana or Diablo wind events. Besides the high winds, they bring high temperatures and low humidity. A perfect recipe for dangerous fire conditions.
The problem? Those events, to the best of my knowledge, do NOT coincide with lightning strikes. In fact, just the opposite.
So, human activity lights the fuse at exactly the worse time, and when nature most likely would not have.
******
Here is an analogy:
It is an unusually hot, dry, and windy day, and I have opened the windows in my house to let the breeze through.
Somebody sneaks in and starts a fire. My house is quickly engulfed in flames and burnt to the ground.
I would be very angry at the arsonist. I would not complain that climate change had made the house burn faster than it might have 50 years ago, given a similar weather event.
*****
Using the above example, an increasing trend in arson or careless smokers would dwarf whatever climate change may contribute to an increase in house fire frequency or severity. Not even close.
Does this idea apply to the bushfires in Australia?
Sure, humans start fires by accident or other. They probably do so with similar frequency every year.
This year is a record for temp and drought in Australia.
Is there worse fire this year because of that? Or some speculated spike in arson?
Are Australia Bushfires Worsening From Human-Caused Climate Change?. Not possible because human-caused climate change is an unproven theory. Currently there is no evidence of it!
Australian Arson fires, the history of starting these fires is clear.
https://youtu.be/d-wbxDn14rE
Australian Arson fires, the history of starting these fires is clear.
https://youtu.be/d-wbxDn14rE
http://www.abc.net.au/news/2020-01-11/australias-fires-reveal-arson-not-a-major-cause/11855022 .
There are a few things going on here.
Australia relies on Great Artesian Basin , which feeds the aquifers of the entire continent. This is being drained of its annual monsoonal waters by the frack wells of mining companies extracting coal seam gas.. As the continent becomes more dry, the temperature rises and entire river / forest ecosystems which depend upon the Great Artesian are dying out.
Then there are the multi-national agribusinesses of the Murray Darling Basin. The aquifers of this river system draw upon the Great Artesian and so have a lower volume to draw down due to the frackwell drainage in the North. The farmlands in the south are not getting enough water through their river and creek system because all of the water is being siphoned off to dams that are privately owned by mega agricultural companies and mega mining companies using this water for private operations.
So there is no multi-year drought based on precipitation (2019 excepted), but there is less water available to the ecosystem that has exacerbated the problem.
Then of course one must consider the possibility of pyroterrorism. During very bad fires in 2009 this was treated as a real possibility. No speculation this time despite the government saying arson is behind some of the fires. Perhaps ecoterrorism to get countries to take climate change more seriously. Something to think about
Re: arson, pyroterrorism.
Given that this is a record hot and dry year..
No need to speculate about other causes of a bad fire season like an arson spike..
But your points about water usage are interesting.
Pft
“Then of course one must consider the possibility of pyroterrorism.”
Wow. Pyroterrorists starting over 60,000 bushfires within 3 months.
Great. You seem to be a top specialist…
@Nate,
[They probably do so with similar frequency every year.]
Not necessarily:
[There was a pattern of increasing ignitions going from west to the coast as population increases.]
*******
@binny
[Wow. Pyroterrorists starting over 60,000 bushfires within 3 months.]
30,000 is not out of the question:
Bushfires with a known cause:
– 47 percent accidental (cigarettes, burn-offs, campfires, sparks from machinery, powerlines)
– 40 percent deliberately lit
– 13 percent lightning
https://www.abc.net.au/news/science/2015-12-11/bushfires-in-south-east-australia-mostly-caused-by-humans/7013914
Again, a spike in arson/pyroterrorism is speculation without evidence, likely driven by pro coal interests to raise doubt about climate causes.
Meanwhile the record temps and drought are not speculation at all.
Snape
I understand what you mean, but can only partly agree to it.
A combination of temperature, dried fresh fuel and wind is everywhere the major cause.
P.S. Don’t call me binny! That reminds me this horrifying Gordon Robertson.
I also disliked that diminutive, but like you said:
“L’ignorance et l’arrogance vont très bien ensemble”.
Snape,
I found a full version of the paper that the article is based on.
https://sci-hub.tw/10.1071/wf15054
Some caveats.
The figures given are percentages of those ignitiuons with known causes. When total ignitions are taken into account, deliberate ignitions make up 28%.
Deliberate ignitions are not necessarily arson. Here are two categories described in the paper to give some context:
Accidental
Accidental escapes from prescribed burns, agricultural burns, debris burning, campfires or cooking fires. Fires accidentally lit by a cigarette or other smoking material. Fires caused by electrical malfunction, includes power lines and electrical equipment. Fires caused by equipment or machinery use or malfunction, includes cutting, welding equipment, cars, trains and farm machinery. Fires caused by the re-kindling of previously extinguished fires. Fires identified as accidental but no further details available.
Deliberate
Fires where there is evidence of deliberately lit fires, including fires lit by juveniles and fires lit without a fire permit; i.e. illegal fires.
Suspicious fires where circumstances indicate that the fire was likely to be deliberately lit but ignition source may not be identified.
Again, slightly different:
a) crank the heat in your house to 85 F
b) set up a dehumidifier
Your house will end up record hot and dry.
c) an arsonist sets your house on fire.
*****
Which is the biggest problem?
Disinformation about arson is out there. Earlier comment showed article stating that dozens of arrests for arson, when in fact most of these were citations for barbecuing and other nonArson burning..
We had the same discussion about California here before.
I guess there was plenty of arson in the stone age.
Will heat and drought affect the result?
“So, to automatically blame the Australian bushfires on human-caused climate change is mostly alarmist nonsense, with virtually no basis in fact.”
Higher temperatures in Australia are making fire intensity worse,worsening droughts,lengthening the fire season,increasing days of higher fire danger.
Not disputed by any fire agencies or governments here.
That is the issue not the straw-man put forward by Roy.
The fires in NSW are unprecedented, area burnt so far, unprecedented temperature dryness and drought.
UAH anomaly map shows the record hot zone that settled over southern Australia in December.
The vast majority of these fires have been caused by lightning strikes.
A lot of your information is incorrect i’m afraid.
The heatwaves/dryness we have experienced late in 2019 was due to the indian ocean dipole, the southern annular mode and a late monsoon. I get this from our Bureau of Meteorology.
In the Northern Territory in the 1974/75 bushfires over 60 million hectares burned. There was significantly more land burned in the 74/75 bushfires than the 2019/2020
The vast majority of fires at the start of the season are caused by humans whether it is arson or stupidity. Once these fires get out of control embers are the main culprit as high wind speeds usually generated by the fires blow these embers enormous distances and start many many more fires. If a firestorm gets big enough it can produce dry lightning but lightning is rarely the culprit in starting off the season or the quick spread of the fires.
Apologise for the spam but I thought I might add that there are other human caused factors like fallen powerlines that start many fires. This was what started the initial fire on black Saturday in Victoria in 2009. Many fires were generated from the embers and high wind that day but a second fire was deliberately lit. This fire also got completely out of control. It was a devastating day and many lives were lost.
Ever higher temperatures in Australia means ever worse bushfire seasons.
No amount of distractions,falsehoods or straw-man arguments will change that.
‘In the Northern Territory in the 1974/75 bushfires over 60 million hectares burned. There was significantly more land burned in the 74/75 bushfires than the 2019/2020’
From what I understand these were often in grassland low population areas, whereas the current fires are in populated and forested areas.
Perhaps there was less effort to control the 74-75 fires as they were not threatening humans?
The 1974/75 fires occurred following La Nina heavy rainfall the year before which created a mass of grass growth across vast regions of the interior in arid and semi-arid country.
45 million hectares burned in the N.T. 16 million in S.A., 29 million in W.A.
74/75 area burned in NSW is either 3.5 or 4.5 million depending on two data sets, the majority of that was in grass-lands in the far west of the state.
Area burned in NSW 19/20 is 4.9 million ha, and counting, most of that is forest fire.
Fire fighting equipment available today is far superior, yet still not enough.
In NSW these fires,the high temperatures, dryness and drought are all unprecedented.
I was wrong on the Northern Territory number, thanks for correcting that warmist but it still stand over 100 million hectares burned that season.
Warmist… I find it ironic that you accept La Ninas impact on the fires back then but can’t accept the impact of the IOD, SAM and a late monsoon now? The bureau has some very educational videos for unqualified people like us to learn about the systems creating the perfect conditions this season.
@Darren
“Warmist… I find it ironic that you accept La Ninas impact on the fires back then but can’t accept the impact of the IOD, SAM and a late monsoon now?”
I mentioned La Nina for it’s rainfall that created the mass of grass growth, nothing to do with temperature.
No I didn’t mention the IOD, SAM or AGW either.
Which of those three do you think is largely responsible for Australia reaching yet another record hot year?
From the Bureau’s annual climate statement:
“The mean temperature for the 10 years from 2010 to 2019 was the highest on record, at 0.86 °C above average, and 0.31 °C warmer than the 10 years 2000–2009. All the years since 2013 have been amongst the ten warmest on record for Australia.”
I’d say the IOD is primarily responsible for reaching yet another record. The question is how much do our emissions affect these systems? The SAM for example is seeing a positive trend. Lots of studies using models show Ozone depletion and GHG as a driver and other studies claim it might be natural variation. I ain’t qualified to say which is right but I think both play a role.
I’m sorry to repeat myself, but I think it’s important to put the issues in the right order. Before jumping to conclusions on the basis of flawed evidence, it is best to be sure that the foundations are solid.
Let me summarize the situation regarding temperature indices.
The adjustment and aggregation of temperature series is universally done by conserving short-term trends.
This method is criticized in Hansen et al. 2001 :
“It follows that a necessary concomitant of discontinuity adjustments is an adequate correction for urban warming. Otherwise, if the discontinuities in the temperature record have a predominance of downward jumps over upward jumps, the adjustments may introduce a false warming, as in Figure 1.”
The raw temperature series show a very significant predominance of downward jumps. The necessary adjustment to account for the increase in anthropogenic disturbances is not made. As a result, the raw temperature series are corrected by adding artificial warming when they should be corrected by subtracting the warming due to anthropogenic perturbations. The adjustments are therefore made in the wrong direction.
The estimation of the real temperature evolution can be obtained by means of proxies whose sensitivity to temperature is demonstrated at high frequencies:
https://zupimages.net/up/19/47/ilvv.png
This evolution is confirmed by the rate of sea level rise and by the rate of glacier melt.
phi
1. “The raw temperature series show a very significant predominance of downward jumps.”
Where is your data proving that, please?
*
2. “The necessary adjustment to account for the increase in anthropogenic disturbances is not made.”
Wrong.
Look at GISTEMP, they do that since 1998 (but you and all other people like you either ignore or deny this fact):
GISS Homogenization (Urban Adjustment)
One of the improvements introduced in 1998 was the implementation of a method to address the problem of urban warming: The urban and peri-urban (i.e., other than rural) stations are adjusted so that their long-term trend matches that of the mean of neighboring rural stations.
Urban stations without nearby rural stations are dropped.
This preserves local short-term variability without affecting long term trends. Originally, the classification of stations was based on population size near that station; the current analysis uses satellite-observed night lights to determine which stations are located in urban and peri-urban areas.
Today, the pseudoskepticism has moved ffrom the debunked UHI sydrome toward the pretentious and ridiculous claim that UHI is ‘everywhere’.
*
3. You make use of proxies for temperature series validation: exactly what has been thoroughly refused by the ‘skeptic’s since at least 20 years.
Your ‘high frequencies’ wouldn’t pass any WUWT sniff test.
*
4. You compare your (surface !!!) proxies with the UAH temperature series that
– not only has nothing to do with the surfaces, as it measures temperatures in about 5 km altitude, but also
– is heavily criticised because of his high difference with not only lots of surface series, but also with atmospheric series (e.g. RSS4.0, NOAA STAR).
*
5. You compare UAH with your May-October proxies: did you REALLY restrict the CRUTEM NH and UAH NH time series to that part of the year? And above all:
– why May-October?
– why the NH?
Maybe because this ‘absolutely unintentionally chosen’ combination so pretty good fits to your narrative?
*
5. “This evolution is confirmed by the rate of sea level rise and by the rate of glacier melt.”
Again: where is your data proving this claim?
Read for example this well done article:
https://tinyurl.com/qpu8m3s
Here is the data resulting from their work:
https://tinyurl.com/yx6gqkgy
*
Come back when you will have done the job of all these people you discredit.
“1. Where is your data proving that, please?”
Here, for example: https://www.zupimages.net/up/19/47/dyn5.png
Why do you always ask the same question, you should have understood.
“2. Wrong.”
Ah? Interesting. Source?
GISTEMP has always added artificial warming and they have completely changed their methodology (around 2013?).
“UHI is everywhere.”
Anthropogenic disturbances are everywhere where there are thermometers. This was inevitable at least until the 1970s (accessibility for regular readings).
3.
“Your high frequencies wouldnt pass any WUWT sniff test.”
I don’t care about the WUWT sniff test like it’s year 40.
4. UAH TLT is an excellent surface temperature proxy. There are objective criteria to judge this.
“did you REALLY restrict the CRUTEM NH and UAH NH time series to that part of the year?”
Of course.
“why May-October?”
Because MXD reacts to these temperatures.
“why the NH?”
You have to ask Briffa, not me.
You don’t know anything about the construction of temperature indices, you don’t know anything about proxies, you don’t know anything about sea level data; why do you feel compelled to intervene?
Look at Figure 1B in your link (https://tinyurl.com/qpu8m3s).
It confirms exactly what I’m saying.
phi, Let me ask you in no uncertain terms here…are you trying to convince us that measuring the temperature via tree rings is better than measuring temperature with instruments designed for that purpose?
Why are you asking this question, I already answered you here:
https://tinyurl.com/u53kok8
Let’s put this in plain English.
Phi thinks that the proxy record of temperature – particularly regarding the divergence period – is superior to the instrumental record.
It remains to be understood why phi cannot answer directly. It’s a simple question, and can be answered with a single word. Qualifications can come after that. But without straight answers confidence in the interlocutor ebbs.
@Warmist
Coolists, like ren, will point to an unprecedented cold, snowy event, thinking it proves GW is a hoax. We tell them that a single event is just weather, and they need to look at the trends. Same holds for an unprecedented hot, dry event.
As I argued earlier, wildfires involve so many variables, with trends potentially offsetting one another, that the task is really complicated.
Are there studies that weigh these variables and prove a climate change connection?
*****
For example, a trend towards less precipitation, leading to dryer fuel, might be countered by a trend towards less windy, which results in less evaporation and wetter fuel, as well as less severe fires.
A warming trend, also leading to dryer fuel, could be offset by higher humidity. The higher humidity – like less windy – will tend towards wetter fuel and less severe fires.
An evaporation pan will sum the effects of temperature, wind and humidity to tell you the rate of drying:
[Pan evaporation is a measurement that combines or integrates the effects of several climate elements: temperature, humidity, rain fall, drought dispersion, solar radiation, and wind. Evaporation is greatest on hot, windy, dry, sunny days; and is greatly reduced when clouds block the sun and when air is cool, calm, and humid. Pan evaporation measurements enable farmers and ranchers to understand how much water their crops will need.]
https://en.wikipedia.org/wiki/Pan_evaporation
Pan evaporation rates are tracked by the BOM:
http://www.bom.gov.au/climate/change/index.shtml#tabs=Tracker&tracker=timeseries&tQ=graph%3Devap%26area%3Daus%26season%3D0911%26ave_yr%3D0
*******
And as the coolists correctly point out, severe drought is a normal feature of Australia climate:
[Over the past five centuries we found extreme droughts similar to the recent Millennium Drought, but we also discovered wet periods that lasted decades.
We found short droughts of brutal intensity that blanketed all of eastern Australia, while other droughts of similar intensity were confined to small pockets across the continent.]
http://theconversation.com/500-years-of-drought-and-flood-trees-and-corals-reveal-australias-climate-history-51573
*******
All that, and we still have to weigh in the trend towards humans starting more fires…
In 2018, there was a destructive fire in the Columbia River gorge in Oregon, unprecedented for the area. Climate change may have contributed to the hot and dry conditions, but lightning is very rare.
There would have been zero acres burned if a teenager hadnt started it.
@Snape
I take your points.
All those climate variables being equal fire danger will be worse with higher temperatures.
This was predicted back in 2006 by the CSIRO, increasing days of higher fire danger index and has increased with temperature.
Nate, Darren
I used arson as an example, but accidental has the same result. Studies show that the majority of wildfires are ignited by human activity (similar rates for Australia and California). If the current fires in Australia are found to be mostly caused by lightning, that represents an anomaly, not a trend.
I am not trying to undermine the tragedy, its horrific. Just pushing back on headlines dominated by climate change.
Snape
Over 60,000 bushfires, ignited by human activity?
Hmmmh.
Bindidon
Snape seems to be heading in the correct direction.
The graph in this article shows the contribution, natural is only 6%, the rest are other things. Mostly human caused, not having to be arson, just a lot of contributions by different human activity.
https://www.abc.net.au/news/science/2019-11-20/bushfire-ignition-source-how-we-know/11701132
Sure those are how fires start, presumably every year.
But what is DIFFERENT about this year that makes it such a disaster?
Could it possibly be the temperature and moisture levels?
Nate
Yes the severe drought and high temperature would make fires worse. The question is this a “climate change” catastrophe that could have been prevented by reducing carbon dioxide accumulation in the atmosphere or do these weather events take place from time to time and cause disasters when they occur and such things take place if the Earth is a couple degrees cooler or warmer?
I also have a link to really long term trend in droughts in Australia (the article covers 7000 years and their were worse droughts in the past, thankfully they do not happen often).
Yes it’s difficult to attribute a single event to climate change. Only after accumulating stats on many such events..
But, the trend to higher temps is there. And higher temps (2 C in Australia) lead without question to > burning.
Example, El Nino produces a predictable spatial pattern of warming, and more fires result in these warmer areas. One of the known sources of extra CO2 during El nino.
Nate
You are an intelligent poster. My question to you would it make much difference on how dry fuel becomes if it does not rain but the temperature averages 87.4 F (as current summer in Australia) or 82.2 F which is a normal summer in Australia?
I was looking for some type of formula. The point I would make is a hotter summer will dry material faster but it will only get so dry and that is it. If there is no rain would there be much difference in how dry material gets from a normal summer or an abnormal hot one as long as there was a good amount of heat energy available to dry?
I would agree that the hotter days dry the material faster but by how much? How many days difference. I would think if you have a severe drought and no rain than the rate is really not that important except for when the fire season begins. Do you have links to any formulas for drying rates of forest materials?
No I dont have links handy or a formula.
I have a bit of experience with moisture content of porous materials. Dehydration is all about time, humidity, and temperature. I believe there are formulas worked out for wood and paper.
I recall reading articles about the recent California fires, stating that the dry season lasts months, and towards the end of it (Nov) fires happen because it takes months for brush to dry sufficiently, and wind conditions get worse.
And the articles stated that this year in Ca the fires were worse because it had been warmer during the dry season. This certainly could explain a lower moisture content in woody brush. And the season was extended a couple of weeks.
Per https://www.woodsolutions.com.au/wood-product-categories/roundwood
I believe you are talking about a whole different commodity here. Please check out figures on lumber production and other structural forest products and you will find a totally different story. We import $20 billion worth of these materials because we shut down a majority of the mills in the U.S. In the area where I live, just north of Seattle we have only about 4 or 5 small mills currently. The Everett waterfront alone had about 15. The big Weyerhauser mill shut down a while ago and the Kimberly Clark paper shut down due a lack of wood chips from local mills. I’m sorry, but your perception of the health of the forest products industry in most of the western U.S. differs greatly from reality.
@DR Healy
I did not realize until now that my first link was messed up. Sorry about that. But the US wood products industry, including saw mills and paper mills, is massive, even if not apparent from where you live:
Total revenue in 2018/2019 was $127 Billion
https://www.camoinassociates.com/sites/default/files/styles/content_image_small/public/figure%203_0.jpg?itok=A9SjtXJ1
https://www.camoinassociates.com/recent-and-emerging-trends-forestry-and-lumber
Dr. Spencer, do you have available the satellite temperature record for Australia to compare to the BOM figures for the last 40 years to see if the BOM figures are reasonable?
Using the Australian bushfire crises to get people to panic over climate change is not a new phenomena. I am happy we have a PhD meteorologist that is challenging fanatic alarmists (like Tamino who I consider the same level of lunacy as Joseph Postma just on the other pole of fanatic mind states).
Here are some that were used to panic the Public.
California drought. Was it historically unusual NO. Droughts far more severe have taken place long before Climate Alarmism became a thing.
Moscow heat wave, that lasted one summer, no trend, no long term pattern but was used to panic the Public.
Some of the larger hurricanes.
Now for Australia. Long term history of Australia suggests that terrible droughts do happen on this Continent. Best to help as some people are doing.
https://www.sciencedaily.com/releases/2019/02/190215092925.htm
All the alarmism is based on just about 100 years worth of data. This is a super tiny segment of any long term studies yet that does not seem to change the alarmists.
Roy Spencer’s approach is the most scientific one I have seen. Look at all the evidence. Yes Australia is hot this year and has a bad drought. Is it because of AGW, maybe, how much, unknown. Can we attribute this to AGW and produce a mindless fanatic Public? I suppose people like Tamino will continue to do it. I am sad some intelligent posters on this blog consider him a rational source of information. You would be as likely to sway him of his alarmist viewpoint as anyone could explain GHE to Joseph Postma or his blind followers.
‘ike Tamino who I consider the same level of lunacy as Joseph Postma just on the other pole of fanatic mind states).’
Really? My experience with Postma is he gets physics horribly wrong, and is a lunatic asshole/cult-leader.
Tamino: nothing remotely like that. He generally provides evidence.
Hi Norman,
Which PhD meteorologist is challenging Tamino’s work?
You also say you are sad that intelligent posters consider Tamino a rational source of information.
As a very, very unintelligent poster, I also think the statistician Tamino has provided an excellent source of statistical analysis. (Norman, I hope this makes you happier). In particular his rigour in insisting that , wherever possible , data needs to have supporting statistical uncertainties considered before conclusions are arrived at . The mathematician who writes the Moyhu blog is another who again , when it is possible and sensible, incorporates uncertainties.
Unfortunately Marohasy and her ilk never bother to include such niceties before making their assertions. I suspect that us why the intelligent posters treat their nonsense with the contempt and derision it deserves.
It also noticeable that Dr Roy rarely addresses uncertainties (if I have missed it , I apologise) which is in contrast to RSS see –
http://images.remss.com/papers/rsspubs/Mears_JGR_2011_MSU_AMSU_Uncertainty.pdf .
Finally, Norman I have always thought you are an intelligent and thoughtful commenter. Your apparent desire to occupy the centre ground between the two highly divergent narratives is commendable but sometimes the “ground truth” lies much closer to one narrative than the other. Consequently your bundling of the charlatan Joe Postma and a statistician like Tamino who hasca number of publications in referred climatological journals ( https://www.researchgate.net/profile/Grant_Foster ) is bizarre.
test
MikeR
Thank you for your thoughts. I do accept Grant Foster is a very skilled statistician. I would think he does good work in that area.
I would think that Postma may do useful work in the field of Astrophysics. The level of intelligence or skill is not the issue. It is the fanatic nature of both.
Tamino left a real bad taste in my mouth about what type of person he really is. I was posting some points on his blog a time ago. He clipped off a longer post and chose only to keep a line that made me look bad. I have zero respect for the integrity of this one and he is about as fanatic as Postma when you don’t blindly agree with him.
https://tamino.wordpress.com/2012/10/29/storm-surge/
Yes Norman, that was a very unfortunate exchange. I sympathize with you.
I no longer comment at the Marohasy site for a similar reason (after alteration of one of my comments). The difference being that the employer of Marohasy purports to be a champion of free speech.
Anyway enough of my petty grievance. The point is that we agree about the incompetence of Joe Postma when it comes to thermal physics and we also agree about the statistical capabilities of Tamino when it comes to climatology.
Yeah not cool. Postma altered one of my comments to make me look bad…
Hello!
The reference to Wikipedia of numbers of burnt hectares do not add up. The sum will total 17 millions, not 100 millions. Why is that?
L G
Snape:
Please check out;
ForestFacts_1952-2012_English.pdf
The graphs toward the end show the decline in lumber production in the U.S. it would appear that the east coast and south plus massive imports are picking up the slack, but the federal lands in the west have been shut down to harvest since the early 1980s. As a result, the fuel load in western forests has grown dramatically.
@DR Healy
[but the federal lands in the west have been shut down to harvest since the early 1980s.]
Logging? I thought you were talking about a whole different commodity?? Here again:
[Domestic roundwood harvest increased from 1950 through the mid-1980s, peaking at 15.6 billion cubic feet (ft3) in 1989, and has remained steady until the recent economic downturn when roundwood harvest declined to 10.5 billion ft3 by 2009. Roundwood harvest increased to 11.1 billion ft3 by 2011.]
http://www.fia.fs.fed.us
Click on forest facts tables, 2012
Snape:
The links you provide do not show the historic figures; only the present levels. Our forest products industry is a shadow of what it once was.
@DR Healy
The report is 64 pages long and titled:
US Forest Resource Facts and Historical Trends
Of course it has historic trends.
Meant to write:
Of course it has historic figures.
I am a bit surprised by Figure 2. Why would the measured temperatures in Australia be so much higher than the model results? We know from other sources that the models are around four times the actual, measured, warming. Have you compared the BOM measurements against UAH satellite measurements?
The data are not signal higher than the models. The data have annual variation as expected, while the model curve has none. That’s because the model curve is an average of many runs.
If he had shown the error range on the models you would see that the data and models are not in disagreement.
‘Signal’ –should be ‘significantly’
In the previous solar minimum in 2009, significantly more people died.
“The most deadly conflagration, which claimed 121 lives, was sparked by a faulty power pole near the township of Kilmore East, 37 miles (60 km) north of Melbourne.”
“On February 7, Victorians were told to brace for a record heat wave—with temperatures soaring to 115.5 °F (46.4 °C)—combined with gale-force winds of up to 56 miles per hour (90 km/hr). That day more than 47 major fires erupted across the state, 14 of them claiming lives or causing significant damage. With its abundant forests and hot, dry climate, Australia had often suffered from deadly bushfires, most notably the 1939 “Black Friday” blaze in Victoria, in which 71 people were killed, and the 1983 “Ash Wednesday” fires in Victoria and South Australia, where 75 people perished. The scale of the 2009 fires—attributed to extreme weather conditions coupled with a severe and protracted drought that had created tinder-dry vegetation across the state—was unprecedented and left the country in a state of shock.”
https://www.britannica.com/event/Australia-bushfires-of-2009
An example interesting reply to Dr. Spencer’s post.
https://tamino.wordpress.com/2020/01/12/australia-choose-your-future/
Several hundred thousand acres of Yellowstone National Park burned in 1988. It was by far the largest fire in Yellowstone in the 20th century.
It was blamed, probably correctly, on bad computer models and an ideology that had guided forestry management for decades that forest fires are “bad” and must be extinguished immediately (allowing underbrush to accumulate and provide fuel for fires after ignition).
https://www.youtube.com/watch?v=CAgP9fo3f7s
I’m not aware that climate change was ever mentioned as a contributing cause for the 1988 fire. Only a decade earlier, in 1978, the New York Times reported that an “International Team of Specialists Finds No End in Sight to 30‐Year Cooling Trend in Northern Hemisphere”
https://www.nytimes.com/1978/01/05/archives/international-team-of-specialists-finds-no-end-in-sight-to-30year.html?_r=1
At any rate, if a fire of the magnitude of the 1988 Yellowstone fire happened today, it is literally impossible to imagine the climate change propagandists would not saturate the media with claims about how man made climate change either caused it or made it worse.
Sorry about my questions. I looked in my Iphone and the longer numbers was short by one digit.
The hysteria about an ev. impact of CO2 is remarkable. When temperatures goes up it is CO2 and when temperatures goes down it is natural variability.
Then how come the Swedish temperature record of +38c was in 1933 and the cold record -52,6c is from 1966?
The second warmest year is 1934 and the only warmer year was in 2015 by some hundreds of degree!
This should lead to some realism in the current media hype.
LG
Lars Gustafsson says:
“Then how come the Swedish temperature record of +38c was in 1933”?
Because the precision was +/- 0.5 C?
Snape
I read through both your citations and they go all the way back to 2018, but do make growth projections for the future. I’m referring to the change since the 1950s or earlier. Your second citation mentions 2 billion in exports, when we’re importing 20 billion. Your citations don’t support your conclusion.
@Warmist
[I take your points.
All those climate variables being equal fire danger will be worse with higher temperatures.]
Yes. I agree 100%
******
I have come up with a better way of explaining my thinking on a hypothetical increase in human caused fire starts:
a) 1 day a year there are extremely hazardous fire conditions.
b) 1 day in 10 years this coincides with a lightening strike. A fire starts.
result: a catastrophic fire erupts once a decade.
a) 1 day a year there are extremely hazardous fire conditions.
b) human activity starts a fire on the 9 days a lightning strike didnt.
result: a catastrophic fire erupts once a year.
More hypothetical:
d) as a result of global warming, there are now 2 days a year with severe fire potential
Result: given the second scenario above, there will now be 20 catastrophic fires per decade, instead of 10
Human activity has amplified the natural only variation by 10 fold
Dr Spencer’s His summary point 2 caught my attention immediately. He claims “[a]mple fuel and dry weather exists for devastating fires each year, even without excessive heat or drought, as illustrated by the record number of hectares burned (over 100 million) during 1974-75 when above-average precipitation and below-average temperatures existed.
Really? 100 million hectares sounds like a pretty large number. Can this be correct?
Australia’s land area is 770 million hectares. So Dr Spencer is suggesting that 13% of Australia’s landmass went up in flames in the 1974-75 bushfire season. So what do we know about the bushfire season in 1974?
Well, Dr Spencer kindly references his source as a Wikipedia article, Bushfires in Australia, that provides a table of major bushfires since 1851. Of course, this is not the total area affected by bushfires each year. It’s just the list of major fires. And some years aren’t mentioned at all. For example, 2012 is the most recent year missing from this dataset. As we go further back, more years are missing from the dataset. But given the purpose of the table is “Major bushfires in Australia”, this is reasonable.
I then looked at Figure 1, the graph that Dr Spencer produced from this Wikipedia dataset. “That’s strange”, I thought. The bar for 1975 is massive and requires that the scale of the chart be 0-120,000,000. This means that every other year looks like a blip by comparison with the bar for 1975. This type of visual outlier always suggests some careful consideration. Is something wrong here?
So, I added up the numbers provided by Wiki for 1974 bushfires.
Moolah-Corinya, NSW: 1,117,000 ha
Cobar, NSW: 1,500,000 ha
Balranald, NSW: 340,000 ha
NSW (season): 4,500,000 ha
NT (season): 4,500,000 ha
QLD (season): 750,000 ha
SA (season): 1,700,000 ha
WA (season): 2,900,000 ha
This adds up to 17,307,000 ha. Where did Dr Spencer get his >100,000,000 ha figure from?
How did he make this mistake? How did this error make it through his peer-review and article edit process? Was this an innocent mistake (e.g. mistyped a number) or was it deliberate (e.g. let’s hide a trend that doesn’t support my thesis)?
Why didn’t Dr Spencer notice and double-check this outlier datapoint in his chart? To say that the 1974 datapoint is obvious is like pointing out the nose on your face. Dr Spencer has no excuse publishing on his website an article that includes such an egregious error. Indeed, Dr Spencer is drawing an important conclusion from this figure for 1974 and calls it out specifically in his Summary Points.
Did he really think that his readers wouldn’t notice this problem with his chart? Did he really believe that his readers would not have a look at the Wikipedia article and not check a simple addition?
Beyond this calculation error, there are several other problems with this chart. Why does the chart start with 1920 when the Wiki table starts with the Black Thursday bushfires in 1851 particularly given that missing years in this dataset don’t seem to bother Dr Spencer? Why use this Wiki dataset at all? After all, it is a list of “major bushfires” not a dataset of the “total area burnt by bushfire each year in Australia since 1920”. Such a dataset would allow us to clearly see a trend if one existed. His chart title, “hectares burned by major bushfires in Australia since the 1919-20 season” is not incorrect, but his use of a bar chart as the visualisation tool is arguably misleading.
Steve
Thanks a lot for your excellent comment.
I confess that I had similar problems with Dr Spencer’s chart but was really too lazy to do the persistent research you did.
Steve
Oops?!
I was again at Wiki’s major bushfire list, and ask you where you got these numbers from:
SA (season): 1,700,000 ha
WA (season): 2,900,000 ha
when we see at Wiki for 1974-75, in the ha column
South Australia 17,000,000
Western Australia 29,000,000
I had problems with Roy Spencer’s chart for another reason, namely that his chart incorrectly mixes savanna and bush, as explained by Nick Stokes on his moyhu blog.
But what you write looks a bit strange, doesn’t it?
Or do we look at two different Wikis?
The problem gets worse. Have a look at this Reddit article.
https://www.reddit.com/r/australia/comments/ejuazd/so_i_was_looking_at_the_aust_bushfire_wiki/
And this web page.
https://knowledge.aidr.org.au/resources/bushfire-new-south-wales-1974/
Did Dr Spencer insert a figure from one source (117m ha) into the dataset from another source (17.3m ha) and not notice or care that this calls into question his conclusion in Summary Point 2?
This article has been used by an AU politician, Craig Kelly, MP in a discussion on climate change. Any guidance or comment about the 1974-75 bushfire figure will be appreciated.
https://www.facebook.com/CraigKellyMP/posts/1391555647705732
And one more issue with his data source that Dr Spencer should have picked up. The change history for the wiki article he quotes that the NT figure has been edited. At one point, the 1974 NT figure was 45m ha burnt. It has since changed to 4.5m ha. It appears that the 45m ha figure is sourced to the 2004 National Enquiry on Bushfire Mitigation and Management (Appendix D, page 339). This inquiry report was submitted to John Howard by COAG.
https://documents.uow.edu.au/…/documents/doc/uow098510.pdf
This is looking like a rabbit hole, and it’s beyond the extent of my interest to resolve it. Let’s leave it for now with the agreement that Dr Spencer owns the problem of where his data comes from and the reliability of his conclusions.
Sorry, I mucked up the url for the COAG report.
https://documents.uow.edu.au/content/groups/public/@web/@sci/@icbem/documents/doc/uow098510.pdf
Steve
Thanks again for subsequent info, but I still don’t know exactly what you mean.
I read the Appendix
https://documents.uow.edu.au/content/groups/public/@web/@sci/@icbem/documents/doc/uow098510.pdf
which is also contained in a whole document
https://www.dfes.wa.gov.au/publications/GeneralReports/FESA_Report-NationalInquiryonBushfireMitigationandManagement.pdf
linked to by another commenter.
The sum for the 74/75 ‘season’ is 56.8 Mha when we discard 45 Mha because Nick Stokes thinks it’s all savanna, and a bit over 100 Mha otherwise.
Anyway, it’s far over the bushfire sums in succeeding years.
Are you sure you didn’t misread the wiki? 4 states have lost a 0. NT, QLD, WA and SA. Our fire season generally starts at the end of the year and concludes early the following year. This is why a full season is displayed as 74/75 or 2019/20
Why haven’t we heard about the floodin in East Africa, that is a result of the Indian ocean dipole?
An Australian government primer on bushfires.
https://www.ga.gov.au/scientific-topics/community-safety/bushfire
The fire authorities estimate that 1% of the burned area was a result of fires that were deliberately or accisdentally lit by humans. The rest were caused by dry lightning.
There were a large number of arrests and warnings as a result of breaches of total fire bans, and some of these breaches resulted in minor fires, but most did not.
The thing about precipitation in Australia is that it has always been lumpy and has become more so. For example last year we had the situation in Queensland when there was major flooding in the middle of a drought. The flooding drowned cattle and destroyed fences over a vast area but did nothing to end the drought.
Averages of temperature and precipitation for a year over the whole continent do not give a true picture of what is going on.
Dr Spencer
The data you’ve provided is great, but there is a data source you may not have been aware of. The Council of Australian Governments
National Inquiry on Bushfire Mitigation and Management, 2004. (Ellis, Kanowski and Whelan, 2004)
https://www.dfes.wa.gov.au/publications/GeneralReports/FESA_Report-NationalInquiryonBushfireMitigationandManagement.pdf
The data confirms yours, but has data for many years that your chart is missing.
Dr Spencer writes: “So, to automatically blame the Australian bushfires on human-caused climate change is mostly alarmist nonsense, with virtually no basis in fact.” Quite right.
He further writes: “While reductions in prescribed burning have probably contributed to the irregular increase in the number of years with large bush fires …”
Those living on the ground here in Australia wouldn’t say “reductions” and “probably”. They would say ‘great reductions’ and ‘certainly’. There is powerful city-dwelling green governmental and bureaucratic enforcement of reductions in prescribed burning.
The AAO index is falling again, which means a threat to Australia.
https://www.cpc.ncep.noaa.gov/products/precip/CWlink/daily_ao_index/aao/aao.obs.gif
Except that major fires happened in 1939 burning through Victoria before the discovery of the hockey stick and modern industrialisation. How could this happen?
The Royal Commission in 1939 found poor management of National Parks was the major issue.
Clearly we have learned nothing in Australia.
Firstly, the date of DISCOVERY of the hockey stick is irrelevant. The question would be: At what point in the curve were we? Secondly, modern industrialisation was already well underway by then.
Next, you are using an implicit Straw Man. Nowhere is a claim made that major bushfires are ONLY made possible due to anthropogenic heating. The projection of AW is that they will increase in frequency and intensity, and the claim made this year is that they have been exacerbated by excessive amounts of fuel after prolonged drought. Clearly fire is subject to multiple causes, for instance the decline in native burning for agriculture after the European invasion and changes in management policy.
Fire is natural in several ecosystem types, and long used by native peoples to clear land, condition soil or to reduce fuel load and thus forestall larger spontaneous burns. The perennial “mistake” of science-deniers is to imply that because something has a natural cause, therefore no inferences can be drawn about its anthropogenic influences.
1:1 And he spake to them out of the burning Bush, and SPAKE thusificiously.
1:2 Are your ears painted on? I TOLD thee this would happen, Bruce.
1:3 And no, it wasn’t a hoax, you kangaroo-botherer.
Doctor Roy seems to have a point on this occasion. The first links I scare up with the search terms “scientific papers area burned” all refer to a recent REDUCTION in area burned. This first example attributes the change in the Abstract to “Agricultural expansion and intensification”, and finds a 24% reduction from 1996-2015, admittedly a shortish time over which to extract a trend. The short version: More land is being taken into cultivation so there is less fire-prone natural vegetation to burn.
“Fire is an essential Earth system process that alters ecosystem and atmospheric composition. Here we assessed long-term fire trends using multiple satellite data sets. We found that global burned area declined by 24.3 ± 8.8% over the past 18 years. The estimated decrease in burned area remained robust after adjusting for precipitation variability and was largest in savannas. Agricultural expansion and intensification were primary drivers of declining fire activity. Fewer and smaller fires reduced aerosol concentrations, modified vegetation structure, and increased the magnitude of the terrestrial carbon sink. Fire models were unable to reproduce the pattern and magnitude of observed declines, suggesting that they may overestimate fire emissions in future projections. Using economic and demographic variables, we developed a conceptual model for predicting fire in human-dominated landscapes.”
https://science.sciencemag.org/content/356/6345/1356
Snape:
After further review, I believe your assessment of eastern U.S. conditions is correct, but the situation in the western U.S. is very much different. I refer you to a U.S.F.S. report, rmrs_gtr149.pdf. It was published a while back, but the situation has only become more dire. Thanks.
@DR Healy
Most of the public forests in the western states are now 2nd or 3rd generation. 70,000 miles of logging roads in the state of Oregon alone:
https://oregonwild.org/forests/forest-protection-and-restoration/roads
Yes, a lot of these forests are overgrown and crowded, a fire danger, but that has little to do with conservation groups. The battles were over old growth. not 2nd growth. Look at a road atlas of Washington or Oregon, for example. The vast maze of logging roads represent wins for the timber industry.
Roadless areas (mainly in national parks or protected wilderness) represent wins for conservation. They are tiny in comparison. See the red areas in the map below:
https://www.researchgate.net/profile/Chris_Ringo/publication/324539620/figure/fig2/AS:[email protected]/Management-designations-and-ecological-map-zones-in-Oregon-and-Washington.png
And what is the policy regarding fires in areas protected by the 1973 Wilderness Act? They are to be suppressed only when necessary. This has kept the fuel load as close as possible to natural levels.
While fire managers may choose to suppress fire inside or outside of wilderness, it is also federal policy to use fire to protect, maintain, and enhance resources and, as nearly as possible, be allowed to function in its natural ecological role. (Federal Wildland Fire Management Policy). Often, wilderness, because of its remoteness from resources at risk, is the best place to achieve this goal. Also, wilderness ignitions are often in steep, rugged terrain and therefore are too dangerous for firefighters to attack directly. Suppression may not be the appropriate management response to a fire in wilderness.
https://www.wilderness.org/sites/default/files/media/file/Factsheet-Wilderness%20and%20Wildfire-A%20Brief%20Primer.pdf
*******
The forests outside of wilderness areas have been viewed as a commodity. The fires there have been suppressed, as quickly as possible, for a hundred years. This has resulted in the build up of fuel load we see today.
Sure, blame it on the greenies! (Sarc)
Test.
I think the posting problems here have something to do with the post content. That test went through but my reply won’t. It seems to be quite consistent and the only difference is the content. The three other fields were the same.
Sometimes I can paste the exact same content that got rejected when using Chrome into Edge and it will go through.
Interesting. That conflicts somewhat with the server-side fails that I sometimes get back. Sometimes the page loads without error but without my post, and sometimes I get one of a couple of different errors from the server. Might be more than one problem.
Doctor Roy, I’m beginning to think seriously about offering you a new blog. You’d need a server on which I can install Python Django, then I’d give you the code pro bono, if I can find the time. I have a working tech blog written in Django which already offers features comparable to this site from a course I did recently, so it should be fairly easy technically to polish it up. You can see a basic version with not much content here – I’ve been working offline to build a photo server based on the same example, so I haven’t done much with the blog since I put it up: http://elliottcb.pythonanywhere.com/
Let me know if this would be helpful.
Review of fire-AGW literature
https://sciencebrief.org/topics/climate-change-science/wildfires
“Climate change increases the risk of wildfires.
Human-induced climate change promotes the conditions on which wildfires depend, enhancing their likelihood and challenging suppression efforts. Human-induced warming has already led to a global increase in the frequency and severity of fire weather, increasing the risks of wildfire. This signal has emerged from natural variability in many regions, including the western US and Canada, southern Europe, Scandinavia and Amazonia. Human-induced warming is also increasing fire risks in other regions, including Siberia and Australia. Nonetheless, wildfire activity is determined by a range of other factors includ- ing land management and ignition sources, and on the global-scale most datasets indicate a reduction in burned area in recent years, chiefly due to clearing of natural land for agriculture.”
Greater tendency to burn, but less habitat left to burn. That makes sense, and explains that the reduction is no refutation of the projections based on AW. Very neat.
Nate
Maybe and maybe not.
https://www.forbes.com/sites/michaelshellenberger/2019/08/30/forget-the-hype-forest-fires-have-declined-25-since-2003-thanks-to-economic-growth/#65c46ce4163d
No disagreement with the review article.
In the USA the 4th National Climate Assessment shows a plot of wildfire acreage from 1983 (1.8 million acres) to 2017 (10.1 million acres). The trend is strongly upwards suggesting that correlation with rising CO2 concentrations.
Buried deep in the report is the fact that wildfire acreage peaked in the 1930s at 54 million acres.
Another “inconvenient Truth”?
Nasa article upon which Forbes article is based:
“Across Africa, fires collectively burned an area about half the size of the continental United States every year. In traditional savanna cultures, people often set fires to keep grazing lands productive and free of shrubs and trees. But as many of these communities have shifted to cultivating permanent fields and building more houses, roads, and villages, the use of fire has declined. As this economic development continues, the landscape becomes more fragmented and communities then enact legislation to control fires. This leads the burned area to decline even more.
By 2015, savanna fires in Africa had declined by 700,000 square kilometers (270,000 square miles)—an area the size of Texas. “When land use intensifies on savannas, fire is used less and less as a tool,” Andela said. “As soon as people invest in houses, crops, and livestock, they don’t want these fires close by anymore. The way of doing agriculture changes, the practices change, and fire disappears from the grassland landscape.”
A slightly different pattern occurs in tropical forests and other humid regions near the equator. Fire rarely occurs naturally in these forests; but as humans settle an area, they often use fire to clear land for cropland and pastures. As more people move into these areas and increase the investments in agriculture, they set fewer fires and the burned area declines again.’
Roy Spencer’s essay is a joke. He does not mention the record strong POSITIVE IOD that developed in Sept and Oct. TheIOD
-the INDIAN OCEAN DIPOLE– is THE primary driver of Australia weather patterns. .. anyone with any real forecasting skills and climate knowledge knows this ..10 seconds of Google search will show this to be the case.
The record warm +IOD which caused the Australia drought was caused by record warm sea surface temps in the Indian ocean.,
and what caused the record warm sea surface temps in the Indian ocean? … GW
wxdavid
So, a warmer globe, which drives more water vapor into the air, is causing the drought in Australia. Hmmm.
wxdavid
Now sure what 10 second Google search you did but you should spend a bit more time and get some better data.
Here is a better article for you to read. The first thing to note is they do not know what is producing the cycles of the IOD. It is currently being studied. Second they do not know how Climate Change affects this phenomena. So unless you know more than the people who study this, then you might want to refrain from posting and have a little more data to go with your post.
https://weather.com/en-IN/india/monsoon/news/2019-09-16-2019-to-be-one-of-strongest-iod-years-on-record-expert
Dr. Spencer,
I didn’t see this in article or comments, but what might the impact of large fires on local temperatures?
The outright heat release by the fires themselves is probably not significant, but the atmospheric effects from the smoke and haze seems like it could be – referring to an artificial or artificially augmented inversion layer.
@Gallopingcamel
[Buried deep in the report is the fact that wildfire acreage peaked in the 1930s at 54 million acres.|
Firefighters headed for a blaze, 1938:
https://foresthistory.org/wp-content/uploads/2017/03/FHS5897.jpg
1. Australia is not a ‘specific location’. It is a continent, with many different climate regions.
2. Any rainfall predictions for the continent as a whole are not very useful (especially Dr Spencer’s continent-wide rainfall trend chart!). Australia has a tropical north and northwest, where it has been getting wetter and expected to continue to get wetter into the future. There are temperate regions along the east/south east coast and in the south west (Perth) which have been getting drier and continue to get drier. These areas are also where most people live, and where bushfires have the biggest impact, and where the current bushfires are occurring and getting news coverage.
See BOM trendmaps here:
http://www.bom.gov.au/climate/change/index.shtml#tabs=Tracker&tracker=trend-maps&tQ=map%3Drain%26area%3Daus%26season%3D0112%26period%3D1970
3. “Australia” does not have a ‘dry season’. Rather, the tropical parts of northern Australia have a wet/dry season, but southern and coastal areas (where most Australians live and where current bushfires are impacting people) have more varied seasons. The ‘dry/wet season’ will show up in your continent-wide coarse analysis of bushfires though, since a lot of the bushfire area burned in really big years like 74/5 is in the northwest.
4. The 1974-5 bushfires were massive in scope because they predominantly occurred in WA and NT – these areas encompass large desert areas and also tropical areas, and these years were preceded by more rainfall than normal. These fires were grassfires in central and nw of the continent. A distinction can be made to huge swathes of desert grasses being burned in areas that are expected to get wetter, vs huge swathes of eucalypt forest burning in NSW, VIC, TAS, and SA, areas that are in drought and are expected to get hotter and drier with global warming.
Thanks. I couldn’t be bothered making these points, and they are useful to the discussion. In Australia, grassfire and bushfire overlap, but there is a clear distinction in the regions. Grassfire seasons are generally bigger after a few wet seasons produce grass in and near the deserts. Forest fires (bushfires) are generally bigger drought dries out the forest floors and even more with drying of the canopy. That’s what we’ve seen recently.
Sure, there is burnt grass, too. I’ve seen it in NSW and SA in the last 2 months. But these are predominantly bushfires, and in that context have burnt more area than previous bushfires.
Grassfires have burnt more area in the past, but fewer people and livestock live in those regions.
Nuance and distinction make opinion valuable, not the cookie cutter polemics you see in the press.
I mentioned this earlier, but the potential rate of evaporation from soil and trees can be measured using a pan of water. New South Wales has been getting warmer in spring and summer, but pan evaporation does not show much of a trend.
http://www.bom.gov.au/tmp/cc/evap.nsw.0911.6103.png
Sort of counterintuitive, but pan evaporation tends to INCREASE with drought, because less rainfall usually results in lower humidity.
In other words, what little rain does fall will likely evaporate faster than normal.
Even in Germany 1540 there was nearly no rain for 11 months.
In the 50s in Eastprussia(now Poland)my Mom cant go on the street because the asphalt was gummy,some creeks were empty so my uncle fished the fishes with his hands when he saw it,so he had enough to eat under the communists…
Think of a warming trend as getting a once-in-a-thousand-years event every 500. Or every 100. Or every 10.
So not enough to eat under a foreign occupation, then. Or shortly after a devastating war. He might have been hungry, but his world sounds much simpler than the real one.
It might interest you to know that GHG emissions actually dipped for a while after the fall of Communism. Part of this was surely due to the closure of highly polluting Communist industrial plant, as Communist industry was generally worse for the environment even than comparable Western industrial and agricultural activities. However, a 2019 “Nature” article states that the cause was a drop in eating meat due to the economic crisis. Soviet citizens had been consuming 27% MORE meat than Western Europeans, and four times the world average:
https://www.nature.com/articles/d41586-019-02024-6
Methinks Dr. Spencer should study more about Fire and Water or at least get in to reading all the stuff that fire experts have been saying, and the studies in to rainfall across the regions of Australia before making such blog entries. The blog is influential after all.
Point 1 – attribution is always difficult – that’s a given, but it does not take a lot to think that maybe record dry, record heat has something to do with fires and their intensity.
Point 2 – 1974/75 fires are just not comparable – they need a completely different study. Remoteness, etc. completely different circumstances.
Point 3 – High increase in Australian Temperature for 2019 is well within the scope of global warming theory because it allows for year to year variability.
Point 4 – using rainfall figures for the entire Australian continent as the only figures in long term trends is so wrong. It is a very fraught area of research but rainfall trends in Australia are very clear regionally.
Point 5 – fire experts tell us that hazard reduction (prescribed) burning had and would have had very little effect when the circumstances are so severe as they have been in Australia. Ignition sources could well be much greater but the effects after the igniting is the main thing when it is record dry and hot.
And this – https://www.newscientist.com/article/2229902-analysis-confirms-that-climate-change-is-making-wildfires-worse/ – this study does not disagree with the study Dr. Spencer cites but it does give greater context.
Geoffrey Preece
You: “Point 3 – High increase in Australian Temperature for 2019 is well within the scope of global warming theory because it allows for year to year variability.”
The high increase in temperature may have been caused by the lack of rain. First no rain, then no clouds and no evaporative cooling and you have much higher than normal temperature. Now about the drying of fuel (which I asked above). What would contribute more to the fuel drying? High temperature or lack of moisture. If it was dry but about the same summer temperature would the fuel dry about the same and still lead to the large fires? Would the drought be the biggest cause for the bad fires (especially if it had been above normal rain previous to the drought to build up fuel)?
Questions only not conclusions. Just something to think about.
A few years back, when Moscow had its record heat and fires it was very dry. The dry weather may be more responsible for the heat and fires than any global warming signal in the noise of weather patterns. These droughts seem to move around. So far there is not solid evidence that they are increasing.
Norman – I don’t have any definitive answers to your questions immediately but here is a CSIRO State of the Climate report 2018 for Australia that shows the regions in Australia for the last few decades. https://www.csiro.au/en/Research/OandA/Areas/Assessing-our-climate/State-of-the-Climate-2018/Australias-changing-climate – Drier, wetter, and the same, in different parts of the country. I, personally, have no idea if these patterns are caused by AGW. I do have a fair idea that if they are occurring naturally or because of AGW, the effects are exacerbated by clear warming trends, which are most likely enhanced by human impact.
We live about 12 km (7.45 mile) away from where a mega fire reached on the Central Coast of NSW, Australia. The day with the most worry was a record 44.3 C (111.74 f) and high winds. We have just had the driest October, November, December on record. Our creek stopped flowing for the first time that I can recall. I suspect this is a trend, and I can tell you it is not one that fills me with joy. One person, one place, one experience proves very little, but it seems to fit the trend.
Most of the big fire experiences in Australia seemed to be around late January/ February, the height of summer, up until this one. This was very early.
If almost every year at a very bad time a fire is started, either by lightning or human activity, then all else being equal a worsening fire trend could confidently be attributed to climate change.
If next year at a very bad time there are two fires started instead of just one, to what would you attribute the sudden doubling of acres burned?
It seems obvious that with regionality and confounding factors like changes in land use, no useful conclusions at all about climate trends can be derived from frequency or area of of burn taken in isolation. So Dr. Roy’s criticism of the media is prima facie reasonable.
However, it does not follow from this that a non-naive examination of frequency and area trends will not say something useful about a causal link to climate change. Quite a few fire experts seem to think that they are seeing a causal link. The question is whether they represent a consensus, and beyond that how justified any such conclusion is. I confess that I am by no means sure at this point.
That’s a reasonable comment.
The weight of opinion of fire authorities and researchers points to AGW exacerbating Australian bushfires. Being reasonable, and knowing my limitations, I tend to go with the weight of expert opinion, even if that is not always foolproof.
FYI
https://www.abc.net.au/news/2020-01-11/australias-fires-reveal-arson-not-a-major-cause/11855022
@Nate
Whether lightning, accident or arson, ignition source is still a key variable in wildfire, and often completely unrelated to climate change. The point being – all relevant variables need to be weighed before reaching a conclusion on attribution, not just temperature.
And experts are not immune to confirmation bias. The California drought was a good example:
[The researchers used historical climate data from U.S. government archives to investigate changes during California’s rainy season, from October to May.
They identified the specific North Pacific atmospheric patterns associated with the most extreme temperature and precipitation seasons between 1949 and 2015. The analysis revealed a significant increase in the occurrence of atmospheric patterns linked with certain precipitation and temperature extremes over the 67-year period.
In particular, the scientists found increases in atmospheric patterns resembling what has happened during the latter half of California’s ongoing multi-year drought.]
Now look at the longer term trend, 1895 – present: (remove the asterisk to view)
https://www.ncd*c.noaa.gov/cag/statewide/time-series/4/pcp/8/5/1895-2019?base_prd=true&begbaseyear=1901&endbaseyear=2000&trend=true&trend_base=10&begtrendyear=1895&endtrendyear=2019
OK. Also interesting to check the Palmer drought severity index there…
Why did you leave out the 1969 and 1970 fire seasons from that Wikipedia table? Those were significant as well. Take a look at how the chart changes when they are included.
https://i.imgur.com/zbTIMWh.png
Sorry, I misunderstood the study I quoted from. They were talking about an increase in extremes: longer droughts, wetter wet periods, which is consistent with AGW projections.
Who knows, this may be occurring in Australia.
FYI discussion of Murdoch media climate reporting in Australia. Note that it says they own 70% of newspaper circulation there.
https://www.cbsnews.com/news/james-murdoch-accuses-father-rupert-of-climate-change-denial-as-australia-burns/
@Nate
[Also interesting to check the Palmer drought severity index there]
Yes, and even without a decrease in precipitation, the PDSI for most months and areas in California has been trending downwards (drier).
barry
In your reply to Elliott Bignell above, you wrote:
“The weight of opinion of fire authorities and researchers points to AGW exacerbating Australian bushfires. Being reasonable, and knowing my limitations, I tend to go with the weight of expert opinion, even if that is not always foolproof.”
Despite the comparisons made elsewhere (please recall this comment below and those following)
http://www.drroyspencer.com/2020/01/weak-el-nino-conditions-help-explain-recent-global-warmth/#comment-423589
showing for New South Wales, Australian Capital Territory and Victoria, a general warming indeed, but few warmth differences between the bush fire years 2019, 2009 and 1939, I agree with you and him that warming must have some consequences.
*
Something else now concerning these bush fire intensities in 2019.
I recall having read somewhere that not only the Indian Ocean Dipole played a role during this year, but also a so-called Sudden Stratospheric Warming above the South Pole was supposed to do as well.
This was a good reason for me to have a look at UAH’s time series for the Lower Stratosphere:
https://tinyurl.com/y4ln5u9t
and indeed you see there for Sep 2019, in the SoPol/land/ocean columns:
13.66 15.50 12.78 C (yes: above the mean of 1981-2010)
That is quite quite a lot; bumps in either direction are not unusual:
https://drive.google.com/file/d/1I217oo_VCRyMbDn_0PxotIfmomHbi-t7/view
but the most recent one in 2019 is really big.
This motivated me to zoom into the South Pole, by looking at UAH’s 2.5 degree grid data you can find in the same directory:
https://www.nsstc.uah.edu/data/msu/v6.0/tls/tlsmonamg.2019_6.0
When sorting the list of grid cells to obtain the highest anomalies for September 2019, you see at top a bulk of cells with anomalies around 25 C above mean.
And… where, do you think, is the bulk’s center I found at 71.25S – 151.25E with a 25.74 C anomaly? Hmmmh:
https://tinyurl.com/vrwjvdl
I don’t know if this a proof for anything, but is it not amazing?
barry
Should this interest you, so please have a look at these three pictures I found in
https://www.severe-weather.eu/mcd/sudden-stratospheric-warming-antarctica/
showing the temperature anomalies at 10 mb for 3 days in September (03, 10, 16).
It would be perfect to have in parallel on the monitor 3 youtube sessions showing, with an accurate lag, the day-by-day data for the lower statosphere, the lower troposphere and the surface!
barry (ctnd)
I found this interesting graphi upon reading an article in the French newspaper ‘Le Monde’:
https://img.lemde.fr/2020/01/17/0/0/1667/1425/688/0/60/0/b7f1bd2_MQFCIpiWuaea4IE5DetiJZ_a.png
Speaks for itself; it would be interesting to have a similar graph for the other ‘great bush fire’ years.
I’m not sure what the last chart of Australia is showing. The legend near the bottom is too faint to make out (maybe a problem with my colour blindness – red/green). It’s not a map of the bush fires to date – the blobs are in the wrong places.
I’ve not read of a link to the SSW of September and the bush fires. Near the bottom of the article it says that these events can bring cold weather to NZ and Australia.
If your general point is that weather events had a strong impact on the recent fires, I completely agree. The IOD is perhaps the most clear. More locally, wind speed and direction strongly determines the course of bushfires. 2019 had record low rainfall for much of the regions razed (mixed results in longterm trends for those regions), and there were plenty of record high temperatures (in this case there is a clear upward trend in temps – I don’t trust raw data too much at local scale, even if it matches well with the adjusted data sets on a global scale).
The BoM recently rleased their climate report for 2019.
http://www.bom.gov.au/climate/current/annual/aus/
Choose print view for more details – near the top on the right.
There is some discussion there of FFDI etc, but a more detailed analysis of the fires and the conditions that gave rise to them are in a special report from last month.
http://www.bom.gov.au/climate/current/statements/scs72.pdf
I’ve been looking for a drought map or time series for Australia. An anomaly map would be the best. I’d like to know if and where drought conditions have increased (or not). There is some interesting comparison in the special report between the bushfires of 1968, which occurred in drought conditions similar to recently.
barry
Sorry I misunderstood the border between newspaper and graphic.
It concerns the bush and savanna fires in 1974.
barry
… and thanks for the BoM papers, I’m just reading scs72.
It’s hard to get a good fire map. The one in this article is from Jan 13, apparently, but satellites also pick up heat sources that aren’t bushfires. The map gives a fair overview, but is not precise, and the area of bushfire is a bit less than shown in it.
https://www.vox.com/science-and-health/2020/1/8/21055228/australia-fires-map-animals-koalas-wildlife-smoke-donate
If that is truly a daily map, then there is a lot of area not covered being shown that has been burnt through since last August. Total area burned to date is 18 million hectares, which is more than the area of Belgium, Denmark, Switzerland and the Netherlands combined.
18 million hectares = 44,478,968 acres
For comparison, worst fire year in the US, 1980 – 2018, was about 10,000,000 acres. This includes Alaska.
https://www.iii.org/fact-statistic/facts-statistics-wildfires
There is a MASSIVE climate engineering cover-up that NO-ONE has the balls to present the truth in mainstream media. Ignoring the white elephant of geoengineering, terraforming, use of 5G directed energy weapons EXPLAINS EVERYTHING. Research these before we incorrectly intellectualize ourselves into an artificial oblivion. The choice is yours, choose well.We don’t have much time left.
https://www.geoengineeringwatch.org/ and research Directed Energy Weapons.
Earth Warrior
https://www.geoengineeringwatch.org/the-contrail-lie/
And you really belong to those who believe in such a paranoid nonsense?
Pathetic.
My guess: ‘Earth Warrior’ is a nickname for… Dane Wigington.
Thanks a lot Sir, but we have already enough Antiscientists lurking around on this blog.
+1 : – )
I have read so many articles or reviews concerning the blogger lovers but this paragraph is truly a nice article, keep
it up.
Very good article! We will be linking to this
great content on our website. Keep up the good writing.
This is a topic that’s near to my heart… Many thanks!
Where are your contact details though?
Great post.
Good web site you have here.. It’s hard to find good quality writing like yours nowadays.
I truly appreciate people like you! Take care!!
The information that I have been searching. Glad i found it. Hopefully I’m able to use this for long term use. We talked earlier with my spouse how we may get it. Truthfully the put up was wonderful and really insightful. Can assist me and greater assistance so I am able to probably start out. I want to share this put up to my buddies. Really worth looking through. Genuinely thanks.
Hello these fake brokers take advantage of people who seem low risk and fragile. It sucks when all you wanted to do was to invest your money into something that secures a better future for yourself and your family only to get ripped off. I can recommend a solution to anyone whose in this situation and interested. [email protected]
There is clearly a bundle to know about this. I consider you made various good
points in features also.
Great information. Lucky mes I recently found your site by accident (stumbleupon).
I haves book-markeds it for later! https://trmedya-3.blogspot.com/
I think the admin of this website is actually
working hard in favor of his site, because here every
material is quality based data.
Hi there, yeah this paragraph is actually nice and I have learned
lot of things from it about blogging. thanks.
Hello, yup this paragraph is truly fastidious and I have learned lot of things from it concerning blogging.
thanks.
Way cool! Some extremely valid points! I appreciate you
penning this post and the rest of the site is also really good.
Thanks for the auspicious writeup. It in fact was a entertainment account
it. Look complex to more introduced agreeable from you!
By the way, how can we keep in touch?
Hi, all is going fine here and ofcourse every one is sharing
information, that’s genuinely excellent, keep up writing.
It’s the best time to make some plans for the future and it is time to be happy.
I’ve read this publish and if I may just I desire to recommend you few
attention-grabbing issues or advice. Perhaps you could
write subsequent articles regarding this article. I desire
to read even more issues about it!
Appreciating the dedication you put into your site and detailed
information you provide. It’s awesome to come across a blog every once in a while
that isn’t the same old rehashed information. Excellent read!
I’ve saved your site and I’m adding your RSS feeds to my Google account.
Hi there, I enjoy reading through your article post. I wanted
to write a little comment to support you.
Takipi Sat_n Alarak __ini Byt!
Instagram_da nas_l takipi kazanaca__n_z_ anlamaya ba_lamadan nce, en nemli ad_mlardan biri hesab_n_z_n tamamen optimize edilmesidir.
Markan_z_n Instagram biyografisini hesab_n_z_n aynas_ olarak d_nebilirsiniz.
Instagram takipi sat_n almak isteyen kullan_c_lar_,
ncelikle profillerinde ne kadar takipi istediklerine ynelik karar vermeleri gerekmektedir.
_nstagram hesaplar_n_zda gl bir etkiye
sahip olmak istiyorsan_z takipi say_n_z_ en kaliteli yaani Trk takipi sat_n al i_lemi yaparak belirli bir dzeye getirmelisiniz.
Trk takipiler tamamen organik olarak site zerinde sat__a
sunulmu_tur : https://cutt.ly/takipcintrcom
What’s up everyone, it’s my first pay a quick visit at this web page,
and article is genuinely fruitful in favor of me, keep
up posting these types of articles.
nstagram Takipi Sat_n Alarak Kitleniz Nas_l Byr?
Instagram takipi sat_n al gnmzde tercih edilen hesap bytme yollar_ndan biridir.
Ki_isel hesaplar_n yan_ s_ra pek ok i_letme hesab_n_n da yer ald___ uygulamada her hesap, takipi say_s_n_n ok olmas_n_ ister.
Takipi say_s_n_n yksek olmas_ ile farkl_ Instagram kullan_c_lar_nda gven olu_ur ve sayfa ziyareti ba_lar.
_nstagram takipi alarak profilinizi zengin gstererek en iyi ve kaliteli takipilere sahip olman_z yan_ s_ra ucuz fiyatlara
takip2018 den instagram takipi sat_n al
Trkiyen en kaliteli sitesinden iNSTAGRAM Takipi Sat_n Al 1000 takipi 2000 takipi
3000 takipi gibi hatta 100.000 instagram takipi ye kadar sat_n alabilirsiniz.
Ucuz ve kaliteli takipi sitesi.
Having read this I thought it was rather informative. I appreciate you taking the time and effort to put this short
article together. I once again find myself spending a lot of
time both reading and commenting. But so what, it was still worth it!
Instagram takipi sat_n alarak profilini byt, sat__lar_n_
ykselterek en iyi takipi paketlerine sahip olan siteyi kesinlikle sana tavsiye
diyoruz.
Takipi sat_n alma konusunda uzman kadrosu ile sizi bekleyen bu site ile ucuz ve
garantili gerek trk ki_ilere ula_abilirsin. HEmen instagram takipi sat_n al https://rebrand.ly/takipcintr
Thank you for any other informative web site. Where else may just I am getting that kind
of information written in such a perfect approach?
I’ve a project that I’m just now operating on, and I have been on the glance
out for such info.
KEND_N_Z_ DUYURMANIN EN KISA VE UYGUN YOLU INSTAGRAM
TAK_P_ SATIN ALMAK
Televizyon reklam_ misali ilerleyen takipi sat_n al hizmeti hesab_n poplerlik
kazanmas_ iin yap_l_r. Bteyi yormadan farkl_ alternatifler aras_nda istenilen hizmet tercih edilebilir.
Sat_n al_nan Instagram takipilerinin sa_lad___ avantajlar aras_nda
rekabet edilen sayfalar_n bir ad_m nne gemek yer al_r.
O hesaplar geride b_rak_ld___ gibi takipi say_s_na ba_l_ olarak
hesap dikkat ekece_inden organik ve gerek takipi kitlesi
elde edilir.
instagram takipi sATIN al
Instagram da Takipi Sat_n Alarak Ek Gelir Sa_layabilirsin!
_nstagram hesaplar_ hem de nemli birer gelir kap_s_d_r.
zellikle reklam gelirleri birolduka hesap sahibi iin ek gelir olu_turmaktad_r.
_ayet hesaplar_n_zda reklam alabilmek yahut Instagram zerinden bir_eyler satarak
para kazanmaksa
hedefiniz Trk gerek takipi paketlerini tercih etmelisiniz.
_ayet bot yada bota benzer instagram takipi sat_n al_rsan_z bunu gren hi bir m_teri
kitlesi size gvenmeyecektir.
Hatta _unuda sylemekte fayda varki sizi takip etmek dahi istemeyebilirler.
Bu sebepten sizleri kalitenin adresi olan takip201 e
davet
ediyoruz.
En iyi Instagram takipi sat_n al_nabilir site.
https://cutt.ly/instagramtakipcisatinal
lkenin en nde giden takipi sat__ sitesinden hemen takipi sat_n alarak fenomen ol
ve en iyi kaliteli takipilere sahip ol
takipi sat_n al Takipi SATIN AL
Hi there, its nice paragraph regarding media print, we all
be aware of media is a impressive source of data.
At this time it sounds like Movable Type is the preferred blogging
platform out there right now. (from what I’ve read) Is that what you’re using
on your blog?
Instagram takipi alarak profilinizi ykseltebilir, be_eni alarak diledi_iniz kadar be_eniye ula_abilirsiniz,
Bunlar_n hepsi sadece bir t_k uzakta sizi bekliyor.
https://bit.ly/takipcivebegeniblogu
Instagram takipi sat_n almaya karar verdiniz fakat
bir ok akl_n_zdaki sorulardan en zor olan_ da takipi alaca__n_z sitenin ucuz ve gvenilir olmas_d_r.
O halde size ssl sertifikal_ gvenilir deme yap_s_ ile takip2018 i neriyoruz
siteye giderek hemen takipi sat_n al
Takipi SATIN al
I every time spent my half an hour to read this web site’s content every day along with a cup of coffee.
When someone writes an article he/she keeps the thought of
a user in his/her mind that how a user can know it.
So that’s why this paragraph is perfect. Thanks!
Hi, I do believe this is an excellent website. I stumbledupon it ;
) I will revisit yet again since i have book-marked it.
Money and freedom is the best way to change, may you be rich
and continue to help others.
Ki_iler genelde cretsiz _ekilde takipi kasmaya
al___yorlar, yada be_eni, Siz hangisini isterseniz ikisinide bu
sitede bulunuyor!
Hemen takipi yada be_eni hilesi yaparak profilinizi zenginle_tir.
arkada_lar_n aras_nda fark_n_ hissettir.
https://rebrand.ly/takipci-hilesi-
I absolutely love your blog.. Great colors &
theme. Did you make this site yourself? Please reply back as I’m hoping to create my own personal website and would
love to find out where you got this from or just what the theme
is named. Kudos!
Awesome blog! Do you have any recommendations
for aspiring writers? I’m hoping to start my own site soon but
I’m a little lost on everything. Would you recommend starting with a free platform like
Wordpress or go for a paid option? There are so many options out there that I’m completely
confused .. Any recommendations? Thanks a lot!
Instagram da bedava takipi kasma i_lemi iin hemen takipcibegenihilesi
sitemize gelerek cretisiz bedavaya takipi kasabilirsin
Bo_una para deme yerine sadece be_eni veya
takipi kasabilirsin.
Site linktedir.
instagram takipi hilesi
Hurrah, that’s what I was searching for, what a material!
existing here at this web site, thanks admin of this web
page.
Howdy! Do you use Twitter? I’d like to follow
you if that would be ok. I’m definitely enjoying your blog and look forward to new updates.
Hi there, I discovered your site by the use of Google while searching for a related topic, your website came up, it seems good.
I’ve bookmarked it in my google bookmarks.
Hello there, simply became alert to your weblog through Google, and found that it’s
really informative. I’m going to be careful for brussels.
I will be grateful in case you continue this in future.
Numerous other people will likely be benefited out of your writing.
Cheers!
instagram Takipi Hilesi
Bir numaral_ sosyal medya yard_mc_n_z olarak sizlere gerekli
tm i_lemleri son derece kaliteli bir _ekilde sa_l_yoruz.
Popler olmak ve belirli bir kitleye hitap etmek ister misiniz, deste_imizle bu prosedrleri takip ederek
gne ayak uydurarak poplaritenizi kolayca art_rabilirsiniz.
Herkes Instagram hilelerinin gvenilmez oldu_una
dair bir alg_ya sahip ancak 2021 yaz_nda bu al__malar
art_k yksek gvenilirlik ve kalite ile yap_l_yor.
En gvenilri _ekilde hi cret demeden gnlk limitli _ekilde takiilerinizi
artt_rabilirsiniz
https://rebrand.ly/takipcibegenihilesi
I do not even know how I ended up here, but I thought this post was great.
I don’t know who you are but certainly you’re going to a famous blogger if you are not already 😉 Cheers!
I have been surfing on-line more than 3 hours these days,
but I never discovered any fascinating article like yours.
It’s lovely price enough for me. Personally, if all web owners and bloggers
made just right content material as you probably did, the net can be a lot more
helpful than ever before.
Whats up very cool site!! Guy .. Beautiful .. Wonderful ..
I will bookmark your blog and take the feeds also?
I am glad to seek out a lot of helpful information here within the submit, we need work
out extra techniques in this regard, thank you for sharing.
. . . . .
Undeniably believe that which you said. Your favorite reason appeared to
be on the net the easiest thing to be aware of.
I say to you, I definitely get irked while people think about worries
that they just don’t know about. You managed to
hit the nail upon the top as well as defined out the whole thing without having side-effects , people can take
a signal. Will likely be back to get more. Thanks
It is perfect time to make some plans for the longer term and it’s time
to be happy. I have read this put up and if I may I want to counsel you few attention-grabbing things or advice.
Maybe you can write next articles regarding this article.
I wish to read even more things about it!
Ucuz instagram takipi sat_n al
Bu paket ile sizlere o_unlu_u gerek ki_ilerden olu_mayan bot ile takipi gnderimi yap_lmaktad_r.
Bu tip takipi sat_n alman_z durumunda
sayfan_zda etkile_imde bulunma ihtimalleri yoktur.
Sadece say_ olarak yksek takipi gsterir
D_meyen Takipi Paketi
Bot ile gnderilen takipilerin say_s_nda k_sa sre ierisinde belirli bir miktar d__
olur. Bu d__ organik takipi sat_n al i_lemi yapman_z
halinde de olas_d_r. Sat_n ald___n_z takipi say_s_n_n d_mesini istemiyorsan_z bu paketi tercih etmelisiniz.
_nstagram Trk Takipi Sat_n Alabilirsiniz
Trke yay_n yap_yorsan_z Trk takipi sat_n al paketini tercih
edebilirsiniz. o_unlukla gerek ve bot karma kullan_c_lardan olu_maktad_r.
Bu pakete alternatif olarak gerek Trk takipi sat_n alma imkan_ da
sunulmaktad_r.
Organik Takipi Sat_n Al Ki Etkile_im Arts_n
Sosyal medya hesaplar_n_z_n tamamen gerek kullan_c_lardan olu_mas_n_, payla__mlar_n_z ile yorum ya da be_eni etkile_imlerinde bulunmas_n_ istiyorsan_z
tercih etmeniz gereken hizmettir. Organik takipi alarak
hem hesab_n_z_n takipi say_s_n_ artt_rabilir hem de
takipileriniz ile etkile_im kurma imkan_na kavu_ursunuz.
Organik takipi sat_n ald___n_zda zaman ierisinde bir k_s_m
takipinizi kaybedebilirsiniz. Bunun sebebi takipilerin gerek kullan_c_lar olmas_ ve zaman ierisinde sizi ya da sayfan_z_ takip etmek istememeleridir.
https://cutt.ly/takipcintrcoco
Super bro
Roy, you did a great job for this case. Did you publish this article on your Facebook page to more people be able to read it? With https://soclikes.com/ you can add followers to increase the auditory of readers.
Hello there! This post couldn’t be written any
better! Reading through this post reminds me of my previous roommate!
He always kept talking about this. I will send this post to him.
Fairly certain he’s going to have a great read.
Thank you for sharing!
hello!,I love your writing so a lot! share we keep in touch more about your post on AOL?
I require an expert in this house to solve my problem.
Maybe that’s you! Taking a look forward to see you.
Everyone loves it when folks get together and share views.
Great blog, stick with it!
Спортивное питание
Интенсивные тренировки, питание и освежение – три основных элемента любого спортсмена. Физические тренировки требуют кладезь энергии, будто известно, мы получаем энергию из пищи. Выше магазин питательных веществ поможет обеспечить устройство всем для роста мышечной массы, силы, похудания и регенерации тела. У каждого продукта есть подробное изображение и приказ сообразно применению. Интенсивные тренировки, питание и регенерация – три основных элемента любого спортсмена.
Спортивное питание
The words of peace want to make people live in peace, a site created in this sense. your site is very good thank you
Nice site!
Nice
With your knowledge you can create and lead instagram blog about weather and climate changes. From this site https://viplikes.net/ I advise you to get followers for your blog
пансионат для пожилых
В нашем пансионате «Добрые люди» пожилые чувствуют себя максимально комфортно и спокойно, ведь условия проживания приближены к домашним, но быть этом следовать ними круглосуточно присматривают сиделки и медсестры. Ради каждого постояльца проводится индивидуальная реабилитация, лежачим больным организуется частный уход, включающий кормление и гигиенические процедуры. Вы ввек можете приехать для бесплатную экскурсию и своими глазами увидеть условия проживания пожилых людей, познакомиться с персоналом и задать любые вопросы.
пансионат для пожилых
A site for women. You can definitely find what you are looking for in women’s clothing. If you are looking for a dress that suits you, you can visit this site. I can say that the products are very good or even excellent.
Bayan Giyim
We would like to see you on our site where the most up-to-date and best mobile applications are available. A place where you can easily download mobile games.
You aree sharing really good articles. thanks.
Yyou are sharing really good articles. thanks.
We all know what banks can do today. Although it is sometimes difficult to be aware of the loan packages issued by banks, this is now possible thanks to your site.
I will follow a very good article.
We all know what banks can do today. Although it is sometimes difficult to be aware of the loan packages issued by banks, this is now possible thanks to your site.
I will follow a very good article.
ЭВАКУАТОР
Одна з найнеприємніших ситуацій в дорозі: поломка автомобіля. Почасту це відбувається в невідповідний момент, десь в глушині, очень від майстерні. На початку водій марно намагається його перезапустити, потім намагається штовхнути і нарешті в господиніці розуміє, що доведеться замовляти евакуатор. Замість того щоб самостійно причинаізовувати трудомісткий процес транспортування в такої надзвичайної ситуації, краще довірити вирішення проблем фірмі, що здійснює технічне обслуговування і допомогу. Тому телефонний комната компанії, яка надає послуги з евакуації транспортного засобу потрібно в дорозі завжди мати під рукою дешево.
ЭВАКУАТОР
I will follow a very good article. Mykunden.
Were a Web Design Agency Bali with over a decade of experience in building user friendly, secure websites that help strengthen your business.
Nice post!
Great post!
Thank you for sharing your post! It is very interesting! I think you can publish it on instagram and get instagram likes for it from here https://viplikes.us
This page definitely has all the information I wanted concerning this subject and didn’t know who to ask.
Hii,
This is Great Post!!
Thanks for sharing with us!! this is Really useful for me.. Please Keep here some updates.
google maps yorum satın al hizmeti ile googledeki sıralamanızı yükseltin ve daha çok müşteri toplayın
Hi! This article is so great! Thank you for sharing this awesome information. I liked the way you presented your information. I enjoy reading this article which includes lots of helpful information its very interesting and amazing.
https://electricianstclair.com.au/
Good job, I would like to see more works like this.
Hii,
This is Great Post.. for me, Thanks for sharing with us!!
Buy Real Facebook Live Stream Views
Thank you very much for sharing this topic, which is very useful for me. I wish you continued success.
wonderful submit, very informative. I wonder why the opposite experts of this sector do not understand this.
You must continue your writing. I’m confident, you’ve a great
readers’ base already!
Thanks You Bro . Goods Blog
2022 İstanbul Üniversitesi (İÜ) taban puanları,İSTANBUL ÜNİVERSİTESİ (İÜ) Taban Puanları 2022 ve İSTANBUL ÜNİVERSİTESİ (İÜ) Başarı Sıralamaları 2022 açıklandı. istanbul üniversitesi taban puanları İstanbul Üniversitesi taban puanları,istanbul üni taban,istanbul üni taban puanları,istanbul üniversitesi taban puanları,İstanbul Üniversitesi Kontenjanları,istanbul üniversitesi,İstanbul Üniversitesi taban puanları verilerinin tamamı ÖSYM ve YÖK – YÖK ATLAS tarafından yayınlanmış olan en son güncel puanlardır.
I follow every article you share, it’s nice that you explain it so beautifully and practically, thank you for that.
Thank you for publishing such a beautiful and readable article, I love you very much and wish you continued success.
wow how did you manage to write such an incredible article? thank you so much for this i love you so much guys
Bu güzel bilgilendirmeler için teşekkür ederim.
Thank you for publishing such a beautiful and readable article, I love you very much and wish you continued success.
thanks for sharing your information with us , such a amazing information
Çok yararlı bir makale olmuş. Severek takip ediyorum. Teşekkür ederim.
En iyi WordPress temaları ucuztema.net’de