
 Home/Blog
Well, as I suspected (and warned everyone) in my blog post yesterday, a portion of my calculations were in error regarding how much CO2 is taken out of the atmosphere in the global carbon cycle models used for the RCP (Representative Concentration Pathway) scenarios. A few comments there said it was hard to believe such a discrepancy existed, and I said so myself.
The error occurred by using the wrong baseline number for the “excess” CO2 (atmospheric CO2 content above 295 ppm) that I divided by in the RCP scenarios.
Here is the corrected Fig. 1 from yesterday’s post. We see that during the overlap between Mauna Loa CO2 observations (through 2019) and the RCP scenarios (starting in 2000), the RCP scenarios do approximately match the observations for the fraction of atmospheric CO2 above 295 ppm.
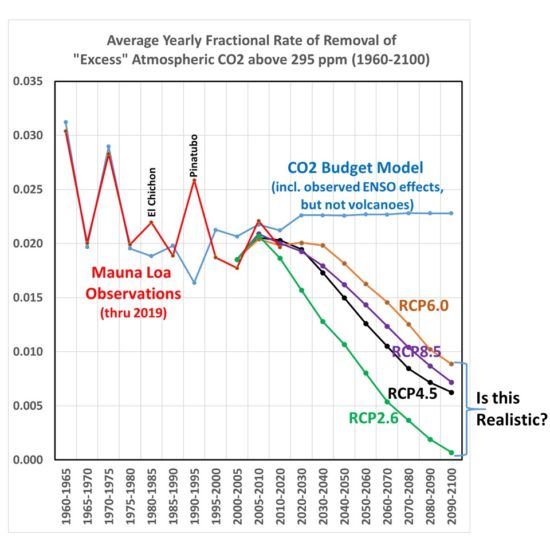
But now, the RCP scenarios have a reduced rate of removal in the coming decades during which that same factor-of-4 discrepancy with the Mauna Loa observation period gradually develops. More on that in a minute.
First, I should point out that the CO2 sink (removal rate) in terms of ppm/yr in three of the four RCP scenarios does indeed increase in absolute terms from (for example ) the 2000-2005 period to the 2040-2050 period: from 1.46 ppm/year during 2000-2005 to 2.68 ppm/yr (RCP4.5), 3.07 ppm/yr (RCP6.0), and 3.56 ppm/yr (RCP8.5). RCP2.6 is difficult to compare to because it involves not only a reduction of emissions, but actual negative CO2 emissions in the future from enhanced CO2 uptake programs. So, the RCP curves in Fig.1 should not be used to infer a reduced rate of CO2 uptake; it is only a reduced uptake relative to the atmospheric CO2 “overburden” relative to more pre-Industrial levels of CO2.
How Realistic are the Future RCP CO2 Removal Fractions?
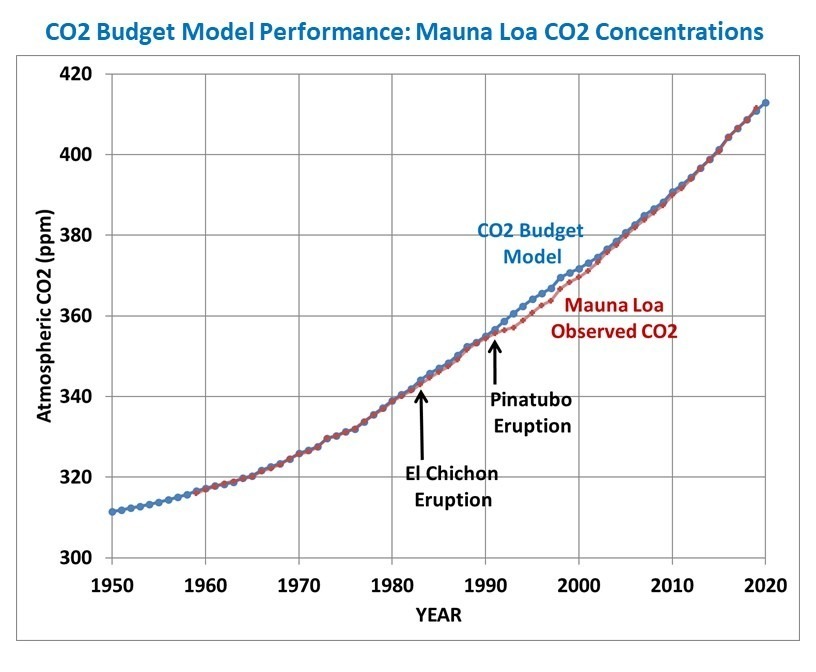
I have been emphasizing that the Mauna Loa data are extremely closely matched by a simple model (blue line in Fig. 1) that assumes CO2 is removed from the atmosphere at a constant rate of 2.3%/yr of the atmospheric excess over a baseline value of 295 ppm.
OK, now actually look at that figure I just linked to, because the fit is amazingly good. I’ll wait….
Now, if I reduce the model specified CO2 removal rate value from 2.3 to 2.0%/yr, I cannot match the Mauna Loa data. Yet the RCP scenarios insist that value will decrease markedly in the coming decades.
Who is correct? Will nature continue to remove 2.0-2.3%/yr of the CO2 excess above 295 ppm, or will that removal rate drop precipitously? If it stays fairly constant, then the future RCP scenarios are overestimating future atmospheric CO2 concentrations, and as a result climate models are predicting too much future warming.
Unfortunately, as far as I can tell, this situation can not be easily resolved. Since that removal fraction is MY metric (which seems physically reasonable to me), but is not how the carbon cycle models are built, it can be claimed that my model is too simple, and does not contain the physics necessary to address how CO2 sinks change in the future.
Which is true. All I can say is that there is no evidence from the past 60 years (1959-2019) of Mauna Loa data that the removal fraction is changing…yet.
There is no way for me to win that argument.


