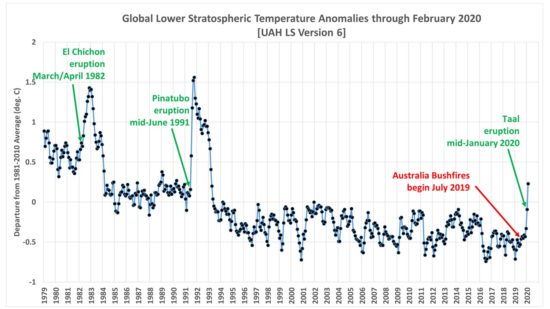
John Christy pointed out to me that our UAH lower stratosphere (“LS”) temperature product which has peak sensitivity at about 17 km (70 hPa pressure) has increased in the last 2 months to its warmest value since the post-Pinatubo period of warming (1991-93). This can be seen in the following plot of global average anomalies.

At first I though we might be seeing warming from the mid-January eruption of Taal volcano in the Philippines, but even the much more massive mid-June 1991 eruption of Pinatubo did not show up in the LS temperatures until the month following the eruption, while we see evidence of warming in Fig. 2 in the same month as the Taal eruption.
NASA had previously reported that the smoke from the Australian bushfires had been detected in January as as high as 20-25 km, well into the stratosphere (see here, here, and here). The measurements come from the CALIPSO spacecraft which has a lidar instrument capable of accurate altitude measurements of aerosols.
The mechanism for the warming of the lower stratosphere by the smoke is some combination of direct solar heating of the smoke particles, and infrared (“greenhouse”) warming of the smoke layer, the latter being the mechanism that caused the warming after the eruptions of El Chichon and Pinatubo. The aerosol layer is very cold, and it intercepts infrared radiation from below and so warms slightly.
I will try to examine the specific latitude band (30S-60S) being affected in more detail, including temperature measurements from higher up (which we do not produce official products for). The difficulty is that there is considerable natural variation in the tropical and extra-tropical temperatures in the stratosphere which have a see-saw behavior due to variations in the strength of the Brewer-Dobson circulation. As a result, these stratospheric aerosol effects on temperature tend to show up best in global or nearly-global averages (Fig. 2, above) where such circulation induced changes average out.

 Home/Blog


