
John Christy pointed out to me that our UAH lower stratosphere (“LS”) temperature product which has peak sensitivity at about 17 km (70 hPa pressure) has increased in the last 2 months to its warmest value since the post-Pinatubo period of warming (1991-93). This can be seen in the following plot of global average anomalies.

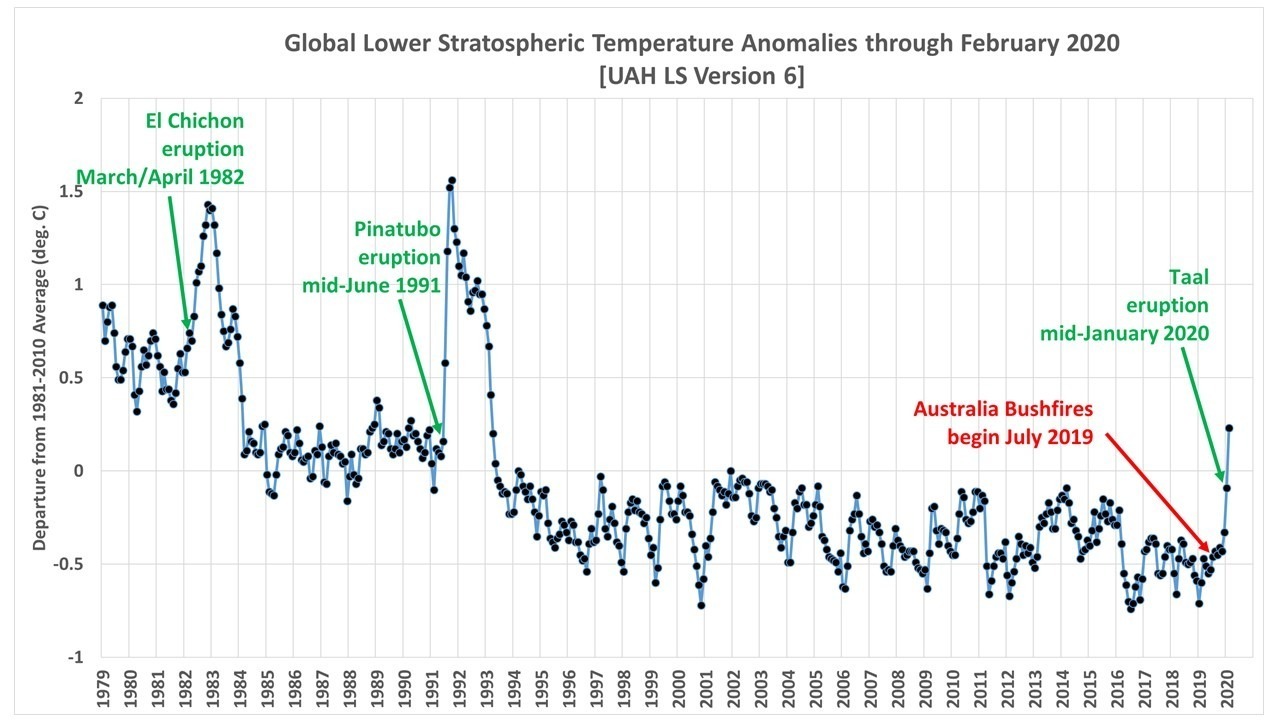
At first I though we might be seeing warming from the mid-January eruption of Taal volcano in the Philippines, but even the much more massive mid-June 1991 eruption of Pinatubo did not show up in the LS temperatures until the month following the eruption, while we see evidence of warming in Fig. 2 in the same month as the Taal eruption.
NASA had previously reported that the smoke from the Australian bushfires had been detected in January as as high as 20-25 km, well into the stratosphere (see here, here, and here). The measurements come from the CALIPSO spacecraft which has a lidar instrument capable of accurate altitude measurements of aerosols.
The mechanism for the warming of the lower stratosphere by the smoke is some combination of direct solar heating of the smoke particles, and infrared (“greenhouse”) warming of the smoke layer, the latter being the mechanism that caused the warming after the eruptions of El Chichon and Pinatubo. The aerosol layer is very cold, and it intercepts infrared radiation from below and so warms slightly.
I will try to examine the specific latitude band (30S-60S) being affected in more detail, including temperature measurements from higher up (which we do not produce official products for). The difficulty is that there is considerable natural variation in the tropical and extra-tropical temperatures in the stratosphere which have a see-saw behavior due to variations in the strength of the Brewer-Dobson circulation. As a result, these stratospheric aerosol effects on temperature tend to show up best in global or nearly-global averages (Fig. 2, above) where such circulation induced changes average out.
“The aerosol layer is very cold, and it intercepts infrared radiation from below and so warms slightly.” It also reflects and scatters incoming solar light during daytime. What is the overall effect?
And of course you will also look for a signal in your record for all large bush fires in the past anywhere in the world, including the US and in the Amazon.
I’ve now got pretty good evidence the smoke contributed to tropospheric warmth in February. Working on that now (including looking at other months) and will blog on it in the coming days.
Would agree Dr. Spencer. Taal eruption hit 16 – 17 km, and we have had many that high that haven’t affected the stratosphere like that. Persistent smoke reaching 20+km regularly would definitely be the culprit here.
Definitely??
Perhaps you would care to explain why the dominant signal this month is in the northern hemisphere when the fires were in Australia.
You DO understand that after an eruption, it takes almost a year for the particulate matter to blanket the earth and cause cooling, right? What evidence do you have which suggests that this is different with smoke?
Aerosol index maps show a large amount of bush fire smoke traveling around the S hemisphere from very late Dec 2019 until mid Feb 2020. If it was reaching 20 – 25 km, then it would cause a brief warming while it was being dispersed. There wasn’t another SSW event going on either, as far as I could see.
N Pol
1 – -2.45
2 – -6.08
N Lat
1 – 0.02
2 – -0.87
Tropics
1 – -0.36
2 – 0.62
S Lat
1 – 0.08
2 – 0.92
S Pol
1 – -0.12
2 – 0.54
NH
1 – -0.09
2 – -0.35
SH
1 – -0.08
2 – 0.81
Odd given fact that almost all of the increase came from warming in the NH. SH has barely warmed since November 2019.
In the context of an informative post on a specific atmospheric phenomenon, was it necessary to dumb down the conversation by referring to infrared “greenhouse” warming of the smoke layer?
Why continue promoting such an ill-fitted analogy especially when smoke is not a greenhouse component?
Because aerosols and smoke DO have a greenhouse component.
People smoke in their greenhouses? :>)
Amongst the crop they grew which they’re smoking.
Speaking of aerosol.
A swedish guy walks into a chemist shop and asks for deodorant. The chemist asks, ‘ball or aerosol?
The man answers, “Neither, I want it for my armpits”.
Not quite sure I understand. The amount of CO2 the brush fires have put into the atmosphere is equivalent to less than 0.1ppm. That made the temperature in stratusphere rise 1 degree?
Sorry stratosphere.
It’s not the CO2 from the brush fires that caused the stratosphere to warm. It’s the aerosols or other chemical compounds that caused this. Aerosols warm the stratosphere and typically cool the troposphere. The big problem we’re all trying to figure out is why did both the stratosphere and troposphere spike up in February?
My understanding is that there is no consensus as to whether smoke acts as a warming or a cooling agent,
Well, smoke has some carbon in it. So why not? You global warming alarmists all think carbon in the atmosphere will heat the planet up and melt the polar ice. Dr. Spencer is onto something here.
Midas
My (little layman) understanding is that if the lower stratosphere warms, then a cooling below till into lower troposphere and surface mostly can be expected:
https://drive.google.com/file/d/1OO6HpUOvk_N_tC2fUt8wzDDvMzhYM8C_/view
No further explanation needed I guess…
J.-P. D.
Aerosols have a cooling effect. That is recognized by Schneider and Rasool. Dr. Spencer, you used to have the cooling effects of of El Chichon and Pinatuba on you temperature graph.
Is Australian fire smoke considered a well mixed gas? All the warming is happening in the NH.
The aerosols from brush fires in Australia warm the entire planet 1 degree? BS.
Dr. Spencer,
I wonder if you have a comment on the “steps” in the temperature signal from your plot.
I have never given much value to the notion that the 1998 El Nino gave a “step up” in the LT data. I recall you even did a post on how a simple combination of Fourier modes can appear to resemble a “step”.
But I have to say the plot above does seem to show steps down after the two big eruptions, at leasts more convincingly than in the LT data. Is there a possible explanation?
Mort
Interesting. I would expect stratospheric warming to cause tropospheric cooling. Wouldn’t the most significant cause of stratospheric warming due to smoke be from blocking and absorbing incoming solar radiation and less from outgoing IR?
Dr. Spencer,
Stratosphere warming…yeah the smoke link seems reasonable.
Troposphere warming…I’d like to see more evidence. Can you run the numbers and see what effect the record smashing +AO events in February had on the troposphere especially in the NH? What about other factors?
If I well remember, a great part of these huge smokes travelled southeast over the Pacific, down to Chile, Argentina and Brazil.
Maybe it would be interesting to collect all UAH6.0 2.5 degree grid cells in this area, and to selectively compare LS and LT therein.
But, as Midas correctly wrote in
http://www.drroyspencer.com/2020/03/australia-bushfire-smoke-now-warming-the-lower-stratosphere/#comment-442263
it might be useless work to do that right now, as it might take some longer time for this stratospheric warming to reach lowest atmospheric levels.
But we see here (and especially in Indonesia and Brazil) how quickly humanity can influence the planet, possibly even endanger it.
Some will say: ‘So what?’. I don’t.
J.-P. D.
:how quickly humanity can influence the planet, possibly even endanger it.”
So you buy the story that those Australian fires were arsonists events?
Question. I just saw the temperature graph and table for February. If USA at plus .38 and northern hemisphere at .96, is it fair to assume that Eurasia was off the charts? All, why is the average of the areas’ averages so much lower than the global average?
Eurasia was indeed quite warm in February.
https://www.nsstc.uah.edu/climate/
martnitony,
NoExt land Jan = 0.69
NoExt land Feb = 1.17
NoExt ocean Jan = 0.50
NoExt ocean Feb = 0.92
This has the signature of ENSO forcing in February. The tropics are pretty warm. Check out February 2016…
NoExt land Jan 2016 = 0.79
NoExt land Feb 2016 = 1.52
NoExt land Mar 2016 = 1.28
NoExt ocean Jan 2016 = 0.56
NoExt ocean Feb 2016 = 1.02
NoExt ocean Mar 2016 = 0.6
It took until September 2018 to cool the mid NH ocean to the local bottom.
ocean 0.14
The land bottomed in November 2018 at -0.05 on a typical 2 month delay.
We are currently ENSO neutral and have been for quite some time.
https://www.cpc.ncep.noaa.gov/products/analysis_monitoring/enso_advisory/ensodisc.html
Jack Dale,
Officially, you are correct. While we use the ENSO 3.4 region to define an ENSO event, it does not take away from the fact that the tropics have reached warmer overall conditions only now, warmer than last year. UAH tropics ocean is 0.77 for February. A huge jump for the -0.11 recorded in January 2018. The low starting temperature shows us that we can return this region to below baseline still.
Here are the years where we had UAH tropics at 0.75 or higher:
FEB 2020
JAN-APRIL 2016
MAY 2010
FEB-MAR 2010
DEC 1997-MAY 1998
They are all periods during and following ENSO events just like now.
martinitony
” If USA at plus .38 and northern hemisphere at .96, is it fair to assume that Eurasia was off the charts? ”
Yes it is.
I wrote a few years ago a piece of software with different methods accessing the UAH grid data, and generated just now a time series for the zone I identify with Eurasia, a rectangle from 35N-10W till 80N-180E.
Anomalies wrt mean of 1981-2010:
…
2019 1 -0.04
2019 2 0.83
2019 3 0.67
2019 4 0.39
2019 5 0.22
2019 6 0.46
2019 7 0.14
2019 8 0.44
2019 9 0.40
2019 10 1.02
2019 11 0.46
2019 12 1.00
2020 1 1.16
2020 2 1.84
At the surface, Europe was incredibly warm during this (non)winter (it was, according to Copernicus, the warmest since measurement begin).
It seems that it has been warm above the Asian part of the continent too.
” All, why is the average of the areas averages so much lower than the global average? ”
Which areas did you average together?
J.-P. D.
Aerosols have a cooling effect. That is recognized by Schneider and Rasool. Spencer used to have the cooling effects of of El Chichon and Pinatuba on his temperature graph.
Jack Dale
Yes we can see that in both the LT and the LS layer graphs.
The LT is warming according to the UAH data, despite all the smoke aerosols from Australia nd volcanic eruptions.
Jack Dale
Now I understand better what you mean.
When having a look at UAH’s grid data for LT and LS, these smokes imho can’t have such a great influence after 6-8 weeks.
Neither local (I looked for the grid data in Dec, Jan and Feb within 30S-50S–140E-80W), let alone global.
The Taal eruption could by no means compete with El Chichon or Pinatubo; but maybe it is nevertheless the origin of the recent little LS peak. Who knows!
https://drive.google.com/file/d/1OO6HpUOvk_N_tC2fUt8wzDDvMzhYM8C_/view
SULPHATE aerosols have a cooling effect.
It is not known what the effect of smoke particles is.
I don’t understand the step down in the ‘normal’ temperature pre/post El Chichon and pre/post Pinatubo. Shouldn’t the temperature go back up once the aerosol effect is ended?
Not if there is a longer term trend beneath the spikes.
The REASON that smoke from fires raises temperatures (rather than cooling the surface by shading the Earth) is that it raises the level of the weighted mean radiating altitude. From that anchoring point the temperature rises due to the Loschmidt gravito-thermal effect known about by physicists since 1876, but continually ignored or disbelieved by climatologists because they THINK it violates the Second Law of Thermodynamics whereas in fact it is a direct consequence of maximum entropy production.
“raises the weighted mean radiating altitude” is not a “REASON”. It is an alternative wording for reduced OLR. The reason is in the processes that generate the OLR.
There is no known general principle of “maximum entropy production” for non-equilibrium processes such as the climate process.
The Second Law of Thermodynamics is about two thermodynamic equilibrium states that are linked by a process, not about non-equilibrium processes as such.
You Christopher Game, very clearly demonstrate being brainwashed by the false physics of climatology. My very next comment has you tied in knots. Try explaining Venus surface temperatures with radiation calculations and those knots get even bigger.
The Second Law of Thermodynamics is about entropy increasing in a (singular) natural thermodynamic process. This tendency is evident in all such natural processes and it relates to a single system or a combination of interacting systems, but not to a combination of independent systems. At least Wikipedia got that right: “In a natural thermodynamic process, the sum of the entropies of the interacting thermodynamic systems increases” at https://en.wikipedia.org/wiki/Laws_of_thermodynamics.
If you think the Second Law of Thermodynamics does not operate in the troposphere, or that it only applies between two states of equilibrium, you are sadly mistaken.
For example, it is quite apparent that the density gradient in the troposphere tends to restore itself to a certain state of thermodynamic equilibrium (ie maximum entropy) and so its tendency to form is a direct consequence of the Second Law of Thermodynamics operating in a gravitational field.
So too does the (non-zero) temperature gradient form at the molecular level in a gravitational field as a direct consequence of the Second Law of Thermodynamics. That’s what you and climatologists fail to understand and that is why you all get it so wrong by guessing that backradiation must be what is tripling the warming effect of the Sun’s direct radiation reaching the surface.
Dear Anonymous-Academic, I am happy that your comment disagrees with mine.
It is very clear from all the climatology energy diagrams showing back radiation that climatologists (and thus all the computer models) assume that the surface is warmer than the direct solar radiation could make it because of the back radiation supposedly causing about twice as much heat into the surface (324W/m^2) as the solar radiation (168W/m^2) supplies.
You all need to face the FACT that climatologists QUANTIFY the surface temperature by adding together the fluxes from the Sun and the atmosphere, then deducting the cooling flux by evaporation and conduction-cum-convection out of the surface, and then using the net total of about 390W/m^2 in Stefan Boltzmann calculations that then give 288K for a uniform flux day and night all over the globe (LOL). The fact that it is variable would give a mean temperature at least 10 degrees cooler – like about 5C.
This is totally wrong. Nothing in established physics says you can add fluxes like that and get correct results in Stefan-Boltzmann calculations. Nothing in established physics says the solar radiation can make the surface hotter than the black body temperature for the mean flux. There is no experiment that confirms radiation can be added this way – nothing anywhere! A simple experiment comparing the warming effect of a single artificial source of radiation and the warming by multiple such sources PROVES that this addition of radiative fluxes does NOT give correct results in Stefan-Boltzmann calculations, yet the WHOLE radiative forcing climate change conjecture is BASED on that FALSE assumption.
And THAT is the reason Roy’s graphs show no warming since the peak in the 60-year cycle back in 1998 and will not show future warming until after 2028. There may be more then, but the long term cycle of about 1,000 years should turn to cooling perhaps before any more than another half degree of warming after 2028.
So Academic Guy, is CO2 a factor in trop warming or not? Is the human-caused portion of CO2 a significant factor?
Rob,
they way I understand Guy, the answer is NO.
I actually agree with Guy on his assessment of Venus.
It even explains why there is hardly any temperature difference towards the poles and unlit side of Venus.
Anonymous-Academic
I don’t participate in this energy balance discussion because I don’t know enough about its real theory.
You write here lots of things without presenting any academic paper; a proof for me that you might not know as much as you pretend.
People like you publish such stuff endless at dozens of ‘skeptic’ sites, and, like you, never hint on valuable research confirming their claims.
I’m no more than a humble, retired engineer.
But what I can do, Anonymous, is to process and evaluate available data.
And I need no more than a look at Roy Spencer’s UAH6.0 LT data in a spreadsheet calculator to see that since the peak of 1998, the linear estimate for the Globe is
0.16 +- 0.17 C / decade
to be compared with the estimate since 1979:
0.13 +- 0.01 C / decade.
Even if I would be, like most ‘skeptic’s, dumb enough to include the peak year 1998, therefore starting the trend period with a very high value automatically leading to low estimates, the estimate in this case still is
0.11 +- 0.18 C / decade
Thus, Anonymous: you know the academic rule:
“Put up, or shut up.”
Rgds
J.-P. Dehottay
AA,
If I got a dollar every time someone came on here with a new ‘how to prove all of climate-science wrong with this one simple trick’ post, I’d be rich.
Here we go again.
“This is totally wrong. Nothing in established physics says you can add fluxes like that and get correct results in Stefan-Boltzmann calculations. Nothing in established physics says the solar radiation can make the surface hotter than the black body temperature for the mean flux. There is no experiment that confirms radiation can be added this way nothing anywhere!”
What rot.
Problem is that you are not just saying that climatologists got it wrong. You are also saying that meteorologists and atmospheric physicists have gotten it wrong all these years. And yet, somehow they’ve gotten everything else about atmospheric science essentially right, not the least of which is numerical weather prediction.
It is simply an observable fact that solar radiation has made “the surface hotter than the black body temperature for the mean flux.”
Sorry, fluxes do add like that. Unclear what specifically you object to.
“fluxes do add like that”
Now Nate, you wrong, dead wrong on this.
To make the case for you, take two copper pennies, oxidised, Emissivity of 0.78 both at a temperature of 75 Fahrenheit.
They both emit about 344 W/m2.
You think, that both pennies increase their temperature to 176 Fahrenheit, which is the sum of the two radiation streams of 344 W/m2 calculated as temperature?
Everybody can make that test. And the answer is both pennies do not change the temperature.
This means you are wrong and Guy is right!
Dr. Spencer
My amateur understanding is that yes, smoke absorbs visible light from the sun, but is mostly transparent to LWIR.
Seems like the result should be the exact opposite of a GHE… blocks solar while allowing free passage of upwelling energy:
[thermal cameras can detect heat through smoke, and are widely used by firefighters for this purpose. Soot particles in smoke effectively block visible light, but allow infrared radiation to pass through, letting firefighters or other first responders navigate through smoke-filled environments.]
https://www.flir.com/discover/cores-components/can-thermal-imaging-see-through-walls/
This reminds me the old days when people still thought CO2 was causing warming
People still do. Monkeys do not.
Monkeys obviously smarter than people like you.
The monkey called me a person – apparently he thinks it’s an insult.
So you talk to monkeys, do you? What about dead people? Are you really stupid, or just pretending?
The monkey thinks I am talking to it, and wants a conversation.
But judging by it’s comments, it is the proverbial monkey at a typewriter.
Learn to ignore the name calling trolling tards
In January and February 2020 ionizing radiation in the lower stratosphere was maximum in this solar ycle.
https://pics.tinypic.pl/i/00999/h5c1fa50sk8l.gif
https://cosmicrays.oulu.fi/webform/monitor.gif
The increase in temperature in the lower stratosphere results from the increase in ionization in these layers during very low solar activity (solar minimum).
The highest rate of carbon-14 production takes place at altitudes of 9 to 15 km (30,000 to 49,000 ft) and at high geomagnetic latitudes.
https://en.wikipedia.org/wiki/Carbon-14
Vertical soundings of the atmospheric ion production rate have been obtained from Geiger counters integrated with conventional meteorological radiosondes. In launches made from Reading (UK) during 20132014, the RegenerPfotzer ionisation maximum was at an altitude equivalent to a pressure of (63.12.4) hPa, or, expressed in terms of the local air density, (0.1010.005) kg m−3.
https://www.sciencedirect.com/science/article/pii/S1364682614001850
Seriously – given the failure of your definitive predictions about La Nina and the AO, you really should cease making definitive statements.
Midas,
Have you looked at my chart showing the ~3.6 year cycle in the ocean tropics yet? The La Nina down beat is still coming. It shows up approximately 3.6 years after the solar minimum starts. This is not exact. As I mentioned to you before, each solar cycle is unique, and the 3 3.6 waves conform to it… sometimes extending or amplifying due to higher time frame forcers.
https://www.facebook.com/100000276969216/posts/2979081735444363/?d=n
When you release your paper, peer-reviewed by appropriate scientists, I’ll take a look at it.
Midas,
Seriously? That is your criteria? So why are any of us here? Should our comments be peer-reviewed and certified by the fact checkers for accuracy before the post is allowed?
Here is a better idea. How about you look at the chart with an unbiased and open mind yourself and we talk about it like 2 civilized science minded citizens trying to get to the bottom of what drives the climate.
An increase in temperature in the lower stratosphere can cause an increase in water vapor in the stratosphere, which explains such a rapid increase in temperature in the upper troposphere and the lower stratosphere.
https://www.nsstc.uah.edu/climate/
Abstract
The molar mass of water vapor is much less than that of dry air. This makes a moist parcel lighter than a dry parcel of the same temperature and pressure. This effect is referred to as the vapor buoyancy effect and has often been overlooked in climate studies.
https://journals.ametsoc.org/doi/full/10.1175/JCLI-D-19-0260.1
Particulate Matter < 1 µm
mass of atmospheric particles with a diameter less than 1 micron
on 2020/02/15/1600Z
Sorry.
https://earth.nullschool.net/#2020/02/15/1600Z/particulates/surface/level/overlay=pm1/equirectangular=-345.00,0.00,248
Currently, the average temperature above the 60th parallel in the lower stratosphere is very low (strong polar vortex in the north).
https://www.cpc.ncep.noaa.gov/products/stratosphere/strat-trop/gif_files/time_pres_TEMP_ANOM_JFM_NH_2020.png
The strength of the polar vortex in the northern hemisphere is shown by anomalies of the geopotential height above the polar circle.
https://www.cpc.ncep.noaa.gov/products/stratosphere/strat-trop/gif_files/time_pres_HGT_ANOM_JFM_NH_2020.png
I’m doubtful about Australian bushfires having much short-term effect in the Northern Hemisphere. I’m inclined to think this is more of an effect of weather patterns, zonal vs meridional flow. Recently we have an unusual prevalence of zonal flow of the mid-latitude jet stream with the arctic jet very disorganized. This will interfere with heat rejection to space and cause regional warming. For example, Siberia/Mongolia has been very warm. They usually see the arctic jet looping southward giving very cold winter temperatures. If this phenomena is now temporarily removed, the seasonal temperature anomalies will of course be very warm. I think this situation may normalize at any time. It’s only weather.
Currently, the polar vortex in the lower stratosphere is very strong and hence the zonal circulation in the northern hemisphere. This is the entrance to La Nia, and may indicate an active hurricane season in the Atlantic.
https://earth.nullschool.net/#2020/03/06/1200Z/wind/isobaric/70hPa/orthographic=-312.53,92.34,390
https://www.cpc.ncep.noaa.gov/products/stratosphere/strat-trop/gif_files/time_pres_UGRD_ANOM_JFM_NH_2020.png
Earth is waiting for the beginning of the 25th solar cycle.
Hey everybody, what is going on in the Arctic? Big temperature drop going on now north of 80N. I have no clue what ren talks about. But whatever it is, he just might be on to something.
What was “going on” in the Arctic in:
Jan 2019
Mar 2018
Jul 2017
Aug/Nov/Dec 2015
Jun/Sep 2014
Feb/Mar/Apr/May 2013
Mar/Aug 2012
Feb/Nov/Dec 2011
Mar/May/Jun/Jul/Aug 2009
.
.
.
Why do you believe that a month or two (or three or four) of lower Arctic temperatures is anything more than regularly occurring natural variation that has nothing to do with the background climate?
I am not trying to make some sort of profound statement on climate Midas. I just noticed the DMI data is currently indicating a rapid drop in 80+ deg. North temperatures. ren is posting a bunch of stuff I don’t understand too well. But whatever it is, ren must be onto something for the time being.
And this happens to go along with the above average ice growth in the Arctic for February 2020. The daily average ice growth in February is 20,200 km^2. for February 2020, the daily average ice growth was 22,100 km^2.
Let me get this right … if I want to explain the cause of something, all I have to do is make up a theory that is beyond your understanding, and you will believe it without question?
Well, that isn’t as bad as believing that the almighty CO2 molecule is the primary driver of our climate! I like Jeremy Corbyn’s big brother Piers assessment – complete delusional nonsense!
You’ve basically admitted that your scientific knowledge is not strong enough to challenge that fact.
Hey Rob, zonal flow means that arctic air stays bottled up and gets colder. At some point that will revert and we’ll get those meridional blasts of cold air again. Maybe next year. The Maunder Minimum was not cold all of the time. There were warm years, and cold ones. The cold ones produced the problems for a populace unprepared for them. This time we’ll do better.
During my 63 years, I’ve noticed that the Arctic blasts of the 60s, 70s, and early 80s have certainly let up in recent years (decades). It is very difficult for me to believe the almighty CO2 molecule is the reason for that.
Multi-decadal warming spells have occurred in the past have they not?
Yes. My thinking is that the atmospheric rivers are multi-modal. Like turbulent vs laminar flow, under certain conditions they can jump from one state to another. The sun can influence this, nudge it from favoring one state or another, but does not control it. The focus on CO2 has distracted us from hunting the major players.
Can you theory explain the timing and magnitude of the global mean temperature trend? Can it explain the timing and magnitude of the ocean heat content trend? Can it explain polar amplification? Can it explain the cooling stratosphere? Can it explain the diurnal temperature range decrease? Can it explain where all of the energy accumulated by CO2’s radiative force went if not into the geosphere? And most important…can it explain all of the evidence we’ve accumulated any better than the consensus theory? If so please present it for review.
Latitudinal circulation will bring more rain in mid-latitudes. The surface temperature will drop in summer.
There you are using “will” again.
Just like your prediction that the US winter WILL be bitterly cold.
How did that one turn out for you?
(I’ll wait for your inevitable reference to a single cold snap which you will claim is representative of the entire winter.)
Polar vortex is strong and the temperature above the polar circle very low.
https://www.cpc.ncep.noaa.gov/products/stratosphere/strat-trop/gif_files/time_pres_TEMP_MEAN_JFM_NH_2020.png
Rob Mitchell
” Big temperature drop going on now north of 80N. ”
*
Here is the end of the temperature anomaly time series generated out of the UAH 2.5 degree grid for 80N+:
2019 1 0,10
2019 2 0.48
2019 3 0.13
2019 4 1.50
2019 5 1.96
2019 6 1.44
2019 7 0.85
2019 8 0.63
2019 9 1.59
2019 10 2.02
2019 11 0.37
2019 12 1.22
2020 1 -0.16
2020 2 0.20
It’s indeed cooling a bit, but I don’t see a drop: I rather see that in 2019, it was much too warm there. And in the 3 previous years, lots of months were too warm as well.
Look at the graph, it tells us enough:
https://drive.google.com/file/d/1YAwpgWfzkxLhO6lpRcfDQhPvyRqeJR0w/view
Here is the top 20 of the yearly averages:
2016 1.500
2018 0.750
2017 0.667
2012 0.667
2010 0.667
2019 0.583
2011 0.583
2005 0.500
2014 0.417
2009 0.417
2006 0.417
1999 0.417
2007 0.333
2002 0.333
2015 0.250
2013 0.250
2001 0.250
1998 0.250
2008 0.167
2004 0.167
I would await one or two years before telling it’s cools there.
P.S. 18 of the top20 are years after 1999… Interesting.
2003 and 2000 are just below 2004.
And I won’t show you the chart for the average of the few surface stations above 80N, you wouldn’t believe me.
*
The Arctic sea ice extent is this year pretty good. But it was in 2012 as well till end of May, and then…
https://drive.google.com/file/d/19I6WWxw-xavC0H7K7tS_Ocef8BE2gzcs/view
Rgds
J.-P. D.
Bindidon, I worked in Alaska during the summers of 2007, 2008, 2010, 2012, and 2015. I was forecasting weather and sea states for marine vessels transiting the Bering Strait and the Barrow passage. I worked with a sea ice analyst to help tug boat captains circumnavigate their way around chunks of sea ice. What I remember most about 2012 was that it was a particularly stormy summer, and it shattered the sea ice in thousands of pieces across the Beaufort and Chukchi Seas. It was a rather difficult year. Because the sea ice extent measures 15% area coverage in a grid or higher, I think a lot of the ice got missed. In 2007, the Beaufort Sea was essentially sea ice free. The sea ice analyst told me he had never seen anything like it that year. But in 2012, there were lots of ice chunks scattered across the Arctic seas. In 2015, the summer was much more tranquil than 2012, and there was more ice to count since it was more consolidated.
Rob Mitchell
” But in 2012, there were lots of ice chunks scattered across the Arctic seas. ”
I respect that you were ‘in situ’ for such a long time there.
But please accept in turn
– that you were at a few places among thousands in Alaska, and how much is Alaska compared with the whole Arctic region? 10-15 % ?
– and that I therefore prefer to trust in satellite readings.
Moreover, it is nice always to speak about ice melting becoming less since a few years, but this is half the story. You must consider the ice rebuild period as well for each year. And 2012 for example had one of the strongest in the last decade.
Thus, the best still is to have a look at the sum of both, i.e. the yearly averages.
This is the yearly average of Arctic sea ice extent provided by NSID-C via U Colorado:
2008 10.99
2009 10.96
2013 10.92
2014 10.81
2010 10.73
2015 10.59
2011 10.51
2007 10.50
2012 10.42
2017 10.40
2018 10.35
2019 10.21
2016 10.16
You see that it will take some time for Arctic sea ice coming back.
This is my personal hope, as ice sheet and sea ice melting in northwestern Atlantic regions means for me more atmospheric perturbation, more precipitation, more westerly winds.
We have been feeling here for years as if we were at the sea (250 km away) .
Rgds
J.-P. D.
Addendum to NSID-C / U Colorado data
Arctic sea ice extent, Mkm2(descending sorts)
1. Ice rebuild level in March since 2007
2012 15.20
2008 15.18
2010 15.14
2013 15.03
2009 14.98
2014 14.76
2019 14.55
2011 14.55
2007 14.54
2016 14.40
2015 14.37
2018 14.30
2017 14.27
2. Ice melting in September
2009 5.26
2014 5.22
2013 5.21
2010 4.87
2017 4.80
2018 4.71
2008 4.69
2015 4.62
2011 4.56
2016 4.51
2019 4.32
2007 4.27
2012 3.57
“Cooling” is the new “Warming”
https://bit.ly/2xeBbKZ
https://bit.ly/3cCh75G
https://bit.ly/2vJBPjh
Eben
Even if you do warm the earth with CO2, water vapor will still be dominant. As the slightly higher equilibrium is reached and the water vapor turns to clouds, what was once a GHG is now reflecting radiation back into space! The extra energy put into the system will make it crash that much harder when the atmosphere goes into it’s 20 year cooling trend and drops it’s moisture that would be greater than it would have otherwise been.
There will be no 20 year cooling trend.
https://climate.nasa.gov/blog/2953/there-is-no-impending-mini-ice-age/
Nice page , just look how much higher the last 6 cycles are compare to the first six , the warming is perfectly correlating to the cumulative effect of it , there must a lot of blind people at NASA
Eben in fact the last 7 solar cycles are the strongest of the last 400 years. Even the last one. Of course the earth has continued to warm from that.
The Earth warms and has a positive energy imbalance because of declining solar irradiance?
Just to satisfy my own curiosity…what does the Sun have to do to result in a negative energy imbalance and cause cooling?
BTW…speaking of the Sun…did you guys see that the Zharkova 2019 paper get formally retracted?
“One of tricks of climate shysters is to mach up data in one chart on a different relative scale, that way any small mismatch will ‘appear’ a lot bigger.”
The more ignorant and the more incompetent some people are, the more they discredit, denigrate, insult and lie.
Jack Dale’s link shows to pertinent data, made without any manipulation.
It is evident that, when you want to produce a graph of plots of time series whose value ranges differ by a lot, you need to scale these time series until they approximately fit.
Typical examples are total solar irradiance (TSI) and Sun Spot Numbers (SSN) when compared with temperature series.
I have SSN at hand. Here is a chart comparing SSN with the global temperature series Had-CRUT, showing the SSN relative to its mean value in order to get it fitting in size and format to the anomaly-based Had-CRUT series:
https://drive.google.com/file/d/1d70-k06I_jfziFHvLLraXl-mhUvJbUAB/view
It is pretty good visible that the plots shown in
https://climate.nasa.gov/internal_resources/1993/
are absolutely correct. I just would need to displace the plots in the chart and to give him the same width/height ratio to make it perfectly similar.
J.-P. D.
bdgwx,
The earth does not instantly respond to changes in energy input. Say you are heating a pan of water on high heat. When it hits 90 deg C, you turn the heat down to medium high. Of course the pan continues to warm and ends up boiling. In the same way, the earth does not instantly respond to energy input. I know the earth reacts to the 11 year cycle by resisting the temperature change via the 3rd harmonic wave. The La Nina down beat does not occur until 3.6 years after the solar min. So if cycles of 11 years have a delay of 3.6 years… what kind of delays should we expect for a 360-420 year cycle? How about a 60 year cycle?
As far as Zharkova, it doesn’t change my opinion that the barycenter is having a major impact on climate. It only proves that there continues to be a concerted effort to silence anyone with a point of view different from the mainstream. Sad that science has become so political.
Scott: The earth does not instantly respond to changes in energy input.
Yes it does. A change in solar radiation changes the energy budget of Earth instantly (within 8 minutes or so). What is lagged is the transfer of that energy between the different reservoirs within the geosphere and the associated temperature of those reservoirs.
Scott: Say you are heating a pan of water on high heat. When it hits 90 deg C, you turn the heat down to medium high. Of course the pan continues to warm and ends up boiling. In the same way, the earth does not instantly respond to energy input.
The response to the lowering of the input heat is manifested as a decrease in the rate at which energy is accumulated and stored in the water…instantly. If the new input energy flux still leads to warming then at the very least the warming will occur at a slower rate than before.
Scott: As far as Zharkova, it doesn’t change my opinion that the barycenter is having a major impact on climate. It only proves that there continues to be a concerted effort to silence anyone with a point of view different from the mainstream. Sad that science has become so political.
How do we convince you that the Earth does not bob in and out like a spring that continuously compresses and relaxes? Why doesn’t any other astronomical body do that? And why is there no observational evidence of it happening with Earth either?
The Sun does not want us to freeze.
https://www.ospo.noaa.gov/data/sst/anomaly/2020/anomnight.3.5.2020.gif
In response to this https://www.ospo.noaa.gov/data/sst/anomaly/2020/anomnight.3.5.2020.gif
One of tricks of climate shysters is to mach up data in one chart on a different relative scale, that way any small mismatch will “appear” a lot bigger.
Take a note the temp variation takes up 50% of the chart scale while the sun data takes only 20% of the chart .
If you make both the sun and temp at the same scale of 50% height, they will match up o lot closer.
They are good at this ,they do it for livin, use it all the time.
Eben, nothing wrong with the temp anomLy map.
What u talkin bout Willis?
Yeah I bungled up it was response to this
https://climate.nasa.gov/internal_resources/1993/
It looks like the scale choices are designed to give ~ correct scale factor between the watts and deg C.
Thus, in early 20th century the match in shape and magnitude is evident.
There is no match after 1950.
What deception u talkin bout Willis?
Jack Dale,
Do you honestly expect me to believe that in 1980 we were at record temperatures already? Nasa has attempted to erase the mid-century cooling that did in fact happen. You can do a shred of research and find all the evidence… scientists, media at the time worrying about an ice age.
Once you put the mid century cooling back in, things become a 60 year cycle.
Also, I might add here that if you look at base NOAA temperature data sets for specific locations, you can see the mid century cooling and the 60 year cycle.
The NOAA and GISS data look almost exactly the same, except for the shift due to the different baselines.
Same with Berkeley Earth, JMA, Cowtan&Way, and a bunch of reanalysis datasets. There is pretty solid agreement on the global mean surface temperature going back to the mid 20th century and prior.
The graph of solar activity vs temperature demonstrates the lack of engineering/science skill at NASA climate. This is a bogus graph. Temperature is an energy thing. Solar irradiance is a power thing. This graph is like plotting W hr meter readings on same graph as W meter readings and deciding they are unrelated because the traces are different shapes
Are you suggesting the graph would be more useful if it plotted the energy received by Earth instead of the TSI? You do realize what the shape of that plot looks like right?
Dan, radiative forcing is a power thing, same for solar and GHG.
Bdg,
No, the graph would be more correct and meaningful if they compared the time-integral of the solar irradiance anomaly, which would have units of energy, with the temperature.
Nate,
Yes, so they need to be time-integrated to rationally compare with temperature.
Dan,
Sure. We can try that. Download the TSI from the following page or use your own source.
https://spot.colorado.edu/~koppg/TSI/
How do you want to pick the baseline for the anomaly?
How do you want to perform the integration?
OK, integrate energy balance eqn with FB parameter and ocean heat capacity, which gives an exponential response to a step-up forcing with some reasonable time constant.
Lets say fb parameter ~ 1, and ocean mixed layer 200 m, then TC ~ 20 y is obtained.
Comparing average global temperature with just one parameter would still be dumb.
SSN follows TSI fairly closely. I used the time-integral of SSN anomaly, a saw-tooth approximation of the net of SST temperature cycles and the time-integral of TPW combined per Equation 1 to achieve a 96.6% match with measured average global temperature 1895-2019 as shown at
https://drive.google.com/open?id=1TYPxR19k1aheZvstnpAmK2qlXX8zjgkg
Dan,
What formula did you use to produce the “CALCULATED, 65% TPW EFFECT” series?
“with just one parameter would still be dumb”
Using many mystery parameters is worse.
“I used the time-integral of SSN anomaly, a saw-tooth approximation of the net of SST temperature cycles and the time-integral of TPW combined ”
But you must take into account ocean heat capacity.
The point is a step up in forcing should not produce a linear trend, it produces an an exponential rise to a new flat level.
Nate,
The ocean heat capacity is accounted for in the effective thermal capacitance of the planet of 17 W yr/m/m/K. The integration process accounts for the trajectory of the calculated change.
Bdg,
The formula that gets to the 65% TPW effect is equation 1 in (click my name) executed in EXCEL.
Dan, ok 17 wyr/m2/k. The fb parameter is typically set to 0.8 W/m2/k. Then TC will be 17/0.8 = 21 y.
So again, the exp response to the rise in TSI up to ~ 1950 will be done rising by 1980.
The linesr trend in temp cannot be due to that.
Somehow your wv rise is doing all the work of giving you a match.
But as we have discussed thst part is not convincing.
Nate,
Yes, the WV rise has been causing most of the average global temperature increase.
The 65% is the fraction of the average global temperature increase 1909-2019 due to WV. It is an output of the calculation using Equation 1 in (click my name). The derived fraction due to SSN anomalies is only about 16% 1909-2019. Table 1 gives the calculated attributions thru 2018.
Saying it is not convincing is not helpful. The WV increase is simply the TPW reported by NASA/RSS. The analysis is corroborated by Modtran for Std atm, 10% WV increase in Table 0.5.
Dan
“Saying it is not convincing is not helpful.”
As mentioned several times, your idea that global water vapor responds in proportion to regional evaporation is simplistic, and ignores the general circulation and papers we showed you that say otherwise.
As mentioned, you say irrigation area has increased over many decades to current 4x area of France, which is 0.7% of total ocean area. How can that be responsible for an increase of 1.47%/decade TPW?
As shown to you several times, including Clive Best’s discussion, your MODTRAN calculation at the Earths surface IGNORES the main contribution to the GHE from CO2 which is in the upper troposphere.
As mentioned several times, your trends with NO error analysis are not useful for comparing to any prediction. That is not convincing to science.
Not dealing seriously with the criticisms is not helpful, and thus your analysis remains unconvincing.
“As the slightly higher equilibrium is reached and the water vapor turns to clouds, what was once a GHG is now reflecting radiation back into space!”
Venus has way more clouds than Earth. And yet it has a huge GHE and is much hotter than it would be without an atmosphere.
https://bit.ly/3cCh75G
Typical TricksZone blah blah.
Feb 2020 was the warmest since measurement begin, as well as the entire winter (Dec, Jan, Feb).
What this Gosselin boaster is brazen enough to dissimulate is the fact that normally, this rain fall in fact should have been… snow fall.
We had on Feb 26 about 4 mm snow in the garden. That was the 2019/20 snow fall…
How dumb is one allowed to be?
Dumb enough to point out to his own garden as an evidence of the state of the climate
Bindidon the current low temperature in Western Europe and the influx of lows from the cold Atlantic will contribute to the epidemic in Europe.
Same on the US West Coast.
ren
You really should learn the difference between “will” and “might”.
Remember that La Nina that “WILL” begin by November?
Wait for the beginning of the new solar cycle.
https://files.tinypic.pl/i/00999/8oo807xpjkt3.png
What was the point of a graphic that confirms that your predicted La Nina did not eventuate?
I just want to show that it is the Sun that governs global air circulation.
https://www.tropicaltidbits.com/analysis/ocean/nino3.png
You live in Poland, right ren?
Average temperature anomalies in Warsaw for first week of March:
Max: +7C
Min: +6C
Locations in western (continental) Europe:
Paris
Max: average
Min: +1C
Berlin
Max: +3C
Min: +3.5C
Madrid
Max: -1C
Min: +4C
The Hague
Max: +1C
Min: +1.5C
Lisbon
Max: +2.5C
Min: +2.5C
Brussels
Max: -0.5C
Min: +3C
London
Max: average
Min: +1C
Copenhagen
Max: +3C
Min: +4C
Stockholm
Max: +3C
Min: +3.5C
FOUND ONE FOR YOU!! …
Dublin
Max: -0.5
Min: -1
Is that what you mean by “western Europe”?
Oops – I wrote “continental” before I decided to add the British Isles, then forgot to remove it.
ren
Could you please stop your ridiculous lies?
https://www.wetteronline.de/?daytime=day&diagram=true&fcdatstr=20200307&iid=euro&pid=p_city_local&sid=Pictogram
It is NOT cold in Europe, ren.
It is WINDY.
Bindidon, lack of sunlight will cause a coronavirus attack in Europe.
Hahaha. This made me laugh.
Sorry, in Western Europe it is mostly cloudy.
https://pl.sat24.com/pl/eu
It should be kept in mind that the dreadful extra severity of the recent bushfires here in Australia was mainly due to two factors (1) a very exceptionally severe drought that was predicted by no one, in particular not by the doctrine of man-made CO2-emissions supposed global warming; and more importantly (2) decades of green political activist bureaucratic obstruction of traditional regular cool-season natural-fire-fuel-accumulation-hazard-reducing controlled burns. The latter obstruction is indeed human-caused, but due to green political activism, not to CO2-emissions.
Chris, that topic was discussed at length a month ago, people showed articles debunking #2. The issues with that are develppment that restricts burning.
Dear Nate, those articles regrettably persuade someone who isn’t on the ground where the fires happen, and where the bureaucracy rules, but those articles don’t really debunk my comment; they are green political activist propaganda.
I was “on the ground where the fires happened,” but I wouldn’t use my proximity as an argument from authority or any other fallacy. On these matters I took take the advice of experts, not politicians, not greenies, not journalists, not bloggers, not noisy pundits.
Australia bushfire smoke is a hiccup on global climate.
Water vapor is a greenhouse gas. Natural sources of it made the planet warm enough for life as we know it to evolve.
What happened to common sense? Whole rivers have been dammed with added evaporation from artificial lakes and water used for irrigation and other uses where it evaporates. There are more than 57,000 large dams worldwide.
Water tables are declining worldwide due to pumped irrigation. Irrigated cropland is now more than four times the area of France.
Measured average global water vapor has been increasing 1.47% per decade which accounts for all the global warming attributable to humanity.
Any increase in atmospheric water vapour is DUE TO the warming (and hence adding to the warming as a feedback).
Increasing the surface area of exposed water only increases the RATE of evaporation, not the equilibrium concentration in the atmosphere. (It also increases the rate of condensation.)
And – seriously – calculate what percentage these extra surface areas of water are of the total surface area of ocean. Get back to me when you’ve done that calculation.
Mid,
Your opinion “not the equilibrium concentration in the atmosphere”
NASA/RSS data show WV has been increasing 1.47% per decade.
The RSS assessment is corroborated by NCEPR1, & NCEPR2.
The natural evaporation area has not changed. The increasing WV accounts for the global warming attributable to human activity.
Foo © bar 𝌆 baz ☃ qux
Mid,
Your suggested calculation appears to be profoundly lacking in the knowledge that the temperature of the ocean surface varies tremendously with latitude and that the vapor pressure of water (which is one of the important factors determining the rate at which WV is driven into the atmosphere) depends on its temperature. Low water temperatures at high latitudes might even pull WV out of the atmosphere.
Your response appears to be profoundly lacking in the knowledge that we are interested in CHANGES in ocean surface temperature, not surface temperature itself.
Mid,
Apparently you are too stubborn (or blind) to realize that I addressed that here: “The increasing WV accounts for the global warming attributable to human activity.”
Then you understand the significance of that calculation.
Still waiting for your answer.
Mid,
Calculation of the percentage increase of water surface area would be totally meaningless and potentially misleading. You should know better than to ask for it.
By “misleading” you mean “doesn’t suit my agenda”.
What was misleading was your statement about ocean surface temperature varying with latitude. What is important is that the entire ocean is warming, regardless of its temperature, and so the INCREASE in CO2 released is roughly the same over the entire ocean (at least to the same order of magnitude). So a comparison to the surface of the ocean is most certainly appropriate.
… ‘ALMOST’ the entire ocean …
Mid,
By misleading I mean because the ratio of irrigated area to ocean area is about 266E10/3.62E14 = 7.3E-5 and not representative of the influence that increasing irrigation has had on planet warming.
The WV increase resulting from temperature increase of the entire planet (71+% of area is water) is compared to the measured WV increase in Fig 7 of (click my name) and shown here: https://drive.google.com/open?id=1XFc92GAl-NXOqwiJKiAZzfEbb9x4BKND
CO2 change has had no significant effect on climate.
Dan,
Water tabl” Irrigated cropland is now more than four times the area of France.”
Seems insignificant compared to the area of the ocean.
Dan,
Water tabl” Irrigated cropland is now more than four times the area of France.”
Indeed that is 0.7% of the ocean area. How many decades to reach that size?
Hard to see how you can get 1.5%/decade out of that.
Nate,
The 1.47% increase in WV (1.49 % thru Jan 2020) is from the NASA/RSS reported measurements. The % area increase is meaningless and potentially misleading.
Your attribution of the CAUSE of the rise is the issue I have.
If you want to claim it is due to irrigation, then the area of irrigation increase is meaningful.
The rise is more than POSSIBLE from average global temperature increase. Therefore, the increase due to irrigation (etc.) has to be leading.
Another way to look at it: To start, assume that the temperature increase was caused by something else. Then the WV increase can be calculated from that temperature increase using the vapor pressure vs temperature for water and the assumption that % increase in WV = % increase in vapor pressure. But the WV has increased more than that so there has to be an additional source of WV. The additional source of WV is the something else that produced the initial warming and the rest of the warming is from the feedback of the temperature increase of the liquid water.
This lead to my survey to find the additional sources of WV and the discovery that it is nearly all from increased irrigation which, per Aquastat, http://www.fao.org/aquastat/en/overview/methodology/water-use has had a major surge beginning around 1950.
Dan,
I too am wondering if your match is being dominated by TPW. If so then that does not discriminate whether TPW is the cause or the effect.
If you are saying TPW is a cause of longterm changes then would you not have to exclude higher TPW from being an effect (rather than a cause) of higher temperatures or at least have some braking term that claps the feedback? Afterall, if we assume that TPW is also an effect (in addition to a cause) of temperature changes and you don’t have a braking term then the feedback will runaway.
Bdg,
WV increase is a cause of warming because it is a ghg. WV increase is a result of warming because its vapor pressure increases with temperature. The vapor pressure increase causes an increase in the number of WV molecules being forced into the atmosphere.
The higher TPW (i.e. higher than possible from just temperature increase) is from irrigation, etc.
If the feedback was high enough there would be runaway. Of course it is not or we would not be here. Even with full compounding (which is arguable given the time delay due to effective thermal capacitance) the feedback is only about 7% given the max uncompounded value of 6.87%. This means that the temperature increase is only about 7% more than it would be if there was no feedback.
bdgwx says
BTWspeaking of the Sundid you guys see that the Zharkova 2019 paper get formally retracted?
3 of the 4 scientist stood their ground 1 folded under pressure but the others are sticking to it
Talk about the old boys club ganging up on a women scientist
only had to wait 10months and if nothing started to happen her theory was a goner anyway. Perhaps they know something we don’t
Regards
Harry
Note: https://tinyurl.com/rongc7h
Meanwhile, the strength of the sun’s magnetic field is falling.
http://wso.stanford.edu/gifs/Dipall.gif
The northern polar field of the Sun is strong, but the southern is weakening. You can see that they are not in phase.
http://wso.stanford.edu/gifs/south.gif
Harry Cummings
“3 of the 4 scientist stood their ground 1 folded under pressure but the others are sticking to it”
WEven if it doen’t play any role, as Svante found out: where please did you read that?
TricksZone?
J.-P. D.
It wasn’t retracted because of an “old boys club” thing. It was retracted because it 1) contained a claim that was wrong and 2) because that false claim was a focus point of the paper.
Read all about it. Paper made a very dumb mistake.
Everything that doesnt go your way is not a conspiracy.
The latitudinal circulation that occurs at the beginning of the solar cycle will cause similar conditions as in 2010. The ice extent in the Arctic will remain high in summer.
Similar to 2010 – so … not followed by an ice age.
Didn’t alarmism die with the 18 year pause in temperature increases during which aco2 vastly increased? So aren’t we really left with three positions? Warmers, skeptics and liars?
Also, does anyone else recall the Ebola crisis several years back where Dr. Spencer posted how during past outbreaks in Ancient Greece, the recovered cared for the newly infected? I’ve searched for it and can’t find it. This seems like the right approach regarding the covid 19 response.
Darwin Wyatt
Duh! After days of getting all comments thru – even long ones – the blog’s scanner is on strike again.
https://drive.google.com/file/d/1HbCdYw0YY4kXnwwXk60jhlWttCwWLNT3/view
Rgds
J.-P. D.
Cold air from the north now flows to the east and west coast of North America.
https://images.tinypic.pl/i/00999/hhssc5jtswim.png
Thanks bindidon for clarifying that detail! 🙂
On Wikipedia they also comment:
“It received the name of Spanish flu because the pandemic occupied a greater attention of the press in Spain than in the rest of Europe, since it was not involved in the war and therefore the information about the disease was not censored.”
De nada!
J.-P. D.
March 7 (GMT):
1,247 new cases and 36 new deaths in Italy [source]
Percentage of deaths by age group:
90+ years old: 6% of deaths
80 – 89 years old: 42% of deaths
70 – 79 years old: 35% of deaths
60 – 69years old: 16% of deaths
– Among the 5,061 active cases, 3,218 (55%) are hospitalized, 567 of which (representing 11% of active cases) are in intensive care
– Among the 822 closed cases, 589 (72%) have recovered, 233 (28%) have died
Current temperature in Europe.
https://files.tinypic.pl/i/00999/z5odmch7sxyz.png
With Ebola the growing curve of suspicious cases was increasingly exaggerated by panic and there was a problem with the Excel records of the four laboratories that analyzed blood samples in Liberia, they did not combine. Until Dr. Hans Rosling arrived in Liberia, he began to organize the data that reflected the number of confirmed cases and it was seen that the maximum point had been reached two weeks before and it was already descending …
This is told by Dr. himself in his book Factfulness. 2018.
An amazing book!!
https://www.consilium.europa.eu/es/documents-publications/library/library-blog/posts/factfulness/
With regard to the coronavirus figures, I imagine that in Western countries the data is assured and there is capacity to control. Whatever, from China we know what they want to communicate from the country itself, … But in the most disadvantaged and populated countries like India …….. My God, What will happen there? It truly gives panic to think what its inhabitants may suffer with this speed of infection …
Italians are very honest in statistics. They do not pretend that age and other diseases led to the death of patients. They do a sufficient number of tests.
You have been deleted
https://bit.ly/2IvFKmF
Am I right in believing that the CO2 hypothesis says that the stratosphere will cool? So what happened after 1994 – why didn’t it continue to cool? Thanks.
Yes, the prediction was that the lower stratosphere would cool, owing to the ‘trapping’* of long wave radiation in the troposphere.
This is a long term effect, and indeed the troposphere has cooled in the period of satellite and radiosonde measurements. The flattish period is a curious phenomenon (though there has still been a very slight general cooling to present), and I am just now wondering if that has anything to do with the higher radiating level of the TOA 9top of atmosphere).
http://images.remss.com/msu/msu_time_series.html
I checked for myself that there had been a general slight cooling after the spike in 1993.
https://i.imgur.com/NkTD5fS.png
Mikey
” So what happened after 1994 – why didn’t it continue to cool? ”
Ooops?!
Look at the blue plot in the graph, showing the temperature anomalies of the lower stratosphere…
https://drive.google.com/file/d/1OO6HpUOvk_N_tC2fUt8wzDDvMzhYM8C_/view
The last little peak at the end is, as Roy Spencer says, due to the recent Taal eruption.
J.-P. D.
I don’t know what your “ooops” is supposed to signify. I’m an engineer. If I looked at that on a graph of heat (temperature), I wouldn’t consider that cooling after 1994, given the Y axis. It’s hardly discernible by eye. I’m not a sceptic or a warmist, I just try and see things as they really are. From 1978 to 2000 was cooling. After that, not so much, but you could make a case (by eye) for saying after 1994. Surely, if the CO2 hypothesis is correct, we should have seen the cooling from 1978 to 1994 continue? As for what it therefore SHOULD be now, I got a figure (quite literally from putting a ruler on my PC screen) of around -1.75 deg c. Yet it’s -0.5. To any reasonable OBJECTIVE person, stratospheric cooling has not continued, or is continuing at a rate so slow as to be insignificant.
Mikey
Yes indeed, my ooops merits no more than a counterooops.
Apos, I was robertsoning a bit.
I now looked at the spreadsheet behind the graph instead of eyeballing, and comnputed the trends for 1978-1992, and for 1993-2020:
-0.24 resp. -0.07 / decade.
Interesting is that the trend for 1978-2020 is -0.29.
My layman’s impression: this decrease in LS cooling might be kinda residual of the Pinatubo eruption. The abrupt decrease switch namely happens soon after it.
Discussing about CO2 within such short periods: is that meaningful?
“After 1994”
Ok then. Lest I be accused of cherry-picking.
https://i.imgur.com/CKrglOb.png
So that’s not a significant trend. Aren’t we supposed to be in the middle of a climate crisis – and the trend is 0.05 per decade – half of one degree in 100 years?
Yes, those people living in the stratosphere should calm down.
It is inherent to the CO2 hypothesis.
Do you believe that the amount of cooling in the stratosphere is directly tied to the amount of warming in the lower troposphere/surface? That would explain your remarks, but perhaps you have a subtler view than this?
Yes, and no I don’t have a’subtler view’.
https://skepticalscience.com/Stratospheric_Cooling.html
Mikey,
Correct. GHG forcing tends to warm the troposphere and cool the stratosphere. However, aerosols have the exact opposite effect. They tend to cool the troposphere and warm the stratosphere. It is the net effect of everything (GHGs, aerosols, etc.) that matters. As such an observation of a flat trend in both the troposphere and stratosphere is not sufficient to falsify the CO2 hypothesis. In fact, that is expected behavior if the aerosol effect is offsetting the GHG effect.
bdgwx
This is correct.
And I repeat my impression that this decrease in LS cooling which started in 1994 might be a residual of the Pinatubo eruption.
We see even a flatter anomaly sequence between El Chichon and Pinatubo (see the graph in a comment above).
I read somewhere that though having erupted with a lower VEI than Pinatubo, El Chichon has thrown out at least as much SO2 as did the former.
J.-P. D.
Yep. Though it wouldn’t necessarily have to be just Pinatubo. IPCC AR5 WGI figure 8.13 shows elevated stratospheric aerosols from 2004 to 2012 as well.
https://www.ipcc.ch/report/ar5/wg1/anthropogenic-and-natural-radiative-forcing/
bdgwx
” Though it wouldn’t necessarily have to be just Pinatubo. ”
… or El Chichon.
” … shows elevated stratospheric aerosols from 2004 to 2012 as well. ”
Yes: and that also smaller eruptions must be taken into account was shown in 2014 by Santer, Bonfils et alii in a great article, whose goal was to show the residuals of RSS(3.3) after extraction of ENSO and volcano eruptions.
Here is its much more elaborated variant hosted by MIT (the results are shown at page 52 in graphical form):
https://dspace.mit.edu/handle/1721.1/89054
J.-P. D.
bdgwx (cntnd)
While searching for Santer’s volcano stuff in my bookmarks, I found also this:
https://atmos.washington.edu/~qfu/Publications/JC.Santer.Dec2016.pdf
Different context, but interesting as well.
I’ve seen that Santer et al. paper before. It’s a good read. For the lurkers this paper addresses the so called mid troposphere tropical hotspot problem. Christy often compares UAH TMT 20N-20S product to climate models for the purpose of discrediting climate models. Santer shows in this paper that the difference is almost half of the claimed difference.
Of course Ren.
That’s what I meant with Western countries, … and of course in the EU the data is safe
For Bindidon and Scott:
From:
https://www.nature.com/articles/s41598-020-61020-3
– “The analyses presented in the section entitled Effects of SIM on a temperature in the terrestrial hemispheres are based on the assumption that the orbits of the Earth and the Sun about the Solar System barycenter are uncorrelated, so that the Earth-Sun distance changes by an amount comparable to the Sun-barycenter distance. Post-publication peer review has shownthat this assumption is inaccurate because the motions of the Earth and the Sun are primarily due to Jupiter and the other giant planets, which accelerate the Earth and the Sun in nearly the same direction, and thereby generate highly-correlated motions in the Earth and Sun. Current ephemeris calculations [1,2] show that the Earth-Sun distance varies over a timescale of a few centuries by substantially less than the amount reported in this article. As a result the Editors no longer have confidence in the conclusions presented.
S. I. Zharkov agrees with the retraction. V. V. Zharkova, E. Popova, and S. J. Shepherd disagree with
the retraction. “-
Scott:
I think I understand that you always talk about the influence of the great planets of our solar system on the ENSO phenomena … AMO cycles … Is that so? And do you think about the reasons ( distance earth-sun) for the retraction of Zhaekova’s publication?
Thank you very much!
Adelaida,
There is a relationship between the 3 conjunction types / locations for Jupiter and Saturn and temperatures in the north Atlantic. If someone wants to argue that the distances are overstated in Zharkova’s paper, I’m willing to listen, but the relationship and result speak for themselves. I can’t confirm or deny the distances stated in the paper. This retraction does nothing to change the amplitude of the change in the AMO over time and it’s link to these conjunction cycles. It is possible that the distances are not the only factor. The speed in which the sun moves could create an effect within the sun which causes these cycles. In fact the Yoshimura cycle, we know that is the case because it effects both the NH and SH. For that one, Jupiter and Saturn conjunct at Jupiter’s perihelion location, which amplifies solar activity. The other 2 conjunction types are more important to the earth sun distance so that the arctic and Antarctic during their respective summers can melt more or less ice. That causes feedback cycles to start due to albedo.
Adelaida
Muchas gracias!
But I must confess that my interest in this highly speculative domain is near zero…
¡Hasta la próxima!
“The Illinois-based Heartland Institute ― which captured headlines last month for promoting a German teenager with ties to neo-Nazis as the climate denier’s alternative to acclaimed youth activist Greta Thunberg ― pink-slipped at least 10 staffers Friday, shedding what one former employee described as “more than half” the organization’s staff.
“Heartland is broke,” Nikki Comerford, the nonprofit’s events coordinator on staff for nearly 21 years, told a former colleague in a text message, a screenshot of which HuffPost reviewed.”
How sad. hahahahahahahahahahahahahahahahahahahaha!
Exxon is running late with its annual donation to Heartland.
Yea must be nice to live on cushy Federal funding in the academic echo chamber. It’s odd that a religion can be funded by federal science funds after all.
What contribution has been made (or promises to be made) by Heartland to science that would merit funding? It seems all they do is talk, without ANY science being done.
What scientific contributions do any conference do? They serve a different purpose to share ideas and cross pollinate related groups. Also to create alignment in themes. I would argue Heartland Institution was a big factor in the formation of the Luke warm ideology. The idea that yes CO2 is responsible for moderate warming but that such warming is not destructive for Earth.
Is the government in the habit of financing these types of groups in general?
Ideology: “a system of ideas and ideals, especially one which forms the basis of economic or political theory and policy.”
So no science then.
Midas,
Again i believe the function of most any confrence is not to create original science but rather to put research together and see the bigger picture. Climate research is an ideology and both sides deserve a voice as long as it is constrained by valid logic. Heartland is valid to me because if you extrapolate out global warming data trends you get a low climate sensitivity. So low sensitivity is my mean, p50, or base case. Moderate warming is probably not a big deal for Earth as nearly every creature survived the much warmer Eeniman. So we are no where near exiting natural variability.
Heartland is a political advocacy organization. Their product is not science but propaganda.
A few years ago I was on the recieving end of their propoganda in the form of a free book containing all kinds of highly cherry picked and misleading ‘science’. Like the plot of the flat temperature trend of a small patch of ocean (Sargasso sea), to prove no global warming.
If they should recieve federal funding then so should Greenpeace
If that is true about abusive graphs then I agree. But is it any different from the pre 1950s adjustment to sst from boat motor corrections? Or changing from proxy to high resolution thermometer or satellite temperature as in hockey stock or glacial graphs so common?
Ozone from smoke forcing temperature change?
https://www.sciencenews.org/article/worst-wildfires-can-send-smoke-high-enough-affect-ozone-layer
The real climate history and idiocy of rain makers past and present
https://youtu.be/WwiP_9ZeTtg
https://youtu.be/wcAy4sOcS5M
In Spain we also say “many times”, referring to the fact that I am very grateful to you and to the other scientists who participate in this forum for their work, the information they attach and the clarifications !! (Although the issue of respect and good education, sometimes spoils such an interesting forum)
I was referring to you Bindindon in my previous message, because indeed as Harry Cummings pointed out, three of the four people in charge of Zharkova’s article did not retract and only one of them did.
In the words of Dr. Spencer himself: “Natural causes of climate change are largely not understood.”
So I imagine that the field of research in this area is very large and that
You Scott is a pioneer exploring your field!
From what I’ve been able to see, it seemed to me, that Nir Shaviv and Nicholas Scaffeta are in your line … and out of curiosity, is there any kind of connection between you?
BEST regards!!
Adelaida
Adelaida,
Thanks for the kind words, it means a lot. I care very deeply about this planet and getting to the bottom of what is causing changes in the climate. I don’t have any links to the persons you mentioned. Basically, I’ve just gone step by step with the data and this is where it has lead me. The pieces are starting to fit together as I get deeper into the weeds which is a good sign.
The beginning of my last message is in response to Bindindon’s message:
You’re welcome Adelaida!
I usually try to respond to a specific person but the message always appears at the end …
Thanks for your understanding!
After taking a few months following Dr. Spencer’s posts and subsequent forums, I would like to share, if you allow me, some thoughts:
– At this time, in the world, the belief that the origin of global warming is anthropogenic is general.
The ONU with the IPCC, scientific organizations such as NASA, ESA, CERN etc., as well as many governments and the media in general supported by the previous ones, affirm this idea. (….. Although the scientific consensus, in reality, does not exceed 50-60%:
https://drive.google.com/file/d1FlrrxEhpzfAlOOCu3cMNM4ZhrYwS8Omy/view?usp=drivesdk)
And in this global context, it seems logical that there are many children (and older people, where I am included) concerned and obsessed with the subject.
When an IPCC speaks of 11 years, (already 10), for the cataclysm of the planet! ….
It does not seem strange to me that a Greta Thunberg arises, that if you have Asperger’s syndrome, it is much more obsessive and fierce than normal …
Because to get to know Dr. Spencer and this forum, you have to really investigate and … it is not accessible to everyone! … I have studied engineering and I can more or less follow and learn along the way , but that cannot be done by so many people …
(I add, that I do my best to spread it among friends and colleagues …)
More things:
– I think you have to be constructive (as in life!) And look at the positive: The proAGW economic-political orientation in many countries will lead to the development of technologies and energies that otherwise they might not do because there would not be enough money and reforestation hopefully also …
– Of course, according to the point of view of Dr. Spencer, whom I follow with reverence, fossil fuels would not have to be a problem, as long as they are exploited in a careful and rational way …. But fracking ….. is dangerous if it is not done in a controlled and responsible way.
The possible ecological and overtaking dangers of future seismic movements require very strict control …. as I have seen reading and they have told me friends geologists and mining engineers.
And in that sense, my curiosity has led me to inquire about fracking in the USA and particularly in Alabama,
simply because there is Alabama-Hunsville University!
And I found the following article that speaks about the fact that the authorities of this state did not know in 2017 the exact number of fracking farms in their territory! And that seems really dangerous in terms of the care and external control of these farms ….
https://ballotpedia.org/Fracking_in_Alabama
– Another point is that although global warming is not going to be dangerous, as dr. Spencer, other aspects such as pollution of rivers, seas and oceans ….. And the acidification of these? As well as the barbarity of plastic garbage everywhere …. They need an awareness in this regard, and that is also a positive aspect of the mentality that is expanding right now about caring for our planet..
Don’t you think?
Why don’t you actually READ the IPCC report.
When you’ve finished, get back to me and let me know exactly what the 12 years refers to.
And your first link does not open.
Adelaida: When an IPCC speaks of 11 years, (already 10), for the cataclysm of the planet!
Can you point me to the IPCC publication where it is claimed that the planet will undergo a cataclysmic event in 11 years?
In February 2020, the number of sunspots fell again close to zero.
https://services.swpc.noaa.gov/images/solar-cycle-sunspot-number.gif?time=1583733002000
And in the same month, the earth was the warmest it has been since records began, excluding the strongest El Ninos.
Love that negative correlation.
Extremely low temperature in Svalbard (-14 F, -26 C)
https://www.wunderground.com/weather/ILONGY1
Why can’t you stop your ridiculous coolista nonsense?
A few examples of March temperatures below -30 C:
SV000001008 ___SVALBARD_AIRPORT___________ 1986 3 4 -46.3
SV000001008 ___SVALBARD_AIRPORT___________ 1986 3 3 -46.1
SV000001008 ___SVALBARD_AIRPORT___________ 1986 3 2 -41.1
SV000001008 ___SVALBARD_AIRPORT___________ 1986 3 1 -39.9
SV000001008 ___SVALBARD_AIRPORT___________ 1979 3 1 -37.1
SV000001008 ___SVALBARD_AIRPORT___________ 1976 3 3 -36.0
SV000001008 ___SVALBARD_AIRPORT___________ 1978 3 17 -35.6
SV000001008 ___SVALBARD_AIRPORT___________ 1988 3 28 -35.5
SV000001008 ___SVALBARD_AIRPORT___________ 1976 3 2 -35.4
SV000001008 ___SVALBARD_AIRPORT___________ 1978 3 18 -35.4
And here are the only two records below 30 C for years since 2000:
SV000001008 ___SVALBARD_AIRPORT___________ 2011 1 30 -31.5
SV000001008 ___SVALBARD_AIRPORT___________ 2011 1 31 -30.6
He must have meant compared to Poland.
Are you sure?
I just picked up Europe’s night forecast for March, 26:
https://tinyurl.com/s7c7m6c
If that holds, it will then be colder in Poland than in Scandinavia and Iceland…
Yes, but he said Svalbard.
Midas and bdgwx:
The first document that didn’t open I hope it opens now! I had already sent it in the first comment I made in the forum a few months ago … and when I read it is when I began to doubt the official line of the climate consensus:
https://drive.google.com/file/d/1FlrrxEhpzfAlOOCu3cMNM4ZhrYwS8Omy/view?usp=drivesdk
I began to see that the issue was really serious with this publication of the government of my country:
“PROPOSED DRAFT CLIMATE CHANGE AND TRANSITION LAW ENERGY”. Government of Spain.
The text is in spanish. A traslated extract:
“The next ten years will be decisive for be able to succeed and preserve our security. Exceed the limit 1.5 C depends on the actions to combat change climate carried out by all the actors, not just the Governments, but also the private sector and the rest of society.”
https://drive.google.com/file/d/1H9_qvTChM5B5-gllW4IksLve6TUriKKR/view?usp=drivesdk
The “IPCC Summary for Policy Makers”. Octubre 2018:
https://drive.google.com/file/d/1H4sC-1rwWei-6buh_Eaeuf3D8plYjirF/view?usp=drivesdk
Again, your 2nd and 3rd links have no viewing permission.
But I don’t want the entire IPCC report. Just quote me the relevant passage, not forgetting to add any text that is relevant to the context of the quote, plus page numbers from the report.
Alternatively, just tell me whether it actually says something equivalent to “we are destined for a cataclysm by the year 2030”, or whether it suggests that we have until 2030 to prevent a crisis by 2100.
My point was really that the IPCC traditionally uses careful language. I suspect what you are referring to is the statement by the IPCC that limiting the warming to 1.5C can only be achieved through aggressive emission mitigation prior to 2030.
An example of the language used is this…
“Pathways that limit global warming to 1.5C with no or limited overshoot show clear emission reductions by 2030 (high
confidence)” SR15 pg. 20
https://www.ipcc.ch/site/assets/uploads/2018/10/SR15_SPM_version_stand_alone_LR.pdf
Nowhere in the Summary for Policymakers is cataclysm, catastrophe, or doomsday mentioned. That language typically comes from the media or bloggers. And a bit odd irony here is that contrarian slanted blogs often tend to favor this exaggerated language with more fervor than everyone else.
Real scientists know it is the Sun not CO2
https://youtu.be/7_ccRjQpBgU
UN IPCC Scientist Dr. Steven M. Japar, a PhD atmospheric chemist who was part of Intergovernmental Panel on Climate Change’s (IPCC) Second (1995) and Third (2001) Assessment Reports, and has authored 83 peer-reviewed publications and in the areas of climate change, atmospheric chemistry, air pollutions and vehicle emissions, challenged the IPCC’s climate claims.
“Temperature measurements show that the [climate model-predicted mid-troposphere] hot zone is non-existent. This is more than sufficient to invalidate global climate models and projections made with them!” Japar told the minority staff on the Environment and Public Works Committee on January 7, 2009.
The NCEP GDAS and CPC temperature and height analyses are used to monitor processes in the Stratosphere and Troposphere. In the table below are zonal mean time series of Temperature, Zonal Wind Component, Normalized Geopotential Height anomalies, amplitude of the height field’s Wave 1, Wave 2, and Wave 3.
https://www.cpc.ncep.noaa.gov/products/stratosphere/strat-trop/gif_files/time_pres_TEMP_ANOM_ALL_EQ_2020.png
The current temperature at a height of approximately 5 km.
https://earth.nullschool.net/#current/wind/isobaric/500hPa/overlay=temp/equirectangular=-111.55,-0.00,188/loc=-145.374,76.037
Thank you bdgwx!
It is true Midas, what is expressed wrong, Actually, what the IPCC says is that we have until 2030 to get conditions on the planet to avoid a subsequent cataclysm … Not that the cataclysm is going to be in 2030 …
I apologize for my expression error!
And there are still more alarmist institutions than the IPCC and the Club of Rome. The Australian NGO BT He talks about having much less time to avoid irreversible weather conditions:
“A 2050 SCENARIO
20202030: Policy-makers fail to act on evidence that the current Paris Agreement path in which global
human-caused greenhouse emissions do not peak until 2030 will lock in at least 3C of warming. The case for a global, climate-emergency mobilisation of labour and resources to build a zero-emission economy and carbon drawdown in order to have a
realistic chance of keeping warming well below 2C is politely ignored. As projected by Xu and Ramanathan,
by 2030 carbon dioxide levels have reached 437 parts per million which is unprecedented in the last 20
million years and warming reaches 1.6C.
20302050: Emissions peak in 2030, and start to fall consistent with an 80 percent reduction in fossil-fuel
energy intensity by 2100 compared to 2010 energy intensity. This leads to warming of 2.4C by 2050,consistent with the Xu and Ramanathan
baseline-fastscenario. However, another 0.6C of warming occurs
taking the total to 3C by 2050 due to the activation of a number of carbon-cycle feedbacks and
higher levels of ice albedo and cloud feedbacks than current models assume.
[It should be noted that this is far from an extremescenario: the low-probability, high-impact warming
(five percent probability) can exceed 3.54C by 2050 in the Xu and Ramanathan scheme.]”
You can read more in:
https://drive.google.com/file/d/1HmsyFxpWGJ8CtGYlzXcUluWNvj-PeQl2/view?usp=drivesdk
Uff!
Sorry if my form of expression is still exaggerated, I should reflect more like saying it before writing it!
And Thank you all for not taking it too much into account! ….
Now the biggest concern here is the alarming growth of coronavirus cases that can explode and resemble what is happening in Italy!
Adelaida
I follow this page day by day, and don’t think that Spain will reach Italy:
https://tinyurl.com/s4gvvck
Rgds
J.-P. D.
all you alarmists out there
how many great authority figures at the time with all the knowledge they had could not possible be wrong predicted the end of man in some horrible way……. say over the last 5000 years 100’s maybe more not one has been right not a single one.
Got to tell you something…maybe go get a new hobby
Regards
Harry
Harry, who is predicting ‘end of man in some horrible way’?
No one here that Im aware of.
The global warming is harmful about the same way communism is beneficial ,
It is all in Bizarro World of the Left.
For start – stop using the idiotic phrase “Climate Change”
https://youtu.be/nopTsZL4CXw
https://youtu.be/ve8JzyjHz0Y
Sure..just as soon as you stop labelling ordinary science ‘alarmist’.
So you think political science, cognitive science, social science and the rest of the self described sciences are ordinary science? The Bizarro World of the Left has stolen your brain! When do the oceans start boiling? Or dont we need to be alarmed after all?
Would you call a volcanologist, who by studying a particular volcano determined that it will explode and tried to publish his results – alarmist? Imo, climatologists that publically claim that 2xco2 will lead to 3*C to 10*C warming IS an alarmist regardless of whether his results are correct.
I mean, just embrace it just like we embraced the ‘denier’ moniker.
Amazed: When do the oceans start boiling?
It’s a good question, but tricky and complicated. It is very unlikely that a runaway greenhouse effect will occur that boils the oceans off. It would require super high concentrations of non-condensing GHGs that probably is not even possible on Earth. However, what is more realistic is what is called a moist greenhouse which through a complicated process can cause the loss of water on Earth. But the evidence seems to suggest that it would take at least 10,000 ppm of CO2 and a dramatic increase in temperature to kick start that process. One thing you can research is the Simpson-Nakajima limit. You’ll find a lot of papers on the topic of how susceptible Earth is or isn’t in regards to a strict runaway and the various stability points of different atmospheric configurations. It’s pretty complicated. I’ve only just started diving in myself.
I wonder how all the alarmist trend followers have fared following the stock market upward trend recently? Prediction, projection, or scenario, take your pick. All equally useless.
Maybe the recent temperature trends will fare better? Who knows?
Well the market was kinda super el Nino anwyay. No worries, this La Nina will run its course and long term trend will continue.
What in the world are you talking about? Don’t you realise that El Niño etc are just names given to observed temperatures? A bit like claiming summer provides heat to the Earth, and winter takes the heat away! How is the world-melting “tipping point” faring? Still coming? Ho ho.
I think the sarcasm was missed Amazed. But, yes, we all agree that ENSO is not an energy source or a causative mechanism for planetary scale energy imbalances.
Translation for the analogy-impaired:
Well the market was recently overheated anyway. No worries, this downturn will run its course and long term trend will continue.
Similarly, El Ninos give short term boosts to global temperature, La Ninas give short term reductions in global temperature. But when these effects are accounted for, the long term upward trend in global temperature continues.
Nate
“… the long term upward trend in global temperature continues. ”
Yes. According to Santer, Bonfils et alii, after having extracted ENSO and volcano eruption effects, at a rate of 70 % of the original time series.
Temperature above the 60th parallel is still typical for winter.
https://www.cpc.ncep.noaa.gov/products/stratosphere/strat-trop/gif_files/time_pres_TEMP_MEAN_JFM_NH_2020.png
The end of March will be unusually cold in Europe.
https://www.netweather.tv/charts-and-data/jetstream
Forecast night temperature in Europe for March, 24:
https://tinyurl.com/rtr9h5c
ren
In Sweden we have had the mildest winter since Anders Celsius days.
You were convinced that Scandinavia would have a hard winter a few months ago.
Petwap
‘Commentator’ ren is always convinced of anything showing cooling.
For him / her it is not even a question of ideology, let alone of knowledge.
Forecast night temperature in Europe for March, 25:
https://tinyurl.com/v22spfn
Thank you Ren!
BEST regards!
My daughter lives in Madrid. Regards Spain.
I only showed the most alarmist side that exists, the NGO BT of Audtralia. On whose reports the most alarmist articles of the newspaper “The Guardian” are based.
This NGO is based in turn on Rammanathan, who is the scientist who discovered the ozone layer and climate advisor of the Dalai Lama and Pope Francis …
I’ve gone to an extreme just to show it to you. I am currently a convinced follower of Dr. Spencer
Adelaida
What about showing us the extremes on the other side?
Do you need some help?
Rgds
J.-P. D.
Exposing climate deceptions used by alarmists
https://bit.ly/3aQyi1D
Just curious why the big Indonesian fires in late 1997 and early 1998 dont show up at all ??
ImranCan
Maybe because the lower stratosphere is not affected by smoke as it is by aerosols spread out by volcanic eruptions?
Or maybe not. Whats the point of maybe? If you dont know, why not just say so, or better still, say nothing.
Amazed
The mental emptiness of your psychotic comments is really amazing.
They remind me of all these dogs who live under the urge to give each tree a ‘gift’.
People like you come and go, as soon as they get sad of their own nonsense.
I’ll be here for a longer while.
One of “them” took the red pill
https://bit.ly/2W1giNT
Remdesivir and chloroquine effectively inhibit the recently emerged novel coronavirus (2019-nCoV) in vitro.
https://www.nature.com/articles/s41422-020-0282-0
Very changeable weather in Europe. I predict the peak of infection at the turn of March and April.
We are just at its very beginning:
https://tinyurl.com/tqttf3r
I guess end of June.
Advancing the debate
https://climateataglance.com/
Simple-minded, totally biased Heartland stuff.
No wonder that these ‘smart’ guys managed to enroll alt-right girlie Seibt!
Ren,
I Hope your daughter is well!!! And also well isolated!!….BecauseThat’s seems the question now with this incredible super infectous and terrible coronavirus!!
Thank you very much for the information!
I couldn’t found chloroquine, hospitals must stock up on It!
My best wishes for you and your family Ren!!