COVID-19 Global Economic Downturn not Affecting CO2 Rise: May 2020 Update

June 5th, 2020 by Roy W. Spencer, Ph. D.

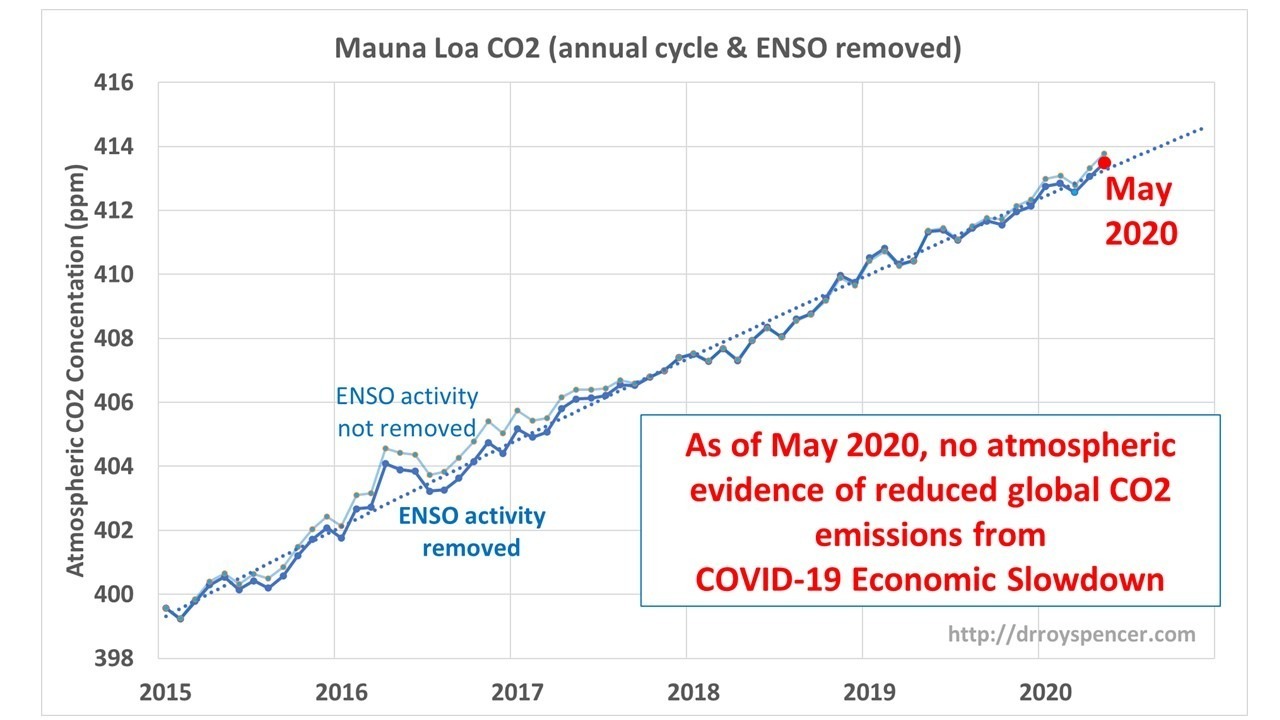
The Mauna Loa atmospheric CO2 concentration data continue to show no reduction in the rate of rise due to the recent global economic slowdown. This demonstrates how difficult it is to reduce global CO2 emissions without causing a major disruption to the global economy and exacerbation of poverty.

After removal of the strong seasonal cycle in Mauna Loa CO2 data, and a first order estimate of the CO2 influence of El Nino and La Nina activity (ENSO), the May 2020 update shows no indication of a reduction in the rate of rise in the last few months, when the reduction in economic activity should have shown up.

I had previously explained why the slowdown would likely not be large enough to affect measured atmospheric CO2 levels compared to natural variations in global sources and sinks of CO2. I calculated that the Energy Information Administration-estimated 11% reductions in CO2 emissions during 2020 would have to be four times larger to stop the rise of atmospheric CO2 over 2019 values (assuming no substantial natural variations in CO2 sources and sinks).


911 Responses to “COVID-19 Global Economic Downturn not Affecting CO2 Rise: May 2020 Update”

Toggle Trackbacks

  1. Eben says:

    It looks like this Satanic gas is making itself

    • Svante says:

      That’s bad news, we have to cut emissions more than 100% to make up for natural additions.

      • Eben says:

        Put Your Money Where Your Mouth Is as and stop exhaling CO2

      • Svante says:

        In other words, if the CO2 increase is natural we must cut our emissions further, and use carbon capture and storage (CCS) to offset it.

        • Dr Roys Emergency Moderation Team says:

          Svante, please stop trolling.

        • Svante says:

          No I’m serious. This unprecedented spike in global temperature puts coastal assets and ecosystems at risk.
          It must be halted regardless of whether it’s natural or not.

        • bdgwx says:

          And wouldn’t an “it’s all natural” explanation be MORE alarming? Afterall, if pumping CO2 into the atmosphere has no effect (contrarian hypothesis) then why should we expect pulling CO2 out or even just curbing emissions will have any effect either?

        • Dr Roys Emergency Moderation Team says:

          Svante, bdgwx, please stop trolling.

        • Svante says:

          Yes bdgwx,
          Solar screens in orbit would cost less than sea level rise and collapsing ecosystems.

  2. ren says:

    A tropical storm moves to the central Gulf of Mexico.
    https://www.tropicaltidbits.com/sat/satlooper.php?region=watl&product=ir

  3. Sisyphus says:

    CO2 steady; temps vacillating up-and-down significantly.
    Correlation? Causation???

    • Entropic man says:

      Noise

      • Sisyphus says:

        “Noise”
        These past three months of the UAH global temperature records have been aberrantly noisy(?)

    • Ric Werme says:

      The cause is meridional flow in the jet stream – i. e. it’s being pushed around so that the storm track keeps moving back and forth across us.

      • Sisyphus says:

        “The cause is meridional flow in the jet stream i. e. its being pushed around so that the storm track keeps moving back and forth across us.”
        Compare the past 3 months of UAH global to Mauna Loa CO2 for a potentially different perspective…

      • Nate says:

        Sysiphus,

        Are you claiming that temperature should ONLY vary due to CO2 varying?

        That would be a claim no one else is making.

  4. Nate says:

    “This demonstrates how difficult it is to reduce global CO2 emissions without causing a major disruption to the global economy and exacerbation of poverty.”

    FNot at all.

    The permanent replacement of high emitting energy sources, rather than a brief disruption of energy use (and economy) are what is being pursued.

    A sustained reduction of emissions in this way, can have an impact on atm concentration, without economic pain.

    • Juan Slayton says:

      It would have an impact on ATM concentrations, sure enough…

    • Chic Bowdrie says:

      You are obviously wrong on both accounts.

      You have no data even remotely showing a reduction in emissions will have no economic pain.

      You have no data showing that a reduction in emissions will have a noticeable effect on CO2 concentration in the atmosphere.

      Back to obfuscation par excellence, I see.

      • bdgwx says:

        The IPCC AR5 report is a pretty good collation of the data showing both 1) that a reduction in emissions has a positive economic gain and 2) that a reduction in emissions would have a noticeable effect on CO2 concentration in the atmosphere.

        • Chic Bowdrie says:

          Chapter and verse backing up your/IPCC speculations?

          • bdgwx says:

            WGI and to a lesser degree WGIII for the claim that reducing human emissions will have a noticeable effect on CO2 concentration. WGII for the impact of doing nothing (both in terms of societal cost and increased societal risk). WGIII for the cost of mitigation and the incremental cost of delaying that mitigation.

          • Chic Bowdrie says:

            And the verses? You need to make the case with more than vague references. Otherwise your just polluting the blog.

          • bdgwx says:

            All of it. That is my source. It is a complex topic that cannot be boiled down to a single sentence.

          • Chic Bowdrie says:

            Then let the record show you guys have no data even remotely showing a reduction in emissions will have any economic pain and you guys have no data showing that a reduction in FF emissions will have a noticeable effect on CO2 concentration in the atmosphere.

          • Nate says:

            “no data showing that a reduction in FF emissions will have a noticeable effect on CO2 concentration in the atmosphere.”

            Quite silly. We have strong evidence that our additions have increased CO2. The proportion that has remained has been predictably steady.

            Basic logic says that if we stop adding, then the rise will cease. The rate of decrease is different issue.

          • Chic Bowdrie says:

            Don’t you realize what you keep doing over and over? You really must have some mental problem. Are you trying to compensate for something? I recommend accepting yourself for who you are. Get some close friends who will support you. Maybe you can find a self-help group in Seattle or somewhere with lots of simpatico liberals who feel your pain and won’t throw bricks in your windows.

          • Nate says:

            Yep.

            “We have strong evidence” and you don’t. It really comes down to that.

            Models with simple appealing math, imagined inputs, with no identified mechanism, just dont cut it.

            Even your often mention Bomb curve, cannot be explained by your model. Not even close.

            It doesnt matter how much you love your model, that means its wrong.

      • Nate says:

        “You have no data showing that a reduction in emissions will have a noticeable effect on CO2 concentration in the atmosphere.”

        The experiment of lowering emission substantially hasnt, obviously, benn possible, while the opposite experiment of increasing emissions and seeingvthat the concentration responds in kind has been done. It worked, repeatedly, 6 times in 6 decades. Lots of corroborating evidence

        There is no viable alternative mechanism to explain this rise, other than hopes and prayers, and ignored data.

        As you know, paradigms in science are overturned by complelling new evidence. In this instance, where is that? Where is even the attempt to find it?

        • Chic Bowdrie says:

          “…while the opposite experiment of increasing emissions and seeing that the concentration responds in kind has been done.”

          Again with the obfuscation. Unbelievable! Where has anyone denied that CO2 doesn’t respond to increasing emissions? The question is what emissions? FF or natural. Data indicates natural emissions relegate FF emissions to noise.

          While we are at it, what 6 times are you talking about? Remind me how you explain the failure of growth rate of atmospheric CO2 to change when FF emissions surged after 2000.

        • Nate says:

          ‘Obfuscate’.. oh nevermind, waste of energy.

          Here is co2 conc vs cum emissions over last 6 decades of hi-res measurement.

          http://climexp.knmi.nl/data/icum_global_co2_emissions_1958:2020corr13168.png

          6 times refers to 6 decades. Sub-decade is too noisy, again due to ENSO etc.

          • Chic Bowdrie says:

            Your correlation doesn’t prove anything. What evidence do you have that ALL of the rise in CO2 is from those cumulative FF emissions? Look at this similar graph showing what a hypothetical curve would look like if any growth in natural emissions were shown. And my graph only shows the cumulative growth in net natural emissions. If I plotted total natural emissions, FF emissions would be reduced to noise.

            https://www.dropbox.com/s/q4tdqfi0tgaz132/1Emissions%20vs.%20CO2.png?dl=0

          • Nate says:

            hypothetical curve would look like…

            hahahahahah

          • bdgwx says:

            Chic said: Your correlation doesnt prove anything.

            Correlation with a causative mechanism is pretty convincing.

            Chic said: What evidence do you have that ALL of the rise in CO2 is from those cumulative FF emissions?

            Not ALL of the rise is due to FF emissions. There are contributions from land use changes, concrete production, and other non FF based human emission sources.

          • Chic Bowdrie says:

            bdgwx,

            By now I would have thought you could conceive of the possibility that not all of the emissions estimated as non-fossil fuel emissions have been accounted for. Has anyone monitored your yard for grass cutting, tree pruning, wood burning?

            What you and Nate need to do is resolve the dilemma on the table. If estimates of human emissions are 5% of total emissions as a generous upper bound, the maximum amount of CO2 in the atmosphere that can be attributed to them is 5% or about 16% of the rise. Please explain why you guys claim ALL the 130 ppm increase in atmospheric CO2 is human caused.

            Feel free to reference where you have done that previously, if my memory failed.

          • bdgwx says:

            If estimates of human emissions are 5% of total emissions as a generous upper bound, the maximum amount of CO2 in the atmosphere that can be attributed to them is 5% or about 16% of the rise.

            What that means is that the specific molecules emitted by humans account for only 5% of the total molecules. But the mass increase that resulted from the emission of those molecules account for nearly 100% of the total increase.

            Remember…the mixture inside the reservoir can change independently of the total amount contained within the reservoir. In other words, sub species A can increase while sub species B decreases and yet the total amount of the reservoir can remain unchanged. I think this may be the core of the confusion.

            Please explain why you guys claim ALL the 130 ppm increase in atmospheric CO2 is human caused.

            Because…

            1. …”increase” is in reference to the total mass< of the carbon in the atmosphere; not a specific sub species like C14. We care about the entirely of the carbon in the atmosphere. We do not care about how the sub species are mixed. Don't hear what I'm not saying. I'm not saying the distribution of of the sub species isn't important. It is…for other reasons. Just not in the context of how much radiative forcing occurs as a result.

            2. …the only reservoir(s) that have a net flux towards the atmosphere are those modulated by humans. The reservoir(s) modulated entirely by natural processes (with no human influence) have a net flux away from the atmosphere. Human modulated reservoirs are giving carbon to the atmosphere and natural modulated reservoirs are taking it from the atmosphere.

            3. …any new emission from a previously natural process that has been perturbed either directly or indirectly by human behavior is no longer entirely natural. It now has a human component itself. For example, if carbon is release from melting permafrost as an indirect result of rising temperatures that were catalyzed by FF emissions then this new emission carbon from the permafrost is no longer “natural”.

            BTW…I don’t claim that humans are responsible for “ALL” of the increase. What I claim is that humans are responsible for “nearly all” of the increase. I will define “nearly all” as > 90% though admittedly I have no idea where the other 10% could have come from. But my skeptical nature simply does not allow me to make blanket statements like “ALL”.

          • Nate says:

            ” If estimates of human emissions are 5% of total emissions as a generous upper bound, the maximum amount of CO2 in the atmosphere that can be attributed to them is 5% or about 16% of the rise. Please explain why you guys claim ALL the 130 ppm increase in atmospheric CO2 is human caused.”

            1. We have been over this many times. This is horribly bad logic.

            If natural emissions are oscillatory, and average to 0 over a year, then the fact that they are 20 x anthro is irrelevant.

            The issue, as we have discussed, is that it takes a long time to sink carbon added at the surface, to the deep ocean.

            2. If you think that FF emissions can account for only 5% of CO2, then I dont understand your whole population growth meme. Somehow that will give us a 50% rise?

          • Chic Bowdrie says:

            Wow am I sorry I asked. You guys may never get this, but I’ll give it another try.

            bdgwx: “In other words, sub species A can increase while sub species B decreases and yet the total amount of the reservoir can remain unchanged.”

            Since the whole issue involves the atmospheric reservoir increasing at 2.5 ppm/year, that is irrelevant and, no, it is not the core of confusion.

            All of your points have too much misinformation to rebut this late in the weekend. To cut to the chase, I will use another modified Dr. S spreadsheet to explain your dilemma.

            https://www.dropbox.com/s/cmied9i0hq7dyzw/CO2%20sink%20models.xlsx?dl=0

            You both won’t acknowledge an increase in natural emissions. You both haven’t asserted that nature treats FF emissions differently from natural emissions. Therefore in both blue and melon data columns, natural emissions are assumed to be constant at 95 ppm/year. In the blue columns the sink rate for all CO2 molecules in the atmosphere is a constant 0.28. The starting CO2 is 280 ppm. These numbers are arbitrary. Feel free to adjust if you think that will change anything. If you don’t understand the spreadsheet, please say so I can explain.

            The blue curve shows that both natural emissions and the sink rate cannot be constant and still conform to the Mauna Loa data.

            The grey curve, representing the melon columns, shows that to realistically fit the Mauna Loa data (meaning using the same sink rate for all CO2 molecules), the sink rate must drop from about 1/3 to 1/4.

            It is possible that the sink rate could be slowing somewhat due to non-linear rate processes or saturation mechanisms. But claiming that is the case without evidence is hypocritical while denying my claim that natural emissions are rising. You both do that.

            I won’t stop calling you obfuscators, if you can’t be intellectually honest about that.

          • Nate says:

            The problem as I see it is this.

            ” In the blue columns the sink rate for all CO2 molecules in the atmosphere is a constant 0.28. The starting CO2 is 280 ppm.”

            The problem is that this a model, not data. And it is oversimplified.

            It assumes a single reservoir and flux out proportional to level.

            Whereas, we know one reservoir is wrong. We know that the Earth is more complex.

            Your sink rate of .28 is the exchange rate between atm and surface ocean and biosphere. NOT the mass sinkbrate to the deep ocean.

            As evidence, your model fails to explain the 17 y Bomb-14 decay curve.

          • bdgwx says:

            Chic,

            C14 is decreasing. But C14+C13+C12 is increasing. That’s what I mean. Berry measures the C14 decrease but ignores the C14+C13+C12 increase.

            I don’t think the carbon cycle treats human emissions any differently than natural emissions in terms of how the sinks work. One caveat…there is a slight isotope on the sinks but it is insignificant and won’t change any major conclusions. It is important when you want to perform detailed isotope experiments that exploit this preference.

            We don’t acknowledge an increase in natural emissions because there’s little evidence to suggest that they have increased. What would pique our interest is to identify which natural reservoir was tapped and what physical process was in play to make that happen.

            Can you expound more on the link you provided. I’m not sure I understand it. Specifically what does “constant removal rate” actually mean?

          • Chic Bowdrie says:

            Before I forget to mention it, this comment by Nate is classic obfuscation. He cannot participate in any conversation that will lead to a meeting of the minds. Perhaps Seattle would be a good spot for him.

            “The problem is that this a model, not data. And it is oversimplified.”

            I never said it was data, &^%#. I used a spreadsheet model trying to illustrate a point with it as a way of getting through to your thick-headed closed mind. Did you object to Dr. Spencer’s spreadsheet model from which I generated this one?

            “It assumes a single reservoir and flux out proportional to level.”

            I don’t need two reservoirs to demonstrate the point, *&&^^. Do you have any evidence to show that flux out proportional to level is not a reasonable assumption?

            It’s so frustrating that you obfuscate every single paragraph. Sink rate to the deep ocean does not apply in this simplified model. I can do a model that does with a lot of work and no greater learning. You failed to do it yourself even with my help. Sad.

            I can’t explain the bomb decay curve discrepancy as I’ve said on other Dr. S posts. You can’t explain it either, so why do you bring it up? Oh, of course, you are the King of Obfuscation.

          • Chic Bowdrie says:

            You guys are pathetic. You cannot address an issue without changing the subject or just obfuscational jibber-jabber.

            bdgwx: “Berry measures the C14 decrease but ignores the C14+C13+C12 increase.”

            What does that have to do the spreadsheet model I was using to illustrate the dilemma resulting from inadequate accounting of the growth in non-FF emissions?

            “We dont acknowledge an increase in natural emissions because theres little evidence to suggest that they have increased.”

            Yet to my knowledge you presented no evidence they have not increased.

            Thank you for wanting me to expound on the link. I hope to pique your interest in the possible under-estimation of non-FF emissions.

            Constant removal rate means the fraction of the total CO2 in the atmosphere which is sinked remains constant from year to year. That fraction is the inverse of retention time. You may want to check back to the original post where Dr. Spencer introduced the virus effect on emissions. You were involved with my discussions about retention time being constant for first-order processes. If that isn’t clear to you, then let’s deal with that again first before moving on.

            The variable removal rate (or retention time) case applies when the system does not completely obey first-order kinetics.

            It would be great if you would take your next comment down to the end of the comments where I can find it fast. I will be travelling this week and may have little time to respond.

          • Nate says:

            “Its so frustrating that you obfuscate every single paragraph.”

            It is rather pathetic and inconcievable that you keep using that word, especially when you have no answers.

            As Inigo Montoyo says “I do not think it means what you think it means”

            And it should concern you that your model cant work for the bomb curve. Its as close to a test of your model as weve got.

            I can explain it with multiple reservoirs and did already.

          • Nate says:

            “The blue curve shows that both natural emissions and the sink rate cannot be constant and still conform to the Mauna Loa data.”

            Nope it doesnt show that because, as I said, its a model, not data.

          • bdgwx says:

            Chic,

            Thanks for the clarification on “constant”. I saw the removal amount in blue change so I just wanted to make sure I understood what “constant” meant.

            Clearly blue is a bad model, but amber is pretty good. One thing I notice with amber is that it starts with 94.6 removal and ends with 97.7. That means sinks increased by about 3 ppm. That’s great and inline with everything I understand as well.

            What is it about the amber model you have that you feel is incompatible with the IPCC message?

          • Dr Roys Emergency Moderation Team says:

            bdgwx, please stop trolling.

  5. Alan says:

    So all we have to do to get a noticeable reduction is to kill off 4/9ths of the people on the planet and make sure that the remainder don’t increase their per capita energy consumption. Seems simple enough!

  6. UvMeter says:

    Seasonal plant respiration of CO2 also high right now. But enough to offset all those jet contrails? I don’t think so.

  7. It is obvious, as per Roys Comments, that the natural sources of CO2 are > human sourced (fossil fuels and human respiration). How to prove this?
    1) The latest 2019 Carbon budget (Friedlingstein et al 2019), like all previous C budgets use a conversion factor of 2.124 to convert Gt Carbon to ppm CO2 (by volume). No where is the origin of this number explained except by referring to Ballantyne et al 2012 where they say “Atmospheric CO2 concentrations are converted from parts per million to petagrams of carbon by using the conversion factor 2.124 PgC p.p.m -1.This conversion factor implicitly assumes that the annual increases we calculate for the MBL are representative of the entire atmosphere.” So their definition of the entire atmosphere is???? I can tell you. My calcs show the entire atmosphere is only to 8.4 km in height in order for the 2.124 factor to be applicable to the current C budget sources and sinks.
    2)BUT, if one uses the tropospheric and stratospheric volumes capped at 48 km height, then this conversion factor is totally unsuitable. Assuming the entire atmosphere is capped at 48 km then the C budget FF amounts eg 9.98 Gt Carbon in 2018 is only 5-6 ppm out of the total 2018 ML CO2 of 407 ppm. That means there are significant CO2 sources not accounted for in the C budget.
    3) These sources will include significant amounts of oceanic sourced CO2 which increase as the oceans warm-in addition to other unaccounted for sources.
    4)Hence it cannot be a surprise that say an 11% reduction in FF sourced CO2 in April 2020 due to COVID is unmeasurable. ie 11%*2/12 (2 months)*5 ppm = 0.09 ppm reduction in ML CO2 due to FF reduction.

    • Nate says:

      “2)BUT, if one uses the tropospheric and stratospheric volumes capped at 48 km height, then this conversion factor is totally unsuitable. ”

      Lauchlan, we know the total MASS of the atmosphere quite well.

      We use atmospheric pressure: 101,000 N/m^2 to find the weight of a 1 m^2 column. The mass of this column is 101,000/g = 10300 kg/m^2.

      Then multiply by Earth surface area: 4piR^2, we get M = 5.26 x 10^18 Kg = 5.26 x 10^21 g.

      Mostly Nitrogen @ 28 g/mole. So atm contains 5.26 x 10^21 g/28g = 1.88e20 moles.

      1 ppm = 1.88 e 14 Moles. and C has 12 g/Mole so 1 ppm = 12 x 1.88 e 14 = 2.26e15 g = 2.26 Pg/ppm

      Close.

      • Nate says:

        Could get closer by including O2 fraction of atm.

      • Nate,
        I have compared my methodology of calculating atmospheric mass vs Trenberth 2004 methodology, which is what you are using in your reply. Putting aside the water vapour/aq content of the atmosphere for this part of the argument, I have calculated the mass of the atmosphere at 1 km levels from 0-48 km using a thermodynamic simulator which employs an Equation of state (in this case SRKPeneloux (T) (which is no different to PR78 (T) in this atmospheric case. In other words a real gas rather than ideal gas. So using the simulator one can flash the atmosphere at all the 1 km levels of Pressure/Temperature down to the simulators lowest pressure level of 0.01 bar. The flashed parameters of interest at each P/T level are the flashed density at each level. The atmospheric volumes are calculated at each 1 km level using the earths volumetric mean radius of 6371 km. In other words the total mass is not calculated using the surface pressure but the individual pressures at each 1 km level through the atmosphere. In order to match (within 1%) the Trenberth mass using my method, one has to cap the atmosphere at 15 km. This method of mine is far more robust than the standard method you (& Trenberth use). In this case, I have used 0.15% (by volume) water
        up until 8km height (0.41bar & -34.9C Temp) to “match” Trenberths water mass within 16%. (At 7 km Trenberths water mass is 23% higher than mine and at 8km it is 16% less than mine) At 48km being the stratosphere height I have used P/T of 0.02 bar and -6.7C.So again, I ask, what is the definition of the atmosphere in terms of height?

      • Nate says:

        Lauchlan,

        The calculation I showed, and what others use, is absolutely straightforward, fact based, with no assumptions or guesses.. You cannot point out any flaws in it.

        While yours is not straightforward, not checkable, seems to require guessed assumptions, and you get an entirely different answer.

        • Lauchlan Duff says:

          Nate-Yes your calculations are straight forward but wrong. Plse explain how the surface pressure reflects the lapse rates that I (and meteorologists) use?? The only thing debateable with my methodology is what lapse rate to use. I have used USA standard atmosphere lapse rate and NASAs lapse rate equation to get 2 different lapse rates, but the methodology is 100% robust, subject to what lapse rate to use. And so I repeat the question, what is the definition of the atmosphere that your calculation applies to? Troposphere, T+ S?, T+S+M ?

          • Nate says:

            Lachlan,

            “-Yes your calculations are straight forward but wrong.”

            Wrong how?

            Do you dispute that surface atmospheric pressure must equal the weight per unit area on it, in order to balance the weight of the column of air above it?

            Do you dispute the surface area of the Earth in m^2 x the mass on each m^2 gives the total mass of the atmosphere.

            This is basic. No need to go into lapse rate, and all that. The calculation agrees with the value universally used.

            I’m on this blog, admittedly, way too much.

            Hardly a day goes by without someone coming here, like you, to post a new version of:

            ‘How to prove all of climate science wrong with this one simple trick’

            Why do people think that thousands of really brainy experts have somehow missed the simple fact that they, an amateur, has discovered?

            And when we point out the basic error or missing piece of information, that poster has made, always, always, always, the poster will double down, and triple down. and refuse to admit any error.

            Why is that?

      • Nate says:

        And BTW the water mass @ 0.15% will make a negligible contribution.

        • Lauchlan Duff says:

          So my question to you Nate is what atmospheric volume / height is incorporated into your calculation methodology? Infinity to x pressure correlating with what atmospheric level? What I have done is new to climate science (ie using a thermodynamic simulator called PVTSim) but apart from that its basic stuff. And just to reiterate, the simulator outputs a range of thermodynamic variables at each of the inputs (P/T) where in this case the only variable taken from the simulator is the density of the various phases and total. Calc earths layered volumes aint rocket science apart from the choice of what earth radius to use, and I used a NASA volumetric earth radius of 6371km. And so, to repeat what I have said, the total emitted fossil fuel emissions and official sinks, is way under matching the total atmospheric CO2 today which implies unaccounted for sources, which makes sense if all the oceans are warming and hence releasing /sourcing CO2 unaccounted for in the C budget. I am not the only one saying that anthropogenic FFs are only 5-6 ppm of the total. Even IPCC said it a few ARs back, let alone others who have used totally different methodology to the one I have used. eg Hardie / Salby. All of the above explains why April / May 2020 ML CO2 is still climbing as per last year pre COVID ML CO2 data, despite the 11-17% estimated reductions in FF emissions.

        • Nate says:

          “My calcs show the entire atmosphere is only to 8.4 km in height in order for the 2.124 factor to be applicable to the current C budget sources and sinks.
          2)BUT, if one uses the tropospheric and stratospheric volumes capped at 48 km height, then this conversion factor is totally unsuitable.”

          What do you get instead of 2.124? Ive not seen that anywhere?

          “Hence it cannot be a surprise that say an 11% reduction in FF sourced CO2 in April 2020 due to COVID is unmeasurable. ie 11%*2/12 (2 months)*5 ppm = 0.09 ppm reduction in ML CO2 due to FF reduction.”

          This calculation agrees with mine and everyone else’s….

          So that means your factor must not be very different from 2.124.

        • Nate says:

          “I am not the only one saying that anthropogenic FFs are only 5-6 ppm of the total. Even IPCC said it a few ARs back, let alone others who have used totally different methodology to the one I have used. eg Hardie / Salby.”

          Very confusing, because your 5-6 ppm is what you calculated for one year’s anthro contribution, and it is not much different from everyone else.

          It is NOT the total contributed over last century.

          • Lauchlan Duff says:

            Nate,
            The total accumulated FFs between 1750 and 2018 is 22.1 ppm-that is using the official carbon budget ffs and sinks. This number is based on the volume of the troposphere and stratosphere (to 48km) (2.4668E+19)m3. If one uses the official conversion number of Gt C/2.214 to ppm CO2 suggested by Ballantyne and used by the carbon budget community one gets a 2018 value of 386.9 ppm CO2 derived from ffuels. But this 2.124 applies to an atmosphere of only 8-8.5 km high. I didnt use any conversion factors to get my 22.1 ppm except the valid 3.664 used in the Carbon budget to convert Gt C to Gt CO2.(MWt CO2/MWt C) So I just tallied the moles of CO2 added to the atmosphere from 1750 based on the carbon budget Gt CO2 added yearly and divided by the MWT of CO2. Then in another column the moles total in the atmosphere is obtained by dividing the atmospheric volume by MWT of air + added ff CO2. The accumulated CO2 is obtained by dividing the first column by the second ie mols CO2 in atmosphere / mols total atmosphere composition (*1000000) to convert to ppm. In this case I used 1.16mol% water but if I use dry air the accumulated CO2 is 22.2ppm.
            So 22.1ppm FFCO2 /407 ppm total = 5.4% of total atmosphere being anthropogenic.
            So the question is: Why does the carbon budget community just use an atmospheric volume equivalent to 8-8.5km height yet when ozone depletion by CFCs is studied ( where clearly the CFCs have migrated to the stratosphere), then thats OK???

          • Nate says:

            Lauchlan,

            “The total accumulated FFs between 1750 and 2018 is 22.1 ppm-that is using the official carbon budget ffs and sinks. This number is based on the volume of the troposphere and stratosphere (to 48km) (2.4668E+19)m3. If one uses the official conversion number of Gt C/2.214 to ppm CO2 suggested by Ballantyne and used by the carbon budget community one gets a 2018 value of 386.9 ppm CO2 derived from ffuels. But this 2.124 applies to an atmosphere of only 8-8.5 km high”

            This is totally wrong. You already calculated an atmosphere mass that got you very close to the same answer as the rest of humanity.

            Use of the volume in this way makes no sense because the CO2 will be mostly filling the lower altitudes, just as nitrogen and oxygen do.

        • bdgwx says:

          Even IPCC said it a few ARs back, let alone others who have used totally different methodology to the one I have used. eg Hardie / Salby.

          I’d to see what the IPCC actually said.

          May I also suggest to analyzing Salby and Harde (and Berry)’s work with a critical and skeptical eye. Their work is not consistent with what is known about the carbon cycle or the observational evidence. Their models provide no explanation for how the carbon mass got into the atmosphere nor can they predict the future trajectory of the CO2 level since their models are dependent upon temperature which they also cannot explain or predict. Would you like for us to discuss this further?

        • Lauchlan Duff says:

          Nate- I have double checked my PVTSim flashed densities every 1 km through the atmosphere with those of NASA using their formula:
          Density = Pressure (kPa)/(0.2869*T (k). Now I think we are all agreed that Density is kg/m3 and so mass = density * volume. It will take you 30 mins to go and calculate the volumes of every km section above the earths surface to say 48 km. So then applying density* volume for each 1 km section and adding all the 1 km volumes up through to 48 km gives a NASA mass of 2.4234E+20 kg. Using my flashed densities gives 2.4295E+20 kg. Volumes calculated using Re 6371km. So, these masses to 48 km > Trenberths 5.1479E+18kg.
          Now, I have just seen a NASA note on the terrestrial atmosphere:
          Quote:
          Surface pressure: 1014 mb
          Surface density: 1.217 kg/m3
          Scale height: 8.5 km
          Total mass of atmosphere: 5.1 x E+18 kg
          So NASA is saying the calculated mass of 5.1 E+18 applies to up to 8.5 km. So Nate-look at my note of June 6th. I have said exactly the same thing! Trenberths mass only to approx 8km. But the stratosphere to 48 km has more mass!! 2.467E+18 kg in addition to make total mass to 48km = 6.138E+18.

          • Lauchlan Duff says:

            Correction to my comment half way up previous one: Flashed densities to 48 km gives my mass to 48 km of 6.1382E+18 kg and NASA mass to 48 km of 6.1225E+18 kg.

          • Nate says:

            Lauchlin,

            My prev calc of atm mass:

            “We use atmospheric pressure: 101,000 N/m^2 to find the weight of a 1 m^2 column. The mass of this column is 101,000/g = 10300 kg/m^2.

            Then multiply by Earth surface area: 4piR^2, we get M = 5.26 x 10^18 Kg = 5.26 x 10^21 g.”

            If I account for O2, I get 5.19 x 10^18 Kg.

            Surface pressure must support the column weight. Column weight comes from all mass above, including stratosphere. So this number should be the total, and is based on a single measured quantity average surface pressure.

            You are getting 6.12 x 10^18 Kg.

            Not much different, really. Not enough to prove climate science all wrong.

            I think your calculation is ok, but suspect these values are modeled rather than measured. The lapse rate varies dramatically from place to place and with time. This may account for the difference.

          • Nate says:

            https://en.wikipedia.org/wiki/Atmosphere_of_Earth

            Long discussion there, and they get 5.15 x 10^18 Kg

    • Stephen Paul Anderson says:

      But wait, Roy believes natural emission has not changed since 1800. He keeps promoting a model that espouses that.

      • Will says:

        Indeed. That’s the circular reasoning.. ahem.. of the IPCC.

        • Chic Bowdrie says:

          And of Nate, bdgwx, barry, etc. Closed minds afraid of the unknown and unwilling to explore a new paradigm.

        • Nate says:

          Sure we are, given compelling evidence.

          One needs to first understand the current paradigm and the evidence for and against it deeply, as revolutionaries like Galileo and Einstein certainly did.

          They only overturned their paradigms as a last resort, because the evidence led them to do so.

          That’s not where you guys are coming from. You are led by forces other than the evidence.

          • Chic Bowdrie says:

            Blah, blah, etc.

          • Nate says:

            Your ‘closed minds’ and ‘obfuscation’ memes have again moved the discussion out of honest debate territory back to ad-homs, attack the messengers, defend my teams indefensible BS, blah blah

            Where is your new evidence, facts or logic, that could move your sides case forward?

          • Chic Bowdrie says:

            Are you referring to heliocentricity, relativity, radiative forces, or overturning some other paradigm?

            No need or time for any new evidence. It’s a full time job countering your propaganda and obfuscatory comments.

      • bdgwx says:

        SPA, Is there evidence that points to natural emissions increasing?

        Will, I’d like to hear you out. What specifically has the IPCC claimed that you feel is circular reasoning?

        • Stephen Paul Anderson says:

          You know there is. Ed Berry has three really good papers and you continually go back to your Bern model. Chic Bowdrie has gone round and round with you on it but you disregard simple math. You are a leftist propagandist, nothing more.

          • Stephen Paul Anderson says:

            Please BGDWX, tell us where this utopia of yours is? I really want to know.

          • bdgwx says:

            Ed Berry presents a model for explaining the C14 bomb spike and C14-to-C12 ratio depletion. None of his papers present evidence for increased natural emission flux. Nor does he present a hypothesis regarding which reservoir supplied the increase. He has been asked about this point, but is evasive. I did see in the comment section of one blog post where he surmised (after equivocating first) that it must have come from the ocean. Yet…the ocean is a net absorber and so has taken CO2 from the atmosphere; not given it. This is based on ocean pH observations.

          • Chic Bowdrie says:

            bdgwx,

            Based on your extensive knowledge of multiple lines of evidence, where is the evidence that there has not been an increase in natural emissions? (Your insertion of “flux” is obfuscatory.) It is not necessary to define which reservoirs do what to show that Berry’s model works. It requires you to show enough reservoir data to prove his model wrong.

            I am interested in reading the blog post you refer to. The ocean does not have to be the NET source of increase in atm CO2 to validate Berry’s model. But it still could be a net source even while ocean pH decreases. This is because the temperature causes outgassing not necessarily accompanied by a commensurate pH change.

          • bdgwx says:

            Chic said: Based on your extensive knowledge of multiple lines of evidence, where is the evidence that there has not been an increase in natural emissions?

            First…my knowledge is not extensive. It is quite limited. I have a lot to learn still.

            Second…the evidence is that the biosphere and hydrosphere reservoirs have increased their uptake of carbon. They are net absorbers of carbon by a wide margin. They are taking carbon from the atmosphere; not giving it. On the flip side the fossil reservoir is sourcing carbon in the carbon cycle. Carbon is flowing out of it and entering the biosphere and hydrosphere.

            Chic said: It is not necessary to define which reservoirs do what to show that Berrys model works.

            I actually agree with this. Berry’s model is excellent in explaining the C14 bomb spike decay. That’s not the issue. The issue is that he is then taking a giant and incorrect leap that it must therefore explain total mass depletion after a release as well.

            Chic said: It requires you to show enough reservoir data to prove his model wrong.

            He is advertising his model as being able to explain total mass depletion after release. Back testing his model against previous carbon releases and depletion fail…badly. And I mean by orders of magnitude.

            Chic said: I am interested in reading the blog post you refer to.

            DR. ED on JANUARY 5, 2020 AT 3:57 PM

            https://edberry.com/blog/climate/climate-physics/human-co2-has-little-effect-on-the-carbon-cycle/

            Notice how doesn’t actually answer the question asked of him. Instead he equivocates by asking new questions and then points the poster to a Heartland Institute video on YouTube that says “The main cause may be desor.p.tion from the oceans.” So I guess that is his position? If so then we would expect the pH of the ocean to have risen as carbon “desorbed” form it and went into the atmosphere. And no answer was given to why nature so fundamentally changed around 1850 to make this happen.

            Chic said: But it still could be a net source even while ocean pH decreases.

            Absolutely. But for that to happen another reservoir must be transferring more carbon into the ocean than the ocean is transferring to the atmosphere. What reservoir is doing the transfer and why did it suddenly change around 1850?

            Chic said: This is because the temperature causes outgassing not necessarily accompanied by a commensurate pH change.

            This is true. As temperature increases pH decreases without any change in carbonic acid. But this relationship only accounts for a small fraction of the pH. The ocean is definitely accumulating carbon from somewhere. If only we knew of a reservoir that was losing carbon and contributing it to the others…

          • bdgwx says:

            Ya know…if Berry wants to convince others here is what he needs to do. Instead of using the C14 bomb spike isotope ratio decay curve he needs to use total carbon mass (in units of ppm, GtC, or GtCO2) and then use the same methodology on previous release and decay events and see how well the match is. Again…he needs to do his analysis on the total mass and not on a tracer. It would also help if he didn’t confuse residence time with adjustment time and use the terms appropriately in his writings. Do you think this is an unreasonable position?

          • Chic Bowdrie says:

            “He is advertising his model as being able to explain total mass depletion after release. Back testing his model against previous carbon releases and depletion failbadly.”

            Please explain.

            “If only we knew of a reservoir that was losing carbon and contributing it to the others”

            It must be from land sources. I agree that the ocean is a net absorber since it is known that total dissolved carbon is increasing. I can’t explain why Berry would argue otherwise, although I haven’t been realistic about that fact either. Increasing temperature offsets absorp.tion to some degree but not enough to deplete ocean carbon.

            Berry is not confused about residence time. I pleaded with you to explain how adjustment time differs from defining how many residence times it takes to return a pulse to some fixed % of total removal. Remind me where you did that? Don’t remind me how you waffled about it incessantly by doing it again.

            It might help if you would stop claiming that bomb spike data does not apply to total carbon mass removal and start showing why. Think of C14 as a very small mass and the consequences of increasing that amount to annual levels of increasing atmospheric mass. What happens to the residence times as the mass increases even further to a doubling of CO2?

          • bdgwx says:

            Please explain.

            A ~15 year e-fold cannot explain any of the previous carbon release and decay events in the paleoclimate record…none…AFAIK. The PETM release took thousands of years to deplete. The interglacial releases took tens of thousands of years to deplete. I’m unaware of any carbon release event in which the released amount got scrubbed out on a ~15 year e-fold.

            I pleaded with you to explain how adjustment time differs from defining how many residence times it takes to return a pulse to some fixed % of total removal.

            Have I not explained the differences enough?

            Residence Time – The amount of time a specific molecule of CO2 remains in the atmosphere.

            Adjustment Time – The amount of time a unit of mass of CO2 remains in the atmosphere.

            They are different because RT is based on the level and sink rate while AT is based on the source/sink imbalance.

            Berry is not confused about residence time.

            You should look at the exchanges he has with scientists far smarter than I on his own blog. He is asked point blank to clarify his understanding of RT and AT on at least two occasions and it is clear that he doesn’t understand the concepts. He even had Dr. Cawley (who Berry cites) chime in to say that Berry misrepresented his publication. The topic of the paper touches on the differences between RT and AT and the physical processes relevant to both. Berry evades the topic that he misrepresented Cawley’s work and evades the discussion of the differences between RT and AT just like he evaded the question of which reservoir sourced the atmospheric carbon increase.

            I realize that RT and AT are not trivial concepts to mot of us. But to experts on the carbon cycle it is. The fact that Berry misrepresents and misunderstands them is alarming considering that he seems to think he’s figured something that somehow eluded thousands of scientists before him. That’s hubris.

          • Dr Roys Emergency Moderation Team says:

            bdgwx, please stop trolling.

  8. Geoff Sherrington says:

    As I showed on WUWT a week or two ago, the CO2 measurements are at best +/- 1 ppm which places a severe impediment on inferring rates and amounts of change and the allocation of their causes.
    I am with Roy. I consider the changes in CO2 due to lockdowns are likely to be too small to be detected with acceptable confidence.
    See what happens when one actually does the science of getting the raw data and analysing it, instead of listening to propaganda informed by propaganda. Geoff S

  9. gbaikie says:

    The 10 countries with highest population:
    1. China 1,394,015,977
    2. India 1,326,093,247
    3. United States 332,639,102
    4. Indonesia 267,026,366
    5. Pakistan 233,500,636
    6. Nigeria 214,028,302
    7. Brazil 211,715,973
    8. Bangladesh 162,650,853
    9. Russia 141,722,205
    10. Mexico 128,649,565
    https://www.census.gov/popclock/print.php?component=counter
    Percentage of world total counted human CO2 emission in 2017
    {why 2017 when living in 2020. Counting is too hard or Wiki can’t bother to update?}

    China: 29.34%, India: 6.62%, US: 13.77%, Indonesia: 1.38%,
    Pakistan: 0.53%, Nigeria: 0.26%, Brazil: 1.33%, Bangladesh: 0.23%
    Russia: 4.76%, and Mexico: 1.37%
    Totaling:59.59%
    China does about 1/2 and US does about 1/4 and India does less 1/8th.
    Totaling pop: 4,412,042,226
    Out of world pop of 7,654,152,093
    Btw, 59.59% of 7,654,152,093 is about 4,561,109,232
    If these 10 countries had 149 million more people these countries
    it would be world average in in terms of CO2 emissions counted {and counted in 2017}.
    So China emits about 10 billion and that about 30% of total which about 34 billion tons. Or other 9 countries of the 10 emit about 10 billion tons.
    And they have said natural carbon cycle emits around 100 billion and absorbs about 100 billion.
    Here something NASA saying:
    The Slow Carbon Cycle
    “Through a series of chemical reactions and tectonic activity, carbon takes between 100-200 million years to move between rocks, soil, ocean, and atmosphere in the slow carbon cycle. On average, 10^13 to 10^14 grams (10–100 million metric tons) of carbon move through the slow carbon cycle every year. In comparison, human emissions of carbon to the atmosphere are on the order of 10^15 grams, whereas the fast carbon cycle moves 10^16 to 10^17 grams of carbon per year.”
    Or humans emit on order of billions of metric tons and fast natural process do tens of billion to hundreds of billions. And “The movement of carbon from the atmosphere to the lithosphere (rocks) begins with rain. Atmospheric carbon combines with water to form a weak acid—carbonic acid—that falls to the surface in rain.”
    Well, I can’t say that added much in terms precision, but that hundreds of billion of tons can removed and/or only 10 tens billion per year, does seem add something to it. Or forget how much CO2 is in Atmosphere, but somewhere around trillions of tons.
    200 times 8 is 1.6 trillion??

    ” level of carbon dioxide above 415 ppm, the highest concentration of atmospheric carbon dioxide in millions of years. This accumulation represents an additional 135 ppm of carbon dioxide in the atmosphere since the Industrial Revolution, which equates to one trillion tons* of carbon dioxide, or one teraton.”
    So saying 7.4 billion per 1 ppm. So with 415 ppm saying about 3 trillion tons in atmosphere. And Nature remove about 1% to 10% and humans added 1%. And in terms 1 month .1% and terms reducing in couple month .05%. And in environment which remove or add .1 to 1 % in a month. So, just means added a bit less plant food than otherwise would have added.

  10. Brendan says:

    I have analyzed a lot of data and calculated a 44% reduction in CO2 emissions during the lockdown period during February in China. I have not yet calculated March but it will be less, probably around 35%. April is back to 5% – 10% below normal.

    Based on China’s data, I have estimated the instantaneous global reduction in CO2 emissions to be 30% for each of the months of March and April.

    It is not 30% of atmospheric concentration which is 415 ppm that we are looking for. CO2 rises by 2 to 3 ppm each year. It goes up by 8-9 ppm in the seasonal decay cycle and down by 6-7 ppm every year in the seasonal growth cycle. The claim is that all of this 2-3 ppm is from humans. 30% of 2 to 3 ppm is .75 to 1ppm. In reality it was an instantaneous drop in human emissions of 0.75 ppm to 1 ppm in each of the months of March and April 2020, plus a smaller reduction, about half that, in the months of February and May 2020. That should put a severe kink in the Keeling Curve and should be measurable. It hasn’t budged.

    I.e. Over that 4 month period there should be a 2-3 ppm reduction in the atmospheric concentration of CO2 with a very measurable sideways kink.

    We need to take that one step further. Realist scientists and those that follow the scientific method have measured isotopes that show just 4% of all CO2 emissions come from humans.

    Scrutinizing the carbon cycle and CO2 residence time in the atmosphere
    Hermann Harde 2017
    http://www.sciencedirect.com/science/article/pii/S0921818116304787/

    So therefore what the realists are actually looking for and the alarmists are not looking for is 4% of the 30% which is 1.2% of the 2-3ppm. That is 0.024ppm to 0.036ppm.

    That is immeasurable.

    The current situation presents a perfect experiment to “justify” one way or another, the influence of humans in the increase in CO2 levels. If it is as bad as the alarmists make out, then we will see it in the keeling curve.

    So if the alarmists are correct there should be a 2-3 ppm kink in the Keeling Curve. If the pragmatists and realists are correct we should see nothing that is measurable. And that’s what we are seeing – nothing.

    The decay cycle normally ends in the middle of May each year. Here we are at the end of the first week of June and it has not yet turned the corner and is still rising. Further the maximum rise we see in each decay cycle is 9 ppm. This decay cycle has risen the maximum. We don’t even see a little kink. There is a kink in February but that is seasonal and is there every February.

    We proved via isotope measurements that CO2 emissions would have a zero effect on atmospheric concentrations. Now we have proved absolutely by CO2 measurements that human CO2 emissions have zero effect on atmospheric CO2 concentrations.

    It should be noted that the EIA released a report at the end of Q1 2020 showing a projection for CO2 emission reductions averaged over the 12 months of 2020 to be 11%. They did not show any instantaneous reductions. EIA are heavily promoting CO2 emission reductions and the use of unreliable energy sources. They are trying to play down these dramatic reductions in emissions as it doesn’t suit their narrative.

    • Nate says:

      “The claim is that all of this 2-3 ppm is from humans. 30% of 2 to 3 ppm is .75 to 1ppm. In reality it was an instantaneous drop in human emissions of 0.75 ppm to 1 ppm in each of the months of March and April 2020, plus a smaller reduction, about half that, in the months of February and May 2020. That should put a severe kink in the Keeling Curve and should be measurable. It hasn’t budged.”

      You forgot to divide 0.75 ppm by 12 months.

      It should be 0.06 ppm/mo reduction.

      That is well within the noise.

    • bdgwx says:

      And using the 11% over 12 months you cited from EIA that would be about 0.5 ppm less emissions for 2020. That may be close to detectablility, but you’ll have to use some clever signal processing in conjunction with seasonal and ENSO filters to pull that signal out of the noise. Look at Dr. Spencer’s graph…variation above/below the trendline is easily 0.5 ppm even with his ENSO filter turned on.

  11. ren says:

    The first hurricane this season may form in the Atlantic in June.

  12. Clyde Spencer says:

    Roy
    The seasonal variations in CO2 strongly suggest that there is little lag (perhaps two weeks)in the response of the atmosphere to increases and decreases in CO2. The steady increase of the cumulative CO2 is commonly attributed to the human-produced component of the Carbon Cycle. That shows up as (Currently, about 2.5 PPMv per year, or an average [2.5/12] of about 0.21 PPMv per month.) a long-term, approximately linear trend. World-wide emissions fell by an average of 17% in April. [And an unspecified amount in February, March, and May as well!] Now, let’s assume that only half of anthropogenic emissions make it into the atmosphere; or, put another way, only half of that 17% April decline has an effect on the cumulative concentration. That means that of the expected 0.21 PPMv baseline increase expected for EVERY month, there might only be (100% – (17%/2)) x 0.21 = 91.5% x 0.21 = 0.19 PPMv increase in April. This should be a lower bound because it is only for one month and not the approximately 4 months there has been a significant decline in anthropogenic CO2. Instead of a small, but potentially measurable reduction, Scripps is reporting an even larger increase for May of this year, compared to previous years. While the expected change is in the last significant figure of the measurements, I find it surprising that instead of seeing a decline, or even staying the same as last year, there is a claimed increase with sufficient precision to tease out a decline. Admittedly, the changes leading up to the peak in May are primarily driven by terrestrial soil respiration rates. However, the seasonal changes are against a constant background change attributed to humans. I’m not claiming that the anthropogenic contributions dominate at seasonal time scales. I’m only questioning why we are not seeing the “not insignificant” anthropogenic changes, which are probably about -0.1 PPMv for February through May.

    • bdgwx says:

      Human emissions are actually closer to 5 ppm/yr. It is unlikely IMHO that sinks would throttle down quickly enough to reduce their 50% scrub rate. And if we assume 17% reduction for 4 months that is actually a -0.3 ppm difference using the entire 5 ppm/yr baseline. Notice that even with Dr Spencer’s ENSO and seasonal filter applied the variation off the trendline exceeds 0.3 ppm. There’s too much noise and not enough signal…yet. I think with a better ENSO and seasonal filter (likely requiring a complex model) and better signal processing you might be able to eek out the signal. I really think we’d need to see a -2.5 ppm or greater reduction before the anthroprogenic signal can be established with reasonable confidence.

      • Clyde Spencer says:

        bdgwx
        I agree that the anthropogenic contribution is about 5 PPMv per year. That means I shouldn’t have divided the 17% by two, because it is already accounted for in the measured 2.5 PPMv per year of atmospheric CO2. Thus, my estimates should be doubled.

        That is, the estimate for the rise in CO2 for April should be about 0.17 PPMv, or about 0.04 PPMv less then projected, for April alone. I think that your estimates for the other months seem reasonable. All in all, I’d expect to see the growth stalling, not continuing as though nothing had happened.

        • bdgwx says:

          I think we would see growth stalling if the emissions reductions were large enough and persistent long enough to be discernible against the noisy backdrop of natural variation like the annual and ENSO cycles. I don’t think this pandemic induced global recession will be severe enough to get us there.

  13. Clyde Spencer says:

    Roy
    Note that there seems to be a translation problem for quote marks, apostrophes, and minus signs.

  14. ren says:

    Fronts show that the tropical storm will slowly move deeper into the US. It will generate thunderstorms and tornadoes. This is indicated by the high temperature on land.
    https://pics.tinypic.pl/i/01007/4bygqjs7lnmr.png

  15. Crakar24 says:

    LOL

  16. Crakar24 says:

    The above comment is in response to Eben @1

    I don’t understand we were told this satanic 🙂 gas would last in the atmosphere for 1000 years if so why would anyone expect the levels to drop?

    Obviously the 1000 year statement is now considered to be false and the promoters of this theory are desperately trying to imagine away another falsification.

    We were told ALL co2 increases were from human sources ergo if human sources reduce co2 levels should reduce. Now we have to

    Adjust for seasonal variations
    Estimate ENSO influences

    Push it through a computer program and proclaim its very difficult to reduce co2 emissions, did anyone stop to think we have no idea? Because what i see here and elsewhere is this is not settled science

    • bdgwx says:

      Obviously the 1000 year statement is now considered to be false and the promoters of this theory are desperately trying to imagine away another falsification.

      I am unaware of even a single CO2 release in the paleoclimate record in which the mass depleted to pre-release level within 1000 years. But if its so obvious to you that this statement is false then I suspect you are prepared to link to hundreds of lines of evidence that equivocally and convincingly come to this conclusion. Can you provide a link so that we can review the material?

      We were told ALL co2 increases were from human sources…”

      I don’t know about “ALL”, but humans are responsible for most of the increase.

      …ergo if human sources reduce co2 levels should reduce.

      No. That’s not how it works. If you are filling a bucket with water at a rate of 2 gallons/minute and then reduce your fill rate to 1 gallon/minute the level in the bucket will still increase. It’s the same with CO2 in the atmosphere or any substance in any reservoir. As long as the net flux into the reservoir is positive the level of the reservoir increases even if you reduce the flux.

      Now we have to

      Adjust for seasonal variations
      Estimate ENSO influences

      Yes. What Dr. Spencer is trying to do is isolate the human contribution to CO2 level increase. To do this you must control for the seasonal and ENSO cycles. If you neglect to control for known modulating agents your conclusions about the cause of CO2 changes is contaminated by agents you did not want to analyze. The concept of a control is a fundamental tenant of proper experimental design. Can you imagine the backlash Dr. Spencer would be getting had he not included seasonal and ENSO filters in his analysis here?

      Push it through a computer program and proclaim its very difficult to reduce co2 emissions, did anyone stop to think we have no idea?

      No one thinks it will be easy. And just because you have no idea doesn’t mean the rest of us are equally uninformed.

      Because what i see here and elsewhere is this is not settled science

      The fact that humans emitted significant amounts of carbon and other things into the atmosphere is settled in the same way gravity is settled. Our knowledge of gravity isn’t 100% perfect nor is our understanding of the human emissions, but we know enough about both to draw conclusions and make decisions based on the conclusions with high confidence.

      • gbaikie says:

        –The fact that humans emitted significant amounts of carbon and other things into the atmosphere is settled in the same way gravity is settled.–

        All doing is delusionally pretending we are measuring the amount of CO2 is emitted by “industrial type” CO2 emission.
        Part of the delusion is that we actually care about the amount of this CO2 which is being emitted by each country in the world each year. And the delusion requires us to believe a typical government in the world has transparency.
        Or we can pretend that we know that in terms of “industrial type” CO2 emission, China emits about twice as much as the US does.
        We could be way off. We might assume China could more inaccurate than US, as China does not even pretend follow international treaties or agreements.
        One could say the US has political “system” that elevates the importance of international treaties. This “system” is built into US Constitution and we attempt principles regarding the Rule of Law.
        And China government make the Nazi government in comparison seem as though the Nazi government followed international treaties and followed the Rule of Law. The China government violates idea, that nothing can worst than the Nazis, the China government is worst. It has concentration camps. One could argue N Korea is worse, it also has concentration camps. But North Korea will put any of it’s “citizens” in concentration camp whereas China only put Muslims in it’s concentration camps. But anyhow, N Korea is a pawn of China, one can say that N Korea is China’s plantation, so China putting Muslims and N Koreans in concentration camps.
        But US also has transparency issue, one make huge list, if you have half brain and wanted to spend the time to do it, but regarding topic of CO2 emissions there enormous amount of government corruption.
        One could say transparency is very easy, if it regards matters of less importance, but it becomes complicated and murky the more importance it is. But as general rule you need to be able to apply force to cause there to be transparency- and such force, can roughly said to be the Freedom of the Press, otherwise politicans do what politicans do.
        Independent reporting in China is like independent reporting of Saddam’s Iraq, but worse.
        So reported in terms of CO2 emission is what government wants to have reported. And one could even imagine China government want to report more CO2 emission than it actually has- in case you imagine it only wants to report less. But even if honest, such honestly depends on what rules they are “supposed” follow and “correct rules” is limited to something like, “industrial type” CO2 emission. Or if forest burns down that is not a “industrial type” CO2 emission.
        And with corruption, would you count things biomass burning, accurately.

        Anyways, if wanted to limit CO2 emission, you promote nuclear power. If wanted remove CO2, you would plant a trillion trees[and not burn them for biofuel].

      • Clyde Spencer says:

        bdgwx
        You said, “As long as the net flux into the reservoir is positive the level of the reservoir increases even if you reduce the flux.” That is true. But what we would expect to see, but don’t, is a decline in the baseline trend. That is, the residual, if we subtract the measurements attributable to the periodic seasonal variations. However, it should also show in a reduced rate of increase of the combined contributions. What I mean is that if a trend line is fitted to the May averages for several recent years prior to 2020, the projected May 2020 should come in somewhat higher than what has actually been measured.

        • bdgwx says:

          Agreed. The problem is in figuring out what May 2020 would have been had emission reductions not occurred.

      • Dave J Price says:

        but the atmosphere is not a bucket, there are constant flows of carbon dependent on many poorly understood and barely measurable factors that vary across the globe

        throw water into a bucket and the water level increases

        throw water into a pool and the rate of flow increases but the water level stays the same

        is the Earth more like a bucket or a pool? no one really knows

        • bdgwx says:

          If you throw water in a pool its level will increase as well.

          The atmosphere isn’t really like either IMHO. The reason is because unlike a bucket or a pool the atmosphere is a reservoir in which the sinks are modulated by the level. That’s not saying we can’t use bucket or pool analogies to help illustrate how inflows and outflows behave.

          • Dave J Price says:

            no, a pool has mechanisms that kick in at higher water levels to drop the level faster than water can be added (overflow filters at the top), such that the water level cannot be raised at all ever

            the carbon cycle has many flows whose behavior is not well understood and whose estimates have large error bounds… this is why Hansen’s 1988 temperature predictions were so far off (he assumed concentrations would respond more strongly to emissions)

            are the Earth’s carbon cycle mechanisms indifferent to human emissions like a pool? or sensitive like a bucket?

            evidence suggests more like a pool, Mauna Loa can’t even detect a fall in emissions that is probably larger than all human emissions 30 years ago

          • bdgwx says:

            Dave,

            Gotcha. You’re pool has a mechanism to drop the level if it gets to high.

            The atmosphere is more like your pool than a bucket since sinks are partially modulated by the level. Just in a far more complex way.

            Hansen’s 1988 computer model prediction considered 3 scenarios: A, B, and C. None of these scenarios played out. When given the actual scenario that played out the prediction was indistinguishable from observations. See Hausfather et al. 2019. That means a primitive model from 30 years ago was programmed with physics that almost exactly replicated the the warming trend of the following 30 years. What Hansen got wrong was his scenario B guess of how humans would behave and the nature of volcanic eruptions. The lesson…if we want our temperature predictions to be better we should put a significant focus on understanding how human behave and what decisions they will make in the future and on predicting volcanic activity.

            Mauna Loa is not detecting a fall in emissions because that’s not what it is measuring. It is measuring the CO2 concentration. The concentration is modulated by a variety of factors both natural and anthroprogenic. It is the net affect of all sources and sinks that matter. And the human source did not decline enough or long enough to be detectable.

          • TallDave says:

            Again, you seem totally ignorant of some basic facts.

            Hansen’s Scenario A actually *underestimated* emissions. But his *concentrations* were still too high b/c he underestimated carbon sinks. Zeke’s dodge is to ignore the actual temperature prediction Hansen made and judge his concentrations as though he had not predicted something higher.

          • TallDave says:

            of course that level of complete dishonesty from Zeke is par for the course from orthodox climate science and goes a long way toward explaining why every IPPC forecast gets labelled “high confidence” even though the next one always has major revisions

            we’re never going to learn if we pretend we didn’t make any mistakes

          • bdgwx says:

            Dave: Hansen’s Scenario A actually *underestimated* emissions.

            No. I’m sorry, but that is not correct. You can read his paper here.

            https://pubs.giss.nasa.gov/docs/1988/1988_Hansen_ha02700w.pdf

            And you can see graphs of the emissions for each scenario here.

            http://www.realclimate.org/index.php/archives/2018/06/30-years-after-hansens-testimony/

            Hansen’s scenario A overestimated emissions…by a lot. And that was intentional because it was meant to be a worst case scenario.

            Hansen’s scenario C underestimated emissions. And that was intentional because it was meant to be a best case scenario.

            Hansen’s scenario B was considered his best guess. You can see that it too overestimated emissions particularly CFCs on CH4. As you know CFCs were curtailed by the Montreal Protocol; something Hansen did not consider.

            Dave said: Zeke’s dodge is to ignore the actual temperature prediction Hansen made and judge his concentrations as though he had not predicted something higher.

            What Dr. Hausfather was testing was the reason why Hansen’s scenario B was overshot the observation. Was it because of bad inputs or bad model physics? That is the question being answered. And the answer is that the bulk of the mismatch was due to poor input selections.

            Dave said: of course that level of complete dishonesty from Zeke

            What do you feel was dishonest about Dr. Hausfather’s methodology? What would you have done differently? Be specific and be technical.

            Dave said: we’re never going to learn if we pretend we didn’t make any mistakes

            Absolutely.

          • TallDave says:

            trust me, I’ve read Zeke’s paper and talked to Zeke about it… you can believe Zeke or your lying eyes

            http://i90.photobucket.com/albums/k247/dhm1353/Climate%20Change/HansenvUAH.png

            Hansen’s Scenario Line is a temperature prediction based on an “business as usual” emissions scenario… it was clearly labelled as such in his Senate testimony, and emissions (esp. from China) since 1988 vastly exceeded estimates

            Zeke can try to rewrite history all he likes, but only the gullible (i.e. you) are buying the idea you can just re-run his failed Scenario A numbers with the actual concentration numbers Hansen got wrong and declare his model accurate

          • TallDave says:

            http://image.guardian.co.uk/sys-files/Environment/documents/2008/06/23/ClimateChangeHearing1988.pdf

            i mean come on, it says literally in the text just below the diagram that Scenario A temperature predictions “assume continued growth rates of trace gas emissions typical of the past 20 years”

            Scenario B was “emissions fixed at current rates” — does that sond anything like any post-1988 emissions graph you ever saw?

            no wonder Kuhn argued science advances one funeral at a time, the degree of deliberate siege-mentality obfuscation here is just epic

          • bdgwx says:

            trust me, Ive read Zekes paper and talked to Zeke about it

            So Zeke told you personally that he was being dishonest?

            http://i90.photobucket.com/albums/k247/dhm1353/Climate%20Change/HansenvUAH.png

            First…UAH TLT is not the same thing as 2mT. UAH TLT also happens to be an outlier when compared to other datasets that provide TLT-like proxies. Why not include the other datasets in the image?

            Second…what this shows is that neither scenario A, B, or C provides a good match UAH TLT. Given what we know about UAH TLT and the actual scenario that played out this is not a surprise. Why not include the actual scenario that play out and do so for the same layer and weighting for the atmosphere that UAH TLT uses?

            Hansens Scenario Line is a temperature prediction based on an business as usual emissions scenario it was clearly labelled as such in his Senate testimony

            Correct. And the same statement (though different wording) in his original 1988 paper as well. Business as usual is defined as emissions growth rates that are typical of the 70s and 80s. Growth of all GHG trace gases emissions have been less than what they were in the 70s and 80s. And note what Hansen says (pg. 9345 paragraph 2, last sentence)…”Scenario B is perhaps the most plausible of the 3 cases.”

            Zeke can try to rewrite history all he likes, but only the gullible (i.e. you) are buying the idea you can just re-run his failed Scenario A numbers with the actual concentration numbers Hansen got wrong and declare his model accurate

            I’m not suggesting we rerun scenario A. What would the point be? What we want to know is if Hansen’s input guesses or his model physics is the cause for the mismatch with reality. To do that we want to rerun his model as-is just with inputs that are representative of actual human emissions of all trace gases CO2, CH4, NO2, CFCs, etc.

            Make no mistake. Hansen did not get the temperature trajectory 100% correct. But it was not because his model was wrong. It was because he guessed wrong at the inputs. That’s not to say that his model could not benefit from improvements though.

            Scenario B was emissions fixed at current rates

            In his 1988 paper he describes scenario B as having decreasing trace gas growth rates such that the annual increase in greenhouse gas climate forcing remains approximately constant. This is for all GHG trace gas species taken in aggregate.

            does that sond anything like any post-1988 emissions graph you ever saw?

            No. Post 1988 climate forcing was less than represented by scenario B. Again…this primarily because of lower CH4 and CFC emissions.

          • bdgwx says:

            So Zeke told you personally that he was being dishonest?

            That came out wrong. What I meant to ask…You talked to Zeke personally and from that conversation you concluded that he was being dishonest?

        • Nate says:

          “is the Earth more like a bucket or a pool? no one really knows”

          I think you mean YOU really dont know.

          Science has learned quite a lot about the carbon cycle of the Earth.

          You should perhaps go read about it before declaring what we dont know.

          • TallDave says:

            haha no, a pools water level is constant, have you ever seen a pool with variable water level?

            doesnt matter how much water you pour in, the pool has mechanisms that kick in at higher water levels to drop the level faster than water can be added

            if you think the carbon cycle is well understood you haven’t been reading the literature — sounds like you have a lot of learning ahead 🙂

          • bdgwx says:

            Dave,

            Yes. My pool’s level is not constant. Water must be added when the level drops and removed when the level rises. For me this is a manual process.

            The carbon cycle isn’t understood with 100% perfection. And it never will be. But that does not mean our understanding is 0% either. Knowledge and understanding is not a binary concept. It is a spectrum in which new information continually increases it. Just because YOUR level of understanding maybe 0% does not mean everyone else’s level of understanding is equally as low. Scientists know a lot about the carbon cycle and their knowledge is continually increasing.

            Yes. We still have a lot of learning ahead of us. It never ends.

          • TallDave says:

            YOUR level of understanding seems awfully limited, have you even heard of Born or Petterson?

          • bdgwx says:

            My personal level of understanding of the carbon cycle is extremely limited; far more limited than the experts who studying it for a living. I have a lot to learn.

            No. I am not aware of Born and Petterson. Is there something specific I should know?

          • TallDave says:

            Born and Petterson do, in fact, study the carbon cycle for a living and have proposed alternate models, GIYF but here’s an intro to the bomb curve hypothesis

            http://hockeyschtick.blogspot.com/search?q=pettersson&max-results=20&by-date=true

          • bdgwx says:

            Ah…The Bern model…yes. I’m familiar with that. I’m also familiar with the C14 bomb spike. I’m also familiar with ill-informed attempts at discrediting the Bern model by using the C14 bomb spike. like what Berry, Salby, and Harde have attempted. We’ve discussed it many times on this blog.

            Pettersson is partially correct here. He is correct in that the Bern model does not sufficiently explain the C14 bomb spike decay curve. What he is incorrect about is his implication that it should explain it. That’s not what the Bern model is designed to do. What it is designed to do is explain and predict the aggregate mass depletion curve. That is different than explain or predicting a tracer depletion curve. Showing how the Bern model does not match the C14 decay curve does not in anyway invalidate the Bern model.

            Before we attempt to explain how this works let me ask you this…are you familiar with the concepts of residence time and adjustment time? Do you understand what each is measuring and how they differ? And why does it even matter?

          • TallDave says:

            no, not the Bern model

          • bdgwx says:

            That’s what Pettersson attempted to discredit. Would you like to discuss why Pettersson’s argument is invalid?

          • Nate says:

            “haha no, a pools water level is constant, have you ever seen a pool with variable water level?”

            Not sure what pools you are talking about, after a big rain, pools Ive seen have more water in them.

            In any case, no point in talking about pools when we have the real Earth and the known facts about its climate cycle. They dont agree with Berry or you.

            As with the claims of Berry et al, you offer no explanation of where the extra anthro carbon went.

            Where the extra natural carbon came from?

            What caused it to be constant for millenia and only rise sharply when emission rose?

            What caused it to increase since 1950 in a highly improbable coincidental decade-by-decade match to emissions?

            What causes its isotope match to anthro?

            and many more.

    • Gerald Stewart says:

      Crakar24
      You’re on to them, If you an I can work it out it doesn’t say much for the so called 97% of scientists who say that the science is settled,
      Dear Lord please save us from these nutjobs.

      • bdgwx says:

        I like give people the benefit of the doubt; even those who claim they’ve figured something out that has somehow eluded thousands of the world’s scientists for decades while simultaneously mocking them by calling them “nutjobs”. So here is your chance. What did you work out? How did you work it out? And what evidence can you present to convince us that your work is valid?

    • Nate says:

      “We were told ALL co2 increases were from human sources”

      Nope. Strawman.

      ” ergo if human sources reduce co2 levels should reduce. Now we have to

      Adjust for seasonal variations
      Estimate ENSO influences”

      Yep, and why not?

      We understand very well that there are natural sources and sinks for CO2.

      Why would you expect these natural sources and sinks to turn off, because humans have added a new source?

      “Push it through a computer program and proclaim its very difficult to reduce co2 emissions, did anyone stop to think we have no idea?”

      This is ordinary science in action. Collect data on the Earth and analyze it, consider all factors,…with a computer.

      Did you expect them to use a slide-rule?

      When Roy considers all factors, natural variation turns out to be larger than the predicted SIGNAL caused by the short-term reduction in emissions.

      Nature doesnt give up its secrets so easily.

      A longer or larger reduction is needed to clearly detect the global signal.

      Regional is another story.

      • TallDave says:

        We were told ALL co2 increases were from human sources
        “Nope. Strawman”

        o rly… well please stop by the IPCC office to collect your Nobel prize if you can prove that

        “The present atmospheric CO2 increase is caused by anthropogenic emissions of CO2. About three-quarters of these
        emissions are due to fossil fuel burning. Fossil fuel burning (plus
        a small contribution from cement production) released on
        average 5.4 0.3 PgC/yr during 1980 to 1989, and 6.3 0.4
        PgC/yr during 1990 to 1999. Land use change is responsible for
        the rest of the emissions”

        https://www.ipcc.ch/site/assets/uploads/2018/02/TAR-03.pdf

        every official agency (e.g. EPA) says “all” or “almost all” — you really should develop some basic familiarity with the topic

        • bdgwx says:

          Yes. Present atmospheric CO2 increases are almost entirely the result of human emissions. But past increases like during the interglacials of the Quaternary Period or the PETM event and other ETMx events were entirely natural (ya know…because humans weren’t around or capable of it). And the important point here is that the laws of physics don’t care who/what put the CO2 in the atmosphere. It results the exact same radiative forcing either way. All things being equal it results in the exact same amount of warming.

          • TallDave says:

            wilfully obtuse, we were talking about the present

          • bdgwx says:

            I’m not sure Nate was on the same page as you. Or perhaps his statement was in the context of the present but he focused on the “ALL” part of your statement. I don’t know.

            Either way…most (though maybe not exactly 100% or “ALL”) of the CO2 increase is likely the result of human emissions. Pretty much everyone agrees with that even most “skeptics”. It’s not a seriously contested point. What is contested is exactly how long it will take for the present increase to deplete to pre-industrial levels once a decline starts. The estimates encompass a pretty large range…a couple hundred to a hundred thousand years. That is definitely debatable.

          • TallDave says:

            in fact “most” would be a very skeptical position, the IPCC is quite adamant that the answer must be “all” or “nearly all” and most skeptics agree

            so yes, the original poster’s point stands — the IPCC has in fact staked out this position and must defend it

          • bdgwx says:

            I think the IPCC defends that position pretty well.

          • TallDave says:

            again, obtuse, and you’ve wasted enough of my time

          • bdgwx says:

            We can discuss details or specific lines of evidence favoring the IPCC’s position. Is that a waste of time?

          • Chic Bowdrie says:

            “Either waymost (though maybe not exactly 100% or ‘ALL’) of the CO2 increase is likely the result of human emissions. Pretty much everyone agrees with that even most ‘skeptics’. Its not a seriously contested point.”

            That is a major whopper. I wish I had the time time to counter all the misinformation your bloviating spews out.

            Good, at least, you are acknowledging the debate on the depletion curve.

        • Nate says:

          “We were told ALL co2 increases were from human sources
          ‘Nope. Strawman’

          “o rly well please stop by the IPCC office to collect your Nobel prize if you can prove that”

          No need. You’re ignorant assertion is obviously false, unless you can show us the quotes.

          The seasonal natural oscillation has been known since 1950s.

          The papers explaining the natural INCREASES and DECREASES of CO2 due to ENSO go back 35 y or so.

          C. D. Keeling, R. Revelle, Effects of El-Nio Southern Oscillation on the atmospheric content of carbon dioxide. Meteoritics 20, 437450 (1985).

      • Nate says:

        “The present atmospheric CO2 increase is caused by anthropogenic emissions of CO2.”

        The context clues should tell any intelligent reader the meaning of ‘the present atmospheric CO2 increase’ is not this MONTH’s increase, it is this CENTURY’s increase.

        The IPCC is all about climate change not short term weather.

        • Nate says:

          And the ‘ALL’ comment was made in the context of Roy analyzing the short-term wiggles month to month, which are WELL KNOWN to be influenced by natural variation.

          That was the whole point of his post and my comment.

          Cmon the ‘We were told ALL co2 increases were from human sources’ is a blatant strawman.

          • Chic Bowdrie says:

            It is contemptible how you and bdgwx continue to mislead, obfuscate, and otherwise twist the discussions without acknowledging the weakness of your positions.

            The “ALL” comment clearly referred to the generally accepted warmist view that the gradual (over several decades) rise in CO2 is anthropogenic. IOW, natural emissions remaining constant. I have explained repeatedly how the Berry/Harde/Salby presentations show that FF emissions cannot account for all of the rise in CO2 using any physically meaningful model. I demonstrated with a modification of Dr. Spencer’s model how natural emissions may have contributed substantially to the rise.

            You countered with the vacuous “what other sources” without acknowledging the obvious contributions from population growth unrelated to FF and the century long increase in global temperature. Never have you demonstrated how our models are wrong.

            Your reference to short-term wiggles is a red-herring having nothing to do with the fact that Dr. Spencer, the IPCC, and all Berry/Harde/Salby protagonists claim that humans are responsible for ALL of the rise in CO2 at least since Muona Loa measurements began.

          • Nate says:

            Here we go again with your ‘obfuscation’ bullshit. You just can’t help yourself. Just stop this BS right now!

            The ‘we were told All…’ comment was patently a strawman when you read the context.

            My point and Roy’s point is very clear. The short term natural variations CAN be UP or DOWN. As I showed the literature 35 years ago shows that ENSO causes UP and DOWN CO2 variations.

            Again, no one, certainly not the IPCC, is suggesting that natural CO2 variation has turned off.

            Real science means accounting for all known confounding variables.

            The STRAWMAN is that we dont need to.

          • bdgwx says:

            Chic,

            Let me first say that my position is not my own. I advocate for the theory that provides the best match to reality over a wide variety of test cases. This is the theory that the scientific community has analyzed ad-nauseam and deemed the best there is. It has wide acceptance by the overwhelming majority of reputable scientists and scientific institutions.

            You are advocating for a position from 3 guys only 1 of which passed peer review and that was only because it was submitted unethically and in bad faith and got admonished from the journal once it was determined what happened. All 3 of them 1) conflate the concepts of residence time with adjustment time, 2) fail to provide adequate explanations for the reservoir sourcing the carbon increase in the atmosphere, 3) cannot explain why all previous carbon release and depletion events took thousands and even tens of thousands of years to play out yet proclaim that the contemporary event is orders of magnitude faster in timing, 4) find no interest in explaining why the fossil reservoir was tapped at the same time in proportion to the atmospheric increase, 5) find no interest in explaining why C and O2 isotope ratios changed they way they did, 6) assume the carbon cycle is so simple that they neglect physical process limitations like the Revelle Factor, and probably a bunch of other stuff I failed to mention.

            Sure…it’s possible that these 3 guys figured out something that has somehow eluded thousands of other experts, but past experience tells us that the odds are infinitesimally small. And considering the criticisms of their work the odds are certainly much lower still.

          • Chic Bowdrie says:

            Nate,

            Obfuscation is often your MO. And I will continue to call you on it whenever I please.

            The context of “ALL” is subjective and depends on how one interprets it. I interpret it from exactly where Crakar24 first wrote it:

            “We were told ALL co2 increases were from human sources ergo if human sources reduce co2 levels should reduce. Now we have to

            Adjust for seasonal variations
            Estimate ENSO influences

            Push it through a computer program and proclaim its very difficult to reduce co2 emissions, did anyone stop to think we have no idea? Because what i see here and elsewhere is this is not settled science”

            No change in natural emissions means that ALL CO2 increases were from human sources. That’s what we were and still are being told.

            You obfuscate by claiming seasonal variations and ENSO influences have something to do with what we are told, that the long term rise in CO2 are ALL from human sources. Short term natural variations have nothing to do with the long term trend in CO2.

            Suggesting that natural CO2 variation has turned off is a strawman. Suggesting that someone says we don’t need to account for all known confounding variables is a strawman. But it is par for the course if you intend to obfuscate.

          • Chic Bowdrie says:

            bdgwx,

            As long as you continue to advocate and defend the IPCC position, it is your position. This is not a high school debate where you argue an opposing position for practice. Get real man.

            Arguing wide acceptance by the overwhelming majority of reputable scientists and scientific institutions is a logical fallacy called an appeal to authority. It is not a scientific argument.

            1) The three are less confused about residence time and adjustment time than you are because you think you know what they think. Who made you the judge of that? 2) Failure to quantify reservoir sourcing adequately does not invalidate the Berry/Harde/Salby models. You need to provide the counter evidence proving them wrong. 3) The time frame of past carbon release and depletion events have little to do with judging residence times or adjustment times today. Present conditions could go on for thousands of years with little change in CO2 for all we know. 4) The relative sources of the rise in CO2 is exactly the debate that the three have generated. No interest??? 5) This I cannot respond to as I am not familiar enough with isotope change data. 6) How can you presume to know what the three assume about the carbon cycle? How does the Revelle factor negate the three’s models? Can you explain how the Revelle factor means that nature will treat FF carbon different than from any other source?

            What do odds have to do with science?

          • Nate says:

            Chic,

            You are not looking at this logically, you are simply being TRIBAL.

            “No change in natural emissions means that ALL CO2 increases were from human sources. Thats what we were and still are being told.”

            The rise in CO2 attributed to anthro has happened over decades, with lots of natural variation on top.

            If you guys were being honest, ‘no change in natural’ means continuation of natural variation.

            “You obfuscate by claiming seasonal variations and ENSO influences have something to do with what we are told, that the long term rise in CO2 are ALL from human sources. Short term natural variations have nothing to do with the long term trend in CO2.”

            Then it makes absolutely no sense for you guys to look at the 3 month record, and make ANY conclusion.

            “Suggesting that natural CO2 variation has turned off is a strawman.”

            Obviously not since you guys keep ignoring it.

            “Suggesting that someone says we dont need to account for all known confounding variables is a strawman.”

            Thats exactly Crackars complaint, that we shouldnt have to do that.

            Cmon, guys.

          • Nate says:

            “Arguing wide acceptance by the overwhelming majority of reputable scientists and scientific institutions is a logical fallacy called an appeal to authority.”

            Yes, but it is important to note that lots people with bona fide expertise, who are familiar with way more literature than us, have concluded that the evidence is strong for anthro carbon. That matters.

            IOW you guys dont need to rely on BDGWX and my word.

            Implicitly, you guys have a bias in favor of contrarion positions.

            Being contrarion against the mainstream view seems, for you guys, to make Berry/Salby more likely to be right.

            When, in reality, the opposite is much moreikely.

          • Chic Bowdrie says:

            This is why you are the Kind of Obfuscation.

            “The rise in CO2 attributed to anthro has happened over decades, with lots of natural variation on top.

            If you guys were being honest, no change in natural means continuation of natural variation.”

            Lots of variation on top? What the heck does that even mean? Take another look at Dr. Spencer’s model and notice he sinks annual amounts of CO2 by a fraction of the difference between present CO2 concentration and a figure assumed to be the concentration before the start of the industrial age. That figure is assumed to result from the same level of natural sources and sinks today, meaning that ALL of the rise in atm CO2 is due to humans not nature. Can you see your way to an amen on that or will you spin it somehow?

            My next comment, if there is one, is going down to a new thread.

          • Nate says:

            ‘The rise in CO2 attributed to anthro has happened over decades, with lots of natural variation on top.

            If you guys were being honest, no change in natural means continuation of natural variation.’

            CB “Lots of variation on top? What the heck does that even mean?”

            If you were at all familiar with the data, you would know exactly what that means. Are you?

            “Lots of Natural variation” means the peaks in CO2 growth rate in 1998, 2016, and troughs in 2008, and 2011-2012, due to well known ENSO effects.

            These affects have presumably been there since way before the rise of the 20th century.

            Given this background noise, as Roy explains, it is difficult to draw any conclusions about the anthro signal from 3 months of data.

            If you guys can draw useful conclusions when Roy cannot, show us how to do that.

          • Chic Bowdrie says:

            I’m not “you guys.” You are the TRIBAL one defending your Team tooth and nail. What an obfuscatory hypocrite you are!

            No response to my pointing out how Dr. Spencer’s spreadsheet model assumes that ALL the rise in CO2 is due to human emissions?

            How much more familiar with what data do I need to be? I modified Dr. Spencer’s spreadsheet model to show how correct physical math will explain the Mauna Loa data equally well by allowing a modest increase in natural emissions not accounted for by land use changes. This is reasonable based on the exponential growth in population. I think this is a “useful conclusion” that will one day be, if it has not already been, verified by data.

            So many obfuscations, so little time.

            I already explained why there has been too little change in FF emissions during the past 3 months to be any more than noise. You don’t seem to grasp the fact that it is not just due to natural variation. It has more to do with FF emissions being 1/20th of natural emissions and that growth in natural emissions contribute to the rise in CO2. But you want to skate around that because it doesn’t fit your closed-minded warmist dogma.

          • Nate says:

            “show how correct physical math”

            Ha ha.

            “will explain the Mauna Loa data equally well by allowing a modest increase in natural emissions not accounted for by land use changes”

            Not modest. Completely made up. No evidence for it. Land use effect properly estimated is way way too small.

            Occam just rose from the dead and barfed.

            Nobody will objectively find this ideology-driven, evidence-lacking, explanation more satisfactory than one using real data, and logical analysis.

            Go get some new evidence!

          • Nate says:

            “I already explained why there has been too little change in FF emissions during the past 3 months to be any more than noise.
            You dont seem to grasp the fact that it is not just due to natural variation. It has more to do with FF emissions being 1/20th of natural emissions and that growth in natural emissions contribute to the rise in CO2.”

            ALL rise should be anthro, not a strawman, but not really because long term only, wht natural variation?. 3 month is too short, but Im still going to try and say it supports my model, bla bla bla.

          • bdgwx says:

            Chic said: growth in natural emissions contribute to the rise in CO2.

            Which reservoir via entirely natural processes started transferring more carbon to the atmosphere?

            And if the human emissions of 260 ppm contributed little if any to the rise then where did it all go?

          • Chic Bowdrie says:

            Nate: “Land use effect properly estimated is way way too small.”

            Purposely obfuscating or do you need a do-over on that sentence?

            Nate: “ALL rise should be anthro, not a strawman, but not really because long term only, wht natural variation?. 3 month is too short, but Im still going to try and say it supports my model, bla bla bla.”

            Purposely obfuscating or do you need a do-over on that paragraph?

            bdgwx: “And if the human emissions of 260 ppm contributed little if any to the rise then where did it all go?”

            Purposely obfuscating or do you need a do-over on your premise?

            As I wrote before, the total carbon in the ocean is increasing despite rising temperature. Therefore both are contributing more than previously, but the land reservoir must be contributing most of the natural emissions not accounted for in the estimates of anthropogenic emissions.

          • bdgwx says:

            Chic said: As I wrote before, the total carbon in the ocean is increasing despite rising temperature. Therefore both are contributing more than previously,

            If the total carbon in the ocean is increasing (which I agree with) and if the ocean still has a net flux towards the atmosphere then that means yet another reservoir must have a net flux towards the ocean to not only offset the lost mass from the ocean to the atmosphere but to also increase the carbon in the ocean despite the loss to the atmosphere. What reservoir are you invoking to make that happen?

            Chic said: but the land reservoir must be contributing most of the natural emissions not accounted for in the estimates of anthropogenic emissions.

            Which physical land based process increased it’s net flux towards the atmosphere equivalent to 100 ppm over the period in question?

          • Nate says:

            “This is reasonable based on the exponential growth in population.”

            Oh really? A correlation = causation from you of all people?

            What natural source of carbon increases reasonably in step with population?

            Agricultural land use has grown exponentially along with population, meat production has grown exponentially, energy use has grown exponentially along with population, fossil fuel use has grown exponentially along with population.

            All of these have been analysed, and of these, FF use is the largest contributor.

            For some reason, you hope against hope that FF use is somehow not the largest. But show us actual data or analysis that demonstrates that.

          • bdgwx says:

            What natural source of carbon increases reasonably in step with population?

            Good question. I’ll add the follow up question…if a “natural” source of carbon increases in proportion to human population then is it really “natural”?

          • Chic Bowdrie says:

            bdgwx: “Which physical land based process increased its net flux towards the atmosphere equivalent to 100 ppm over the period in question?”

            According to my model, the combined land and ocean reservoirs need only have contributed 33 ppm since 1750. I said mostly land probably from decomposition, a biological process of breaking down an organic material into smaller constituent parts.

            Nate: “What natural source of carbon increases reasonably in step with population?”

            I think you answered your own question.

            Nate: “For some reason, you hope against hope that FF use is somehow not the largest.”

            Pure unadulterated obfuscation, possibly a result of too much sitting on your head. The doctor is…needed.

            Nate: “But show us actual data or analysis that demonstrates that.”

            My spreadsheet model indicates that increases in natural emissions do not need to be larger than FF. 33 ppm for total net natural growth vs 207 ppm since 1750 for Boden et al. 2017 from Dr. Spencer.

            bdgwx: “If a ‘natural’ source of carbon increases in proportion to human population then is it really ‘natural'”?

            Which way do you want it? Should we say it’s all anthropogenic and admit that the Boden estimates are too low in that they under count land use changes, etc. or admit that there is another category of non-FF emissions we can tolerate so as not to have to promote genocide? I prefer the latter because I want to keep my energy privilege without having to wipe out a few generations.

          • bdgwx says:

            Chic said: According to my model, the combined land and ocean reservoirs need only have contributed 33 ppm since 1750. I said mostly land probably from decomposition, a biological process of breaking down an organic material into smaller constituent parts.

            One way to test this hypothesis is to see how biomass has changed. If it has increased then the biosphere was a net absorber during the period of interest. If it has decreased then the biosphere is a net emitter. Has biomass decreased? And has it decreased by the appropriate magnitude to account for 33 ppm?

            Chic said: Which way do you want it?

            I just want the best answer possible. If we have overestimated FF emissions and underestimated land use emissions then so be it. My only point here is that if human behavior has disrupted a physical process that was once wholly natural then that change that was induced is not natural. It’s anthroprogenic and as such you tally it in the anthroprogenic column.

          • Chic Bowdrie says:

            I doubt FF emissions have been overestimated. There is no zero sum game at this level.

            With all the increased population utilizing God’s gift of this temperate climate, it is no surprise to me that the decomposition economy is growing. I worship the Creator not the creation. Disrupting physical processes is why we are here, IMO.

            Call it anthro or natural whatever, let’s just get the science right.

  17. Dan Pangburn says:

    Comparison of TPW CO2 & T thru May 2020 demonstrates that temperature follows TPW (water vapor) and not CO2 https://drive.google.com/file/d/1C0MR-SOI54L-8-DRsmajHbAnLV3yVN2H/view?usp=sharing

    • Entropic man says:

      Actually you have it backwards.

      TPW is following temperature.

      • Dan Pangburn says:

        Ent,
        Many have made the same mistake that you just made. Did you not even look at the graph? You need to dig a little deeper into the science. If you do it correctly you will discover that WV has been increasing faster than possible from temperature increase. If you do not know how, click my name.

        • Entropic man says:

          I see what the graphs show.

          Water vapour increasing with temperature as expected.

          While temperature increases with CO2 as expected.

          No links, I’m afriad. The site won’t let me.

          • Dan Pangburn says:

            Ent,
            The graph shows the water vapor increasing faster than possible from temperature increase. I can show it to you but I cannot understand it for you. A detailed explanation along with the algorithm for doing the calculation are provided.

            Clive got it wrong. In fact that entire concept (which he is using) is bogus. It does not acknowledge thermalization and reverse-thermalization. Thermalization and/or reverse-thermalization occur continuously throughout the atmosphere. The combination of thermalization and the steep gradient of WV molecules causes much of the energy absorbed by CO2 to be shared with (redirected to) WV molecules which radiate it to space. This energy transfer and WV population decline produce the notch and ‘hash’ in Top of Atmosphere (TOA) graphs of radiation flux vs wavenumber/cm. A more detailed assessment is at https://watervaporandwarming.blogspot.com

        • Entropic man says:

          Go to omni calculator.com and look up vapour pressure formulae

          • Dan Pangburn says:

            Ent.
            Numerical data for water vapor pressure is widely available. The fairly narrow temperature range of interest in earth climate is discussed in Section 4.

            You have been egregiously misled by people who have not correctly accounted for the increasing water vapor. In fact many even refuse to acknowledge that WV has been increasing. Further, they dont appear to understand typical TOA graphs of flux vs wavenumber. All this stuff is explained in the analysis at https://watervaporandwarming.blogspot.com but you have to actually try to understand it.

    • Entropic man says:

      Did a quick calculation.

      The temperature increase of 1C from 1967 would be expected to increase TPW by 6.25%.

      Your graph shows an increase of 4%.

      If anything the increase is less than expected, not more as you claim.

      You’ve an error somewhere, either in your theory or your calculations. Either way, your results are a poor match to reality.

      • Dan Pangburn says:

        Ent,
        You didn’t show your calculations so I can’t tell where you went wrong. I suspect that confirmation bias clouded your thinking. An obvious mistake is the increase in WV is from 1988 not 1967. The only meaningful assessment is from trends. The trend increase in Had-CRUT4 temperature 1988 to 2020 is 0.7 – 0.15 = 0.55 K. By your calculation using 6.25% per K amounts to 0.55 * 6.25% = 3.44 %. I used a conservative factor of 7.37% per K which results in 0.55 * 7.37% = 4.05%. Measured increase in WV 1988 to 2020 is 1.35 kg/m^2 for an increase of 1.35/29 = 4.65%. Either way, you are wrong as demonstrated in Figure 7.

    • TallDave says:

      interesting idea… how does the total WV content of the atmosphere compare to human vapor emissions?

      wondered a few years back how much human water usage would have to increase to affect sea levels and the answer there seems to be “by a few orders of magnitude” but then of course the hydrosphere masses about 300x what the atmosphere does so that seems like it might be in a relevant ballpark

      • bdgwx says:

        WV emissions (whether human or natural) are not able to induce long term changes in the temperature. The reason is because it is a condensing gas that is in a stable equilibrium with the temperature. If a perturbation causes WV to increase/decrease above/below the equilibrium level it condenses/evaporates to drive itself back toward the equilibrium. In this manner it cannot catalyze a long term temperature change on its own. What it can do is amplify a temperature change that was catalyzed by another agent. But understand that this amplification has a braking term that clamps the effect. That’s why it is said to amplify changes, but not catalyze them. Our understanding of the thermodynamics and physical processes in play here is very well understood and intuitive since the Earth never experience runaway warming from evaporating oceans.

        • TallDave says:

          thanks for not answering the question at all

        • bdgwx says:

          The specific answer to your question is unknown to me. I’ll see if I can look it up. If you find the answer before me I would be interested in knowing as well. My hunch is that we emit a lot. And I truly mean a LOT.

          But the “read between the lines” answer to your question is that human WV emissions have little if any impact on the long term climate for the reason I stated.

          • TallDave says:

            the original poster already explained why he believes you’re wrong, unless you can manage a better signal to noise ratio consider yourself muted

          • bdgwx says:

            The original poster uses a model he created and which has not been vetted. His model also provides no explanation for the temperature increase AFAIK. This is a problem because his model is dependent upon it. That means his model cannot predict the future WV trajectory. His model is also inferior to those that already exist and are used widely in the atmospheric sciences already. Existing models already sufficiently explain and predict WV concentration and do so with superior skill.

          • Dan Pangburn says:

            bdg,
            You have been egregiously misled. Essentially everything that you assert is wrong and you apparently dont understand what I show.

            If the method I used, as explained in Section 7 is not something that you can follow, then us the simplistic calculation provided above at https://www.drroyspencer.com/2020/06/covid-19-global-economic-downturn-not-affecting-co2-rise-may-2020-update/#comment-484468 . The temperatures are measured that are used to calculate the WV increase either by the algorithm provided in Sect 7 or by the 7.37% factor and the WV increase thus determined is less than the measured WV increase.

            Explanation for the temperature increase, a 96+% match with measured 1895-2018 is shown at http://globalclimatedrivers2.blogspot.com

            The existing GCMs calculate the WV based on temperature increase. That is wrong. The actual measured WV increase is more than that. That is part of why the GCMs do such a poor job of predicting and back casting.

          • bdgwx says:

            Dan,

            My apologies for misrepresenting your model then. I was focused on section 8 where WVn = WVn-1 + (Tn – Tn-1)*R*A.

      • Dan Pangburn says:

        Tal,
        The water all ends up back in the ocean minus a little which is the measured increase in water vapor and plus a little from the essentially worldwide reduction in water tables. I doubt that it is enough to measure directly but could be calculated indirectly . . . if anybody is interested.

  18. Bart says:

    Who’da thunk it?

  19. ren says:

    “Cristobal is forecast to intensify and become post-tropical later today as the energetic upper trough approaches from the west. Winds are forecast to reach gale force over the waters of the Great Lakes as the post-tropical cyclone passes in a close distance early on Wednesday. Heavy downpours can also be expected near the track of Cristobal. The Great Lakes will continue to see showery and windy conditions into Wednesday as the complex system intensifies further and heads into eastern Canada early on Thursday.”

  20. TallDave says:

    Hope Joe Born and Petterson get some useful data out of this for their respective models

    • TallDave says:

      also recommend Javier’s look at why CO2 residence times may be important… if CO2 levels do not exhibit the expected long tail, the catastrophic end of our interglacial could be along much sooner even if ECS is as high as IPCC expects

      https://judithcurry.com/2018/08/14/nature-unbound-x-the-next-glaciation/

      • bdgwx says:

        Check out figure 132. CO2 peaked at around 280 ppm. Once it began declining it took 5000 years for it to drop 30 ppm or complete a 50% retrace. That’s a pretty long tail…far longer than Pettersson’s tail of only 50 years for 95% removal…by 2 orders of magnitude.

  21. Midas says:

    And what is wrong, Mr Spencer, with aiming to reach that 44% and progress beyond?

  22. TallDave says:

    For reference, the Wuhan virus emissons drop is probably roughly equivalent to the whole world’s emissions circa 1990

    https://ourworldindata.org/grapher/annual-co-emissions-by-region

    and yet… nothing

    • Bob says:

      What a load of BS. How could the drop possibly be 23Gt in a few months when we put out only 35Gt in a year and emissions are down by only a fraction of the normal?

    • bdgwx says:

      According to your link 1990 emissions were about 23 GtCO2/yr or 1.9 GtCO2/month. 2019 was about 40 GtCO2/yr or 3.3 GtCO2/month . That is by far the highest emissions reduction estimate I’ve seen. Where did you get this figure?

      Even if we assume 1.9 GtCO2 drop for 3 months (which is unrealistic) that would be a -0.7 ppm tendency on the CO2 level. That might be in the realm of detectability, but I think you’d need good annual and ENSO filters (likely requiring complex modeling) and good signal processing techniques to be confident.

      • TallDave says:

        that’s the whole point, if a monthly drop equal to the entire world’s production a few decades ago (pick a year you like) doesn’t show up at all, the fine-tuning offsets must be precise indeed

        remember, CO2 has been rising MUCH longer than 30-40 years… odd that the trend has so little response to changes, esp given that half of emissions disappear almost immediately

        • bdgwx says:

          The trend has little responses to little changes. A -0.7 ppm change (which is WAY higher than any other estimate I’ve seen) is still less than 1/10 of the annual range. The signal to noise ratio there is still pretty small. It is my understanding that we would not be able to detect a 50% reduction with reasonable confidence unless it persistent for at least a year. You would need longer time frames for smaller reductions. I still think a 0.7 ppm reduction could be in the realm of detectability but it would require far more complex natural cycle filters and signal processing techniques. It will be interesting to see the literature that is published in the years to come regarding the pandemic induced emission reductions.

    • Nate says:

      Talldave is bad at math.

      30% x 2 mo/12 mo = 5%.

      5% of 35 Gt =1.8 Gt.

  23. TallDave says:

    haha no, a pool’s water level is constant, have you ever seen a pool with variable water level?

    doesn’t matter how much water you pour in, the pool has mechanisms that kick in at higher water levels to drop the level faster than water can be added

    sounds like you have a lot of learning ahead 🙂

    • Midas says:

      “drop the level FASTER THAN water can be added”

      So you are claiming that when you add water to a pool, the water level drops. Not many neurons firing there.

      • TallDave says:

        no, it means the process’s capacity is larger than any amount you can add, ergo the water level cannot be raised

        if you can get any of your synapses working let me know

        • TallDave says:

          I mean come on, a pool is not exactly a complicated machine

          water is added > the water level rises to the top > the top filters kick in > the water level now falls back to the level at which the top filters sit faster than water can be added… only a very small fluctuation in water level can ever occur b/c the outflow rate increases so fast above the filter height, thus the water level is essentially stable irrespective of inflows

          • TallDave says:

            now of course the Earth obviously doesn’t have any high-ppm processes quite that strong… but the estimates for some have been revised sharply upward, e.g. this triples IPCC greening estimates

            https://onlinelibrary.wiley.com/doi/full/10.1111/gcb.14950

          • bdgwx says:

            That is an interesting study. Yes. If biosphere uptake is higher than the current mean estimate then CO2 level will certainly be less as well. That also means less warming. What we should do with this study is equally weight it along with the others. This will pull the mean down a hair. Or if scientists think this study incorporates a new and better understanding the uptake process then they should give it a biased weight. That would pull the mean estimate down a bit more.

    • bdgwx says:

      Yes. My pool has a variable water level.

      • TallDave says:

        don’t be obtuse, a municipal pool with filters has one fixed water level, that’s why they write the numbers on the side

        • Midas says:

          You are referring to an ACTIVE sink that is designed specifically to regulate the water level. The climate analogy is closer to a bathtub whose only regulator is a partially open drain. When the tap is supplying water faster than water can be drained, the water level rises. As the water level rises, the increased pressure at the bottom causes water to leave the drain at a faster rate, and when that rate matches the rate of water flowing in from the tap, you get a new HIGHER equilibrium water level.

          • TallDave says:

            yes, the atmosphere is definitely not a bucket with no flows, thank you for reinforcing my point

          • Midas says:

            I don’t recall claiming anything of the sort. Do you like your straw man arguments?

        • Midas says:

          Watch this video:
          https://tinyurl.com/Tank-Equilibrium
          Watch the ENTIRE video.

          • Eric S says:

            I love the lab work. So simple. I wish he had talked about CO2 balance using the same analogy. That’s what Selby and Barry have modeled, and it is wonderfully simple. Their model also sheds light on the very real possibility that atmospheric CO2 levels are only partially affected by FF emissions. To date, we have only inference and speculation that CO2 concentration is driving global temps, not the other way around, since accurate CO2 and temp records do not go back far enough to give us real confidence in the history of these levels.

            We understand so little of the carbon cycle (full nature of all sources/sinks and their full interaction), that the Selby/Berry model is very handy in keeping folks honest about temp->CO2 relationship causation until we have a better handle on the carbon cycle.

            It is dangerous for climate physicists to assert (with such unfounded confidence) that our carbon sinks are anywhere near saturation. Especially when you see the giant seasonal swings in atmospheric CO2, which dwarf the scale of annual FF emissions.

            Remember, all this FF carbon was sequestered by the biosphere naturally. We have only speculation as to the processes behind that sequestration. And we have no idea the limits of our carbon sinks or what tricks our biosphere may have in store should CO2 reach levels than unleash new sinks and/or previously unknown feedbacks.

            We were not here when CO2 levels were higher, so we simply don’t know. To assert otherwise is pure hubris. It would be helpful for our climate scientists to admit just how little we actually know about our how durable our biosphere really is…especially when it comes to maintaining safe concentrations of such an important life-sustaining gas as CO2.

          • Nate says:

            “Thats what Selby and Barry have modeled, and it is wonderfully simple.”

            Sure and thats what makes it so appealing to amateurs. It would be wonderful if the Earth’s carbon cycle were so simple.

            Unfortunately, the Earth feels no compulsion to comply. Berry and Salby ignore the complexity that we have learned about and successfully modeled over last 60 years.

          • Chic Bowdrie says:

            Nate is back to trolling, adding nothing to the conversation.

          • Nate says:

            And Mr Tribal is back.

          • Nate says:

            “It is dangerous for climate physicists to assert (with such unfounded confidence) that our carbon sinks are anywhere near saturation. Especially when you see the giant seasonal swings in atmospheric CO2, which dwarf the scale of annual FF emissions.”

            Not sure what you mean by saturation here. I dont think that is what is being asserted. Climate scientists have confidence in well tested models.

            The giant seasonal swings have averaged annually to near 0 over the last few millenia, as ice cores show, and do not cancel out annual FF additions.

            The point that was missed by Chic, is that we DO understand a lot about the carbon cycle after 60 years or so of study. One just has to go read about it.

            “Remember, all this FF carbon was sequestered by the biosphere naturally. We have only speculation as to the processes behind that sequestration. ”

            I think we understand that process pretty well. In any case, there is no uncertainty that the carbon that the biosphere sequestered for Millions of years is now being released in ~ century.

      • bdgwx says:

        It sounds like you’re very familiar with pools. I’m not. But I do like analogies so I’m willing to go with it. Just understand that I don’t know how all sources and sinks are modulated in a municipal pools. I am certainly familiar with natural sources and sinks like evaporation and precipitation, but I have no knowledge of the control mechanism that increase/decrease automated sources and sinks.

  24. gbaikie says:

    –Dan Pangburn says:
    June 9, 2020 at 12:31 PM
    Ent,
    The graph shows the water vapor increasing faster than possible from temperature increase.–

    What do think of this:
    “How has America’s water use changed over the last 65 years? Are we using more or less water, and are there trends for different kinds of water use? ”

    https://www.usgs.gov/special-topic/water-science-school/science/trends-water-use-united-states-1950-2015?qt-science_center_objects=0#qt-science_center_objects

  25. crakar24 says:

    Test…..

  26. crakar24 says:

    Based on the above comments we have two ideals, one where the IPCC claim all increases in emissions are due to human sources and the other which claims not all is from human sources.

    The IPCC position based on climate sensitivity figures requires us to dramatically reduce emissions to stave off large and rapid warming, our emissions are so large the recent reduction due to COVID 19 has little effect.

    The other ideal states global levels continue to increase unabated despite COVID 19 effects because our emissions are so small this change makes no measurable difference it also means we dont have to follow the IPCC path they have chartered.

    Which brings me back to my original supposition and as i have seen plenty of opinion/trash talk there has been no evidence to the contrary ergo this is not settled science and any policy direction/want or need to lower CO2 is based purely on opinion and assumptions.

    • bdgwx says:

      Nearly all of the increase in CO2 is because of human emissions. This is even acknowledged by most “skeptics”. It is only a fringe group of contrarians that posit that humans have little influence and they use contrived models that do not match reality to justify their position.

      Decisions are already being made. Humanity has decided to release Gt of carbon into the atmosphere at continually increasing rates based on the false opinion and assumption that it will not have any negative consequences.

      • Chic Bowdrie says:

        Which of the GCM models are not contrived? Do they all have some sensitivity to CO2 concentration? How is this sensitivity calculated? Inquiring members of the fringe group of contrarians want to know.

        Humanity has an opinion?

  27. Dan Pangburn says:

    Realize that all that carbon in fossil fuels was once in CO2 in the atmosphere.

  28. Entropic man says:

    I did mistake the dates, so I redid the calculation.

    In 1987 temperature was 14.27C, rising to 19.98 in 2019.

    Using omnicalculator, vapour pressure increased from 1.66 kPa to 1.734, an increase of 4.46%.

    Your TWP data increased from 82.8kg/m^2 to 84.8, an increase of 2.4%

    My point stands TWP increased less than expected, not more.

    You are mistaken.

  29. Entropic man says:

    Dan Pangburn

    Not my day. Note the typo. 2019 temperature should have been 14.98C. The calculation used the correct temperature.

    • Dan Pangburn says:

      Ent,
      The later temperature of 14.98 C results in a temperature increase of 0.71 K. A graph of Had-CRUT4 data at https://drive.google.com/file/d/1zbV7o4qoMByTtMjVvYbEt8IHws623U3Q/view?usp=sharing clearly shows the trend increase to be 0.55 K as I stated above. Using your starting number of 14.27 with an ending number of 14.27 + .55 = 14.82, omnicalc gives 1.659 and 1.7167 for a vapor pressure increase of 1.7167/1.659 = 1.0348 or 3.48 %. The assumption is (I have seen verification data but havent found it again) that TPW % increase is about the same as VP % increase.

      The TPW data that you used is for the tropics which is the wrong data to use. The correct data is the global data for TPW as shown in Figure 5. The trend increases from 28.22 kg/m^2 to 29.57 for a TPW increase of 1.35/29 = 1.0465 or 4.65%.

      If you had used the correct data you would have verified my assessment.

  30. TallDave says:

    “Because of this rapid rate of removal, the anthropogenic CO2 emissions do not have to go to zero to stop the observed rise in atmospheric CO2. Using my simple model (blue line in Fig. 1, above), I find that a 43% reduction in anthropogenic CO2 emissions in 2020 would — in the absence of natural fluctuations in the carbon cycle — lead to a halt in the observed rise of atmospheric CO2 in 2020 over 2019 levels. This is about 4 times larger than the EIA estimate of an 11% reduction in CO2 emissions for the year 2020.”

    Roy, this all makes sense, but a follow-up question: 11% is a yearly value but of course the yoy falloff for a given week, day, or month in the first half of 2020 should be much larger, and emissions are expected to grow at their most rapid pace ever in the second half… since the Mauna Loa data has higher frequency than yearly, should we expect any of those changes to be detectable? Seems like this might be a tremendous once-in-a-lifetime natural experiment to set some bounds on the responsiveness of CO2 concentrations to human CO2 emissions (“dominated by human emissions” still seems likely of course, but we might be able to tweak around the edges).

    perhaps some good work for some grad students over the next couple years

    • Midas says:

      Have you watched the video yet?

    • bdgwx says:

      should we expect any of those changes to be detectable?

      Probably not. 11% of 5 ppm/yr is 0.55 ppm/yr or 0.05 ppm/month.

      The stdev of the detrended yoy changes for March, April, and May is 0.8 ppm.

      You tell us. Do you think the signal-to-noise ratio is high enough to draw conclusions?

      I did not make an attempt to remove the ENSO variation. And as I’ve said better natural cycle filtering and signal processing would probably raise our SNR, but would it still be high enough to draw conclusions with confidence. IMHO…doubtful…just not a big enough reduction for long enough.

      You can download the Mauna Loa data here.

      https://www.esrl.noaa.gov/gmd/ccgg/trends/data.html

      • TallDave says:

        bdgwx — appreciate the continued interest but don’t really have time to try to parse your amusing non sequiturs, thanks anyway… won’t reply further, good day

    • Entropic man says:

      I’m not sure it works like that.

      Emit 5 units, two units stay in the atmosphere and three are absorbed into the other two reservoirs.

      Emit 2.5 units, one unit stays in the air and 1.5 units are absorbed.

      About 60% of emitted CO2 is absorbed by ocean and biomass, but it is pro rata.

      Regrettably you can’t say that if you reduce emissions from 5 units to three, that those three units will move into the ocean and biomass while none stays in the atmosphere.

      • Entropic man says:

        Imagine three half-full aquarium tanks side by side, linked by siphons.

        The siphons mean that the water levels in the three tanks tend to stay at the same level.

        Label the tanks ocean, biomass and atmosphere.

        Add three litres of water to the atmosphere tank. Initially the volume in that tank will rise by 3 litres.

        Wait a while. Water will flow from the atmosphere tank to the other two until each tank has increased by one litre and they balance.

        CO2 released into the atmosphere does the same. It spreads among all three reservoirs until they balance.

      • bdgwx says:

        It’s a really good point. I was kind of wondering that same thing. I think the question is if it is a rapid reduction in emissions will the natural sinks throttle down in tandem that quickly?

        If they do then it makes this pandemic induced reduction even harder to detect. Instead of a 0.05 ppm/month signal we would only expect a 0.02 ppm/month signal. A 0.02 signal against 0.8 of noise would be difficult to detect I think.

        I was thinking an emission of 3 units would still result in a 3 unit removal over short time periods and until the natural sinks throttle down. I’m prepared to be wrong about that assumption.

        • Midas says:

          The net rate at which CO2 enters the ocean is a function of the concentrations of CO2 in the atmosphere and in the ocean. It doesn’t depend on the rate at which we add CO2 to the atmosphere.

          • Midas says:

            I should have said “the net rate at any moment in time …”.
            After integrating over time, then of course the rate of change of atmospheric CO2 concentrations makes a difference.

          • bdgwx says:

            Right. It doesn’t depend on the rate in which we add CO2. It depends on the level. And it takes time for the level to drop. Meanwhile the carbon in the ocean is mixed deep at roughly the same rate keep roughly the same amount of buffer capacity at the surface. So the surface will continue to pull CO2 out at roughly the same rate as before because the head pressure hasn’t significantly changed.

            Don’t get me wrong…hydrosphere uptake will throttle down. I’m just not sure it is an instant response. I believe there is some inertia there. I believe this is why the Bern model predicts rapid uptake in the first few years followed by an ever decreasing decay rate and flattening curve. It is because the uptake rate takes time to throttle down.

          • bdgwx says:

            I think of it this way…the partial pressure of CO2 at 410 ppm isn’t significantly different from say 409 ppm or 411 ppm. That means the ocean uptake at 410 is roughly the same as it would be at +- 1 ppm all other things being equal because the ocean is still mixing that captured carbon at the surface to the ocean depths at roughly the same rate allowing the surface capture to continue at roughly the same rate as well.

            Like you said…ocean uptake is function of the level in the atmosphere and the level in the ocean. These levels are not significantly different month-to-month.

            This is why I think ocean uptake will be largely the same before and after emissions reductions at least on a monthly timescale. After a few years…sure…we’d probably start noticing a throttle down. I’m prepared to be wrong about my assumption though.

          • Jim Ross says:

            “Like you said…ocean uptake is function of the level in the atmosphere and the level in the ocean. These levels are not significantly different month-to-month.”

            Month-to-month variations of pCO2 in surface ocean waters can be very significant. See, for example: https://pmel.noaa.gov/co2/story/GAKOA

            (plots may be slow to appear)

          • bdgwx says:

            Let me clarify my statement. The changes in partial pressure of CO2 in both the atmosphere and ocean would not significantly change on a month-to-month timescale if humans emissions were reduced by 0.05 ppm/month. At least that’s my hypothesis.

  31. ren says:

    A strong temperature drop in the Peruvian Current.
    https://www.tropicaltidbits.com/analysis/ocean/nino12.png

  32. Entropic man says:

    “I was thinking an emission of 3 units would still result in a 3 unit removal over short time periods and until the natural sinks throttle down.”

    Does the system have momentum?I

    The transfer from atmosphere to ocean is basic physics. If you abruptly reduce the pressure gradient during fluid flow, the rate of flow decreases immediately. CO2 would do the same. There’s no stored energy to maintain the higher rate.

    The biosphere is more complex. Extra CO2 creates extra photosyntesising biomass, which may continue to take up CO2 at the higher rate for the rest of the growing season.

    If we had data for the last five months since the drop in emissions started I would expect to see the rate of ocean uptake decrease almost immediately (though perhaps not measurably), while increased biomass uptake continued.

    • Entropic man says:

      I think the key is to understand that increased CO2 is the driver pushing material out of the atmosphere down gradients.That is the throttle.

      The ocean responds to lifting your metaphorical foot immediately, while biomass has a bit of turbo lag.

  33. Entropic man says:

    I was thinking about the tank analogy.

    Our emissions would be like water flowing from a gap into the atmosphere tank.

    This would create a head of water which would stabilise when water flowed out through the siphons at the same rate as it came in.

    If you turned the tap down by half, the existing head and flow would still be there for a short time, so water would flow out faster than it came in until the level in the tank stabilised at a lower head.

    And my head hurts!

  34. Aaron S says:

    Good question. Human is the genus Homo. Homo erectus existed and thrived for 1 million years of elevated CO2 during the Latest Pliocene to Early Pleistocene. As African climate degrades and cools entering into the current ice age CO2 dropped and humans have decreased population density. 120k yr ago in Isotope Stage 5e Sea level was 6 m higher than today and earth was warmer despite CO2 being under 300. Human populations expanded and grew creating anatomically modern humans in Africa. Then climate degraded again and populations fragmented and left Africa. Small numbers survived the cold ice age. The current interglacial is characterized by exponential population growth. The coming ice age will most likely stop this trend. A bit of global warming from elevated CO2 would allow the exponential growth to continue. So high CO2 and warm climate appear very positive for the genus Homo. However, the high success of humans is coming at the cost of other ecosystems.

    • Midas says:

      Homo erectus is first know 2 million years ago. The current ice age began 2.5 million years ago.

      And you are ignoring the lag of 50000+ years for ice melt to fully react to changes in temperature. It is not meaningful to attempt to correlate temperatures now with ice levels now.

    • bdgwx says:

      A bit of global warming from elevated CO2 would allow the exponential growth to continue. So high CO2 and warm climate appear very positive for the genus Homo.

      How long do you want the exponential population growth to continue?

      Will rising CO2 levels always result in a positive tendency for exponential population growth? Or is there a limit to its positive effect? What is that limit?

    • Nate says:

      “bit of global warming from elevated CO2 would allow the exponential growth to continue.”

      Uhhh, lots of corr = causation in there.

      1. Exponential growth not caused by climate, but by industrial rev and science.

      2. Further exp pop growth = good???

  35. ren says:

    The Atlantic forecast indicates favorable conditions for hurricane development.
    https://s.w-x.co/staticmaps/wu/fee4c/surface_day1/watln/20200612/1800z.jpg

  36. Aaron S says:

    I’m back to the bottom of comments when I reply.

  37. JOEL BLACK says:

    Hey Dr. Spencer,
    Looking over this article it occurred to me that one might be able to plot the Mauna Loa data against the satellite record to see if CO2 concentrations were leading or following temperature changes. Do you think there is a large enough time sample to show a real relationship? Apologies if this is old news, I just haven’t seen it.
    Thanks!

    • Midas says:

      How would you do that when the satellite record has not caught the beginning of the temperature rise?

      • JOEL BLACK says:

        I understand we don’t have the whole record, I’m interested in the satellite record compared to the Mauna Loa record. I’m not a statistician or I would do it myself. I imagine something that removes secular trends and tries to see if there is a lead or lag to the changes on either side.

    • bdgwx says:

      I’m not sure how that could be inferred either way from the UAH record. The main issue is that CO2 alone does not modulate the temperature especially on short timescales.

      At any rate we know that CO2 is leading the temperature today for a variety of reasons. 1) The net biosphere and hydrosphere carbon flux is taking carbon from the atmosphere even despite the rising temperature. 2) The net anthroprogenic carbon flux is giving carbon to the atmosphere and is independent of the temperature change. 3) Positive changes in CO2 level produce a positive radiative force. These 3 points (and there’s probably more points) all suggest that CO2 is leading the temperature change…today.

      Don’t hear what I’m not saying. I’m not saying that CO2 always leads the temperature. It doesn’t. Because it is both in a feedback and forcing relationship with the temperature it can either lead or lag depending on the specific circumstances. There are many events in the paleoclimate record in which both lead and lagged. We just happen to be living in an era in which leads primarly because the way it is increasing in the atmosphere is invariant of the temperature.

      • Chic Bowdrie says:

        Total speculation. None of your three point sermon adds up to a discernible change in temperature from a change in CO2.

        You can easily demonstrate that warmer temperatures will result in greater CO2 concentrations. OTOH, you cannot measure an increase in global temperature after an increase in CO2.

        • bdgwx says:

          You can easily demonstrate that warmer temperatures will result in greater CO2 concentrations.

          Absolutely. There is plenty of evidence to suggest that increasing temperature leads to an increase in CO2.

          OTOH, you cannot measure an increase in global temperature after an increase in CO2.

          Yes. We literally can. People have been doing it since the 1890’s.

          And using more complex GCMs with the aid of computers we can predict the global temperature with remarkable skill. For example, when you feed Hansen’s 1988 GCM (primitive by today’s standards, but complex by standards of Arrhenius’ time) with GHG emissions that actually happened the temperature output is indistinguishable from observations. (See Hausfather et al. 2019)

          In fact, today’s models are comprehensive enough that they can solve for both the CO2 level and temperature without using either as inputs to solve for the other. (See Williet et al. 2019)

          Don’t hear what I’m not saying. I’m not saying that our models are perfect. They aren’t and they never will be. But these models that incorporate the bulk of the consensus understanding do a far better job at explaining and predicting reality as compared to contrarian models. They are useful and they are continually improving.

          • Chic Bowdrie says:

            The measurement you are describing is called a correlation. It is not a measurement. A model is a prediction not a measurement. There are relatively long time periods in the recent past where temperatures fell while CO2 was rising. I challenge you to provide scientific evidence (experimental data) showing that an incremental increase in CO2 will cause a measurable increase in global temperatures.

          • bdgwx says:

            I challenge you to provide scientific evidence (experimental data) showing that an incremental increase in CO2 will cause a measurable increase in global temperatures.

            Is there any experiment better than the one currently being conducted? We pump CO2 into the atmosphere and the temperature goes up below the CO2 layer and down above the layer pretty much in line with expectations. Then of course we have the paleoclimate record that has many experiments that can be analyzed and the laboratory experiments clearly demonstrating CO2’s behavior in the IR part of the EM spectrum and resulting thermal barrier properties.

            There are relatively long time periods in the recent past where temperatures fell while CO2 was rising.

            Absolutely. But no reputable scientist is contesting that. No reputable scientist is claiming that CO2 is the only factor that modulates the temperature.

          • Stephen Paul Anderson says:

            You think what you believe is reality. You offer no proof other than your own perception. You are going to hang on to your leftist dogma to your death. I don’t even understand why Chic wastes his time on you. Where is this utopia?

          • Stephen Paul Anderson says:

            Oh, I know, the Nation of CHAZ. There you go. There is your utopia.

          • Chic Bowdrie says:

            Stephen,

            I agree bdgwx believes the dogma, but I don’t believe he intentionally lies. I view his comments in the light of this law of propaganda: repeat a lie often enough and it becomes the truth. So as time permits, I will expose the dogma’s Achilles’ heals. Bdgwx raises several of those issues above.

            Pumping CO2 into the air is no experiment, especially a legitimately controlled one. There is still insufficient evidence to know where the CO2 is coming from and who is doing the pumping. The comparison of temperature with CO2 is merely a correlation which is a necessary, but not a sufficient condition showing that CO2 causes temperature to increase.

            Paleoclimate data raises many questions with few solid answers and the main one being that CO2 lags temperature.

            Laboratory spectroscopy experiments only demonstrate that CO2 cannot trap CO2 and only contributes to reducing daily temperature extremes. That is not much of a thermal barrier albeit a beneficial one.

            The problem with admitting that other factors modulate the temperature is showing how CO2 has any effect at all when temperatures can drop for decades while CO2 rises.

          • bdgwx says:

            You ask for experiments. You dismiss them. Is there any test/experiment you would accept that would falsify Berry/Salby/Harde’s understanding of the carbon cycle? Is there any test/experiment you would accept that would falsify the hypothesis that CO2 cannot warm the planet?

          • Chic Bowdrie says:

            I dismiss your experiments as insufficient to support your dogmatic claims, not that they aren’t useful information. They just aren’t hypothesis, test, result, conclude scientific method type experiments.

            Those are good questions. If I could start my life over, it would make a good career goal to answer them.

          • bdgwx says:

            Let me get this straight…you’re saying that there is no experiment you would accept to convince you that the Berry/Salby/Harde hypothesis is wrong or that the CO2-does-not-cause-warming hypothesis is wrong?

          • Chic Bowdrie says:

            No I did not mean that those experiments cannot be done, I just prefer not to speculate on it here. But I think you are approaching this from the wrong perspective. It’s a scientist’s job to prove hypotheses right. That they are wrong (the null hypothesis) is the starting point of experimentation.

            What is the Berry/Salby/Harde hypothesis? Their proponents need to find the data to support it. CO2-causes-warming proponents need to find the data supporting their hypothesis. Multiple lines of evidence are useful, but not definitive. Correlations are not conclusive. Look, if science was easy, even a liberal could do it.

          • bdgwx says:

            Berry’s hypothesis is that humans are only responsible for 24% of the increase from 280 to 410 ppm. I believe Harde claims 15%. I think, though I’m prepared to be wrong, that Salby claims it is closer to 0%.

          • Stephen Paul Anderson says:

            Chic,
            Either leftists are mentally defective or they are sociopath/psychopaths. I’ve often wondered if utopianists have this mental defect that is placed there by nature which causes civilizations to collapse. Historians, archeologists, and paleontologists study civilizations like Babylon, Rome, Maya, Inca, China, Egypt, etc. and try to discover what caused them to collapse. My hypothesis is that it is the same basic cause-utopianism or leftism. It runs through the fabric of mankind and causes civilizations to collapse. Man’s basic nature is to compete, ergo capitalism. Societies’ basic nature is to tend toward egalitarianism, ergo socialism. Capitalism works, egalitarianism, or socialism doesn’t. The climate change movement is utopianism.

          • bdgwx says:

            Chic said: No I did not mean that those experiments cannot be done, I just prefer not to speculate on it here.

            How about release some carbon into the atmosphere. Once the release has ended observe how long it takes for the total mass to deplete to pre-release levels? If the time it takes to drop 63% is significantly longer than ~15 years then you know something is wrong with the model. Does that work?

            Chic said: But I think you are approaching this from the wrong perspective. Its a scientists job to prove hypotheses right.

            Actually hypothesis evolve based on the principal of falsification. The reason is because it only takes one counter example to prove a hypothesis false. But it takes infinite effort to prove a hypothesis true.

            For example…if Berry’s hypothesis is that only 24% of the human emissions contributed to the rise in CO2 and we find evidence that it is 26% then his hypothesis (as-is) is false. He then evolves the hypothesis to say something like 24-28% instead which cannot be falsified by the same line of evidence. Or if we find evidence that it is 98% he can restate the hypothesis to say 24-98%. But another astute scientists could claim it is 96-100%. Which hypothesis is better? Obviously the one that remains consistent with all lines of evidence and which has the narrower range.

            If you formulate a consensus hypothesis using Berry/Salby/Harde it would have to be a range of 0-24% with an equal weighted mean of 13%.

          • Svante says:

            Stephen Paul Anderson, the Maya decline may be due to severe environmental degradation.

          • bdgwx says:

            The book Collapse by Jared Diamond has examples of civilization collapse caused by human induced environmental harm. It’s a fascinating read.

    • Dan Pangburn says:

      Joe,
      The lack of influence of CO2 on climate is corroborated by multiple compelling evidence listed in Section 2 of http://globalclimatedrivers2.blogspot.com

      • Midas says:

        “… is corroborated by my blog …”
        LOL

        • Dan Pangburn says:

          Mid,
          I wonder if the vacuous sarcasm is because you are unwilling or unable to challenge any of the items listed there.
          Perhaps you didn’t even look. Here are the first 7.

          1. In the late Ordovician Period, the planet plunged into and warmed up from the Andean/Saharan ice age, all at about 10 times the current CO2 level [3].
          2. Over the Phanerozoic eon (last 542 million years) there is no correlation between CO2 level and AGT [3].
          3. Antarctic ice core data show that during the last and previous glaciations AGT trend changed directions before CO2 trend [2].
          4. Since 2001, average temperature uptrend calculated by Global Climate Models (GCMs, aka General Circulation Models) which assume CO2 causes AGW is about twice measured. [13]. The one Russian model output essentially matches measurements but carries the usual ‘free world’ suspicions as to its authenticity. This is shown, with recent data added, on Figure 0.1.
          5. Analysis of CO2 and Temperature data 2002-2008 shows a close correlation between d CO2/dT and lower tropospheric temperature. This demonstrates that CO2 level follows temperature and not the reverse. [30]
          6. Average global water vapor had been increasing faster than possible, calculated on the basis of increased vapor pressure of water resulting from temperature increase of the liquid surface water. (Section 8 here) This demonstrates that average global temperature increase has been driven by water vapor increase, not the reverse.
          7. The data from all reporting agencies agree that at least as far back as 2002 average global temperature tracks WV not CO2 (Figure 0.2).
          There are more . . .

          • Midas says:

            When you get that peer-reviewed (using the PROPER peer-review process) then I’ll treat it with more respect.

          • Dr Roys Emergency Moderation Team says:

            Des, please stop trolling.

  38. Entropic man says:

    My vapour pressure change calculation using GISS gave an increase of 4.46%, which agrees with your global TPW calculation of 4.65%.

    Your Had***CRUT based calculation gave a lower value of 3.45%.

    If you do three calculations and one disagrees, the odd one out is usually the wrong one.

    Your Had***CRUT calculation suggests that it is underestimating the temperature rise, something already known from other sources.

  39. Entropic man says:

    Dan Pangburn

    Search “Large igneous provinces and mass extinctions: An update ”

    You”ll find a discussion of the link between large igneous province volcanism and extinctions.

    The proposed mechanism is rapid CO2 release triggering global warming and the warming triggering anoxic oceans.

    Examples of CO2 leading temperature.

  40. Dr Roys Emergency Moderation Team says:

    A bit more interesting under this one, at least…

  41. JOEL BLACK says:

    I understand we don’t have the whole record, I’m interested in the satellite record compared to the Mauna Loa record. I’m not a statistician or I would do it myself. I imagine something that removes secular trends and tries to see if there is a lead or lag to the changes on either side.

  42. Entropic man says:

    Dan Pangburn

    1) Interesting that you mention the Ordovician extinction, which was always regarded as the odd one out of the big five. The conventional wisdom was indeed that it coincided with glaciation.

    I was reading the 30th May New Scientist, which reported evidence for large scale volcanism at the time of the extiction, which makes it five for five. Five mass extinctions, five large igneous provinces and five global warming events.

    2) Interesting how the decrease in warming due to decreasing CO2 through the Phanerozoic matches and cancels out the increased warming as solar insolation increased. Don’t assume that CO2 is the only variable operating.

    3) Yes, this is generally agreed. The chain of causation of glacial cycles is that orbital cycles drive temperature and that temperature drives CO2. Amplifying feedback.

    4) It’s going into the oceans. Note that sea level rise has jumped from 3 mm/ year to 5mm/year.

    5) 6 years data certified to rearrange the long term trend and end below the trend.

    6+7) I’ve already shown that water vapour is increasing as expected and your mismatch is due to choosing an underreading temperature dataset.

    • Dan Pangburn says:

      Ent,
      You hide behind a made-up name (are you even a man?) making it difficult to find out how you benefit from your bizarre rationalizations of multiple evidence, all of which corroborate that CO2 has no significant effect on climate.

      1. You say “Interesting that you mention the Ordovician extinction”. I did not mention any extinction. Why do you ignore what I actually said which was “In the late Ordovician Period, the planet plunged into and warmed up from the Andean/Saharan ice age, all at about 10 times the current CO2 level”. Why did you change the subject?

      The word extinction appears only once in the entire document: In Section 13 “The planet came perilously close to extinction of all land plants and animals due to the low level of CO2 at the end of the last glaciation.”

      2. You say “decrease in warming due to decreasing CO2 through the Phanerozoic matches and cancels out the increased warming as solar insolation”. That is bogus. Several researchers (all that I know of) have reported that the CO2 level was about as low 300 million ybp as it is now and it was much higher in between. Fig 2 in https://drive.google.com/file/d/0B0bU2NwQFmKJMkVZQW5zdll2OVhUdW5iOGxESFBvcE85R0Jr/view?usp=sharing

      3. You almost get part credit for agreeing but apparently you ignore that the shortest Milankovitch cycle is 25000 years while trend direction changes were much more frequent. https://drive.google.com/file/d/1HRsMhsHAG_lV7r-GPX7CoFeKIajpvEj8/view?usp=sharing

      4. By cherry picking time periods, since the uncertainty is ±4 mm/yr, changing from 3 to 5 isn’t surprising. NASA says it is 3.3 mm/yr https://climate.nasa.gov/vital-signs/sea-level/ .

      5. The reference explains it. I can’t understand it for you.

      6,7. I’ve already demonstrated that globally WV has been increasing faster than possible from temperature increase. I have run the same analysis for all available temperature data sets, including the ones that have been ‘adjusted’ to better fit an agenda, and they all show that WV has been increasing faster than possible from temperature increase.

      Sooner or later you will have to take the blinders off.

  43. Chic Bowdrie says:

    This is a response to Nate’s comment here: http://www.drroyspencer.com/2020/06/covid-19-global-economic-downturn-not-affecting-co2-rise-may-2020-update/#comment-485828

    “Then it makes absolutely no sense for you guys to look at the 3 month record, and make ANY conclusion.”

    You are the one making a big deal out of the 3 month record. Most woke people get it that a fraction of 3/12ths of 1/20th of the total CO2 emissions will not be statistically significant. OTOH, if you think that human FF emissions cause ALL the rise in atmospheric CO2, it should cause you pause.

    “[Suggesting that natural CO2 variation has turned off is] obviously not [a strawman] since you guys keep ignoring it.”

    I never said natural CO2 variation has turned off. It is a figment of your obfuscation.

    And I’m not “you guys.” If you have a problem with Crackars’ interpretations, take them up with him/her.

    • Nate says:

      Glad to hear you cant draw conclusions from 3 mo of noisy data either.

      Then not sure what all this discussion was about?

      “[Suggesting that natural CO2 variation has turned off is] obviously not [a strawman] since you guys keep ignoring it.”

      “And Im not ‘you guys.’ If you have a problem with Crackars interpretations, take them up with him/her.”

      I did. And you jumped to his defense, and agreed with his strawman points.

      Typical Chic backpedaling.

      • Chic Bowdrie says:

        I entered the discussion to point out another obfuscatory comment by you:

        http://www.drroyspencer.com/2020/06/covid-19-global-economic-downturn-not-affecting-co2-rise-may-2020-update/#comment-484415

        Roy has not been analyzing short-term month to month wiggles. He simply notes that a change in emissions will have to be larger than the estimated drop in FF emissions due to the China virus. Those wiggles are not just influenced by natural variation, they ARE the natural variation. FF emission variation is around 1/20th of that.

        However, if you have been sucked in (and I don’t know if that applies to Crackar24 or anyone else) by warmist propaganda claiming FF emissions cause ALL the rise in CO2, then it would be reasonable to wonder why the drop in FF emissions doesn’t show up in the Mauna Loa data.

        I’m not jumping to anyone’s defense. I’m calling out your obfuscation.

        • bdgwx says:

          Chic said: However, if you have been sucked in (and I dont know if that applies to Crackar24 or anyone else) by warmist propaganda claiming FF emissions cause ALL the rise in CO2, then it would be reasonable to wonder why the drop in FF emissions doesnt show up in the Mauna Loa data.

          I agree. It is reasonable. That’s why Dr. Spencer is testing it.

          The reason why Dr. Spencer and pretty much everyone else doesn’t think the pandemic induced emissions reduction will be detectable is because the reduction is not large enough for long enough to produce a signal that is significantly above the noise floor. The detrended March-April-May CO2 standard deviation is 0.8 ppm. The estimated emission reduction for this period is probably no more than 0.1 ppm. Your signal-to-noise here is lopsided.

          However, as I’ve said before I think the signal might be detectable with better natural cycle filters, a very good model of the carbon cycle, and more complex signal processing techniques. That’s all certainly beyond my expertise. And I suspect Dr. Spencer would say the same thing.

          • Chic Bowdrie says:

            The latter was well-stated and thank you for agreement on the former.

            My point here was just to set the record straight by correcting the misinformation disseminated by Nate. To your credit I think you generally try to get things right (even though I often disagree :>) ).

        • Nate says:

          Chic,

          You dont understand what either a strawman is, or obfuscation, clearly.

          You jump to the defense of those who agree with you, whether or not their points are BS or not. In this case, BS.

          You start a debate with me, by immediately throwing ad-hom grenades, belittling my fact-based posts, and continuing that with no let up.

          And you expect respectful treatment in return? You expect a meeting of the minds?

          If you think so you are an imbecile.

  44. Chic Bowdrie says:

    Another response to Nate from here:
    http://www.drroyspencer.com/2020/06/covid-19-global-economic-downturn-not-affecting-co2-rise-may-2020-update/#comment-485845

    “Yes, but it is important to note that lots people with bona fide expertise, who are familiar with way more literature than us, have concluded that the evidence is strong for anthro carbon. That matters.”

    It matters to you, because that evidence is not strong enough to allow you to make your case without relying on appeals to authority. No offense meant to your experts, but science is not done by committee or just being familiar with the literature.

    Again, I’m not “you guys.” I am a skeptic prepared to challenge anyone who takes a dogmatic position that is scientifically flawed. I choose my battles and am taking the side of the underdog here.

    What a hypocrite you are. Who made you judge over how much bias someone has or whose view is more likely?

    • Nate says:

      “I am a skeptic prepared to challenge anyone who takes a dogmatic position that is scientifically flawed.”main

      Apparently only you are a real skeptic. When we are skeptical of Berry and Salby’s highly flawed positions, and show you the flaws, we are simply ‘obfuscators’ and ‘closed minded’.

      What rot.

      • Chic Bowdrie says:

        Whatever flaws you think you have pointed out, do they refute the facts that nature doesn’t treat FF carbon different from that of any other source of emission and therefore the rise in atmospheric CO2 can’t be more than 16% from fossil fuel?

        • bdgwx says:

          So if the carbon cycle does not preferentially treat human emissions over natural emissions and vice versa and only (31 / 260) = 12% of human emissions participated in the atmospheric increase then that means (100 / 0.12) = 833 ppm of new natural emissions must have occurred to bring the human+natural contribution to 100%. Which reservoir was tapped to provide this 833 ppm = 6500 GtCO2 = 1770 GtC? And since only 130 ppm stayed in the atmosphere then where did the (833 + 31) – 130 = 734 ppm = 5725 GtCO2 = 1560 GtC end up?

          BTW…scientists agree that the carbon cycle does not treat human and natural emissions differently. They all agree that the change in the net human sources/sinks contribute equally to the change in the net natural sources/sinks. These changes in the net flux contribute 100% to the change in the atmospheric level. That’s why the net flux of 260 ppm human->atmosphere is equally weighted with the net flux 130 ppm hydrosphere+biosphere<-atmosphere to arrive at 260 – 130 = 130 ppm increase in the atmosphere. Human tapped reservoirs decreased by 260 ppm and natural reservoirs increased by 260 ppm (130 ppm to atmosphere and 130 ppm to biosphere+hydrosphere).

          • Stephen Paul Anderson says:

            They don’t agree. The model Spencer uses claims anthropogenic outflow is proportional to the level above a baseline natural level.

          • Chic Bowdrie says:

            Stephen, you are correct. You don’t have to go beyond Dr. Spencer to see that not all agree. Others have overlook this critical point and it is the basis of the Bern model and others. The mathematical model has to be at a minimum realistic. That still doesn’t make it necessarily right. But it is the proper starting point. Otherwise you end up with a coincidental correlation which is what I claim Dr. Spencer’s model is.

          • bdgwx says:

            SPA,

            We’d have to ask Dr. Spencer, but I don’t think his model assumes that it is only the human component of the outflow that is proportional to the level. I believe it assume that all outflow selections are random and treated equally. In other words he is not challenging the mixing ratio of human vs natural molecules of 0.05-to-0.95. His model is consistent with that principal. It is also consistent with the principal that the total amount (human-selections + natural-selections) of the outflow is proportional to the level.

            BTW…human molecules are C14 depleted. This provides us with a tracer to test the hypothesis that outflows are non-preferential. To do this test we compare the C14 isotope ratio in tree rings prior to the industrial revolution with tree rings that occurred later. Unfortunately this experiment must end prior to the contamination from the bomb spike. What is observed from this experiment is that C14 ratios declined in expectation with the C14 depleted emissions and randomly selected outflow. If the carbon cycle really did have a preferential treatment of human or natural molecules we would expect a different trajectory for the carbon isotopes in tree rings. Additionally…this experiment shows that at least prior to the bomb spike human emissions were accumulating in the atmosphere in accordance with expectations as well.

          • bdgwx says:

            Chic said: Others have overlook this critical point and it is the basis of the Bern model and others.

            The Bern model does not assume that total mass depletion is dependent upon the mixing ratio of the sub species. In other words it does not assume that human molecules are treated any differently than natural molecules in terms of the rate at which thy are removed. In fact, it assumes the opposite. It assume there is no difference.

            And remember…the Bern model was not created or designed to model the changes in mixing ratio of sub species or the decay of one sub species relative to another. It is not supposed to explain the C14 bomb spike decay curve. What it is supposed to do is explain and predict the decay of the total amount of carbon (all sub species included) after a release event.

            BTW…I would like to have someone answer this question. Why does the Bern model predict decays of total mass lasting only a few hundred years when all of the release events in the paleoclimate record that I am aware of took thousands or even tens of thousands of years to deplete? How is that discrepancy resolved?

          • Stephen Paul Anderson says:

            BGDWX,
            They use the Bern model incorrectly as Salby points out. The total e-time is the sum of all the e-times so that the fastest e-time is slower than the total. In IPCC’s derivation, they use the equation so that the total e-time is governed by the slowest e-time. In the IPCC’s model, it would be as if the bathtub was partitioned and each partition has its own drain. And CO2 builds up and is governed by the smallest drain. Salby says the bathtub isn’t partitioned. All the CO2 is connected to all the drains.

          • Stephen Paul Anderson says:

            CO2 works like resistors in parallel.

            So the total resistance cant be more than the smallest resistor.
            for CO2 the 1/2 life of the total cant be greater than the 1/2 life which is shortest. This is proper use of the Bern equation. IPCC believes the resistors are in series.

          • Stephen Paul Anderson says:

            I meant to say e-time, not half life.

          • Stephen Paul Anderson says:

            The IPCC improperly solved the continuity equation. Here is the proper solution. Start watching at time 58:00

            https://www.youtube.com/watch?v=NtIgMftbUuw

          • Chic Bowdrie says:

            bdgwx,

            I think Stephen has the general idea correct on Bern model e-times, although saying the fastest e-time is slower than the total” may need to be reworded.

            Somewhere upthread you misunderstood what I referred to as a critical point about how the removal of CO2 from the air is calculated. Stephen objected to your statement, “They all agree that the change in the net human sources/sinks contribute equally to the change in the net natural sources/sinks.” Go back to Dr. Spencer’s original spreadsheet model and notice that the outflow is calculated by the difference between the nth year’s atmospheric CO2 and the original pre-industrial CO2 level (295 ppm in his case). Therefore, all of that outflow is based totally on the addition of Boden data amounts. Natural emissions are ignored.

            This is the critical point: Natural processes don’t ignore the natural CO2 in the atmosphere and scientists who ignore them and their possible undercount do so erroneously.

            http://www.drroyspencer.com/2020/06/covid-19-global-economic-downturn-not-affecting-co2-rise-may-2020-update/#comment-486413

            “BTWI would like to have someone answer this question. Why does the Bern model predict decays of total mass lasting only a few hundred years when all of the release events in the paleoclimate record that I am aware of took thousands or even tens of thousands of years to deplete? How is that discrepancy resolved?”

            Inflow = Level/RT. As long as inflow is maintained there will be no depletion (outflow). Once inflow subsides, depletion can commence. Dare I say you are confusing adjustment time with residence time? :>)

          • Stephen Paul Anderson says:

            Yes, Chic you’re right I think I re-stated it correctly with the parallel resistor analogy.

          • Nate says:

            Stephen,

            “Salby says the bathtub isnt partitioned. All the CO2 is connected to all the drains.”

            Good point.

            And his basis for this claim is what? It completely ignores known facts about the Earth.

            The fact that his model gets the Bomb curve e-time = 17 y totally wrong is good evidence that his non-partitioning model is totally wrong.

          • bdgwx says:

            SPA,

            Things are in series though. For example, human emissions must go through the atmosphere before going through the hydrosphere. The Bern model partitions the carbon cycle based on the interface points between reservoirs and the physical processes that are in play at each point. Each point and process has it’s own rate of transfer and limitations on that transfer rate. Do you disagree?

          • bdgwx says:

            SPA: The IPCC improperly solved the continuity equation. Here is the proper solution. Start watching at time 58:00

            Salby clearly does not understand that the Bern model is not designed to model the C14 bomb spike. And he clearly does not understand the differences between residence time and adjustment time.

            The C14 bomb spike decay is NOT showing you how mass is removed. It is showing you how mass is exchanged. This should be mind numbingly obvious because even though C14 decreased during this period the aggregate sum C14+C13+C12 went up…by a LOT. In fact, C13+C12 increased by something like 12 (give or take) orders of magnitude more than C14 decreased. Actually…even if ALL of the C14 from bomb testing stayed in the atmosphere you would still observe a C14 decay curve because it is the ratio of C14 to C13/C12. If the numerator (C14) stays the same and the denominator (C13/C12) increases then result is lower. Do you see the problem with using only the C14 decay curve?

            If Salby’s model is the correct solution to the problem of mass removal then show us a plot of a real carbon release and decay in which 63% was removed in ~15 years. Use total CO2 ppm as your units on the y-axis and time on the x-axis.

          • Nate says:

            BDGm

            Salby and Berry confuse C14 decay and total mass decay.

            But they ALSO get the bomb decay curve wrong. They predict ~ 4 y decay, but it is 16-17 y. The reason, I believe, is again the series reservoir model that they are missing.

            The Bomb C14 must first exchange between atm and land and surface ocean, say in ~ 4 y. It then must exchange between surface ocean and deep ocean, and that is another ~ 11 y or so. Numbers based on carbon cycle diagrams.

          • bdgwx says:

            Nate,

            Hmm…I was thinking Berry’s model does a pretty good of explaining the C14 bomb spike decay. You can see his model matched up with the observations in figure 2 of his Preprint #2 page.

            The problem IMHO is that his 16.5 year e-time isn’t really the residence time of molecules. The RT is still closer to 4-5 years. The reason why the C14 bomb release decays slower than the RT may be because humans keep adding C14 to the atmosphere thus keeping the balance level higher than it would be otherwise.

            But yes I agree 16.5 years is too fast for the AT because the carbon cycle has interface points that really are in series. Carbon can’t get mixed down into the deep ocean until it has first visited the surface layer. And the Revelle Factor clamps the rate at which DICs are formed. Likewise biological growth processes limit how much CO2 can be removed via photosynthesis. There’s no way you’re going to form an accurate model of the carbon cycle unless these factors (and others) are considered. There Bern model really is the right approach. I just don’t know if its partitioning parameters are tuned correctly. That’s the part that is debatable.

          • Nate says:

            Berry says this abouit his fit to the Bomb curve:

            “The Physics Model, (5) and (8), accurately replicates the 14CO2 data from 1970 to 2014 with e-time set to 16.5 years, balance level set to zero, and starting level set to the D14C level in 1970.”

            It appears to be simply a fit parameter, not calculated.

            IOW, quite lame.

          • Stephen Paul Anderson says:

            BGDWX,
            No, the C14 decay data support Berry’s hypothesis that outflow is proportional to the level divided by e-time. This data supports the hypothesis the e-time is short. Adjustment time is an arbitrary concept. Adjustment time is a term you throw out to avoid the real facts.

          • Stephen Paul Anderson says:

            Nate,
            It doesn’t avoid known facts. It is the mathematical solution to the integral. The correct solution implies that absorbers aren’t partitioned. You can’t just make up any solution to an integral. It doesn’t work that way.

          • Stephen Paul Anderson says:

            Nate,
            It’s not that f**king hard. You take one point of the curve, subtract another point and do it in a few places and divide time and see if it fits most of the curve and if it does then you can say it is a pretty good fit of the negative slope. It implies a very short e-time.

          • Stephen Paul Anderson says:

            Nate,
            ITS NOT THE BOMB DECAY CURVE!

          • bdgwx says:

            No, the C14 decay data support Berry’s hypothesis that outflow is proportional to the level divided by e-time.

            It’s the other way around. e-time is not an intrinsic property of the atmosphere. It is a product of whatever the level and outflow happen to be. Also, C14 is created in the upper atmosphere and by humans. So the e-time here is product inflow, outflow, and level. Berry’s e-time is neither the residence time nor the adjustment time for CO2. It’s probably best to just describe it as the C14 bomb spike decay e-time.

            Adjustment time is an arbitrary concept. Adjustment time is a term you throw out to avoid the real facts.

            I didn’t throw it out there. It has been the term used to describe the mass depletion concept in academic literature for awhile now. Here are the definitions…again.

            Residence Time – The amount of time a specific molecule of CO2 stays in the atmosphere.

            Adjustment Time – The amount of time it takes for the total mass of CO2 to adjust toward the pre-release level.

            These are different concepts with different values. Here is a trivial example to illustrate how RT and AT are calculated.

            Initial level = 280 ppm
            Current level = 410 ppm
            Inflow = 100 ppm
            Outflow = 102 ppm
            e: e-fold
            f: full-fold

            RTe = 410 / 102 = 4 years

            ATf = (410 – 280) / (102 – 100) = 65 years

            The RTe of 4 years is the amount of time it takes for 63% of the original molecules to fall out and get replaced with new molecules. The ATf of 65 years is the amount of time it takes for the mass to adjust back to the initial level.

            In reality the carbon cycle is far more complex. The outflow does not remain constant at 102 ppm. It has an exponential decay as well since it is modulated by the level. And as the level drops the outflow drops as well. At some point inflow and outflow will find an equilibrium. So the reality is that ATf is much longer than 65 years.

            If you still do not understand what RT and AT are measuring please ask questions.

          • Nate says:

            Stephen,

            It is trivial to say the decay of C14 will fit an exponential. The challenge for Berrys model is to predict the e-time. He is unable to do so and simply fits it. His model estimate of 4 y based on a single reservoir, is completely wrong, so he fudges it and fits it, and claims his model ‘works’ when clearly it doesnt.

          • Stephen Paul Anderson says:

            It is arbitrary because it never reaches the prerelease level. Within about 4 e-times it is close enough. (0.63)^4 is close enough.

          • Nate says:

            4 and 16 are ‘close enough’ ???

            Hardly.

            It is an abject failure of the model to fit observations.

            See what Feynman says about such things.

          • Stephen Paul Anderson says:

            Nate,
            etime comes from the solution to the integral of the continuity equation. Where does adjustment time come from? BGDWX claims it is 16.25 etimes. Where does that come from? How was it derived? What physics is it based upon?

          • Chic Bowdrie says:

            Stephen,

            You will never get anywhere with Nate. He only knows superficial or pat answers. When he gets stuck, he just says things that sound good. That is why I call him the King of Obfuscation.

            In this case, he is claiming Berry’s C14 e-time is a fit rather than being a prediction or a calculation. He doesn’t realize the fit is a calculation of the e-time. You can’t calculate e-times any other way. Predicting an e-time is guessing.

          • Stephen Paul Anderson says:

            Chic,
            Yes, absolutely. It is based on real-world data. That is the etime. However, Nate, BGDWX, et.al. create mathematical concoctions to fit their agenda. They don’t care that it doesn’t fit real-world anything, obfuscate away. They huddle up in their little rooms filled with smoke and mirrors and concoct away.

          • Nate says:

            “In this case, he is claiming Berry’s C14 e-time is a fit rather than being a prediction or a calculation. He doesn’t realize the fit is a calculation of the e-time. You can’t calculate e-times any other way. Predicting an e-time is guessing.”

            OMG!

            Fitting the decay curve to an exponential is something any freshman can do. An exponential is standard for a decay curve.

            No model is needed to do that!

            The whole point of Berry’s Model is his calculation of e-time from his basic premise:

            e-time = Level/Input.

            This gives e-time ~ 4 years from well known values of Level and Natural Input Flow.

            His model fails miserably in this regard.

            If his model can’t even get close to the correct e-time, then what good is it?

          • bdgwx says:

            SPA said: Where does adjustment time come from? BGDWX claims it is 16.25 etimes.

            I don’t claim AT is “16.25 etimes”. First…that doesn’t even make sense. That’s like saying “it takes 16.25 half-lives for something to happen”. E-time is not a measurement. It is the units used to make a measurement. The concept is exactly the same as a half-live except instead of a drop to 1/2 it is a drop to 1/e. Second…the IPCC believes it is a couple of hundred years for 1 e-fold. Third…to help you understand what AT is I gave you a trivial example showing how to calculate it. That calculation came out to ATf=65 years which just happens to be 16.25x the RTe=4 year figure. I made it quite clear that the ATf (or actually ATe) of the real world is higher because the outflow would throttle down with time reducing the net imbalance.

            Adjustment time comes from observing the reduction of carbon mass (all carbon mass; not just a tracer like the C14 isotope) from the peak of the CO2 level until it returns to the pre-release level. If you believe it has exponential decay you would typically provide the duration in terms of one e-fold. I call this ATe. But you could express the duration in terms of how long it takes to make the full trip down to the pre-release level. I call that ATf. ATe in the real is a couple hundred years. ATf may be closer to 1 million years.

          • bdgwx says:

            SPA said…They huddle up in their little rooms filled with smoke and mirrors and concoct away.

            We aren’t making things up on our own. The models we support were constructed by experts far smarter than you or us.

            SPA said…They dont care that it doesnt fit real-world anything, obfuscate away.

            Show me a real-world event in which a significant carbon release was followed by a reduction in the total mass that lasted only 16.5 years to adjust to within 1/e of the pre-release level.

          • bdgwx says:

            Chic said: You cant calculate e-times any other way. Predicting an e-time is guessing.

            I can calculate the e-time of my bank account given only the initial balance and percentage draw down rate. I can do this with 100% perfect accuracy without fitting and observations or guessing.

            I think what you actually mean is that the residence time and adjustment times in terms of an e-fold is very difficult to predict with a-priori knowledge of the physical processes involved. But given enough a-priori knowledge a prediction can be made with reasonable confidence without any observations to go on whatsoever. Would it be hard? Yep. Would it be perfect? Nope. But it can be done without any fitting to observation procedures.

          • Chic Bowdrie says:

            Nate distorts physicist Dr. Ed Berry’s analysis of how much atmospheric CO2 is from human emissions with the following series of quotes. I rebut his obfuscations following each quote.

            “The challenge for Berrys model is to predict the e-time. He is unable to do so and simply fits it.”

            Berry’s model is based on the concept that nature sinks all CO2 molecules the same regardless of source. The principle describing this concept is inflow or outflow = level/e-time. It is a steady-state simplification of the differential equation where the change in concentration with respect to time is proportional to the concentration. The solution involves an exponential equation.

            There are two separate problems to be evaluated and modeled. One is 12CO2 for which inflows and outflows are only estimated. A reasonably good fit results using a 4 year e-time. The other problem involves the removal of C14 after the bomb tests. The fit is 16.5 years using the same model.

            “His model estimate of 4 y based on a single reservoir, is completely wrong, so he fudges it and fits it, and claims his model ‘works’ when clearly it doesnt.”

            Berry shows how well a 4 year e-time in his simple model allows a reasonably good explanation for the growth in atmospheric CO2 given the questionable estimates of inflows and outflows. He is not fudging anything.

            “4 and 16 are ‘close enough’ ???”

            The e-times apply to the two separate problems.

            “It is an abject failure of the model to fit observations.”

            The same model applies to two different problems. The difference in the e-times is an open question to be resolved, not a failure of the model.

            “No model is needed to [Fit a decay curve to an exponential].”

            An exponential curve obeys an equation. An equation is a model.

            “The whole point of Berry’s Model is his calculation of e-time from his basic premise: e-time = Level/Input.”

            The point of the model is to show that it adequately explains the measured data in the case of C14 and data estimates in the case of atmospheric CO2.

            “This gives e-time ~ 4 years from well known values of Level and Natural Input Flow. His model fails miserably in this regard.”

            There are no exact measurements of CO2 emissions and absorp.tions. They are estimates. The prediction of a 4 year retention time is from 400 ppm divided by 100 ppm/year.

            There is exact measurements of bomb C14 decay. The e-time for that process is determined from fitting the data to a model. It happens to be an exponential equation. Equations are models.

            Berry’s model works perfectly in both cases. Nate’s model…oh wait, Nate doesn’t have a model. And Nate doesn’t know the answer to why the 4 year and 16.5 year e-times are different either.

          • Chic Bowdrie says:

            bdgwx,

            I can calculate your e-time using only the draw down rate. It is the inverse of the draw down rate. But if you only know the balance and don’t keep track of what you are spending, you can only guess your e-time. This is a bad analogy and by now you should know that. Spending is usually based on a fixed income and fixed spending, not on a percentage of what’s in the bank.

            Berry’s model has nothing to do with RT versus AT. That is a wholly fabricated argument to justify claiming 1000s of years CO2 hanging around.

            That said, I have to retract my claim that an e-time can’t be predicted. For CO2, it might be determined from the energies involved in the emissions and absorp.tion processes. You would still have to measure the e-time to verify your prediction.

          • bdgwx says:

            Chic said: Berry’s model has nothing to do with RT versus AT.

            And that is a problem. Because his model has nothing to do with AT it cannot answer the question of how long it will take for the CO2 level at its peak to adjust down to the pre-release level. He should not be advertising his model as being able to do so.

          • bdgwx says:

            Chic said: I can calculate your e-time using only the draw down rate. It is the inverse of the draw down rate. But if you only know the balance and dont keep track of what you are spending, you can only guess your e-time.

            That’s a good point. If you only track your balance you have to curve fit. And yes…if you know the draw down rate you wouldn’t even need to know the balance. Nice catch.

            In the real world we know a little more than just the CO2 level though. We know how CO2 is sinked and the physical processes that are involved. Now we don’t know them perfectly and we never will, but we should be able to make an a-priori prediction of what the e-time should be based on the physical limitations of the processes involved.

            BTW…I don’t have a problem with curve fitting. Curve fitting is a completely valid method of constructing models. It’s used ubiquitously in nearly all disciplines of science.

          • Nate says:

            Chic,

            “Berrys model works perfectly in both cases.”

            No, it doesnt, and that statement is antithetical to proper skepticism.

            Predicting an exponential decay, as I noted, is trivial, and and not exclusive to his model. It is simply a standard decay.

            For the case of carbon of all kinds he predicts an e-time of Level/inflow = 4 years.

            There is no evidence to suggest that there is such a strong isotope effect that e-time increases by 4x for C12 to C14.

            Please show evidence if you have it. Otherwise it is just an excuse with no supporting evidence.

            If his basic premise that e-time = Level/inflow cannot agree with observational data, then his model is wrong. Its that simple.

            And it is wrong for an obvious reason. It is a single reservoir model. And we KNOW that the Earth’s atm and ocean reservoirs are in series. A simple series model CAN roughly get the right Bomb curve e-time, as I already showed.

          • Nate says:

            Chic,

            The math that you and I were working on before, to describe the decay of atm CO2 concentration excess, of course looks like it has been worked out already, here.

            https://onlinelibrary.wiley.com/doi/epdf/10.1111/j.2153-3490.1975.tb01671.x

            See their eqn 1 and 2.

            One is for the atm to mixed layer and biosphere. And 2 is for ml to deep ocean. They discuss the effect of Revelle factor in a way similar to what we were discussing.

            “If the atmospheric CO2, content increases by x percent, the resulting relative increase of oceanic CO2, (including carbonate) will in equilibrium only be x/chi per- cent. This buffer action of the sea water is taken into account by multiplying the excess CO, content n, by chi in the expression for the flux from the mixed layer”

            This might be the paper that is the basis for the Bern model. It also analyzed the Bomb C14 decay and ocean uptake.

            They point out that multi-box models go back to the 1950s. They didnt agree initially with data for the Bomb decay curve. But were steadily improved and made more complex to make them agree better with measurements.

            You can see how this paper has built on prior work. Its a professional job, and shows the complexity of the problem. Still, it may not be the last word.

            It seems that Berry’s model is even more primitive than the first 1950s multi-box models. And he makes no use of the subsequent development and inclusion of data.

            Looking at this paper, its logic, and its cites, its really difficult for me to accept that Berry’s primitive model, that simply ignores the complexity already discovered, can be correct, or a preferable alternative.

          • bdgwx says:

            That’s a good point Nate. Advocates of the Bern don’t live in a vacuum oblivious to the C14 bomb spike. They’re well aware of it; far more than any of us here and probably Berry as well (based on Berry’s misunderstanding of essential concepts and overly simplistic model). Also, the Bern model, although it gets disproportionate attention, isn’t the only carbon cycle model available nor is it the most complex. Many carbon cycle models are fully coupled GCMs.

          • Chic Bowdrie says:

            Nate,

            My compliments to you for finding and citing that Oeschger paper. This is a welcome change from your frequently useless and obfuscatory comments. I haven’t evaluated it thoroughly yet, but a four compartment model with parameter estimates is exactly the right approach, IMO.

            When I finish reading it, I will reply in a new thread.

          • Chic Bowdrie says:

            bdgwx,

            “And that is a problem.”

            No, the problem is your obsession with AT. It is a meaningless quantity. You can’t even express the equation for it. If you have and I forgot, please reference where. What is the definition of AT? When level returns to baseline right? With the Bern model, the adjustment time is infinity, right? So CO2 never returns to baseline. Useless.

            Berry’s model wasn’t meant to calculate AT or do anything with it, only to demonstrate a model based on sinks that don’t differentiate FF from other emissions. If you guys don’t like his model, come up with something better than it doesn’t fit with the consensus paradigm.

            “We know how CO2 is sinked and the physical processes that are involved. Now we dont know them perfectly and we never will, but we should be able to make an a-priori prediction of what the e-time should be based on the physical limitations of the processes involved.”

            You/we have no idea how much CO2 is sinked other than what IPCC tells us which is about 100 ppm/year. Therefore the best we can do is estimate an e-time of about 4 years. If you think there is more accurate data, then why don’t you reference it?

          • Nate says:

            I would have to say you are back to trolling here.

            Eqn 1 and 2 in the paper above describe the decay of atm concentration. The AT is the time constant for that process.

          • bdgwx says:

            Chic said: No, the problem is your obsession with AT. It is a meaningless quantity.

            The amount of time it takes for the total mass of CO2 to adjusted from the release peak toward the pre-release level is a meaningless quantity? Please explain?

            Chic said: You can’t even express the equation for it.

            I’ve done so multiple times. It is Tp-Ta where Tp is the time at peak level and Ta is the time at the adjusted level. It can be calculated from inflow and outflow since dL=I-O where L is level, I is inflow, and O is outflow. The equations, assumptions, rules, and algorithm of the Bern model is documented here.

            https://www.geosci-model-dev.net/11/1887/2018/

            And the source code is here.

            https://github.com/bernSCM/bernSCM/releases

            Chic said: What is the definition of AT?

            I suppose it won’t hurt to post the definitions yet again.

            Residence Time – The amount of time a specific molecule of CO2 stays in the atmosphere.

            Adjustment Time – The amount of time it takes for the total mass of CO2 to adjust toward the pre-release level.

            Chic said: When level returns to baseline right?

            Yes. Or more precisely it is when the level adjusts towards the pre-release level. If the adjustment target is for a 50% reduction the value will be in terms half-life. If it is 63% or one e-fold it will be in terms of e-time. If it is 100% it will be in terms of a full retrace.

            Chic said: With the Bern model, the adjustment time is infinity, right?

            Not infinity but it could be really long. For the Bern model above AT(0.50)=50 years, AT(0.37)=200 years, AT(0.20)=1000 years.

            There are many other carbon cycle models. The Bern model as I understand is actually overly simplistic. In that regard I don’t know why it gets so much attention.

            For the slugulator model (http://climatemodels.uchicago.edu/slugulator/) the values are AT(0.50)=1000, AT(0.37)=2000, AT(0.20)=4000, AT(0.1)=20000 for the same 100 GtC pulse.

            Chic said: So CO2 never returns to baseline. Useless.

            Not for a really long time. Remember, new carbon mass was added to the biosphere, hydrosphere, and atmosphere. The baseline level of those reservoirs in aggregate went up.

            Consider 3 water tanks of varying sizes connected by pipes with valves that restrict the flow rates. If you pour water into one tank and wait for a new equilibrium to be achieved the baseline level of all tanks will be higher…permanently.

            If Berry’s model assumes that the baseline will not change then his model violates the conservation of mass principal. That is useless.

            Chic said: Berry’s model wasn’t meant to calculate AT or do anything with it, only to demonstrate a model based on sinks that don’t differentiate FF from other emissions.

            The Bern model and the many other carbon cycle models in existence don’t differentiate FF emissions from other emissions either. Any release regardless of the source has the same AT.

            Chic said: If you guys don’t like his model, come up with something better than it doesn’t fit with the consensus paradigm.

            Experts don’t like his model because it is way too simple, ignores essential concepts that have been known for over a hundred years, and is a really poor match to reality…and I mean like REALLY poor match. It is orders of magnitude off in explaining the duration of all previous significant release and depletion events in Earth’s history.

            I can’t come up with anything better than the consensus. The people who work on the consensus are far smarter than I and already have models that work quite well. It would be a fools errand for me to expect to do any better.

            Chic said: You/we have no idea how much CO2 is sinked other than what IPCC tells us which is about 100 ppm/year.

            A 100 ppm/yr estimate seems reasonable and is infinitely better than “no idea”. Even if the uncertainty on that estimate is +- 50 ppm/yr that is still infinitely better than “no idea”. And given all of the lines of evidence at our disposable I would say we have “a really good idea” of what the sinks are. Is our idea perfect? Nope. Will it ever be perfect? Nope. But our understanding of the sinks is not even remotely close to “no idea”.

          • Nate says:

            “No, the problem is your obsession with AT. It is a meaningless quantity. You cant even express the equation for it. If you have and I forgot, please reference where. What is the definition of AT? When level returns to baseline right? With the Bern model, the adjustment time is infinity, right? So CO2 never returns to baseline. Useless.”

            This IS pretty much obfuscation. You should know very well by now what BDGWX and I are talking about with AT. The point is the relaxation of concentration will be much longer than the RT of 4 y. When concentration-baseline reaches 1/e of its initial value, that is AT. It may be a multi-exponential process, but so what?

            If AT is >> 4 years, this is hardly useless information. This means that concentration is proportional to the CUMULATIVE emissions over many decades.

            “Berrys model wasnt meant to calculate AT or do anything with it”

            FALSE, he claims up front that is what his model aims to do, and thereby show that anthro emissions have long ago been sinked.

            “If you guys dont like his model, come up with something better than it doesnt fit with the consensus paradigm.”

            Many people have already come up with better models in the 1950s- today , that have been tested and revised, and formed the basis for the current paradigm. No compelling scientific reason to dump a paradigm that is working.

          • Chic Bowdrie says:

            Although this is fun, I have a life other than commenting here and I’m not keen on beating dead horses. Meanwhile, I’ve been reading Nate’s reference on a model he states might be the basis of the Bern model. Let’s investigate.

            I’ve moved the discussion down to a new thread starting with a response to Nate’s comment at 4:05 AM.

    • Nate says:

      “It matters to you, because that evidence is not strong enough to allow you to make your case without relying on appeals to authority. No offense meant to your experts, but science is not done by committee or just being familiar with the literature.”

      BS. We present you evidence over and over and it is generally dismissed and often misunderstood.

      Experts know things that you and I don’t. I value expertise. That is why I’m not into DIY heart surgery.

      Berry is not a bona-fide carbon cycle expert. His models are based largely on ignoring the known carbon cycle facts, like the Revelle factors, the temperature dependence of solubility.

      That makes his ideas cartoonish to people who do understand the facts.

      • Chic Bowdrie says:

        How does ignoring the Revelle factor invalidate the Berry/Harde/Salby models?

        • Stephen Paul Anderson says:

          The outflow in the continuity equation uses the hypothesis that outflow is proportional to CO2 level. The Revelle factor would not affect this hypothesis.

      • Nate says:

        Weve been over this at length.

        Revelle explains that the total carbon DIC ‘level’ in the ocean mixed layer (ML) increases only 5% when the atm CO2 level increases 50%.

        If output of carbon from ML to deep ocean is proportional to its ‘level’, then its output has only increased 5%. While its input from the deep ocean is little changed.

        This results in a bottleneck in flow of carbon from atm to ML to deep ocean.

  45. Entropic man says:

    Chris Bowdrie

    I am a skeptic prepared to challenge anyone who takes a dogmatic position that is scientifically flawed. ”

    Then why are you not attacking the scientifically flawed memes promoted by lobby groups such as the Heartland Foundation?

    • bdgwx says:

      And considering the work of 3 guys while ignoring the hundreds of other peer reviewed works especially given the numerous criticisms concerning essential and fundamental points is the opposite of being skeptical. One thing I’m starting to realize is that contrarians on the topic of climate change don’t seem to be very skeptical.

      • Chic Bowdrie says:

        Did you intend to say anything substantive or were you just offering some useless commentary?

      • Stephen Paul Anderson says:

        It really isn’t the work of just three guys and you know it. But, authority doesn’t trump truth. No amount of authority makes AGW true. Ed Berry has this statement in his second preprint…..

        Authors who conclude that human CO2 increases atmospheric CO2 by only a small amount include Revelle and Suess [3], Starr [4], Segalstad [5], Jaworoski [6, 7], Beck [8], Rorsch, Courtney, and Thoenes [9], Courtney [10], Quirk [11], Essenhigh [12], Glassman [13], Salby [14-17], Humlum [18], Harde [19, 20], Berry [21-23], and Munshi [24-28].

        Authors who support the IPCC [1] position – that human CO2 has caused all the increase in atmospheric CO2 above about 280 ppm – include Archer et al. [29], Cawley [30], Kohler [31], and their many references.

      • bdgwx says:

        You are right. It doesn’t matter who presents the hypothesis. What matters is how consistent the hypothesis is with ALL available lines of evidence and that all hypothesis are considered and evaluated in the same manner and that the evaluation can be repeated and replicated by everyone.

    • Chic Bowdrie says:

      Like what? Don’t be drive-by troll.

      • Nate says:

        Stop being a troll yourself.

        Demanding to see the evidence that we have shown you and discussed ad nauseum with you 47 times, and you which can easily Google yourself.

        What is lacking is any evidence for the large jump in a natural source of CO2 that you guys claim exists.

        Show us evidence.
        Where is it from?
        What has caused it to jump in the last century?
        What is the mechanism for it?

        For that matter,

        Where did the EXTRA anthro carbon go? Science can track it and determine that 45% went into the atmosphere and most of the rest in the surface ocean.

        You guys claim, without any evidence, that almost all of it has gone somewhere else.

        Show us the evidence.

        • Chic Bowdrie says:

          Been there done that with you. No sense getting into a pissing contest with you over evidence when you will obfuscate the heck out of anything said.

        • Nate says:

          “getting into a pissing contest with you over evidence”

          IOW, I have no evidence, and must evade.

          I am quite happy to demand your evidence, then I will call it obfuscation, and piss all over it.

  46. Entropic man says:

    Chris Bowdrie

    Light reading on Revelle factors.

    https://agupubs.onlinelibrary.wiley.com/doi/10.1029/2008GB003407

  47. Entropic man says:

    Stephen Paul Anderson

    ” But, authority doesnt trump truth. No amount of authority makes AGW true. ”

    It’s not the authority, it’s the evidence. What makes AGW true is not the opinion of one expert, but the accumulated evidence.It is that weight of evidence which supports the theory, not that any one professor says it is so.

    I find it ironic that you attack another poster for using the
    argumentum ab auctoritate and then put up a list of your own authorities.

  48. gallopingcamel says:

    @Chick Bowdrie,
    Thanks for taking on the mindless trolls so steadfastly. I read the comments carefully and decided not to comment since the discussions mostly ignored the issue raised by Dr. Roy.

    The widespread lockdowns related to COVID-19 have had a huge effect on CO2 emissions. The lowest estimate I found was -5% and the highest -15%. Eventually someone will narrow it down but I can’t help with that.

    Dr. Roy is saying that the reduction in man-made CO2 emissions would have to be at least four times larger than it is to have a significant effect on the Keeling curve (aka the Mauna Loa measurements of CO2 concentration).

    So the devastation of economies around the world and ruining the lives of millions of people had no noticeable effect on [CO2]!!!!!!!

    So let’s imagine something ten times worse such as the “Green New Deal”…….catastrophic reductions in productivity so cities are emptied because their citizens are needed to cultivate crops by hand since their won’t be any tractors or harvesters.

    Be careful what you wish for.

    • Chic Bowdrie says:

      gallopingcamel,

      Yes, most of the discussion has been off topic. But I can’t resist getting involved when the discussion gets off science.

      People our age have got to wander what is happening to our youth and the world when looting is considered appropriate protest against police brutality, a Wendy’s is burned at the site of botched police arrest, anarchists take over six blocks of a major US city, and a statue of Winston Churchill in London is defaced by anti-racists of all people.

      God help us.

      • gbaikie says:

        It’s just mostly lockdown angst.
        It’s normal. And media not even pretending to media- it’s a humorless Jon Stewart, and chasing ad revenue.

        • gallopingcamel says:

          IMHO the Media has driven us crazy. Remember what H.L. Mencken said about keeping the public frightened:

          “The whole aim of practical politics is to keep the populace alarmed (and hence clamorous to be led to safety) by menacing it with an endless series of hobgoblins, all of them imaginary.”

    • Nate says:

      Extremism, on both sides, is never good.

      Looting makes no sense. Saying there should be no police, makes no sense.

      Protest over a real issue makes sense and seems to have a positive impact, and should not be equated with extremism.

  49. Entropic man says:

    ” We basically have three choices: mitigation, adaptation and suffering. Were going to do some of each. The question is what the mix is going to be. The more mitigation we do, the less adaptation will be required and the less suffering there will be, ”

    John Holdren

    Galloping camel, Chic Bowdrie

    You choosing to suffer?

    • gallopingcamel says:

      CO2 is not a pollutant….it is the gas of life. John Holdren and Lisa Jackson who preceded him display ignorance of science. Holdren should no better but he sold his soul to get a better job.

      Holdren offered false choices. Thanks to more CO2 in the atmosphere the planet is greening and crop yields are up all around the world…..where is the suffering in that?

      I can’t speak for Chick Bowdrie but I expect to make $1 million out of the COVID crisis so that I will be able to increase my carbon footprint.

      I don’t mind telling you where the $1 million is coming from. I bought UCO at $15 when the benchmark WTI (West Texas Intermediate) was $20/bbl. When WTI hits $60/bbl my investment will have increased by a multiple of 9:1. If WTI spikes at $100/bbl the multiple will be 25:1. I may have found a profitable use of my modeling skills by betting on fossil fuels!

  50. Crakar24 says:

    Nate, I appreciate it must be hard keeping up with all the sudden changes in direction issued to you by your preferred authorities figure forcing you to look a little silly on topics pike this.

    I also understand your reluctance to accept ice core evidence that clearly demonstrates co2 lags temp forcing you to abandon science and resort to dogma.

    Put simply if I ask you a question you find difficult to answer just say so don’t pretend its a straw man so you font have to acknowledge its too difficult.

    Its really rather simple and we have 3 options to choose from.

    1, we see no change in CO2 levels because as we have been told CO2 stays in the atm for approx. 1000 years and therefore no matter what green new deal we choose its all a waste of time.

    2, we have not reduced co2 emissions long enough to see a change in levels, the current reduction has brought the world economy to its knees, to continue will cause mass starvation/death around the globe driving the human race back to the stone age type life style.

    3, Our Co2 emissions make very little difference to global levels as supported by the ice core dara yiy ignore meaning we don’t need a GND carry on……

    Your choice, choose wisely

    • Nate says:

      Crackar,

      If you insist on framing things as strawmen, then I need to explain what that is.

      A strawman is posing the other teams argument falsely, often as a caricature of the real argument, and then knocking it over easily. It misses the other team’s point, typically on purpose.

      “1. we see no change in CO2 levels because as we have been told CO2 stays in the atm for approx. 1000 years and therefore no matter what green new deal we choose its all a waste of time.”

      Climate science is saying the long term trend in CO2 is up, due to anthro. Climate science has NEVER said Co2 will go up over every 3 mo period. Not what Roy and others have been saying. We see no change because 3 months is insufficent. It is well known that CO2 goes up and down over 3 month periods due weather, ENSO, and seasonal effects.

      “3, Our Co2 emissions make very little difference to global levels as supported by the ice core dara yiy ignore meaning we dont need a GND carry on”

      Huh? The ice core data shows little change in CO2 for the last few millenia, even during the MWP to LIA. Only when our emissions increased dramatically did the ice core show an unprecedented rise in CO2, which has tracked cumulative emissions ever since.

      During the glacial period it shows that CO2 dropped ~ 80 ppm when global temps dropped ~ 5-10 C. This shows temp sensitivity is way too low to account for 20th century rise.

      “2. we have not reduced co2 emissions long enough to see a change in levels, the current reduction has brought the world economy to its knees, to continue will cause mass starvation/death around the globe driving the human race back to the stone age type life style.”

      First sentence correct, the rest…

      No one sensible has suggested this route to reducing CO2, ie ;ots of people stop working and using energy. What is being proposed is gradually REPLACING current energy sources with low emission sources.

      Another strawman.

  51. Crakar24 says:

    SPA,

    That is not how resistors in parallel work, the total resistance WILL be greater than the smallest resistor

  52. Crakar24 says:

    SPA,

    Sorry misread your comment you are right

    Cheers

    Crakar24

  53. crakar24 says:

    Nate,

    Why do you persist with this straw man accusation approach?

    I offered 3 scenarios which you responded to, there is no need to invoke the straw man attack. I suggest it is the standard knee jerk reaction by people such as your self as even by your own definition of what a straw man is have not built one (get a grip).

    Responses:

    1, You go off track here with some…..dare i say straw man comments. From the IPCC

    The removal of human-emitted CO2 from the atmosphere by natural processes will take a few hundred thousand years (high confidence). Depending on the RCP scenario considered, about 15 to 40% of emitted CO2 will remain in the atmosphere longer than 1,000 years. This very long time required by sinks to remove anthropogenic CO2 makes climate change caused by elevated CO2 irreversible on human time scale.

    Chapter 6 from Working Group 1.

    Therefore my point 1 in the above comment still stands or are you now saying the IPCC got it wrong?

    2, But, but, but we only have ten years to “save the planet” (Rg Tm) you know the drill Nate we dont have time to waste, we cant slowly destroy our current reliable, cheap sources of power generation which took 5 decades to build we have to destroy it NOW so put a few more carriages on the subsidy gravy train shut down that coal/gas/nuke plant and grind world economies into the dirt…………straw man my ass once again get a grip.

    3, The IC data clearly show CO2 rise and fall lag Temp rise and fall surely you would agree with that unless you are like Al Gore and swap it all around for a TV show. The theory is if CO2 does lag temp then what caused the temp to rise and fall.

    Ergo there is something far more powerful out there driving planet scale weather, a bit of home work for you.

    a, calculate the lag between CO2 and Temp changes
    b, find out when the MVP ended (yes i know you dont believe in the MWP but for now just pretend it happened and it was a global
    event)
    c, maths….2020 – end of MWP = X
    d, compare X to CO2 lag time as per IC data

    Regards

    Crakar24

    • crakar24 says:

      Sorry left out a step…..who am i kidding you wont do it so i will do it for you.

      The MWP dates 950-1250

      CO2 lags temp by approx 800 years when the temp begins to rise as per IC data

      950 plus 800 = 1750

      Question, what year does the CO2 begin to rise? If you google the one hundred odd graphs they all show CO2 began to rise around 1750.

      Nate you have two choices.

      1, You can respond with ramblings about straw men or,
      2, Respond with evidence to show i am wrong

      Your choice

    • bdgwx says:

      1. Yes. It takes a long time for a release of CO2 to adjust toward the pre-release level. But, if the release is small then at all points in the decay curve the level will be lower than it would have been otherwise. This means the warming is less.

      2. The IPCC does not state that we only have 10 years (or 12 years) to “save the planet” whatever that means. What they state is that there are time windows in which mitigation must start taking place to keep the cost low. There is an incremental cost to waiting. Mitigation has a time value. The longer you wait the more costly it gets to accomplish the same level of mitigation. This is documented in AR5 WGIII.

      3. Yes. The IC data does show that CO2 trajectories generally lag temperature trajectories. This is expected. CO2 is in both a feedback and forcing relationship with temperature. Sometimes it will lead and sometimes it will lag. It leads when it is released first and catalyzes a temperature change. It lags when something else catalyzes a temperature change and CO2 gets released as a result. The glacial cycles are examples of primarly lag events while the PETM and other ETMx or sudden onset carbon releases are examples of primarily lead events. The anthroprogenic release is completely independent of the temperature. Therefore for the modern warming period CO2 is catalyzing the temperature change and is thus leading it.

      a. For the glacial cycles the lag is generally (but not always) on the order of a few hundred years.

      b. Can you post a link to a dataset of global mean temperature that you feel is accurate enough to assess the MWP and a definition of MWP and then we’ll tell when it started and ended.

      c/d. What do you hope to accomplish here?

    • Nate says:

      Crackar,

      You persist with strawmen.

      “we have to destroy it NOW” Yeah. No.

      “clearly show CO2 rise and fall lag Temp rise”

      In the modern record, there is little lag between ENSO and atm CO2. Little lag between large volcanic eruptions and CO2 levels.

      Any 800 y lag you are talking about in the ice core record has to do with melting of hundreds of meters of glacial ice covering vast swaths of the continents.

      There is no 19-20th century equivalent of that going on.

    • Nate says:

      Crackar,

      As far as this goes:

      “The removal of human-emitted CO2 from the atmosphere by natural processes will take a few hundred thousand years (high confidence). Depending on the RCP scenario considered, about 15 to 40% of emitted CO2 will remain in the atmosphere longer than 1,000 years. This very long time required by sinks to remove anthropogenic CO2 makes climate change caused by elevated CO2 irreversible on human time scale.”

      The point of mitigation has always been to keep CO2 levels from rising further, and global temps from rising too high, and then causing irreversible events, such as melting of ice-sheets and rising sea levels, which in-turn will cause further warming.

      Models show that if emissions go to 0, a small reduction in CO2 levels happens over a few decades, followed by a long lasting lower level plateau.

      Thus ” therefore no matter what green new deal we choose its all a waste of time.” is still a STRAWMAN

  54. gallopingcamel says:

    @Nate:

    “Huh? The ice core data shows little change in CO2 for the last few millenia, even during the MWP to LIA. Only when our emissions increased dramatically did the ice core show an unprecedented rise in CO2, which has tracked cumulative emissions ever since.”

    I am astounded by your lack of erudition. I have been a fan of the GISP & GRIP ice core data for many years.

    These ice cores show that the concentration of [CO2] flatlined from 1500 B.C. to 1800 A.D. The [CO2] was 275 +/- 5 ppm for 3,500 years. During the same period the temperature swings were large and many. Both the Minoan and Roman Warm Periods were warmer than the modern warm period (time now).
    https://diggingintheclay.wordpress.com/2010/12/30/dorothy-behind-the-curtain-part-2/

      • gallopingcamel says:

        Svante,

        You are fact checking a “Straw Man”. That paper you linked was debunking the Easterbrook analysis published in “Watts Up With That”.

        The Easterbrook chart looks quite different from mine since it seriously underestimates the modern warm period. The GISP2 study ends in 1855 so I contacted Richard Alley at Penn State (GISP2 paper), met with Tom Peterson (GHCN/NOAA) and corresponded with DMI scientists and Albert Klein Tank. All that work was aimed at “Scaling” the modern warm period as accurately as possible.
        https://diggingintheclay.wordpress.com/2010/12/28/dorothy-behind-the-curtain-part-1/

        Somehow you failed to comment on my main point. If CO2 is driving temperature how can temperature go up and down like a yo-yo while [CO2] flatlines!

        • bdgwx says:

          If CO2 is driving temperature how can temperature go up and down like a yo-yo while [CO2] flatlines!

          Because CO2 isn’t the only factor driving Greenland temperatures. It’s not even the only factor driving global temperatures.

          • Svante says:

            A neglected factor is that CO2 (and CH4) operate indirectly via the wildly fluctuating water vapor feedback.

          • bdgwx says:

            There’s also volcanic aerosols, solar output, albedo, etc. In addition Greenland is sensitive to the AMO and the AMOC.

          • gallopingcamel says:

            Finally you got it. There are natural processes at work that completely over power the effect of CO2.

            Ergo, mitigating CO2 is futile.

          • Svante says:

            The CO2 forcing increase is tiny year to year.
            It just wins in the long run.

            Take the UAH graph and rotate it until the trend is flat.
            That’s the difference CO2 (+ CH4) makes.

          • bdgwx says:

            GC, there are natural forces at work. Sometimes they overpower CO2 and sometimes they don’t. We just happen to be living in an era where the CO2 force +2.0 W/m^2 which is 10x higher than at any point during the holocene. There is no natural force that is overpowering it today. Though human aerosols are quite potent and pull the net force down quite a bit.

            BTW…CO2’s radiative force is natural. What isn’t natural is how it got into the atmosphere.

        • Svante says:

          GISP2 is not quite global, but you are basically right.

          Here’s some science:
          https://agupubs.onlinelibrary.wiley.com/doi/pdf/10.1029/2011GL049444

          Fig. shows 2010 at about -27 C (UAH has trended up 0.14 C since then). Two peaks are roundabout the same: 700 C.E. and 1100 B.C. The MWP was mostly below -30 C.

    • bdgwx says:

      GC, notice the significant warming in the DMI record. It is unprecedented in magnitude in timing since at least -1500 BC. It also occurred with the backdrop of a secular multi-millennia decline in temperature. So whether or not Greenland is warmer today compared to the past 4000 years or so the modern warming still stands out as a significant event either way.

      • gallopingcamel says:

        @bdgwx,

        There is nothing “Unprecedented” about the DMI records:
        https://diggingintheclay.wordpress.com/2010/12/30/dorothy-behind-the-curtain-part-2/

        The first chart shows the raw data and since that is a little confusing the second chart averages the data monthly and a 10 year rolling average (the red line).

        Look at the red line….falling from 1875 to 1885…rising from 1885 to 1934……falling from 1934 to 1975……rising from 1975 to 1998.

        I can’t see any correlation between [CO2] and temperature. Can you?

        • bdgwx says:

          Your graph from -1500 to 2000 shows a nearly +3C rise in about 120 years from the DMI record. It took about 2000 years make a -3C drop.

          No. The correlation between CO2 and temperature at Greenland over this period is not very good except for maybe the last 150 years. In fact, CO2 was trending up slightly while Greenland temperatures were dropping. But we don’t expect Greenland temperatures to be driven by CO2 and only CO2. CO2 is but one piece of the puzzle.

          BTW…the CO2 force from -1500 to 1800 was about +0.2 W/m^2. From 1800 to present it is about +2.0 W/m^2.

    • Nate says:

      GC,

      “I am astounded by your lack of erudition.”

      I can’t tell what you disagree with in my post GC.

      Your data shows that temperature is a weak driver of CO2 levels.

      We agree!

      • bdgwx says:

        I hadn’t even considered that. The IC data is inconsistent with Berry/Salby/Harde’s assertion that temperature drives CO2 level. If that were the case then we’d expect a few thousand years of a secular decline of CO2 level following a couple hundred years of modest (only a few ppm) increase. Yet what we actually observe is a 130 ppm increase bringing us to levels not seen for millions of years…far larger than we would be expected if temperature and only the temperature modulated the CO2 level.

      • Nate says:

        GC

        Solar insolation @ 65 deg N is the driver of Milankovitch glaciation cycles. It peaked at Holocene optimum.

        And it is where Greenland is. It makes sense that its temperature swings more than the rest of the Earth.

        https://www.researchgate.net/figure/Calculated-variations-in-insolation-from-the-sun-based-on-the-Milankowitch-theory-It_fig1_308416665

        • gallopingcamel says:

          In principle Milankowitch cycles are the most plausible mechanism to explain the last seven glacial cycles so perhaps we agree on something.

          Given that my approach involves numerical analysis I have tried to use Milankovitch theory to predict when the next glaciation will start. Thus far I have totally failed to explain the past, let alone predict the future. If you know anyone who has a model that works over the last 800,000 years please share it.

  55. Stephen Paul Anderson says:

    It is arbitrary because it never reaches the prerelease level. Within about 4 e-times it is close enough. (0.63)^4 is close enough.

    • bdgwx says:

      I realize this was posted at the bottom by mistake and was meant for a thread above. But can you go ahead and expound on the point you were making here. I’m not sure I understand your context here.

  56. Brendan says:

    Clyde Spencer

    About a week ago you said that the anthropogenic CO2 contribution is about 5 PPMv per year.

    But CO2 is only rising by 2.5ppm. How can anthropogenic be rising by double what the total rise is?

    • Entropic man says:

      Because the atmosphere is not the only part of the climate system through which CO2 circulates. There are also the oceans and the living things, the biomass.

      Think of three aquarium tanks,half full and connected by siphons. The water levels in the three tanks settle to the same height.

      If you add three litres of water to one tank it’s level rises, but then settles again as 1 litre flows into each of the other tanks.

      Similarly when you add 5ppm equivalent of CO2 to the atmosphere, about half of it then moves into the ocean and the biomass.It hasn’t gone away, but it no longer shows in the ppm measurement for the atmosphere.

  57. Entropic man says:

    “Both the Minoan and Roman Warm Periods were warmer than the modern warm period (time now). ”

    That turns out not to be the case.We are now warmer than both.

    http://railsback.org/FQS/FQS22katoFutureTemps03.jpg

  58. Aaron S says:

    I will try to post a reply on the string again.
    I do not want Human population growth to continue. I would prefer we regress to 5 billion or so.

    • gallopingcamel says:

      @Aaron S,

      It is truly sick to hate humanity the way you do. Two billion plus deaths is a good thing? Think about it…..two billion rounds of ammunition or gas chambers?

  59. bdgwx says:

    To boil down my criticisms of Berry’s work into 4 points…

    1. If he wants to convince me that only 12% (31 of 260 ppm) of human emissions contributed to the atmospheric rise from 280 to 410 ppm then he should identify the reservoir that was tapped, how it was tapped, and the amount by which it was tapped to account for the remaining 130 – 31 = 99 ppm by which the atmosphere increased. He then needs to explain how 229 ppm of CO2 could go into the atmosphere but not participate in increasing the level. I want a clear and concise carbon budget that is balanced. I want to know what reservoir gave that extra 99 ppm of CO2 to the atmosphere.

    2. If he wants to convince me that the total mass of the atmospheric carbon will deplete by 63% in 16.5 years then he should show a plot of a previous carbon release and depletion event with ppm or GtC on the y-axis and time on the x-axis demonstrating that it has happened before. Showing me the C14 bomb spike decay curve is not what I’m interested in. I’m interested in the decay of the total mass; not the decay of a particular isotope relative to the others.

    3. Use already established and agreed upon terms to describe well known concepts. If he wants to discuss the amount of time a specific molecule remains in atmospheric circulation he should use ‘residence time’. If he wants to discuss the amount of time it takes for the total mass to adjust toward the pre-release level then he should use ‘adjustment time’. If he wants to discuss other measures then avoid RT and AT since they’ve already been adopted for other concepts. Also, e-time itself is not a measurement or thing that can be estimated. It is the thing by you do the measuring or estimating. The atmosphere does not have an e-time. What it has are physical processes that play out in amounts of time that can be quantify by an e-fold.

    4. Explain why know limitations of carbon transfer like the Revelle Factor should be ignored.

    If he can provide satisfactory responses to these criticisms that are vetted by experts far smarter than I then my interest will be piqued.

  60. Brendan says:

    Entropy man

    Where does your 5 ppmv come from?

    • bdgwx says:

      5 ppm = 39 GtCO2 = 10.6 GtC

      It is the amount of carbon humans release directly into the atmosphere via fossil fuel burning, cement production, land use changes, etc.

  61. crakar24 says:

    Nate,

    You are pathetic, go away and never bother me again

  62. Brendan says:

    Re: Eben’s Holocene chart. This is the correct chart for the Holocene dawn from ice core data. You can ignore the pointer to right axis and the “Recent Proxies” insert. These have been added to the original chart. They are proxies and not raw data from observations and they have been adjusted. I.e. They are fake. Current temperature is still marginally below the MWP.

    Marcott et. al’s chart is a reconstructed chart from tree rings. Tree rings are the most unreliable proxy for temperature. Ice cores are the most accurate. Michael Mann was unable to defend his hockey stick graph from fraud allegations. He is now facing fraud charges.

    Best to use real data.

    • bdgwx says:

      We should ignore recent proxies and the instrumental temperature record?

      We should ignore tree ring proxies because they are unreliable? How are they unreliable?

      How do you know what the global mean temperature was in the past if you only accept non-global proxies?

      Mann has been charged with fraud? Can you post the court documents or at least a news article confirming that he has been charged?

    • Svante says:

      Brendan says:

      Marcott et. al’s chart is a reconstructed chart from tree rings.

      No he did not use tree rings. It was based on:
      – Boreholes.
      – Chironomid transfer function.
      – Diatom MAT.
      – Foram MAT.
      – Foram transfer function.
      – Ice Core δ18O, δD
      – MBT.
      – Mg/Ca.
      – Pollen MAT.
      – Radiolaria.
      – TEX86.
      – UK’37.

  63. Brendan says:

    Aaron

    Just how do you intent to get rid of 2.5 bil people?
    Bullets?
    Compulsory vaccinations?
    CO2 starvation?

  64. Aaron S says:

    Pop control is a real challenge. I understand why people like Bill Gates have said it is off the table in their Ted talks. I will give it a shot for discussion, but I am very aware that I can only speak from a narrow perspective.

    In general, if you tax an activity it decreases, if you subsidize an activity then it increases. So can cut UN type funding for countries that do nothing to reduce population control, reward countries that do fair policy with strong considerations for women’s rights and health. An example of fair policy would be to pay young women/ men that do not have children until they are 21 yr old an basic income. This would also allow them to educate themselves. Reason I say that age is because so many people that ultimately have many kids and create exponential growth start reproducing so young before their brain has even fully crystallized. (Odd humans are fertile before fully brain developed). This would also encourage young female to have the choice to plan their future. Basically, if youth get through the vulnerable stage they are capable of handling their own freedoms to family plan. So I would consider addressing the issue with policy that delays reproducing until the people are fully grown up by paying those that do not but never forces people to conform to a given policy.

    • gallopingcamel says:

      Aaron,
      Just because Bill Gates is an evil ba***rd does not mean that you should be one too.

  65. crakar24 says:

    Its funny because in the old days women were told to keep a penny between their knees (figuratively speaking of course) perhaps you could enact your plan for a far, far cheaper price tag if society held marriage/rearing of children etc in much higher regard.

  66. Aaron S says:

    For example, anecdotal but accurate situation. I hired a web developer from India that was forced into marriage at a very young age. She is still young 22 and recently obtained a divorce to pursue a degree. She described that Her life was out of control when she was young. Had she had a child, her opportunities would most likely decrease. I think the concept above would have helped her because if she had an income her parents could not have directed her and she could have lived independently. Just an idea.

    • gallopingcamel says:

      @Aaron,

      The fact that you care about your female employee tells me that you are not an evil ba***rd so my apologies for comparing you to Bill Gates.

      You are compassionate to people that you know. That does you great credit. Aristotle wrote….”every action seems to be aimed at some good”.

      You need to ask yourself why you hate the bulk of humanity (people you don’t know). Perhaps you are among the millions of people who buy into the “Green New Deal” without thinking through the effect it will have if it was implemented. It will make the recent “Lockdowns” look like a walk in the park.

      • gbaikie says:

        Obviously the US doesn’t have over population problem.
        If imagine US does have over population problem, then US
        should not immigration. If citizen of US want to live in another
        then we accept the amount who leave the US with people who want live in US.
        But I think US should allow a lot more legal immigration, because I think US is underpopulated.
        US is certainly underpopulated in comparison with India. India about 1/3 US land area and has 4 times US population.
        And I don’t India has over population problem.
        Now everywhere there is traffic problem, small towns have traffic problems- but unfortuately due to small size of towns it’s less delay to due shortness of travel distance.

        And seems to me large cities should have far more capability to make less traffic as compared to small towns. Meaning even if one goes longer distance, cities should able to have less delay. Should able to go faster per mile travel and not have any traffic slowdown.
        The obvious advantage is cities can have more mass transit and obviously mass transit is done very poorly. But people have different needs, so one needs all kinds of ways to travel.
        There many ways of doing this- and they no one seems to have much of clue of how to do. Or politicans are idiots.
        Everyone knows politicans are drooling idiots. And reflects very poorly on people who continue to elect these people.
        Now, that you don’t intelligent politicans, and never had, there is simple solution, don’t buy the crap about how capable they are- they aren’t and so, they should given a limited amounts of things they responsible for.
        People can do smart things, if they are not blocked by the numerous and petty tyrants. They might able to do anyhow, but pols get in the way, they tend wreck everything.
        We need more freedom. That US might better about that, then elsewhere, but doesn’t mean we don’t need more Freedom.

        And lack freedom is probably only thing makes India or US seem over populated, which is due inability govern more people.
        If want say it’s not because politicans are too stupid and lazy, and make the argument that there too many laws, to much bureaucracy- that fine, but what political leader has actually done anything about it?
        So, they are stupid, clowns.
        One could say they can’t do anything, because of this. Again, stupid clowns. Who give us endless and same stupid excuses for being incapable leaders they are. They most craving for power and due to their stupid they will always insanely crave for power, and endless, screw up.
        Back to point obviously the US is not over populated. And now come the time of talking about what countries are overpopulated and what what those countries to do about it {cause you desperately want to pretend you are crazy mad tyrant].
        Mexico has 126.2 million people. Are they over populated?
        Land area: 1.973 million square km
        Texas has 695,663 sq km and 29 million
        So in comparison Mexico is over populated in comparison to Texas.
        And Texas lots unused land and so does Mexico.
        Problems with Mexico has nothing to do population.
        There problem is there powerful criminal Cartels.
        One might argue US has a similar problem- certainly part of Mexican Cartels are operating in the US. But you might also talking different kind criminal like gangs/groups.
        Also you blame the US for creating the Mexico Cartels, but I already pointed out that our politicians are stupid and hopelessly incompetent, no need to rehash that.
        If not Mexico what other country, would like manage their affairs- oh yeah, I forget with the UN. The UN the most stupid and lazy and evil and irresponsible creatures known to humankind {and that is including members of the Mexican and Venezuela governments and US Congress who in constant battle with Media to get who can have lowest approval rating with the public- which apparently, they supposes to serve].

        • gallopingcamel says:

          @gbaikie,

          Your comment above was hard to follow as mine sometimes are when I have over indulged in adult beverages.

          Even so I find much to agree with. When it comes to immigration into the USA I am for it since I am an immigrant from the UK and my wife was born in Bogota, Colombia.

          “Aaron S” thinks that the world is over populated by at least 2 billion people. If that was true the actual population would be 5 billion instead of 7.3 billion. While I have no doubt that human population will eventually hit a limit we are not there yet.

          When it comes to individual countries, the USA is lightly populated compared to my home land that has one fifth of the US population packed into 39 times less space. In other words the UK population density is roughly eight times denser than that of the USA. Thus it seems likely that the US could accommodate hundreds of millions more people.

          The big question for Americans is do you like your country the way it is or do you want to pack five or ten times more people in?

          • gbaikie says:

            –The big question for Americans is do you like your country the way it is or do you want to pack five or ten times more people in?–
            3 billion?
            I think it’s more matter of amount doubled per some time frame.
            332,639,000 now and was 151,325,798 in 1950

            Let’s say double every 50 year
            660 million by 2070.
            It seems fine to me. Maybe better to have
            660 million by 2060.

            Where could we be in 2060 AD.
            There is lot of ways to look it. What is going
            on in Africa by 2060 AD.
            It seems we count on them being first world, more than China is first world, at the moment. Same goes for India.
            Which indicate to me a strong force for democracy in the world.
            Can expect peace in middle east by 2060 AD?
            How about democracy in Iran?
            It seem could have both within 10 years, if not, then likely by 2060 AD.
            Never had much hope for Europe, but roughly and optimistically about same by 2060 AD.
            China is currently committing suicide in numerous ways, but we can be hopeful and assume something like Europe by 2060 AD.

            In that world, US doing quite well. But details:
            What happening with AI?
            Did US go to Moon by 2024 AD?
            Did Musk built his Starship. And does work close to expectation?
            I think Moon 2024 and Starship are more important than details where AI has gone.
            I am going to predict Russia, a lot depend on it’s next leader.
            Which true in all cases, it’s seems particularly true in regards to Russia. It seems both Germany and Russia have inherent nature of doing some crazy stuff.

            My optimistic view {which I prefer to be wildly optimistic}
            Is we start mining lunar water by 2026. And land crew on Mars by 2030. Mars exploration doesn’t go as planned, and there human settlement on Mars by 2035 AD. And NASA starts exploring Venus and Mercury starting after 2038 AD [stops its Mars human exploration by 2037 AD- because people living on Mars. NASA find alien life on Jupiter moons by 2040 AD {not due to major program- but due to single robotic mission].
            So what happen twenty years later in US?
            US 2060 AD: We have global suborbital travel. We have hotels in LEO. Every school has lunar sample, along with other earth rocks.
            US education has radically changed- US public education of 2020 AD
            will seem like very, very weird way to educate anyone.
            By 2060, the global satellite market of 2020 of 400 billion will grow at 5% {as it’s forecast to do, roughly continue, but satellite market will become something else. By 2060 satellites going around earth, won’t be a “market followed”, you have suborbital travel, LEO tourism, Lunar industry, Nation {s} of Mars
            mining space rocks, various government agencies doing space exploration and large part will making big telescope {to explore star systems] and etc. And Space Power Satellite should at least being to be made, promises of being “fully deployed within 10 years”. But Mars could have SPS before Earth does. So SPS is huge market which overwhelms all other markets in space, but Mars might only place actually getting any significant electrical power from Space to the planet’s surface. Huge market to terms all stuff needed before a single watt delivered to Earth surface.

            And what all means, is one will launching a lot rockets from Ocean areas, and some people will living in ocean areas. And at some point power from SPS will be going to received in ocean areas.
            But in terms of 660 million Americans in 2060 AD.
            They could have flying cars. Probably rely on more nuclear energy than 20% in 2020 AD. They should have much better transportation infrastructure. Have large businesses which farm large ocean areas. Should have a lot tourism.
            Not much difference. Biggest change could be “low cost living situations”. And more internet type activity- Tele-education, Tele-medicine, etc. Less 9 to 5 car traffic, stuff. Big-Box Stores will mostly be history.
            I think there will less traffic and less masses of people going anywhere. People won’t think there is too many people.
            But politics will look the same. Going have lot night light pollution- far less from the ground and a lot more in the sky.
            Beyond 2060 and beyond US pop 660 million:
            First, there will have already been lots problems associated with low population growth. China and Europe and also a bit with US.
            I think plans of having L-5 colonies will occuring.
            Bigger ocean settlements will in the works.
            Doing something with Sahara Desert, may have already occurred, if not then doing it.
            No significant US population is going to live on Mars. But quite significant population could be going to be living in Earth orbits. And if this starts one could launch from Earth lower by a lot. So 2060 is could be around $100 per kg, could lower to $5 per kg. Though Musk would say he going have below $100 per kg by 2030’s. Maybe it will be $50 per kg, but will lower $5 if a lot people in Earth orbits. And will mostly be about not using chemical rockets to leave Earth. There are various ways to do this. And basically how many people in Earth orbits will depend upon, how much better it is then living on Earth. Better could be related to lower cost of living, but how much fun it is could more a more important factor.
            And when US population is 1.32 billion in 2100 AD.
            SPS had going couple decades and for couple decade electrical power in space is very cheap. Cheap electical power in orbit makes trips to Mars take about 1 month {or less}. Venus will take less than 1 month and Mercury about 1 month. Mercury to Jupiter in about 3 months. Eight hours from Earth to Moon. and getting to LEO remains around few minute, but earth surface to docked somewhere LEO could be about 10 mins {far faster docking than now}.
            Or going LEO is quicker than commuting to the city in 2020. Assuming you near the needed infrastructure that allows this to be cheaply done. But could use chemical rocket if not near such infrastructure- pay more due rocket fuel cost, but it could worth it. Though one could have some kind “fancy” non chemical rocket.
            But not going to LEO, but higher orbit- somewhere around 8 hour trip time.
            And people by 2100 AD the could be living on Moon- millions of people. But L-5 colony type “station” could better than living on Moon and far more people living on them.
            As far as 1.3 billion in US, US about size of China and China has lots land area which not many people are living there.
            By 2100 AD a lot people living on US continental shelf. One add reflected sunlight to Alaska and could significantly increase Alaska’s population. You do things like drop a building structure made in space, somewhere on the ocean. Or by 2100 AD most industry is in space, and things are cheaply made in space- including such things as a “building structure”.
            One advantage of living in space {anywhere in space other than Earth] is you can have very high density “urban population”. You building huge building which are sort of like having 10 km high buildings on Earth. And/or 3 D use of space- rather 2 D living.
            Or one go to many different places requiring shorter travel distances- or travel by elevators. Plus with longer distances, very fast elevators.
            And for human population under a few trillion, with space environment there infinite amount of cheap energy for billions of years.
            Being able to use space resources, Earth probably should not have more than 50 billion people. And seem less crowded then our current world.

          • Svante says:

            gallopingcamel says:
            “human population will eventually hit a limit”

            It’s not going to be limited by resources.
            Economical resources keep growing.

  67. Brendan says:

    The following is what the IPCC say. 4.3% of total emissions are from humans. From isotope measurements 4% is from humans which agrees with the IPCC. This is the only area of this debate where both sides agree on something. Isotope measurements, on the other hand, show a much larger percentage of emissions from the oceans, more than 50%

    Emissions Source Amount Percent
    (PgC/yr)

    Natural
    Respiration and fire 118.7 57.3%
    Ocean out gassing 78.4 37.9%
    Fresh water out gassing 1.0 0.5%
    Volcanism 0.1 0.0%
    _________ _________
    198.2 95.7%

    Man made
    Fossil fuels 7.8 3.8%
    Land use changes 1.1 0.5%
    __________ ___________
    8.9 4.3%
    __________ ___________
    Total 207.1 100.0%

    IPCC AR5 Ch 6 Pg 471

    Human CO2 emissions are 0.1 ppm per annum.

    Your 39 GtCO2 is coming from global carbon budgets. These are all estimates and guesses and calculated with models and they all have an inbuilt false assumption that all CO2 emissions are coming from humans and zero emissions from the oceans. The oceans are the biggest emitter.

    • bdgwx says:

      8.9 GtC = 32.6 GtCO2

      That is the 2000-2009 average. Human emissions have increased since then. They are now close to or exceeding 10 GtC.

      Yes. The oceans are a big source. They are also a big sink. The net flux of the ocean is estimated to be -1.1 ppm/yr. The net flux of the land is estimated to be -1.1ppm/yr. IPCC AR5 WGI Ch 6 Figure 6.1

      BTW…the land is the biggest emitter at 118.7 GtC vs 78.4 GtC for the ocean. In terms of net the biggest emitter is humans at 8.9 GtC. The land and ocean are now net absorbers.

  68. Brendan says:

    Sorry the table got reformatted. All the data is there you’ll have to rebuild it.

    • bdgwx says:

      It’s all good. Commenting on this blog is frustrating. We all understand. Besides I have the full AR5 report downloaded so its not a big deal.

  69. Brendan says:

    From Isotope measurements we know the following:

    1. 4% of CO2 emissions are from humans. CO2 rises by approximately 2.5 ppm per annum. 4% of that makes human CO2 emissions 0.1 ppm per annum.

    2. All CO2 has a 4 year resident time in the atmosphere. None goes straight into the oceans and nothing hangs around for 1000 years. The atmosphere does not discriminate between molecules.

    3. The major source of this 2.5 ppm CO2 increase is from the oceans hence the oceans are emitting more than they are absorbing. Warm oceans emit. Cold oceans absorb. We have just gone through 350 years of warming.

    A new NASA study (Junjie Liu et al) using data from NASA’s Orbiting Carbon Observatory-2 (OCO-2) satellite provides space-based evidence that Earth’s tropical regions were the cause of the largest annual increases in atmospheric carbon dioxide concentration seen in at least 2,000 years

    • Nate says:

      Fabricated ‘facts’ won’t convince anyone Brendan.

      • Brendan says:

        You can’t fabricate measurements.

        • bdgwx says:

          And all of our measurements unequivocally say that humans are the cause by almost 100% of the atmospheric rise in CO2. All measurements say the biosphere is a net absorber. All measurements say the hydrosphere is a net absorber. All measurements say the atmosphere is a net absorber. All measurements say volcanism and rock weather are really small net emitters. All measurements say humans are large net emitters. The net human flux is 4x larger than either the hydrosphere/atmosphere or biosphere/atmosphere fluxes. That is what the measurements say.

    • bdgwx says:

      1. Between 2000-2009 natural emissions were 93.2 ppm/yr and human emissions were 4.2 ppm/yr. Humans emissions are 4.2/93.2 = 4.5% of the total emissions per annum. IPCC AR5 WGI Figure 6.1

      2. The residence time is about 4 years. That is the amount of time a specific molecule stays in the atmosphere. That is a different concept than adjustment time which is on the order of hundreds to even hundreds of thousands of years. That is the amount of time the total mass takes to adjust toward the pre-release level after peaking. And if the atmosphere does not discriminate between molecules (which I agree with) then why are you assuming that 100% of natural emissions can contribute to an atmospheric increase but only 4% of the human emissions can? I mean…didn’t you just say that they are treated equally?

      3. Ocean pH is declining. That means the ocean is a net absorber. That makes since because 260 ppm of human emissions got injected into the atmosphere directly thus increasing the partial pressure differential and the rate of uptake. There was only a 130 ppm rise so the biosphere and hydrosphere because both took up more carbon as a result of the excess carbon being added to the atmosphere.

      Oh and that new NASA study by Liu et al…you have severely misrepresented what it says. In fact, right out of the gate in the first paragraph it says and I quote, “The anthroprogenic emission of CO2, primarily from fossil fuel usage, has lead to average global CO2 mixing ratios reaching historically high levels of > 400 ppm.” The publication also comes right out and says the biosphere and hydrosphere are net sinks for carbon by about -4.3 GtC and -2.4 GtC respectively. That means they are both taking carbon from the atmosphere; not giving it. This publication contradict your points 1, 2 and 3.

    • Chic Bowdrie says:

      1. Brendan and bdgwx roughly agree given that the numbers come from estimates other than the average of 2.5 ppm/year which is from Mauna Loa data.

      2. Brendan and bdgwx roughly agree. AT is a red herring and one can infer that Brendan meant 96%, not 100%, of natural emissions can contribute to an atmospheric increase.

      3. bdgwx is correct about oceans being a net absorber, because the total dissolved inorganic carbon is increasing.

      Brendan suggests the biosphere could be a net emitter. So what both say about the Liu et al. paper conflict.

      Using a back-of-the-envelope calculation with 5 ppm human and 100 ppm natural emissions, a sink fraction of 0.25 (1/4yr), and the atmosphere containing at most 4% human emissions, the 2.5 ppm annual increase would amount to 0.9 ppm human and 1.6 ppm natural. That’s humans contributing 36% of the rise, about what Berry’s model predicts.

      • bdgwx says:

        The recent OCO-2 and biosphere carbon flux paper coauthored by Liu is unequivocal. The biosphere is a net absorber. Specifically it is -4.3 GtC +- 0.25. Section 3.3 pg. 13276

        “From Table 1 it can be seen that annual global mean posterior NEE flux, when using the different prior models and assimilating synthetic LN+LG OCO-2 XCO2, ranges from −4.11 to −4.36 PgC yr−1, which is generally close in magnitude to the true flux of −4.31 PgC yr−1.”

        Note that NEE is net ecosystem exchange.

        https://tinyurl.com/y9d4bznz

        • Chic Bowdrie says:

          I don’t see how the either biosphere or hydrosphere could be anything else but net emitters. You are making a trivial point. I’ll explain.

          Assume there was no net change in the biosphere or hydrosphere exchange until humans emerged from the caves. Suddenly a pulse of CO2 entered the atmosphere. If any of that pulse is absorbed by the reservoirs, they become net absorbers.

          Your problem is to show that sometime in the future they didn’t begin emitting more absolute amounts of CO2 than they were previously.

        • bdgwx says:

          I think you mean net absorber. But, yes, it may be trivial to you and I, but Brendan claimed the biosphere was a net emitter. His reference even confirms it is a net absorber.

          Anyway, your point is fair. We should look to see if the biosphere and hydrosphere have begun emitting more CO2. If nothing else we learn more about the carbon cycle.

          But, if they had begun to emit more than they would have had to begun absorbing more as well based on observations that they are net absorbers. And because the level was relatively stable for thousands of years we know the sources and sinks must have been pretty well even prior to the human release. They clearly are not even today based on the extreme rate of CO2 increase observed today.

          And we know that if a reservoir is a net absorber it cannot be the cause of the increase in the atmospheric reservoir. Unless…that reservoir is receiving a pulse of carbon from yet another reservoir that more than offsets that reservoir’s mass transfer to the atmosphere. There is no known reservoir that is supplying the biosphere and hydrosphere with additional carbon “under the table” so to speak. But even if there were that would present more questions then answers because then we’d need to figure out why the ocean pH isn’t declining even faster than it already is or why the biosphere isn’t greening any faster than it already is. Remember…if want to entertain the idea that a hidden source of mass has infiltrated the carbon cycle then you have to go all in with it and account for all of the effects that should be observable from it.

          • Chic Bowdrie says:

            “And we know that if a reservoir is a net absorber it cannot be the cause of the increase in the atmospheric reservoir.”

            But it may contribute to the increase. Obviously human emissions are contributing some. But that doesn’t mean all. In my model, I simulated numbers that would reproduce the Mauna Loa data using a constant removal rate with an e-time of 3.6 years. It required increasing the natural emissions from 100 ppm/year to an average of 104.5 ppm/year. During the same period (1999 to 2018), my simulated absorp.tion of CO2 increased from 102 to 107 ppm. So the reservoir sinks may continue to be net absorbers while still contributing to the increase in CO2.

            “There is no known reservoir that is supplying the biosphere and hydrosphere with additional carbon ‘under the table’ so to speak.”

            By “under the table,” I assume you mean unaccounted for. I keep asking how you know this. Do you have any data to support your claim?

            While you are at it, where is the data indicating the ocean pH needs to decline faster or the biosphere has to green faster. Maybe they are already. I admit not being able to provide that evidence, but unless you show otherwise, you are back to square one.

      • Nate says:

        “Using a back-of-the-envelope calculation with 5 ppm human and 100 ppm natural emissions, a sink fraction of 0.25 (1/4yr), and the atmosphere containing at most 4% human emissions, the 2.5 ppm annual increase would amount to 0.9 ppm human and 1.6 ppm natural. That’s humans contributing 36% of the rise, about what Berry’s model predicts.”

        Circular logic. The sink fraction of 0.25 IS central to Berry’s model, which is a gross over simplification, and ignores the known complexity of the sinking process, which is multi-reservoir.

        The 0.25 is the EXCHANGED fraction. Still Berry’s model gets this wrong in its only test, to predict the Bomb14 e-time. You guys naturally want to ignore this inconvenient fact.

        • Chic Bowdrie says:

          You continue to assert without evidence these numbers are wrong. Please show us your model that demonstrates the errors in Berry’s model. No more appeals to authority, please.

        • Nate says:

          Im simply saying observed 16 >> 4 modeled. There could be an isotope effect on it, but no evidence that it is that big.

          • Chic Bowdrie says:

            Both 16 year and 4 year e-times are based on data, the former hard and the latter soft. This is another example of your obfuscation and not the first time about this issue.

            I agree that an isotope effect is probably not that big and I see no evidence to the contrary. To my knowledge, no one in your tribe has explained the discrepancy between the C14 decay with an e-time of 16 years and the 4-year residence time of atmospheric CO2. So either give it a go or shut the heck up.

          • Nate says:

            I see, testing your favorite model against real data, as all science must do, is obfuscation?

            Your model has made a prediction, based on its central premise, and it fails to agree with data. Nothing to do with other models’ success or failure.

            The model is wrong. And of course it should be, because it fails to include the real complexity of multi-reservoirs in series that we have on the Earth.

            That is exactly how science works, and you can see that in action in the carbon cycle literature over decades.

          • Chic Bowdrie says:

            Just more BS from you. Assertions without backing it up. So sad.

          • Nate says:

            The facts are 16 and 4. You are in deep denial.

      • bdgwx says:

        Exactly. That is the EXCHANGE fraction. If you exchange one unit of mass for another unit of mass the original molecules fall out but are replaced with different molecules possibly with different isotope signatures. This exchange results in ZERO change in the level. That sink rate of 0.25, by itself, will not tell you how the level will change if it changes at all.

        • Chic Bowdrie says:

          Here is a spreadsheet that shows how exchange vs removal makes no difference. The AT is the same in both cases, about five 4-year e-times.

          https://www.dropbox.com/s/t0o8jftia7t4ok5/Mass%20exchanged%20vs%20mass%20removed%20models.xlsx?dl=0

        • Nate says:

          If you assume in your model that they are the same then, what does that prove?

          • Chic Bowdrie says:

            The example was presented to allow bdgwx an opportunity to explain how removal of a pulse differs from EXCHANGE process which results in ZERO change in the level.

            I don’t expect anything from you other than obfuscation or the inability for any insight to penetrate your closed mind.

          • bdgwx says:

            Your example does not show a scenario where exchanges are happening with zero change in the level. If you want to show that then you need turn off the “anthro CO2 inflow”. Exchanges without changes in level are best shown when the inflow and outflow are balanced.

            Your example does show how AT is different from RT though. For example, from the peak of 651 ppm AT(0.5) = 4.5y, AT(0.37) = 8.5y, AT(0.25) never occurs because you’ve established a new equilibrium at 420. If you turned off your 5 ppm/yr human emission you’d certainly get closer to 315 ppm though.

          • Chic Bowdrie says:

            bdgwx,

            After the level stabilizes (in both cases it occurs within 0.1% of baseline in 20 years), the inflow and outflow are balanced. Are you looking at the right spreadsheet?

            Note that I explained the 315 vs. 420 confusion in another comment and revised the spreadsheet accordingly. No need to turn off human emissions. No need to bring up adjustment time when the residence time is constant. In that scenario, AT is always around five RT depending on how close you specify getting to baseline.

          • Nate says:

            “I dont expect anything from you other than obfuscation or the inability for any insight to penetrate your closed mind.”

            Oh I see, i give you relevant papers and discussion, compare models to observation, yet Im still just obfuscating?

            How disingenuous. Facts no longer seem to matter to you.

        • bdgwx says:

          It looks like you do an instantaneous pulse of 315. One e-fold would bring you down to 431. It looks like this happens maybe 10.5 years later. Though the pulse actually continues at 5 ppm/yr which makes it hard to compute the real AT in this case. I did a quick estimation and I came up with a lower bound of 7 years for your ATe. So your ATe is definitely larger than the RTe. And a full adjustment never happens in your model since 315 ppm is never achieved.

          Anyway…your model pulls out 270 ppm in 10 years. How is that physically possible? How do expect the biosphere and hydrosphere to take carbon at that rate given biological growth limitations and ocean uptake limitations like the Revelle Factor?

          Your model also starts with a sink rate of 78 ppm/yr and given that CO2 level was relatively stable during the holocene that means the source rate was close to 78 ppm/yr. Your model ends balanced at 105 ppm/yr source and sink rates. That means 105 – 5 – 78 = 22 ppm/yr of new emissions of which you haven’t identified the source. Where do you suppose that additional 22 ppm/yr is coming from?

          • Chic Bowdrie says:

            My apologies and thank you for pointing out the confusion. I used 315 as a starting point in the mass exchange model to show how 105 ppm total emissions gradually rises to a level of 420 with a removal rate of 1/4yr. I subsequently modified the spreadsheet to show what happens to a pulse of 420 on top of a baseline of 420 which results from the 105 constant flux as the mass exchange model illustrates.

            The doubled level of 840 goes to a fraction of (1 – 1/e) towards the baseline of 420. That is 0.75 * 420 = 305 which is subtracted from the peak of 840 to give 535 ppm. The graph shows that is exactly 4 years. Sorry again for the confusion. The reason the baseline in the previous version never went to 315 was because the inflows were moving the level towards 420 as in the exchange model.

            “So your ATe is definitely larger than the RTe.”

            This comment troubles me. Where did you get the impression that I ever thought or wrote that AT was NOT larger than RT? AT is always at least four or five times the RT depending on how close one insists on coming to baseline. It seems that whenever you respond to someone who disagrees with you about these carbon cycle models, you claim they are confused about RT vs. AT. I wish you would stop for this reason. Adjustment times longer than five retention times result from secondary rate processes being slower than than the primary exchanges between the atmosphere and the land/ocean surfaces. Unless you have data showing those slower processes exist, you are up a creek without a paddle.

            “Anywayyour model pulls out 270 ppm in 10 years (actually 392 in the updated version). How is that physically possible?”

            I’m only trying to illustrate that exchange and removal processes are not inherently different if they have the same RT. No one has tried removing any CO2, not even the Bern team. It’s all theoretical. The current 4-year residence times we are experiencing are already subject to the factors you mention.

            “Where do you suppose that additional 22 ppm/yr is coming from?”

            First, you are mixing up my spreadsheet models. My modified Spencer model does project natural emissions from the IPCC estimates of 100 ppm to be more like 110 ppm. It is my opinion (stated many times here) that IPCC underestimates the effects of population growth and temperature effect on ocean outgassing. The 105 ppm/yr (actually more like 116 ppm/yr) is not balanced like in the exchange and removal spreadsheet models. My model shows a roughly 2.5 annual increase in CO2 as observed in the Mauna Loa data.

          • Nate says:

            BDGWX,

            Im not undrstanding what you are doing. Doesnt his model assume a removal rate of 0.25? Which gives an AT and RT of 4?

    • Nate says:

      “human CO2 emissions 0.1 ppm per annum.”

      FALSE definitely not a fact. Human emissions are ~ 5 ppm/yr, and about half stays in the atmosphere.

      “None goes straight into the oceans and nothing hangs around for 1000 years.”

      Your opinion, not a fact backed by evidence.

      “3. The major source of this 2.5 ppm CO2 increase is from the oceans hence the oceans are emitting more than they are absorbing. Warm oceans emit. Cold oceans absorb. We have just gone through 350 years of warming.”

      Again more opinion, no evidence to support it.

      ‘A new NASA study (Junjie Liu et al) using data from NASA’s Orbiting Carbon Observatory-2 (OCO-2) satellite provides space-based evidence that Earth’s tropical regions were the cause of the largest annual increases in atmospheric carbon dioxide concentration seen in at least 2,000 years”

      OCO-2 has provided lots of data tracking anthro emissions as well as natural. Consistent with anthro model of CO2 rise.

      You seem to have trouble distinguishing fact from your opinion, Brendan.

      • Brendan says:

        Isotope measurements don’t lie. Measurements – not an opinion.

        There are numerous scientific papers showing the oceans are the major emitter.

  70. gallopingcamel says:

    Dr. Roy shows that the “Lockdown” that may have reduced CO2 emissions by 5-10% is too small to make a significant dip in the Keeling curve.

    So what does it take to cause an anomaly in the [CO2]? Take a look at Dr. Roy’s plot at the head of this post. Notice the uptick in 2016. What could have caused that? I suspect that most of you know the answer but just in case…..
    https://www.theatlantic.com/photo/2016/12/2016-the-year-in-volcanic-activity/510641/

  71. Dan Pangburn says:

    Gba at https://www.drroyspencer.com/2020/06/covid-19-global-economic-downturn-not-affecting-co2-rise-may-2020-update/#comment-484383 provided a link to a usgs assessment of water use in the U.S. The ratio of water use for power generation/use for irrigation in their data is substantially different from what I determined in https://watervaporandwarming.blogspot.com.

    The amount of water that they used for irrigation in the US is about 13% of the global total that I calculated which IMO is reasonable. The difference then must be in water used for cooling in electricity generation.

    I backed into the global water use in electricity generation from evaporation in cooling towers, electrical use and 50% efficiency. Using this same method for the US results in WV of less than 5% of what they report for water use. Apparently they did not assume cooling towers but assumed some other method of water cooling with no evaporation.

  72. Eben says:

    80% certainty oxymorons and something may – or might not happen forecasting

    https://youtu.be/-jZVatV74ok

    • bdgwx says:

      And yet you will almost certainly bet your life on a medical treatment that has only a certain probability that it could, might, possibly, perhaps, or maybe effectively or God-forbid ineffectively treat your specific ailment. So yes…the entire medical discipline could, possibly, perhaps, or maybe be an idiotic enterprise with numerous idiotic scientists. Or it might not. Either way I suspect you will change your tune quickly when the times comes that you need the assistance of these “idiots” whose discipline is almost entirely based on non-deterministic probabilistic outcomes.

      • Eben says:

        You gonna need either a bigger strawman or a more stupid analogy , whichever you can come up with first

      • Dan Pangburn says:

        The problem is not that ‘they’ are stupid although some might be short on common sense. The problem is that most of the available data on covid has been through filters influenced by TDS, ego, and potential profit.

      • bdgwx says:

        My point is that uncertainty, probability, and non-determinism is ubiquitous in nearly all disciplines of science. There is very little we know with 100% certainty. Yet that does not stop people and humanity from drawing conclusions and making decisions with reasonable confidence given our imperfect understanding of reality. People routinely bet their lives on non-deterministic outcomes. And I suspect everyone here understands that. So I seriously doubt the convictions regarding this point are as hardened as they are presented here. Just food for thought for those who are quick to denigrate probability and certainty analysis in the context of scientific understanding…

        And more to the point of the video…scientists cannot eliminate the possibility that the planet warms by 5.3C. That means it could happen. What scientists can eliminate is warming of less than 1C because it has already happen. What scientists can eliminate is a CO2 induced runaway greenhouse. Just because scientists can eliminate some possibilities and not others does not mean that they are idiots. Nor does it mean the science is invalid because it uses the concepts of certainty, probabilities, and non-determinism.

        • gallopingcamel says:

          @bdgwx,

          “My point is that uncertainty, probability, and non-determinism is ubiquitous in nearly all disciplines of science. There is very little we know with 100% certainty.”

          When it come to science there is NOTHING we know with 100% certainty so you are guilty of understatement in your second sentence.

          I don’t disagree with the first sentence above but I would like to add some elaboration. You should distinguish between the “Hard Sciences” where “Three Sigma” standards apply and “Squishy Sciences” that operate at “Two Sigma” or even “One Sigma”.

          When you test a scientific hypothesis there is a possibility that the “Null Hypothesis” is correct. This is a polite way of quantifying the probability that you are wrong.

          “Three Sigma” means that there is only a 0.3% probability that the null hypothesis is correct. “Two Sigma” means ~5% and “One Sigma” means ~32%.

          According to John Nash any discipline that includes the word “Science” in its name probably is not science at all. “Climate Science” and most “Behavioral Sciences” are not science in the generally accepted sense of the word. Here is a link that explains how “Science” has become both tribal and squishy:
          https://quillette.com/2018/10/07/the-devolution-of-social-science/

  73. Chic Bowdrie says:

    Continued from
    http://www.drroyspencer.com/2020/06/covid-19-global-economic-downturn-not-affecting-co2-rise-may-2020-update/#comment-488896

    Nate,

    “Eqn 1 and 2 in the paper above describe the decay of atm concentration. The AT is the time constant for that process.”

    I would have to say you continue to misrepresent facts (obfuscation) unabated. In this case, it’s coming from your own source.

    There is no discussion of AT in the Oeschger et al. paper, let alone any mention of it. Equations 1 and 2 describe the changes in the amounts of CO2 in the atmosphere and ocean mixed layers, respectively. Both are increasing, not decaying.

    I thank you again for bringing my attention to this paper. It provides estimates for rate constants for CO2 from air to mixed layer and diffusion from the mixed layer to the deep ocean. Much data has been derived since the paper’s publication in 1975 and the model can be tested against any new data if you care to learn and/or help in your model development.

    Amazingly the 1/35 year constant for growth in excess emissions above pre-industrial is accurate to within a few ppm using only 10 years of Mauna Loa data.

    • Nate says:

      Oh I didnt realize it was that old. No political agenda then.

      “Equations 1 and 2 describe the changes in the amounts of CO2 in the atmosphere and ocean mixed layers, respectively. Both are increasing, not decaying.”

      Ok, but ‘changes in amounts’ with emissions turned off, can be studied with these equations. IOW the AT could be found, and likely was in followup papers.

      • Chic Bowdrie says:

        Make it happen then. Otherwise, as usual, you are all talk and no action. Put up or shut up.

        If you trust your Bobbsey twin bdgwx, AT is plural. You have a different one every time you specify a different endpoint.

  74. gbaikie says:

    I was saying there is no overpopulation.
    And it’s just stupid politicians.
    And presently, not enough coffee.
    But had a question.
    What kind of “political system”. Or political ideology
    want more people or works towards having a condition of having “overpopulation”.

    Or I would say the current concern over the potential of having an overpopulation problem is not a new belief. It seems a good guess
    that Ancient Egyptians generally would regarded a problem.
    I would not surprised by general idea that overpopulation causes wars.
    Though it fairly obvious that politicans cause wars.
    Now if looking for political system that regards underpopulation
    as something to “fix” rather overpopulation is problem to “fix” then the conditions will be that one wants lots of immigration.
    The US has been and is such country. Canada, Australia, and Russia
    also has condition or reality of having such problem of underpopulation.
    In terms a general idea, the underpopulation problem is usually framed as “having a lot land that needs to be developed”.
    Or politicans see a problem with having “underdeveloped land”
    The Russian had the “gulag program” to solve this problem. Which summed as making people into criminals and forcing them into underdeveloped lands. US has system call homesteading, wiki:
    “Historically, homesteading has been used by governmental entities (engaged in national expansion) to help populate and make habitable what were previously little-desired areas; especially in the United States, Canada, and Australia.”

    The term “little-desired areas” is interesting or useful way to say it. So one ask the question where are there “little-desired areas”?
    Let make brief list of “little-desired areas”:
    The planet Mars.
    The Ocean
    The deserts
    None of which are actually little-desired areas, but if you are stupid politician one could call them this.
    Such areas do lack people who could vote for a politician.
    They lack people who can pay taxes.
    They lack markets.
    And they aren’t a market. The land is not for sale. Actually the land is too cheap to sell. Or idea of homesteading is the land is too cheap to sell, so it’s offered for free, with the view it create markets {land will worth enough to sell and there will other kinds of markets in the region in the future of presently, undeveloped land.
    They also probably a general idea that if you offer land for free, you will lower the existing land which has value- which as general
    matter, would be a stupid idea. But politicians and everyone could firmly believe this not vaguely a stupid idea.
    And I encourage you give the reasons why it’s dangerous to value present, to give away other land for free.

    I would say it’s related to solving the problem of urban plight.
    And can see that if Mars land is free, why it’s problem for land owners on Earth.
    But if people are slaves, then one might lose some “your” slaves to the planet Mars. Also Mars could maybe become a dangerous nation who invade and conquer countries on Earth.
    Such thinking is not generally thought of in terms solving urban blight. The advantage of doing something about urban blight is to lower crime rate and increase surrounding property values. And I would say similar advantages apply to Mars.
    They also apply ocean. And deserts, and all “little-desired areas”.

    • gbaikie says:

      Imagine what would be the most valuable land. Got it?
      Now, remove any access to water, electrical power, and sewage and trash pick up service.
      I would say it’s not valuable land anymore, to you. You might imagine other people making the land have value and still believe the land is valuable.

      What consider valuable land is land in lunar polar region- if lunar water is mineable. But I also believe “other people” making the land more valuable. Or it’s always “other people” making the land more valuable.
      But question was what is the valuable land.
      The land of the moon is valuable, because it has vacuum, and has low gravity, and lots of sunlight.
      But nothing to do with predicting real estate value in such in term time frame. There methods doing sort of thing. But we will call them boring at the moment or worth the word count.
      Anyhow, the land on moon which has value has potential access to electrical power and water. And basically any sewage or trash would have value- but could bury anything which value anywhere you want- including such things as radioactive waste. Because another thing of value on Moon is it lacks a water table. And floods, earthquakes, rain, erosion, etc.
      It does have impactor, and impactors are “different variation” of the impactor problem on Earth- Earth just gets the bigger ones and they are generally hitting at higher velocity.

      If Moon has doesn’t have mineable water, it’s lacks value at the moment. Same applies to Mars. Same applies roughly in anywhere in our solar system {including Earth}.
      Which leads to real estate of ocean, it also lacks mineable water.
      But such a problem can solved if you have access to electrical power. {Same applies anywhere in the solar system}.
      And obvious in terms of deserts.
      But value real estate has to do with the “other people” and though one can find area of desert or ocean in which you could have more water than you need, the point is the amount of water “other people” would need.
      Other people need a lot water {cheap water}. In comparison to real estate value of Mars vs Moon, Mars has advantage of roughly trillions of tons of water vs billions of tons of water. And for largely “market reasons {other people}” and because conditions mineability of Mars water, Mars real estate has more value than the Moon- though has higher gravity and lacks the near perfect vacuum and doesn’t get much sunlight- though in terms solar power, Mars is better than Earth. But very poor in comparison to lunar polar regions.

    • gallopingcamel says:

      @gbaikie,

      The question “Is the world over populated with humans?” is answered every day by “Mother Nature”. Thus far the answer is “NO”.

      The citizens of each country may ask themselves “Is our country over populated?”. The answers to the question are illuminating.

      Mainland China decided it was over populated and a “One Child” model was implemented.

      Many European countries including Italy, Germany and Sweden noticed that their native born population was declining and their solution was “Open Borders”.

      In the USA the debate is not yet settled.

      • gbaikie says:

        Are you saying European countries, are so worried about having lower population in future, that they will allow anyone and everyone to enter by a failure of having a border.

        I don’t think the people of China, have decided anything.
        As the Chinese of Hong Kong have not decided.

        –In the USA the debate is not yet settled.–
        If European countries have decided they are concerned
        about under population.
        It should end the idea of USA debate.

        So, by process of elimination.
        Europe and USA {and obviously Canada and Australia] don’t need
        be concerned about over population. Nor Russia.
        And Chinese have that decision already made for them.

        How about India?
        I can’t imagine India wanting open borders because they overly concerned about under population. But also unaware of Indians having any concern about India’s over population.

        I don’t think Europe, USA, Russia, and other under populated nations have been actively demonstrating anything which could be considered to be amounting to “any sense”. Or they would all would be on low ground in terms trying to convince Indians about anything on topic of their possible “over population” problem.

        But merely for sake of theoretical interest, is anything which might argue strongly that India should do something about it’s possible “over population” problem?

  75. Brendan says:

    There is no such thing as adjustment time. That is an invention to create a distraction from what is really happening.

    Ive seen no evidence of ocean Ph declining. It is rising and falling in different places all around the world. Falling Ph does not necessarily mean the oceans are absorbing CO2. Rising temperatures also cause the Ph to decline. https://www.westlab.com/blog/2017/11/15/how-does-temperature-affect-ph . The ocean temperatures have been rising since the LIA in 1650. Thats 350 years of warming which should lower the Ph.

    pCO2. This is Partial Pressure of CO2 in dissolved inorganic carbon or the DIC. Thats not the same as CO2 concentration in the ocean or the atmosphere. It is measured in Mol/Mol-1. atm is also used. pCO2 is not concentration and it is misleading to use it to try and show atmospheric CO2 is being absorbed in the ocean. The DIC is different from the ocean.

    The oceans contain about 50 times more CO2 than the atmosphere.
    What happens in the DIC is one two thousandths of what happens in the oceans. There are about 2,000 CO2 molecules for each H2CO3 (carbonic acid molecule) in water.

    atm is a fraction scale. 1 x atm = 1 millionth of an atmosphere of pressure. It is proportional to, not equal to the mixing ratio. pCO2 is not measured but calculated from the DIC and other measurements. It is a minute fraction of the atmosphere. CO2 is 0.04% of the atmosphere. That is as close to nothing as you can get. A Mol of pCO2 is one millionth of 1 ppm of atmospheric CO2. Thats one millionth of next to nothing.

    Almost all the CO2 is absorbed in and emitted from the ocean water and has absolutely nothing to do with the DIC.

    • bdgwx says:

      There is no such thing as adjustment time. That is an invention to create a distraction from what is really happening.

      There’s no such thing as the amount of time between the level at its peak and the level after a certain amount of drop?

      It is rising and falling in different places all around the world.

      The global mean is falling.

      Falling Ph does not necessarily mean the oceans are absorbing CO2. Rising temperatures also cause the Ph to decline.

      Correct. But the magnitude of this effect is small. It is too small to explain the decline.

      The ocean temperatures have been rising since the LIA in 1650. Thats 350 years of warming which should lower the Ph.

      Can you present evidence that the ocean temperature has risen by an amount that can explain the pH decline?

      BTW…why has the ocean temperature risen?

      CO2 is 0.04% of the atmosphere. That is as close to nothing as you can get.

      It doesn’t take a lot of CO2 to block IR radiation. The formula for the forcing is 5.35*ln(C/C0). For example a change from 280 ppm to 410 ppm produces a force of 5.35*ln(410/280) = +2.0 W/m^2.

      Also…did you know that Tambora released about 100 MtSO2 and caused the year without a summer? 100 MtSO2 is 400x smaller than the 40,000 MtCO2 released by humans every year. Small things can have huge effects.

      Almost all the CO2 is absorbed in and emitted from the ocean water and has absolutely nothing to do with the DIC.

      Not according to the two sources you cited above. The Liu paper said the net ocean flux was -2.4 GtC/yr and the net biosphere flux was -4.3 GtC/yr. IPCC AR5 Fig 6.1 showed -2.3 GtC/yr for the ocean and -2.6 GtC/yr for the biosphere. In terms of separate emission and absor.p.tion values the biosphere was higher than the ocean.

      • Jim Ross says:

        I don’t want to get into the middle of this ‘discussion’, but it should be noted (as a bit of perspective) that there remains very large uncertainty in the estimates reported by the Global Carbon Budget (2019). Taking the year 2015 as an example, they report the results of 9 different models for the oceanic sink which report flux values between -2.20 and -3.35 GtC. The terrestrial sink flux estimate is based on 16 different models, and the estimates vary between -0.28 and -3.80 GtC.

        The values for 1998 (El Niño) are even more divergent: oceanic flux between -1.50 and -2.63 GtC, and terrestrial flux between +0.79 (yes, plus) and -3.94 GtC.

        I am unsure as to which of these models Nate considers to be “successful”.

        • Brendan says:

          Jim Ross

          These Global Carbon Budgets are all derived originally from Houghton et al; 1983. Current GCBs are just addons to Houghton’s. They start with a false assumption that all CO2 emissions come from humans. Nothing comes from the oceans. Everything else is estimations and guesses and the rest is filled in from models which are nothing more than mathematical illusions.

          • Jim Ross says:

            Brendan,

            Perhaps I was being too subtle with my sarcastic comment in the final sentence. The primary purpose of my comment was simply to highlight the fact that you cannot use just two examples to argue that the terrestrial biosphere removes more CO2 than the oceans (even if you accept models as having some basis in reality).

            You don’t have to convince me about the failure of the models: when I started looking at this issue a few years ago, it was widely argued that we not only knew that the growth in atmospheric CO2 had to be due to anthropogenic emissions, because the δ13C was dropping, we could even determine with some precision the relative split between the oceans and the terrestrial biosphere by also considering the O2/N2 data (double deconvolution was the method used, if I recall correctly). Those days seem to be gone.

            As more data (observations) have become available, the ability of the models to adequately explain the processes has actually diminished. Odd that. Looking again at the Global Carbon Budget (2019) for the year 1998, the difference between atmospheric CO2 growth and total estimated emissions is stated as 1.77 GtC. Now, only one model out of the reported 9 says that the oceans took up less than that, which would leave some CO2 for the terrestrial biosphere to remove. Hence, all the other models require that the terrestrial biosphere was a net source that year. Nothing wrong with that, some might say, but of the 16 models reported by the Global Carbon Project for 1998, only one model showed the terrestrial biosphere as a net source that year.

            I am happy to admit that I do not know of a comprehensive and valid hypothesis, but it is clear that I am not alone.

            Finally, my favourite quote of recent times (with due credit to the authors for admitting it) goes to Keeling et al (2017) who are still unable to match the δ13C behaviour of atmospheric CO2. They say (in the abstract): “Using updated records, we show that no plausible combination of sources and sinks of CO2 from fossil fuel, land, and oceans can explain the observed 13C-Suess effect unless an increase has occurred in the 13C/12C isotopic discrimination of land photosynthesis.” Even then, they only match the recent trend, not the actual values.

  76. Eben says:

    Your government has agreed to keep the climate within prescribed limits

    https://youtu.be/ePj0c-BNR8U

  77. Chic Bowdrie says:

    bdgwx,

    There is a long thread started on June 15 that covers several themes we have been discussing. These are the attacks on the Berry/Salby models, the promotion of the Bern model, the differences between a removal and mass exchange, and the meaningfulness of an adjustment time.

    There is also the question about how models treat human vs. natural carbon. Although you agree that nature treats FF carbon the sames as that of any other source of emission, you defend models that use only the difference between current and preindustrial CO2 levels while criticizing models based on the full atmospheric concentration.

    BTW, thank you for posting the link to the Bern Simple Climate Model (BernSCMI) which is anything but simple. I could not see any evidence that the Bern model doesn’t use the correct physical equations. However, it is a complicated model and the devil may be in the details.

    I would like to resolve these issues before leaving the discussion starting with the meaningfulness of adjustment time. I could find no mention of it in the BernSCM paper, let alone any calculations such as ones you have offered on this blog. Please cite where anyone else derives and uses your formula.

    It seems we both agree that RT involves an exchange process you characterize as the time a molecule stays in the atmosphere. The point we disagree on is that the same e-time constant applies to mass removal. I demonstrated this with a spreadsheet model showing how a pulse is removed in the same time frame as it takes for a change in inflow to re-establish a new level. That time frame is the adjustment time and it is always about five e-times depending on how close to baseline you specify. This definition applies to a simple one box model with a constant e-time.

    The BernSCM is a multiple box model. Based on how long a pulse takes to decay and the equations others claim are used in the model, it employs rate processes slower than 4-year e-time simple model constant that adequately characterizes the observed atmosphere to reservoir exchanges. No one has ever demonstrated that the BernSCM model actually works. Therefore all the talk about adjustment times are meaningless other than to say, IF they are correct, then the time to remove a specified fraction of the pulse is going to be longer than the normal five RTs.

    • bdgwx says:

      The Bern model is certainly more complex than Berry’s model. However, it’s my understanding that the Bern model is actually one of the more simple carbon cycle models.

      I like your speadsheet model. It has a realistic looking depletion curve. But it is removing CO2 really fast. Do we have evidence that suggests mass can be removed this quickly?

      I’m skeptical of the Bern model as well. It does not match previous carbon release and depletion events in the paleoclimate record very well. Specifically it seems to underestimate, often quite severely, the amount of time it takes for CO2 to deplete after peaking. My amateur hunch as to why this is has to do with the duration of the release itself. All events in the paleoclimate record have long duration releases. The shortest one I know of was the PETM event and that took thousands of years. I think the carbon cycle takes up excess atmospheric CO2 faster when it is released faster. At least that’s my amateur hypothesis.

      • Chic Bowdrie says:

        “Do we have evidence that suggests mass can be removed this quickly?”

        No, but we don’t have evidence that it can’t be either. It hasn’t been tried.

        To observe and measure the removal rate, there has to be a sudden end to a substantial amount of emissions and a scrupulous accounting of the remaining emissions. This isn’t going to happen.

        It’s a similar problem trying to analyse the paleoclimate record. We only know the levels vs. time from second hand accounts. No good information on the inflows and outflows.

  78. Chic Bowdrie says:

    bdgwx,

    Regarding the difference between mass removal and mass exchange, please explain the comment you made June 15, 2020 at 9:34:

    “The C14 bomb spike decay is NOT showing you how mass is removed. It is showing you how mass is exchanged.”

    Is it possible you meant something different? In the same comment you said, “If Salbys model is the correct solution to the problem of mass removal then show us a plot of a real carbon release and decay in which 63% was removed in ~15 years. Use total CO2 ppm as your units on the y-axis and time on the x-axis.”

    Both Salby and Berry have reproduced plots of data that are readily available and if you plotted and fitted the data yourself, you will find a 15-17 year e-time. No one disputes that except maybe Nate.

    Just as an exercise in seeing what it would take to find a scenario where a C14 bomb decay could be simulated with a 4-year RT, I prepared a spreadsheet to do that.

    https://www.dropbox.com/s/5axrsdpwctp9exq/C14%20Model.xlsx?dl=0

    The green curve is simply a pulse decay with an e-time of 16 years. The blue curve represents a pulse followed by more inflow (with an e-time of 16 years) which makes the decay curve appear to have an e-time of 16 years. Notice that the Level/Outflow tends toward an e-time of only 4 years. I’m not claiming this is what happens with 14C, but if underwater bomb tests were going on during and after 1960, that could explain the 16 year e-time.

    • bdgwx says:

      If inflow and outflow are the same then mass is only being exchanged. None of it is being removed.

      Example…400 ppm level, 100 ppm/yr inflow, and 100 ppm/yr outflow. 100 units of mass are being exchanged every year, but 0 units of mass are being removed. In this case RTe=4y but AT is undefined because the level isn’t even changing.

      Berry and Salby do not reproduce a chart in which total mass in units of ppm, GtC, or GtCO2 are on the x-axis. What they reproduce is the C14 bomb spike decay which use “delta per mil” units. This is d14C = ((R-sample / R-standard) – 1) * 1000. R is a ratio. R-sample is the sample being analyzed and R-standard is the standard reference. A value of 0 indicates that the sample is equivalent to the standard. Berry uses the data from Turnbull here (https://tinyurl.com/y8k52drl). Notice that Berry is NOT analyzing mass decay here. He is analyzing the return of the 14C ratio to its “standard” value. Here is the epiphany…that 14C decay curve would appear this way even if 14C mass were increasing!

      In your spreadsheet you start with 400 ppm and pulse 400 ppm. In this case RTe = 4y. AT(0.5) = 11y, AT(1/e) = 16y, AT(0.2) = 25y. Also notice that your spreadsheet pulls out CO2 at an astonishing rate. How do you suppose the geosphere will put out 320 ppm of excess in just 25 years given the physical limitations of biosphere and hydrosphere uptake? Can you provide an example in Earth’s past in which this amount of carbon was removed so quickly?

      • Chic Bowdrie says:

        “Here is the epiphanythat 14C decay curve would appear this way even if 14C mass were increasing!”

        I don’t get the epiphany. The pulse of 14C did represent mass increase and it is entirely possible that more 14C was produced in the years following. That is what I attempted to show in my spreadsheet simulation. Unfortunately, I used arbitrary numbers that you assumed as ppm. Can you pretend they represent some measure of 14CO2 molecules and take another look at the spreadsheet? Never mind, I will redo the spreadsheet anyway.

        Regardless of the units used to count 14C, the decay curve represents an e-time of 16 years. Whether you think that is slow or fast is irrelevant. It is what it is.

        “How do you suppose the geosphere will put out 320 ppm of excess in just 25 years given the physical limitations of biosphere and hydrosphere uptake?”

        I don’t know. Without a time machine how would I? A sufficiently controlled experiment has never tested the limitations of biosphere and hydrosphere uptake.

        All of the AT(x) business of yours is BS. You still have not explained where you came up with your method of calculating it.

        • bdgwx says:

          Regardless of the units used to count 14C, the decay curve represents an e-time of 16 years. Whether you think that is slow or fast is irrelevant. It is what it is.

          The issue is not with the e-time of the 14C decay. The issue is that this e-time value does not represent the amount of time it takes for the total mass to adjust toward the pre-release level. That’s what we’re trying to explain. That’s what the Bern model is attempting to estimate.

          All of the AT(x) business of yours is BS. You still have not explained where you came up with your method of calculating it.

          I’ve explained this multiple times. Adjustment time is the amount of time it takes for carbon release to adjust down to target level. For your spreadsheet you release 400 ppm of CO2. AT(0.5) is in reference to the point at which 1/2 of the pulse depletes out. That’s a target level of 600 ppm. So AT(0.5) is the amount of time between a level of 800 ppm and 600 ppm. I find the year on your spreadsheet where the level is 800 ppm (1962) and the year in which it adjusted down to 600 ppm (1973). That’s 11 years. AT(1/e) is for a target of 548 ppm. AT(0.2) is for a target of 480 ppm.

          • Chic Bowdrie says:

            “The issue is that this [16-year] e-time value does not represent the amount of time it takes for the total mass to adjust toward the pre-release level.”

            No one that I trust claims otherwise. It takes at least five e-times to get close to baseline. Technically it takes infinitely long to get there.

            “Thats what were trying to explain.”

            It’s seems what you and Nate are doing is trying to LEARN, which is a good thing. Keep it up. If you new this stuff, you wouldn’t have such a hard time explaining what you mean.

            “Thats what the Bern model is attempting to estimate.”

            Yes, the Bern model ATTEMPTS to estimate what the bomb 14C data readily shows. That pulse still isn’t down to pre-release level after nearly 60 years. The Bern model is essentially speculation which you and Nate treat as gospel.

            OK, now I see that your idea of AT is just different ways of expressing decay time, like half-life or e-time. I prefer to think of mass removal more like AT(0.9), AT(0.99), or AT(0.999).

          • bdgwx says:

            Yes, the Bern model ATTEMPTS to estimate what the bomb 14C data readily shows.

            No. The Bern model does NOT attempt to estimate the 14C bomb spike decay.

            What it is designed to do is estimate the decay of total mass.

          • Chic Bowdrie says:

            It would be good to rap this up before the new week begins.

            I propose the reason you don’t accept 14C mass removal as evidence of 12CO2 mass removal is because the 14C mass is a tiny amount. A 130 ppm pulse of 12CO2 is a huge mass. Therefore, the Bern model is the divine revelation.

            Never mind that it is an unverified model with zero data to back it up. Pay no attention to the physically correct models of Salby, Harde, and Berry supported by the data.

            You could be right. Let me know when you have any information to back it up.

          • Nate says:

            “the physically correct models of Salby, Harde, and Berry supported by the data.”

            OMG, this from a so called skeptic!

            Honestly, how can they be physically correct if they ignore the KNOWN properties of the ocean and its carbon cycle?

            As far as RT vs AT, just ask a bartender how he goes about mixing Vodka and Vermouth without losing any liquid.

          • bdgwx says:

            I propose the reason you dont accept 14C mass removal as evidence of 12CO2 mass removal is because the 14C mass is a tiny amount.

            Well…it’s complicated.

            I wouldn’t accept 14C dilution for the same reasons I wouldn’t accept 13C dilution or 12C concentration. It just doesn’t tell you what the entire mass is doing. It only tells what the mixing ratios are doing. Like I said we can’t even tell from d14C values alone whether 14C mass is even declining. In fact, given that the e-time of the 14C decay curve is larger than the 4y residence time I would say 14C mass is actually increasing; just not as fast 12C. That would explain both its dilution and its longer duration vs residence time.

            Some other things to consider…14C (as measured by d14C) was diluting prior to the bomb spike as well. And remember…human emissions are uniquely 14C depleted. 13C was and still is diluting as well, but at a completely different rate than 14C. And like 14C, humans emissions are also uniquely 13C depleted.

            This is why scientists take issue with Berry’s approach. First, why does he focus on 14C and not 13C? Second, by using mixing ratios Berry is conflating the concepts of dilution with mass removal. A sub species can dilute even when its mass increases. So showing a d14C decay curve is not sufficient to answer questions regarding what mass is doing.

          • Nate says:

            “The carbon cycle is the biogeochemical cycle by which carbon is exchanged among the biosphere, pedosphere, geosphere, hydrosphere, and atmosphere of the Earth. Carbon is the main component of biological compounds as well as a major component of many minerals such as limestone.”

            I think its worth noting that the Carbon cycle is a cyclic process. That is carbon sent into the biosphere eventually returns to the atmosphere.

            In this process, the Bomb C14 initially in the atm, is eventually diluted and spread evenly throughout the cycle.

            No loss of carbon mass need happen in this cyclic process of dilution.

          • Jim Ross says:

            bdgwx,

            A small point, but I do not think it is correct to say that “humans emissions are also uniquely 13C depleted”. Flux from anthropogenic emissions is estimated to have virtually the same 13C/12C ratio as vegetation – certainly too close to distinguish them based on observations. Not too surprising really, since they share the same original source.

            The more interesting point is that the atmospheric depletion of the ratio reflects additional CO2 having a constant (net) ratio which is nowhere close to the value for emissions or vegetation. But that, as they say, is another story.

            Note also my reference to Keeling et al (2017) elsewhere on this thread.

          • bdgwx says:

            Thanks Jim. Hmm…I thought human emissions had lower 13C content than the atmosphere. I’ll double check that.

          • Jim Ross says:

            No, you are right that they are indeed depleted in 13C relative to the current atmospheric content, but my point is that they are not “uniquely” so. Further, they are much more depleted that the atmospheric changes show.

          • bdgwx says:

            Gotcha. Ok. So by “uniquely” I mean that d13C value for human emissions would have its own specific value. I suppose the coal seems that are on fire would have a similar d13C value, but I don’t think those represent a significant emission source. But you are right…our human 13C depleted emissions should have an expected influence on the d13C of the atmosphere. If the d13C of the atmosphere differs from expectations then that needs to be reconciled.

          • bdgwx says:

            That’s pretty compelling Nate. Clearly a new 13C depleted source began around 1800 that perturbed the carbon cycle so much that it altered the biosphere and hydrosphere fluxes by significant amounts.

          • Chic Bowdrie says:

            Major BS by the Queen of Obfuscation:

            “I wouldnt accept 14C dilution for the same reasons I wouldnt accept 13C dilution or 12C concentration. It just doesnt tell you what the entire mass is doing. It only tells what the mixing ratios are doing. Like I said we cant even tell from d14C values alone whether 14C mass is even declining. In fact, given that the e-time of the 14C decay curve is larger than the 4y residence time I would say 14C mass is actually increasing; just not as fast 12C. That would explain both its dilution and its longer duration vs residence time.”

            Super major BS:

            “…I would say 14C mass is actually increasing;”

          • Jim Ross says:

            bdgwx,

            What Nate’s references show is that the additional CO2 in the atmosphere since 1800 or thereabouts has had a 13C/12C ratio that was different from the existing ratio in the atmosphere (generally assumed to be circa -6.4 per mil). What the authors fail to mention, unless I missed it, was that the 13C/12C ratio of the incremental CO2 has been constant (other than minor fluctuations due to ENSO and major volcanic eruptions). This is easy to demonstrate with published data (direct measurements) and is supported by the Law Dome data.

            In addition to this consistency, there is the actual ratio “problem”. The δ13C value for the incremental CO2 flux is -13 per mil, whereas the value for fossil fuels is usually stated (e.g. by NOAA) as -28 per mil. (This latter figure is based on a blend between different fossil fuels and hence will have changed over time.)

            The best way to check that the δ13C of the incremental CO2 has not changed significantly over time is to use the “Keeling plot” where you plot δ13C against 1/CO2. See, for example: http://www.biogeosciences.net/3/539/2006/bg-3-539-2006.pdf. Figure 1 shows that the Law Dome data fit a good linear trend (r2 of 0.96), showing that the ratio for the incremental CO2 was essentially constant, with an intercept of -13.1 per mil being that ratio. The paper gives a good overview of the basis for the Keeling plot, and refers to this δ13C value as the “anthropogenic impact”. You can do a very simple cross-check of the overall average content since 1800 by using the equation 4 from the paper and ball-park values from Nate’s 1000 year paper:

            δ13C(add) = ((390*-8.4) – (280*-6.5))/(390-280) = -13.2 per mil

            The published models that I have seen all take the view that essentially all of the incremental CO2 in the atmosphere is from fossil fuels. This means that the δ13C ratio should have dropped a lot faster than it actually has. The assumption these models then apply is that the “missing” 13C comes from ocean-atmosphere exchange which does not affect the CO2 level but substantially increases the δ13C content of the atmospheric CO2 due to differential fractionation across the air-sea interface (see, for example, table 1 and figure 5 here: http://www.onlinelibrary.wiley.com/doi/10.1029/2001GB001845/pdf).

            I am not saying that I agree with this assumption.

          • Nate says:

            jim,

            thats interesting. just trying to understand, shouldn the emitted FF C get exchanged over a short period into biosphere and ocean mixed layer, just as bomb C14?

          • bdgwx says:

            Chic said: Super major BS:

            I would say 14C mass is actually increasing;

            I don’t see the BS there. I don’t think it’s unreasonable to hypothesize that absolute 14C mass may be increasing. Afterall, the d14C value is now leveling out close to 0. A d14C value that stays near 0 while total CO2 ppm rises means the mass of 14C must be increasing as well.

          • bdgwx says:

            Thanks Jim. You are a wealth of information. One thing I was thinking was that aggregate human emissions would have a higher (less negative) d13C value than FF samples because not all of human emissions are FF based.

          • Jim Ross says:

            Nate,

            I have not looked at the bomb 14C data in any detail, so I think I will avoid getting into that discussion!

            With respect to FF emissions, recent AGW models of δ13C seem to adopt the principles and assumptions that are set out in the reference given above (Randerson et al, 2001). Figure 5 is key, but it can be quite difficult to get your head around. If I can help explain it, let me know.

          • Jim Ross says:

            bdgwx,

            Thanks. I have done a lot of data analysis, but have no specific expertise in atmospheric science, so I look for holes in arguments rather than spouting my own hypotheses! As is often the case, it is what is not said that is the most interesting. You are correct about the difference with non-FF emissions, but the difference in δ13C flux terms is very small (-26 versus -28 per mil). There are also differences in photosynthesis as applied to different plant types.

            A useful reference for δ13C flux values is: https://www.esrl.noaa.gov/gmd/outreach/isotopes/c13tellsus.html
            (scroll to bottom of page).

        • bdgwx says:

          Can you pretend they represent some measure of 14CO2 molecules and take another look at the spreadsheet?

          I can’t just pretend that though. d14C is a ratio based metric that depends on the mixing ratio of 14C and 12C. It is a completely different metric. We can’t just pretend that a ppm data series is equivalent to a delta-isotope-ratio series because they are completely different concepts.

          • Chic Bowdrie says:

            The ratio metric is necessary because the production of 14C is not a constant and the atmosphere itself cannot be used as a standard especially after the bomb tests. But that doesn’t mean a certain absolute amount of 14C in the atmosphere prior to 1950 didn’t increase by a huge amount following the bomb testing. The removal data is a matter of record. I could convert numbers in my spreadsheet to the d14C metric and it would make no difference. The decay process is conceptually and kinetically the same. If you think not, show me the proof in your own spreadsheet.

            I already revised my spreadsheet using nominal amounts to demonstrate this.

          • bdgwx says:

            A decline in d14C does not mean that carbon mass was removed. It doesn’t even mean 14C specific mass was removed. All it tells you is that the ratio of 14C-to-12C declined. This decline can happen if 12C increased more than 14C.

            You could change your spreadsheet to use d14C values. But then you would not be analyzing how total carbon mass is removed. You’d only be analyzing the ratio of 14C relative to the other isotopes. While that may be useful for radiocarbon dating methods it doesn’t have a lot of applicability to climate because it doesn’t matter what the isotope mixing ratio is. All that matters is how much total mass there is.

          • Chic Bowdrie says:

            “This decline can happen if 12C increased more than 14C.”

            Are you claiming that the 100 ppm increase in CO2 was enough to dilute the 14C concentration to nearly baseline in 60 years? Ludicrous. You are grasping at straws now. Be scientific. Be open minded. Stop defending the dogma.

            “All that matters is how much total mass there is.”

            So you keep asserting without evidence. I can imagine many ways why you are correct. But I would want to be able to point to the data that shows why I believe that. All you do is spout Bern model dogma. Take a break. Let’s see what new data emerges going forward. That’s what I will do.

            May the forcings be with you.

          • bdgwx says:

            Are you claiming that the 100 ppm increase in CO2 was enough to dilute the 14C concentration to nearly baseline in 60 years?

            Not exactly. But it is a factor. Let me explain. 14C dilution can occur under two scenarios. 1) The amount of 14C drops faster than the amount of 12C or 2) The amount of 12C rises faster than 14C.

            Even if the amount of total carbon was not increasing 14C would still dilute because the big 14C source (bomb tests) was drastically reduced but the ~100 ppm/yr source and sinks remained in place which was replacing 14C molecules with 12C molecules.

            But there is another factor in play. The total carbon amount is increasing. This is because total net flux (source-sink) > 0. The sink side is randomly selecting molecules. But the source side is 14C depleted. The reason why the source side is 14C depleted is because a portion of the total source is from the FF reservoir. This reservoir contains really old carbon. 14C’s half-life is 5000 years so almost all of it has radioactively decayed in this reservoir. And we are release this carbon into the atmosphere. This works to dilute 14C.

            So you keep asserting without evidence.

            CO2’s eletromagnetic interactions are not substantially different whether the molecule as a 14C atom or a 12C atom. A 14C based CO2 molecule impedes IR radiation the same as a 12C molecule (mostly anyway). That’s why for climatology the carbon mixing ratio or d14C values aren’t that interesting.

            BTW…We didn’t discuss 13C yet. 13C makes up about 1% of the atmosphere. It’s also an interesting tracer isotope. 13C is diluting as well. But the dilution or decay rate is different from 14C. FF also happen to be 13C depleted; just not as much as 14C. The reason for the 13C depletion is different than 14C. 14C is depleted because it is radioactive. 13C is depleted because plants have a slight preference for 12C over 13C. And since the FF reservoir was formed from biomass it has less 13C in it relative to the atmosphere.

          • Nate says:

            “But I would want to be able to point to the data that shows why I believe that.”

            Exactly, pls point to the data that shows why you believe Berry and Salby?

          • Chic Bowdrie says:

            Nate and bdgwx. The King and Queen of Obfuscation.

          • bdgwx says:

            I don’t see the obfuscation here. But if there is then let me clarify it now.

            d14C values increase when

            – the amount of 14C increases faster than 12C
            – the amount of 12C decreases faster than 14C

            d14C values decrease when

            – the amount of 14C decreases faster than 12C
            – the amount of 12C increases faster than 14C

          • Nate says:

            Chic, with no answers, seems to have become full time troll.

          • Chic Bowdrie says:

            The hypocrisy of King Nate knows no bounds.

      • Chic Bowdrie says:

        While revising my spreadsheet, it occurred to me that you were asking for “a plot of a real carbon release and decay in which 63% was removed in ~15 years” as proof of Salby’s model. Have you asked your Bobbsey twin Nate for similar evidence of the Bern model?

        https://www.dropbox.com/s/u59s5t90kebmm71/Revised%20C14%20Model.xlsx?dl=0

        In the revised version an arbitrary inflow of 1 unit/year sets the baseline to 4 units with an e-time of 4 years. The pulse is an arbitrary 10 units. It decays with an e-time of 16 years regardless of whether the inflow stays constant at 1 unit/year or the inflow is followed by additional inflow while the sink rate is 1/4yr.

        • bdgwx says:

          So in your revised spreadsheet are we to assume that 14C is the only isotope in the atmosphere? If so then we can compute AT and in this particular case ATe=16y. But remember…this is only the case if we assume 14C is the only isotope in the atmosphere. If 13C and 12C are also in the atmosphere and since they are not documented in the spreadsheet then we would not be able to compute the AT because there isn’t enough information.

          • Chic Bowdrie says:

            It doesn’t matter whether 14C is the only isotope or not. Nature treats all 14CO2 molecules the same. She treats all 13CO2 the same. She treats all 12CO2 molecules the same. For government work, you can assume nature treats all CO2 molecules the same.

            In the case of my most recently revised spreadsheet, the AT is more than five 16-year e-times or greater than 80 years depending on how close to baseline you want it to go, which makes AT technically meaningless. Please, please, show the calculation that makes you think ATe=16y. I don’t even know what you mean by ATe.

            12C and 13C ARE in the atmosphere. Their concentrations affect the relative concentration of 14C, but not the absolute concentration. Stated another way, if I could change all 13C molecules to 14C and multiply the amounts in my spreadsheet by a scaling factor, it would not change the e-time for decay one bit.

            There are reasons why the 4-year e-time for 12CO2 and the 16-year e-time for 14CO2 are different (and I hope we can nail down what they are). But it has little to do with the absolute concentrations of the isotopes unless the physical differences in how they are exchanged have been greatly underestimated.

            The principles are 1) nature treats all CO2 molecules (nearly) the same and 2) exchange, growth, pulse, and removal processes follow (theoretically) the same kinetics, IOW governed by the same e-times. The caveats mean that there is no definitive evidence to the contrary.

          • Chic Bowdrie says:

            “If 13C and 12C are also in the atmosphere and since they are not documented in the spreadsheet then we would not be able to compute the AT because there isnt enough information.”

            So let’s assume they are documented in the spreadsheet since they are in the atmosphere. What more information would you need to calculate ATe, the e-time for the removal of 14C?

          • bdgwx says:

            What more information would you need to calculate ATe, the e-time for the removal of 14C?

            AT is a concept for total carbon mass. You can’t calculate the AT for just 14C.

            To calculate AT you must know or be able to infer the total carbon mass at specific moments in time.

            To calculate RT you must know or be able to infer the total carbon mass and total outflow.

            To calculate the 14C bomb spike decay e-time you must know or be able to infer the d14C value at specific moments in time.

          • bdgwx says:

            Please, please, show the calculation that makes you think ATe=16y

            AT is a metric that is only applicable to total carbon mass. If your spreadsheet is assuming all carbon is 14C then great. We can calculate AT. ATe is the duration from the peak level to the level at which only 1/e of the pulse remains. In your spreadsheet the peak occurs in 1962. This level is 14. The pulse size is 10. The pre-pulse level is 4. (1/e)*10 = 3.7. So 4 + 3.7 = 7.7. We then look at your spreadsheet and see when a level of 7.7 is reached. This occurs in 1978 in your spreadsheet. You can repeat this exercise for any target level to see what the adjustment time.

            if I could change all 13C molecules to 14C and multiply the amounts in my spreadsheet by a scaling factor, it would not change the e-time for decay one bit.

            That’s assuming the yearly inflow isn’t altering the mixing ratio of 14C, 13C, and 12C.

          • Chic Bowdrie says:

            Nate and bdgwx. The Bobbsey Twin King and Queen of Obfuscation.

          • Svante says:

            I agree with them and would be honoured if you could add me to the list.

          • bdgwx says:

            I don’t see the obfuscation here. It takes 16 years for the peak level to adjust toward a level that contains only 37% of the original pulse. That comes directly from your spreadsheet.

          • Nate says:

            “The principles are 1) nature treats all CO2 molecules (nearly) the same and 2) exchange, growth, pulse, and removal processes follow (theoretically) the same kinetics, ”

            Yes.

            “IOW governed by the same e-times. ”

            No that doesnt follow.

            Not for a system with driven dynamics.

            We have a system driven by a seasonal forcing. A 1 year cycle. This cycle causes mixing of any tracer into the various reservoirs. That time scale has nothing to with the mass relaxation e time.

            Why should it?

          • Chic Bowdrie says:

            “Do not give what is holy to the dogs; nor cast your pearls before swine….”

          • Nate says:

            Clearly you have no answers and are frustrated that you dont.

          • bdgwx says:

            Nate said: No that doesnt follow.

            Exactly. 14C depletion CLEARLY has a different timescale and trajectory than 13C depletion. 14C depletion CLEARLY has a different timescale and trajectory than total carbon mass depletion. It almost defies credulity that Berry/Salby/Harde, who are educated scientists, dismiss this fact.

          • Nate says:

            Since Chic is unable to answer, I will answer:

            Why should it?

            It shouldnt. Berry’s model is primitive and inapplicable to the real carbon cycle of the Earth.

            His model imagines a single reservoir with an INPUT from some imaginary infinite source, and OUTPUT through a hole to some imaginary third place with zero Level.

            He imagines that if Input were turned off that the fluid would continue to flow out the hole until the Level = 0, in etime = Level/Input.

            Of course this is ludicrous.

            There is no such imaginary place with 0 level. There is no evidence that the Level in the atm will drop to 0 if the Input were to stop.

            In fact it is well known that the annual OUTPUT flows to other reservoirs and the annual INPUT also comes from these SAME other reservoirs.

            These other reservoirs are LAND and SURFACE-OCEAN. And they have LEVELS comparable to the atm LEVEL, Not 0, Not infinite.

            The INPUT to ATM from LAND and OCEAN can be modeled as a forced oscillation of the ocean level up and down and the Land level up and down with the seasonal warming. As these levels are driven to oscillate up and down carbon flows into and out of the atm.

            These INTERNAL equilibration processes between the FAST SURFACE reservoirs is fast ~ a year or so.

            But now imagine ADDING new carbon to the 3 reservoir system from an EXTERNAL geologic source. This raises the levels of ALL 3 reservoirs, which equlibrate quickly with each other. The famous 45% remains in the atm.

            The level of these three reservoirs will remain elevated until the ADDED carbon can be drained away to the DEEP ocean.

            The e-time for that process is entirely separate from, and cannot be calculated from the INTERNAL seasonal dynamics of the 3 other reservoirs, but KNOWN parameters of the carbon cycle derived from measurements show that it is very very long.

          • Nate says:

            Let me put it another way that is perhaps closer to Chic’s language, and also comes from my own work.

            “The principles are 1) nature treats all CO2 molecules (nearly) the same and 2) exchange, growth, pulse, and removal processes follow (theoretically) the same kinetics, ”

            Ok yes.

            If the Earth system is forced, its carbon will respond to this forcing with the same kinetics and e-times.

            But I think we can all agree that the Earth system’s carbon cycle MUST have various time scales that it can respond with, various e-times. It has short time scales for plant respiration, longer time scales for leafing out and dropping of leaves, even longer time scales for storage of carbon in wood, and decay of wood. Much longer time scales for equilibration with the deep ocean thru mixing and currents. Still longer e-times are involved with melting of Ice Sheets and exposing soil.

            If an oscillatory forcing is applied with period T. Then only the system processes with e-times comparable with T control the dynamics. The longer ones are simply inaccessible. The shorter ones are saturated. This is well known principle in systems and materials that I work with.

            Thus if T = 1 day. Only the e-times for the thin layers of surface soils or ponds are involved.

            If T = 1 year, the seasonal forcing, only the surface ocean, surface soils, deciduous trees, etc will respond. These have short-e-times ~ 1 year.

            If T ~ 3 years ENSO, again only surface ocean and surface bisosphere respond.

            If T = 1 century, as has been the case for anthro, then the long e-times of deep-ocean sinking become relevant and control the observed dynamics.

          • Chic Bowdrie says:

            The King and Queen of Obfuscation have no data to support their assertions, no models to refute the Salby/Berry/Harde model, no solid grasp of the basic concepts involved. Your mutual admiration for each other reinforces the misinformation you are spewing and hinders your ability to explore the inadequacies of the Bern model and properly explain the discrepancies of the C14 and C12 e-times. You are comfortably enthroned in your closed-minded bubble.

            Give your arms a rest. They must be tired from all your hand-waving arguments.

          • Nate says:

            “no solid grasp of the basic concepts involved.”

            And yet you cannot dispute any of the basic concepts and facts Ive laid out.

            Just more ad homs.

            If thats all you can do, why are you still here?

          • Chic Bowdrie says:

            What facts? No data, no models, no equations, only hot air and hand waving.

            King Nate securely seated on the throne of obfuscatory oscillating forcings.

          • Nate says:

            “What facts? No data, no models, no equations”

            I gave you equations and models and papers in other posts. Very few of your posts contain equations. They are still allowed.

            A few of the Facts that you missed in my posts:

            ” It has short time scales for plant respiration, longer time scales for leafing out and dropping of leaves, even longer time scales for storage of carbon in wood, and decay of wood. Much longer time scales for equilibration with the deep ocean thru mixing and currents. Still longer e-times are involved with melting of Ice Sheets and exposing soil.”

            “There is no such imaginary place with 0 level. There is no evidence that the Level in the atm will drop to 0 if the Input were to stop.
            In fact it is well known that the annual OUTPUT flows to other reservoirs and the annual INPUT also comes from these SAME other reservoirs.
            These other reservoirs are LAND and SURFACE-OCEAN. And they have LEVELS comparable to the atm LEVEL, Not 0, Not infinite.”

            “If T = 1 year, the seasonal forcing, only the surface ocean, surface soils, deciduous trees, etc will respond. These have short-e-times ~ 1 year.”

          • Chic Bowdrie says:

            Your Royal Highness,

            Begging your pardon, I provided equations when necessary to correct and amend your comments in the few times I recall you including any. Equations are models. I spent the bulk of my comments on this post using models to explain concepts that you misunderstood, ignored, or obfuscated. I recall you citing only one relevant paper (which I twice thanked you for) and no models other than the one in question, the Bern model, which is not yours.

            You point to three “Facts” you claim I missed. I ignored them because I grow weary of your predictable obfuscation of any answer I give.

            The first has no data, numbers, equations, models, or specific context for me to disagree with. What do want, a pat on the back for penetrating insight into the intuitively obvious?

            The second is a red herring because neither Berry and I used or needed a 0 level in any of our models. Baseline is not necessarily 0 or any other value, just a reference point to evaluate perturbations to an equilibrium.

            The third refers to yearly fluctuations which are included as average numbers in my models. They are relevant only to the subject of this post, which is largely irrelevant to the discussions here on e-times governing the dispensation of atmospheric CO2.

            I have the honor to be, Sir, Your Majesty’s not so humble nor obedient thorn in your side.

          • Nate says:

            “penetrating insight into the intuitively obvious?”

            Ok if it is intuitively obvious that there are short and very long e-times (due to deep ocean) in the Earth system, why do you keep ignoring this fact and offering models that only have a single, short, 4 y, e-time?

            “he third refers to yearly fluctuations which are included as average numbers in my models. They are relevant only to the subject of this post, which is largely irrelevant to the discussions here on e-times governing the dispensation of atmospheric CO2.”

            Oh just stop with the BS. Math can be used to obfuscate.

            The annual flows are CENTRAL to Berry’s and your models. They are constantly used to argue that e-time is short, 4 years. They are constantly compared to anthro flows, to argue that anthro is too small to explain the observed rise.

            Your 0.25 sink rate is based on the annual flows.

            My point was that the annual flows do not access the Deep Ocean because its e-time is much to long. This is basic systems theory.

            But you would prefer to ignore this fact.

            The arrangement and relative sizes of the reservoirs matters. But again your models ignore this fact.

            I just don’t get why you think that your model and Berry’s model can ignore these basic facts of the Carbon cycle, and still expect it to accurately model the behavior on Earth?

          • Chic Bowdrie says:

            “why do you keep ignoring [short and long e-times] and offering models that only have a single, short, 4 y, e-time?”

            I’m glad you asked. Those e-times are not known and I’m not finished with a more complex model that would evaluate the need for longer e-times. The model I do have is a modification of Dr. Spencer’s spreadsheet model based on the improper physics that outflow of CO2 is proportional to the difference between current CO2 level and the guestimate of the 1750 level. In addition, I’ve offered models that are useful for testing against real data and speculating on future outcomes.

            “Oh just stop with the BS. Math can be used to obfuscate.”

            Apparently you did not understand my point. Ask a clarifying follow-up question…oh never mind.

            “But you would prefer to ignore [annual flows not accessing alleged too long Deep Ocean e-times].”

            You frequently refer to facts not in evidence. I don’t know that Deep Ocean e-times invalidate the simple models that demonstrate short e-times for the atmosphere. If you know otherwise, present the data or at least a model (other than the unverified Bern model) to substantiate your claim.

            I can’t speak for Dr. Berry, but I think he would agree that we are not satisfied with the conclusions of the Bern model and others that result in the conclusion that all the increase in atmospheric CO2 is due to humans. Our models demonstrate other possibilities and don’t claim to accurately model all aspects of the carbon cycle.

            Learn to live with it.

          • Nate says:

            “If you know otherwise, present the data or at least a model (other than the unverified Bern model) to substantiate your claim.”

            Im happy to learn about, and use previous science discoveries. I feel no need to reinvent the wheel or relativity or other work that is already done better than I could do, by experts who spent years diving into it.

            Even in the 1950s it was plainly obvious that to explain the carbon cycle of the real Earth, a multi-box model was required.

            By 1975, with the data available even then, it was clear that even more sophistication was required and the level of complexity can be seen in Eq 1 and 2 in the Bern paper. Since then we’ve only obtained more data confirming the need for multi-box models and GCM simulations.

            Yet here you are in 2020, confidently claiming, No No, a simple one box model, pre-1950s, should work just fine.

            What is the basis for this confidence? New data? MAGA? What?

          • Nate says:

            “You frequently refer to facts not in evidence. I don’t know that Deep Ocean e-times invalidate the simple models that demonstrate short e-times for the atmosphere.”

            First of all, it is plainly obvious that the ocean’s carbon cannot turn over in 1 year.

            The C14 data in the BERN paper, is one example, showing little penetration of the deep ocean by C14 in a decade or so. More recent data confirms this.

            “Dr. Spencer’s spreadsheet model based on the improper physics that outflow of CO2 is proportional to the difference between current CO2 level and the guestimate of the 1750 level.”

            appears to be a contradiction to your earlier statement that:

            “The second is a red herring because neither Berry and I used or needed a 0 level in any of our models. Baseline is not necessarily 0 or any other value, just a reference point to evaluate perturbations to an equilibrium”

          • Chic Bowdrie says:

            More complaining from King Nate without contributing any new information.

            Thanks again for bringing Oeschger’s 1975 paper to my attention. In Figure 8, he compares the output of his model to 10 years of Mauna Loa data and gets an amazingly good fit. Have you projected his model out to see how it did over the following 50 years?

            Have you tested his model with a theoretical pulse to see how it compares with the Bern model?

            Notice the 14C data in Figure 9? If you use an e-time of 4 years, you get an amazingly good match to the growth of 14C in the mixed layer. Don’t you find that interesting?

            I never said a one-box model is fine for explaining every detail of the carbon cycle. But a one-box model does a good job of describing the growth of atmospheric CO2 using only one e-time and allowance for modest growth in natural emissions not included in human emission estimates. I am reasonably confident that the growth in population and increase in global temperatures will bear this out.

          • Chic Bowdrie says:

            “First of all, it is plainly obvious that the oceans carbon cannot turn over in 1 year.”

            Never said it did.

            “More recent data confirms this.”

            A non sequitur, but it would be good for you to cite it and explain how it is relevant.

            “appears to be a contradiction to your earlier statement that:”

            I have no idea how that is a contradiction. I think you must not understand the situation. Or it could be your usual obfuscation which has long since gotten entirely too tiresome.

          • Nate says:

            “I never said a one-box model is fine for explaining every detail of the carbon cycle.”

            Cop out. How about ANY issue. The C14 Residence time? No. The time it takes to sink new carbon added to the atmosphere. No evidence your model gets that right. The C13. The Seuss Effect. The ice core data?

            “But a one-box model does a good job of describing the growth of atmospheric CO2 using only one e-time and allowance for modest growth in natural emissions not included in human emission estimates.”

            This is not a legitimate test of your model, in any possible way.

            You are simply inventing a ‘natural emissions’ profile that there is no independent evidence for. Then, miraculously, it ‘explains’ the rise of atm CO2.

            This is not science, it is self-delusion.

          • Nate says:

            “Thanks again for bringing Oeschgers 1975 paper to my attention. In Figure 8, he compares the output of his model to 10 years of Mauna Loa data and gets an amazingly good fit. Have you projected his model out to see how it did over the following 50 years?”

            No.

            “Have you tested his model with a theoretical pulse to see how it compares with the Bern model?”

            No. You should try that. Have to look at subsequent papers to see how the model has evolved.

            In the paper, the Model was tested against C14 ocean invasion data and atm CO2 rise, and passed.

            “Notice the 14C data in Figure 9? If you use an e-time of 4 years, you get an amazingly good match to the growth of 14C in the mixed layer. Dont you find that interesting?”

            Yes, that might make sense. Again the Mixed layer is 1 box. From this box the C14 can return to the atmosphere box via a term in eqn 1, over and over, UNTIL it is removed and spread to the rest of the ocean. Thus the atm C14 decay will not be 4 y.

            This is a SERIES process, that requires longer than 4 y, ~ 16 y apparently.

          • Chic Bowdrie says:

            As usual King Nate operates in the Realm of Obfuscation providing no data to back his assertions, proposing work he can’t do, adding nothing but speculation to the conversation. Sad, but true.

          • Nate says:

            As usual, any argument or fact you dont understand must be obfuscation.

          • Nate says:

            “providing no data to back his assertions”

            Data has been provided to you again and again.

            Most recently in the Bern paper, and you asked for my thoughts about it. I gave it.

            At least I don’t invent my own data, as you do, to test your models..

            C’mon that is just plain ignorant.

          • Nate says:

            “proposing work he cant do”

            It was you who demanded it. I just see no point in doing work for you that will be in the end serve no purpose.

            You are not led by evidence.

            ‘No data to back his assertions’

            We have been waiting an eternity for you to provide ANY real data to back your assertions.

          • Chic Bowdrie says:

            That is another classic obfuscation. Nobody does it better than the King.

            “As usual, any argument or fact you dont understand must be obfuscation.”

            That is an obfuscation right there. It’s not my misunderstanding your arguments or facts that makes you an obfuscator. It is your messing with my arguments, introducing non sequiturs and red herrings, and making unsubstantiated claims. For example, you claim “Data has been provided to you again and again” in response to my complaint you provide no data to back your assertions. In the previous two comments at 12:06 PM and 12:23 PM, you supplied no data to back any of your assertions. I am the one referencing the data in the figures and calculating an e-time from Oeschger’s 14C data.

            Next point of obfuscation, in response to my question (not a demand) about whether you compared a pulse with Oeschger’s model against the Bern model, you answer, “No. You should try that.” That’s what I call proposing work you can’t do. Maybe won’t do would have given you the benefit of the doubt.

            And finally in response to my noting you provided no data in this thread, you say “We have been waiting an eternity for you to provide ANY real data to back your assertions.”

            It’s blatant hypocrisy. It’s disgusting obfuscation. It’s pitifully sad.

            Nothing new.

        • Nate says:

          The debate should not be all about the performance of the commenters.

          It should be about the facts and the data and the proper model to explain them.

          The points Im trying to make recently are qualitative but still key. They are not obfuscation.

          Some of the Earth’s reservoirs are in series and some in parallel. A proper model should account for this arrangement. Yes?

          The 1975 Bern model, and its box-model predecessors account for this.

          A proper model should account for ocean chemistry, mixing, structure. Yes?

          The 1975 model does this.

          A proper model will be responsive to new empirical data. Yes?

          The 1975 model does this.

  79. Brendan says:

    IR radiation is Electro Magnetic Radiation or EMR. The atmosphere contains Radiatively Active Gases or RAGs. RAGs absorb and emit EMR. Nothing gets blocked or trapped. It is impossible for EMR to get trapped in the atmosphere. As soon as a RAG absorbs an IR photon it immediately emits it in every direction within just a couple of nanoseconds. Some comes back to the Earths surface. This is called back-radiation. 95% of all back radiation comes from water vapor molecules. CO2 molecules only absorb IR EMR in an extremely narrow bandwidth centered around 14.6 microns. The extremely small amount of back-radiation from CO2 gets absorbed by the Earth and reemitted at 1 to 100 micron wavelengths which bypasses any CO2 molecules on the way out a second time. IR EMR travels at the speed of light. It takes a circuitous pinball journey through the atmosphere with all, 100%, escaping to space in less than 30 milliseconds. Nothing gets trapped.

    It is impossible for back-radiation to heat the Earth. Back-radiation is the Earths own radiation coming back on itself. It is impossible for the Earth to heat itself with its own radiation.

    The mean free path for an IR photon traveling through the atmosphere to collide with and get absorbed by a CO2 molecule is 33 metres. These things are as scarce as hens teeth. And just 4% of them come from humans.

    No one has ever measured the Earth being heated from the back radiation from CO2 molecules. Wong & Minnett 2018 tried and failed miserably. https://principia-scientific.org/alarmist-study-fails-to-measure-co2-back-radiation/. They couldnt even measure heating of the Earth from the back-radiation from water vapor.

    There is no such thing as a greenhouse effect or greenhouse gases. It is a theory that has never been scientifically proven. In order to prove it you must be able to measure the heating of the Earth from the back-radiation from specifically CO2 molecules. And if you want to prove Human Induced Climate Change HICC then you need to be able to measure the heating of the Earth from the back-radiation from specifically those 4% of CO2 molecules emitted by humans.

    • Ball4 says:

      Brendan writes: “Nothing gets blocked or trapped.”

      Then Brendan writes something does get blocked: “(EMR) takes a circuitous pinball journey”

      Perhaps Brendan should explain how photons are colliding but are not blocked.

      • ClintR says:

        Brendan already explained: “It takes a circuitous pinball journey through the atmosphere with all, 100%, escaping to space in less than 30 milliseconds. Nothing gets trapped.”

        Perhaps Ball4 should explain why he can’t understand basic concepts.

        • Ball4 says:

          ClintR could help Brendan explain for readers how a circuitous pinball journey is nothing getting blocked. I doubt ClintR wants to be useful though; I do expect some more entertainment from ClintR.

          • ClintR says:

            The entertainment is provided by you, Ball4. Your avoidance of reality, combined with your desperate need to have the last word, makes for a great show.

    • bdgwx says:

      There is other lines of misinformation in this comment, but since this blog post is focused on the carbon cycle I’ll focus on the 4% claim first.

      Let’s be precise on semantics. Of the CO2 molecules that are currently in the atmosphere only ~4% were directly emitted by humans. But of the 410 – 280 = 130 ppm increase in mass nearly 100% occurred because of humans. That means 130 / 410 = 32% of the molecules are there because of humans.

      In other words if we could somehow tag all human emitted CO2 molecules you would observe that only 4% of the molecules in the atmosphere would have that tag. But, if those tagged molecules had never gone in the atmosphere during the industrial revolution then there would be 130 ppm less of them overall.

      Make sure you understand this distinction. If there is confusion please ask questions.

      • Chic Bowdrie says:

        You keep asserting facts not in evidence. Your “130 of the molecules are there because of humans” assumes no additional natural emission growth since human activity. And if we have done all the work increasing the plant food, God bless us one and all!

        • bdgwx says:

          Brendan’s own source says “natural” mass exchange with the atmosphere is -6.7 GtC/yr (-3.1 ppm/yr). He also cited IPCC AR5 Ch. 6 which says it is -4.9 GtC/yr (-2.3 ppm/yr).

          • Chic Bowdrie says:

            My modified Spencer model for 2018 shows natural emissions at 111.35 ppm and natural absorp.tions at 27.9% of 407.76 ppm of atmospheric CO2. That is a net of -2.42 ppm/year. Agreement with the IPCC much?

            What I’m trying to get across is how much more the natural sources may have been emitting than in previous years. That contributes to the rise in CO2. It is possible Brendan’s source is providing that evidence. I’ll have to check it out.

          • bdgwx says:

            A rise in natural sources only contributes to atmospheric increases if the natural sinks did not rise by the same amount.

            We know that natural sources and sinks were roughly balanced prior to the industrial revolution given the relatively stable CO2 level.

            And we know that natural sinks rose MORE than natural sources because of the lines of evidence showing net absor.p.tion.

            And BTW…if “natural” sources and sinks changed because of the actions of humans then those “natural” sources and sinks aren’t fully natural anymore. That’s a discussion for another time, but it shouldn’t be ignored.

          • Chic Bowdrie says:

            “A rise in natural sources only contributes to atmospheric increases if the natural sinks did not rise by the same amount.”

            Are you paying any attention? My model shows that that sentence is false. Your argument is not logical. It assumes that natural sources didn’t rise at all. A 1 ppm rise in natural emissions contributes something albeit not much, unless you insist that human emissions are preferentially retained.

            The “all changes in natural sources are human caused” argument is been there done that and not a discussion for any more of my time.

          • bdgwx says:

            A 1 ppm rise in natural emissions contributes something albeit not much, unless you insist that human emissions are preferentially retained.

            1 ppm/yr increase in sources without a corresponding increase in sinks would contribute to an atmospheric increase. But a 1 ppm/yr increase in sources with a 2 ppm/yr increase in sinks would be a net of -1 ppm/yr. That would suppress an increase.

            It assumes that natural sources didnt rise at all.

            Then it doesn’t match the evidence.

          • bdgwx says:

            Chic said: It assumes that natural sources didnt rise at all.

            bdgwx said: Then it doesnt match the evidence.

            Err…That isn’t right. I thought I was replying to a comment about sinks. But clearly the comment is about sources.

            If natural sources didn’t rise at all but natural sinks did rise then nature would be contributing to a decline.

          • Chic Bowdrie says:

            bdgwx. The Queen of Obfuscation.

          • bdgwx says:

            I don’t see the obfuscation. The CO2 level in the atmosphere is dictated not be sources alone, but by the net of sources and sinks. And if a particular interfacing reservoir has a net negative flux then that reservoir is contributing to either a suppression of the rise or a decrease. It cannot possibly be contributing to an increase because it is taking mass from the atmosphere.

          • Dr Roys Emergency Moderation Team says:

            bdgwx. The Queen of obfuscation.

    • Tim Folkerts says:

      “RAGs absorb and emit EMR. Nothing gets blocked or trapped. It is impossible for EMR to get trapped in the atmosphere. As soon as a RAG absorbs an IR photon it immediately emits it in every direction within just a couple of nanoseconds. ”

      There are a few errors here.

      IR photons get emitted in times like microseconds. But collisions with other atoms occur in nanoseconds. So when a “RAG” absorbs an IR photon and gets boosted to an excited energy level, the odds are MUCH greater that the extra energy will get transferred to another atom rather than getting re-emitted as an IR photon.

      So energy from EMR *does* get “trapped” in the atmosphere. It does not “immediately” get scattered in all directions.

      Lots of IR photons from the warmer surface DO get absorbed into the cooler atmosphere — transferring energy from the ground to the atmosphere. A smaller number of photons get emitted from the cooler atmosphere back down to the surface — transferring energy from the atmosphere to the ground.

      • Dr Roys Emergency Moderation Team says:

        “the odds are MUCH greater that the extra energy will get transferred to another atom rather than getting re-emitted as an IR photon.”

        Another atom, like nitrogen or oxygen most likely.

        So energy from EMR *does* get “trapped” in the atmosphere. It does not “immediately” get scattered in all directions.”

        Ultimately trapped in the atmosphere by N2/O2, not GHGs, since GHGs can emit more efficiently than N2/O2.

      • Chic Bowdrie says:

        Tim Folkerts,

        You aren’t telling the whole story. There is already enough CO2 in the air to absorb all energy radiated from the surface and transfer it to other molecules. This results in expansion of the air and convection. There is no evidence of any increase in CO2 causing any increase in energy transferred to the ground. More CO2 will only mean faster removal of energy via convection/advection.

        • bdgwx says:

          Chic said: There is no evidence of any increase in CO2 causing any increase in energy transferred to the ground.

          That literally is not true. There is evidence of this. I think what you actually mean is that you don’t accept it.

          • Chic Bowdrie says:

            Put up or shut up, Queenie.

          • bdgwx says:

            I recommend starting with IPCC AR5 Chapter 8. It provides a reasonable introductory level summary. There is a complete bibliography at the end of the chapter that you can use to start branching out.

            I also recommend exploring the history of how CO2’s radiative forcing was quantified. Read Arrhenius’ 1896 paper. Read Callendar’s 1938 paper. Read Plass’ works beginning in 1956. The 1950’s was the era in which radiative transfer models were developed using molecular physics and quantum mechanics. Publications regarding CO2’s radiative force begin exponentially increasing at this point. Myrhe et al. 1998 has a good overview of other GHGs including the simple “back-of-the-envelop” estimation models for them. This is the publication in which the well known sensitivity parameter of 5.35 for the 1896 Arrhenius-like model first appears (AFAIK anyway).

            Make sure you branch out and read each of these publication’s bibliography list and their bibliography lists and so on as well.

            There is so much there that it’ll keep you busy for a lifetime.

          • Svante says:

            Or he could just realize that Earth’s output depends on the temperature you see (in IR) from space.
            More CO2, less IR optical depth, higher/colder TOA, less output.
            The radiation budget surplus means Earth accumulates energy and must warm until equilibrium is restored.

          • Chic Bowdrie says:

            Queen b,

            More hand-waving? Come on now, put up or shut up.

          • bdgwx says:

            Chick, I guess I’m not sure what is being asked then. Can you clarify what your request is?

          • Chic Bowdrie says:

            I won’t be reading a lifetime of articles in order to verify your assertions. Appeals to authority and other people’s hypothetical unverified models do not move me. The onus is on you to provide the evidence that an increase in CO2 will transfer more energy to the ground.

            Read these articles for relevant background.

            https://nov79.com/gbwm/satn.html
            https://tinyurl.com/y8njkklh
            http://venturaphotonics.com/files/The_Greenhouse_Effect.pdf

            I’m not claiming they prove you won’t find evidence that more CO2 will cause an increase in ground temperatures. I only provide these articles for you to learn about the processes involved and the difficulty in finding actual data that differentiates between the contributions of radiative and convective heat transfer, let alone how an incremental increase in CO2 affects global temperatures.

            The Cliff note version of the problem occurs when the atmosphere is characterized as a blanket that warms by increasing its thickness. The atmosphere already contains enough CO2 to capture ALL the radiation given off by the surface in any given day other than radiation that goes directly to space. Adding more CO2 will not change that fact. The captured CO2 is transferred to the bulk air by collisions with other molecules resulting in convection and wind. This enhances cooling, not warming.

            You need measurements that show temperature differences between CO2 then and now. There are computer models that claim to do that, but there is not enough data to cover the whole world. Evidence from a limited area is basically anecdotal evidence.

          • Svante says:

            Chic, here’s a primer for you (if you have five minutes to spend on understanding the GHE that is):
            https://tinyurl.com/y8nvylsg

          • Nate says:

            “I won’t be reading a lifetime of articles in order to verify your assertions. ”

            He doesnt believe us. He doesnt believe experts. He wont read papers. He can’t do the calculations himself.

            Yet he’s certain its wrong.

          • Nate says:

            “The atmosphere already contains enough CO2 to capture ALL the radiation given off by the surface in any given day other than radiation that goes directly to space. Adding more CO2 will not change that fact.”

            You fail to understand how insulation works. Same is true of any insulation, whether radiative, convective, or conductive. Adding more of it DOES make a difference.

            Purely radiative vacuum insulation (MLI) works better with more layers.

            “The captured CO2 is transferred to the bulk air by collisions with other molecules resulting in convection and wind. This enhances cooling, not warming.”

            Nope, this is an unproven assertion and not logical. Show us evidence.

          • Chic Bowdrie says:

            You show me yours, I’ll show you….

            On second thought, why bother.

          • bdgwx says:

            Chic, I get that bloggers and probably even a few credentialed scientists believe that CO2’s effect is saturated. But those opinions are relatively small and have already been debunked. Let me ask you this…if a handful of contrarian opinions are right then why is that our space based radiometer experiments observe a drop in the active channels of CO2, CH4, etc. when those gas species increase? And why is it that ground based radiometer experiments observe an increase in DWLR in the active channels? My references are Harries 2001, Griggs 2004, Chen 2007, Wang 2009, Philipona 2004, and Evans 2006. There’s probably more, but that should get you started.

            BTW..H2O is a polyatomic gas species like CO2. Is it’s effect saturated? Why or why not?

          • Chic Bowdrie says:

            Two responses to your first paragraph. The first half boils down to an appeal to authority. Can’t stand on your own two feet? Those papers confirm the CO2 spectrum and that CO2 has increased. Nothing new there. They don’t measure a temperature increase resulting from the increase in CO2. Big difference.

            With sufficient humidity, water vapor absorbs all the available IR from the surface in the wavelengths that CO2 doesn’t and some that it does. This is just how the atmosphere works. Bulk air heated by collisions with excited CO2 and H2O molecules carries energy up to where CO2 can emit it to space by reverse thermalization.

          • bdgwx says:

            It’s an appeal to evidence. I do it a lot.

            What radiometer experiments show is that given the CO2 concentrations in the atmosphere today an incremental increase of it causes a corresponding incremental increase in the magnitude in its radiative effect. Those are of course planetary scale experiments. We also have the laboratory experiments beginning with Tyndal’s thermpoile experiments and moving up to modern infrared spectroscopy that we could talk about too if you’d like. This is the crux of the saturation hypothesis. Tests have been performed. They’ve been repeated and replicated. It turns out the hypothesis is false.

            Now if you want to move the goal post and hypothesize that a change in radiative flux has no impact on the accumulation of heat/energy and ultimately temperature between the sender and receiver we can move on to that if you’d like.

            Regarding WV…at what point do you think H2O’s radiative effect is saturated?

          • Nate says:

            Exactly when you no longer have the facts or logic to back up your claims, why bother?

            When all of youve got left is juvenile name calling. Why bother?

            Ur done. Go home.

          • Nate says:

            “Put up or shut up, Queenie.”

            BDGWX offers up several relevant experimental results and papers.

            So now its ‘you appeal to authority’

            Hilarious!

          • Chic Bowdrie says:

            b,

            Are the radiometer experiments showing an increase or a decrease in OLR? Are they showing an increase or a decrease in ASR? What can you definitively conclude from that data? And I’m not talking about your theories.

            What hypothesis do you think was falsified by laboratory experiments?

            Going back to an earlier comment, where you posit claims that “CO2’s effect is saturated” have been debunked, what is the effect you are referring to?

            You need to accurately describe the details so that I know what you are talking about. Otherwise we are just talking past each other. I don’t have time for that.

            The goal post for me has never moved: There is no evidence that an incremental increase in CO2 causes a further increase in global temperatures. If you think the goal post has changed, please state your case.

            Regarding WV, it is the same principle as for CO2 although the distances may be somewhat different depending on wavelengths and humidity. You will understand this better when you understand the saturation effect.

            Also, is there any way to get King Nate to go back to sleep? He’s drooling all over the blog.

          • Nate says:

            “Now if you want to move the goal post and hypothesize that a change in radiative flux has no impact on the accumulation of heat/energy and ultimately temperature between the sender and receiver we can move on to that if youd like.”

            Well put.

            More hilarity from Chic, who seems to think the First Law of Thermodynamics is not really a law, just a suggestion.

          • Chic Bowdrie says:

            b,

            Your King Nate is playing the jester now. How foolish he looks.

            I never “hypothesized that a change in radiative flux has no impact on the accumulation of heat/energy and ultimately temperature between the sender and receiver.” I am hypothesizing that the change in CO2 is not causing the warming. Big difference.

          • bdgwx says:

            So your hypothesis is that a change in CO2 does not result in a change in radiative flux?

          • Chic Bowdrie says:

            I propose that further increases in CO2 cause changes in global temperatures that are indistinguishable from the changes caused by other factors.

            I should revise my hypothesis to include some wiggle room. A change in CO2 will not cause a significant change in radiative flux averaged over the whole planet.

          • bdgwx says:

            The evidence says the change is significant.

          • Chic Bowdrie says:

            If you have the evidence, please post it.

          • bdgwx says:

            Harries et al. 2001: Increases in greenhouse forcing inferred from the outgoing longwave radiation spectra of the Earth in 1970 and 1997

            Griggs 2004: Comparison of spectrally resolved outgoing longwave data between 1970 and present

            Chen et al. 2007: Spectral signatures of climate change in the Earths infrared spectrum between 1970 and 2006

            Philipona et al. 2004: Radiative forcing ‐ measured at Earth’s surface ‐ corroborate the increasing greenhouse effect

            Evans 2006: Measurements of the radiative surface forcing of climate

          • bdgwx says:

            I actually had several more that I was trying to include in that post above, but the blog’s filter didn’t like it.

          • Svante says:

            bdgwx, can you try the most recent paper on its own please?

        • bobdroege says:

          Where is JD when you need him?

          And his IR thermometer taking temperature measurements of the sky?

          • Svante says:

            He’s busy selling his lunatic reference frame under last months UAH update, using yet another alias (C-l-i-n-t-R) since he keeps getting banned.

        • Nate says:

          “There is already enough CO2 in the air to absorb all energy radiated from the surface and transfer it to other molecules. This results in expansion of the air and convection. There is no evidence of any increase in CO2 causing any increase in energy transferred to the ground. More CO2 will only mean faster removal of energy via convection/advection.”

          Hmm, let me put my response this way. Applying your ‘logic’ to my attic insulation:

          ‘There is already enough fiberglass in my attic insulation to absorb all energy radiated or conducted from the ceiling and transfer it to other fiberglass and trapped air molecules. There is no evidence adding more fiberglass insulation will cause a reduction in heat loss thru my attic. More fiberglass will only mean faster removal of energy via convection/conduction.’

          Even though fiber glass molecules are responsible for radiating and conducting heat to the attic space, adding more of it REDUCES overall heat loss.

          • Chic Bowdrie says:

            Analogies are tools of obfuscation. Fiberglass is constrained in space and is effectively a solid transferring heat by conduction. Radiation and convection are inhibited by fiberglass insulation. The atmosphere is a gas, not a solid.

          • Nate says:

            Analogies are tools of understanding. The principle of insulation is the same.

            “Fiberglass is constrained in space and is effectively a solid transferring heat by conduction. Radiation and convection are inhibited by fiberglass insulation. The atmosphere is a gas, not a solid.”

            True but this makes a difference why?

            The point is that whether solid or gas, the molecules of the medium are capable of transferring heat. The outermost layer of a fiberglass sheet and the highest altitude layer of CO2 in the atmosphere both transfer heat from the medium onward.

            We could say that these last molecules of fiber glass or CO2 are responsible for cooling the medium, but that misses the point of what insulation does.

            The real models of the atmosphere show that it can be understood as a set of layers, each layer is optically opaque in CO2 bands, and is warmed by layers below via convection and radiation. The last opaque layer radiates to space at a temp set by its altitude.

            Adding more CO2 effectively adds more layers.

          • Chic Bowdrie says:

            Nate, Nate, Nate.

            Your analogy is simply wrong. The atmosphere doesn’t work like that. Only the dogma-invested or simpletons can’t see beyond the blanket analogy for the atmosphere.

          • Nate says:

            “Your analogy is simply wrong. The atmosphere doesnt work like that.”

            Oh I see.

            No I don’t. Standard Chic operating procedure.

            No actual rebuttal, no credit.

          • Chic Bowrie says:

            King Nate,

            You are an obfuscatory SOB. Are you paid to troll here? Occasionally your Queen will participate in a scientific discussion, but all you do is deny, misinform, and accuse others of what you do over and over.

            My rebuttal is simple. There is no fiberglass in the atmosphere. Have you ever seen a layer in the atmosphere? The atmosphere is a continuum of molecules, not a cake. The atmosphere does not work that way. QED.

          • Svante says:

            Chic Bowrie says:
            “There is no fiberglass in the atmosphere”.

            Is that why most telescopes operate in the CO2 abs-bands?

          • Nate says:

            “The point is that whether solid or gas, the molecules of the medium are capable of transferring heat. The outermost layer of a fiberglass sheet and the highest altitude layer of CO2 in the atmosphere both transfer heat from the medium onward.

            We could say that these last molecules of fiber glass or CO2 are responsible for cooling the medium, but that misses the point of what insulation does.”

            Where in here do you see me claiming any fiberglass in the atmosphere or that the atmosphere is solid?

            This was in response to your claim, which is a well known myth, that since CO2 is responsible for COOLING the atmosphere, it cannot be warming.

            That is wrong, because the last molecules in ANY form of insulation are COOLING, ie removing the heat, from the insulation.

            But it still insulates.

          • Nate says:

            “Have you ever seen a layer in the atmosphere? The atmosphere is a continuum of molecules, not a cake.”

            No where did I claim that the atmosphere is actually layered, strawman erector.

            As I explained, but you mustve missed, it is modeled that way. Because a certain thickness of atmosphere makes it opaque to IR in CO2 bands. Pure optics. That defines a layer in the model.

            Although such a layer is opaque to IR, it can still transfer heat to layers above or below it, by emitting IR, or by convection.

            Not my model. Just standard atmospheric physics developed 50 y ago.

          • Chic Bowdrie says:

            “This was in response to your claim, which is a well known myth, that since CO2 is responsible for COOLING the atmosphere, it cannot be warming.”

            I never claimed that. I claimed there is no evidence that an increase in CO2 will increase global temperatures. Using a fiberglass analogy is not good evidence.

            No data, no models, no conductivities. Nothing but hand-waving and speculation. Typically obfuscatory.

          • Chic Bowdrie says:

            “No where did I claim that the atmosphere is actually layered”

            http://www.drroyspencer.com/2020/06/covid-19-global-economic-downturn-not-affecting-co2-rise-may-2020-update/#comment-491657

            “The real models of the atmosphere show that it can be understood as a set of layers, each layer is optically opaque in CO2 bands, and is warmed by layers below via convection and radiation. The last opaque layer radiates to space at a temp set by its altitude.

            Adding more CO2 effectively adds more layers.”

            No icing, no thicknesses, no data, no models, no conductivities. Nothing but hand-waving and speculation.

            The obfuscation by Nate is like diarrhea. It stinks and you wish it would end.

          • Nate says:

            You’re density knows no bounds.

          • Nate says:

            For the uninformed and hopelessly literal:

            “The simple one-level atmospheric model can be readily extended to a multiple-layer atmosphere. In this case the equations for the temperatures become a series of coupled equations. This simple model always predicts a decreasing temperature away from the surface, and all levels increase in temperature as ‘greenhouse gases are added’.”

            From https://en.wikipedia.org/wiki/Idealized_greenhouse_model

    • Nate says:

      Too bad another soul lost to the PSI flat-earther cult.

      By definition, their ideas cannot be falsified.

    • Dr Roys Emergency Moderation Team says:

      “the odds are MUCH greater that the extra energy will get transferred to another atom rather than getting re-emitted as an IR photon.”

      Another atom, like nitrogen or oxygen most likely.

      So energy from EMR *does* get “trapped” in the atmosphere. It does not “immediately” get scattered in all directions.”

      Ultimately trapped in the atmosphere by N2/O2, not GHGs, since GHGs can emit more efficiently than N2/O2.

  80. Nate says:

    Jim, you are not comparing any data to a model and showing failure.

    You are showing variability of carbon sinking/sourcing from the ocean. It is well known to be strongly modulated by ENSO, which has been modeled as well.

    • Svante says:

      Chic Bowdrie, another clue for finding your CO2 sources.

      Atmospheric oxygen is going down, so you need to think about combustion. Ocean outgassing does not fit the bill.

      See maps at the end of this paper:
      https://tinyurl.com/yalc2cy6

      • bdgwx says:

        That would eliminate the biosphere too right? O2 is byproduct of photosynthesis.

        We also know that the source must be 14C depleted. That eliminates increased cosmic rays and recent biomass decay.

        We also know that the source must be 13C depleted. That eliminates volcanic gases and rock weathering.

        Another clue on searching for the source…the rate of increased emission minus the rates of increased biosphere and hydrosphere uptake should match the CO2 level trajectory.

        • Svante says:

          It could be some other type of oxidation, e.g natural wild fires increasing, by chance in sync with fossil fuel combustion, while the latter disappears down a hole we haven’t found yet.

          Except the isotope ratio is wrong and “Other processes are tiny enough to be neglected, compared with the processes mentioned above, like the oxidative weathering process (Haynes et al., 2016)”.

      • Jim Ross says:

        One of the first things I do when looking at a new set of data is to investigate relationships with potentially related parameters. Despite the decline in atmospheric O2 being well known, it is rare to see O2/N2 (which is what is actually measured) plotted against CO2. I do not know why this is the case.

        Anyway, this is what the data look like from Scripps O2 program (after removal, by Scripps, of the annual cycle). The gradient can be converted to the molar ratio of O2:CO2 by dividing by 4.8, hence it is 2.2 approx. This compares to 1.1 for photosynthesis and roughly 1.4 for burning fossil fuels (depends on mix).

        https://i.postimg.cc/d37r6Bxg/O2-v-CO2.jpg

        • Svante says:

          Ocean and land sinks take up 55% of the CO2.

          • Jim Ross says:

            Not sure what your point is, but according to the Global Carbon Budget (2019) the overall average of CO2 removed by ocean and land sinks since 1959 has been 55% of total emissions (including land use changes). On an annual basis, it ranges from 18% to 80% due to ENSO and major volcanic eruptions.

          • Svante says:

            The point was that your plot had less than half the total CO2.

          • Jim Ross says:

            Fine, but my focus was on actual data (measurements/observations), rather than estimated quantities. If you wish to bring in estimated quantities as well that is certainly OK with me … I await you graphs showing how the atmosphere and other reservoirs behave with respect to estimated CO2 emissions. I look forward to seeing your graphs and hearing about the actual scientific point that you are trying to make. I am particularly interested in the evidence you can provide regarding the O2/CO2 exchange ratio across the ocean-atmosphere interface.

          • Svante says:

            We have a 4 ppm O2 loss for an atmospheric CO2 increase of 2 ppm, so half of it went elsewhere.

          • Jim Ross says:

            Svante,

            I await your CO2:O2 graph with interest.

          • Svante says:

            No, I like your graph, you just need to divide the CO2 numbers by 0.45 to get a better molar ratio. I can do that in my head.

          • Jim Ross says:

            I can do it in my head too: 2.2*0.45 = 0.99. So what? This would imply that the emissions have an O2:CO2 exchange ratio that is much closer to respiration from the terrestrial biosphere (i.e. 1.1) than a value which would be expected for anthropogenic emissions (i.e. 1.4). This is not how I do science.

            I start with the observations/measurements and find that, in the atmosphere, O2 is dropping at just over twice the rate that CO2 is increasing (my graph of atmospheric O2 versus atmospheric CO2). Then I say “hmm, that’s interesting, I wonder why it’s 2.2 and not some other value”. Then I have to develop a model (hypothesis) that might explain this, while keeping in mind that models are always non-unique.

            Models always start with assumptions. In this case, we can start with two primary assumptions: that the published estimates of anthropogenic emissions are in the ball-park and that the calculated exchange ratio for such emissions (O2:CO2 of 1.4) is also about right. We can then plot the growth in estimated CO2 emissions and, by applying the 1.4 ratio, calculating (not measuring!) the implied decline in O2. In so doing we find that (i) the growth in estimated CO2 emissions is roughly double what we observe in the atmosphere and (ii) the reduction in O2 is roughly 27% more than what is observed in the atmosphere (2*1.4/2.2).

            This is the reason why I did not plot estimated CO2 emissions against actual observed changes in atmospheric O2.

            Obviously, there are models out there which seek to explain the “extra” O2 in the atmosphere.

          • Svante says:

            Ralph Keeling solving the Carbon budget by Oxygene:
            https://tinyurl.com/y8xgdzer

          • Jim Ross says:

            Yes, that is an example of one (rather old) model of the type that I was referring to. However, Keeling did not “solve” the matter. He developed a model which provided a possible explanation of the observations that were available at that time, which was back in 2008. Recall that in 2017 (as I commented earlier), Keeling et al admitted that their model for atmospheric δ13C no longer worked once they had updated it with more recent observations; they then had to revise the model.

            Talking of assumptions, you will have noticed that his key assumption for the model to work was that the oceanic sink removes atmospheric CO2 without significant O2 being released from the oceans in return. I think the phytoplankton might have something to say about that, never mind the cold upwelling waters that are rich in CO2 but low in O2. See Figure 1 here: https://agupubs.onlinelibrary.wiley.com/doi/full/10.1002/2017GB005630. Keeling is a co-author in this 2017 paper. Of particular note is this quote from the abstract: “These findings suggest a substantial and complex response of the oceanic O2 cycle to climate variability that is significantly (>50%) underestimated in magnitude by ocean models.”

            In other words, we do not fully understand what is going on and hence nothing is “solved”.

          • Svante says:

            Thank you for citing science. I look forward to reading that, although the title suggests it’s about short term variability.

            Did you read the “Impact of anthropogenic activities on global land oxygen flux”?

          • Jim Ross says:

            I did read it, but I am afraid that I did not find it very useful other than confirming what I had read elsewhere about the oxidative ratio for different fossil fuels. The value of 1.4 seems to be about right for a global average. There is no evidence from my original graphs that the atmospheric ratio of 2.2 has been changing of late, which is another important factor for potential models.

            Other than that, the authors are focussed on land emissions/fluxes and do not consider the oceans to any degree (just one reference to a small quantity of O2 outgassing as far as I could see). This is not a criticism of the authors, it is just that I am more focussed on global data, as represented by the main observatories, especially as O2 trends are almost identical from Alert to the South Pole. Given this global consistency, inclusion of information from the oceans must be a critical part of any assessment.

          • Svante says:

            Yes, 1.4 is about right, fig. 2 says 1.34 in 2013, but trending down (fig. 2b). Perhaps because of coal increase in China at ratio 1.09 (fig. 1b).

            You mean this ocean reference?

            It is estimated that about 1.4Gt O2 is outgassed from ocean per year during 2000~2010 (Keeling and Manning, 2014), which is very small compared to the magnitude of the other processes we estimated earlier

            You have evidence that Keeling and Manning are wrong?
            In any case it is far from stopping the atmospheric O2 decline.
            In your graph you are losing twice what the atmospheric CO2 increase suggests.

          • Jim Ross says:

            Re “trending down” estimate of Liu et al: my O2:CO2 graph showed that there has been no significant (discernable) change in the observed exchange ratio of incremental atmospheric CO2 versus O2 (1991-2017). This observation must form an input constraint to any model.

            Yes, that is the reference given by Liu et al.

            Keeling and Manning (2014) have a model which, if their assumptions regarding fossil fuel emissions with a fixed exchange ratio of 1.384, oceanic sink size with an exchange ratio of zero, and land sink size with an exchange ratio of 1.1 are all correct (six different estimates), they must invoke an additional small source of O2 in order to obtain a match with observations (i.e., my graph). This is a consequence of their model. It is not evidence.

            I will leave this discussion with the money quote from the Keeling and Manning paper:

            “An important step, as yet unrealized, is to extend the framework for inverse models to provide an optimized description of processes occurring within the ocean, such as photosynthetic carbon uptake in surface waters, export to the ocean interior, and ocean ventilation rates.”

          • Svante says:

            Jim Ross says:
            “I think the phytoplankton might have something to say about that, never mind the cold upwelling waters that are rich in CO2 but low in O2. See Figure 1”.

            The paper you cited says:

            The net balance of these effects on the O2 flux response is dominated by the ventilation effect, so that shallower and weaker upwelling during El Niño leads to anomalous O2 outgassing, whereas deeper and intensified upwelling during La Niña drives anomalous O2 uptake.
            Accounting for most of theAPO flux variability, these O2 flux anomalies are strongly localized along the eastern and central equatorial Pacific and are accompanied by a weaker response of the opposite sign in the western tropical Pacific

            Furthermore, the ENSO cycle is not very interesting long term.

  81. gallopingcamel says:

    Svante says:
    June 20, 2020 at 2:39 AM

    gallopingcamel says:
    human population will eventually hit a limit

    I can see how you might interpret that comment to imagine that I am a Malthusian. This link should convince you that I am a Cornucopian:

    https://diggingintheclay.wordpress.com/2013/06/17/bussard-revisited/

  82. gallopingcamel says:

    @gbaikie

    I have nothing to say on India.

    Here in the USA Trump has just frozen H1, H2, L & J Visas until the end of this year which is a strong statement in favor of our 20 million unemployed.

    Merit based immigration will be a major plank in his manifesto. Will the electorate support that? We will find out in 134 days.

    When it comes to Europe my understanding comes from reading the “Strange Death of Europe”.

    • gbaikie says:

      –gallopingcamel says:
      June 22, 2020 at 10:43 PM
      @gbaikie

      I have nothing to say on India.

      Here in the USA Trump has just frozen H1, H2, L & J Visas until the end of this year which is a strong statement in favor of our 20 million unemployed.–

      Trump expects to get back normal by the end of year. Or in terms of a metric, a +30 K Dow Jones and much lower unemployment.
      But US economy has been sucking for decades, and by end of year will be slightly better than just a continuation of the sucking, and Trump probably wants unfreeze them, and could increase them, in 2021.
      But also probably use it as bargaining chip, he knows helps in terms of economic growth. Or if wants 7% yearly growth, he will have unfreeze the visas, and increase them, but also they are as corrupt as hell, and so also maybe clean them up a bit.

      ” Merit based immigration will be a major plank in his manifesto. Will the electorate support that? We will find out in 134 days.”

      Always has been broad public support.
      And broad public opposition to illegal immigration {dems used to very eager for building the wall- and spent far more to do, then what we spent during Trump term}. In terms immigration, you have big business lobby who want to keep wages low. So, big business lobby wants increase their costs with regulations which hinders competition {Big business only problem is competition} and lower cost added by regulation by keeping costs down on costs employees.

      Of course if increase costs of employees, one looks for more ways of getting labor at lower cost- robotics, and other ways.
      Or do things that Musk does, which is increase productivity of employees, which largely about getting better managers and having CEO actually know where they are going. Musk, some of “where” he is going, appears to Mars {which is quite exciting for the people that are actually making rockets].
      –When it comes to Europe my understanding comes from reading the “Strange Death of Europe”.–
      I have not read the book. I don’t read books much- used to read them a lot more. A favorite book was Diplomacy, by Henry Kissinger.
      Most favorite books I read again and again. Not, Diplomacy as it made laugh too much. I don’t usually laugh a lot reading books.
      It was like the Pink Panther {old movie- not a book}.

      • gallopingcamel says:

        The ruling class is in favor of cheap labor which is why they have “Off-Shored” American jobs for the last 30 years. For many years I facilitated the process by moving jobs from Johnson City, Tennessee to Taiwan; from Fort Edward, New York to Ciudad Rodriguez; from Rome, Georgia to Monterrey and on and on.

        Today I see the folly of all that and regret my contribution to implementing incredibly destructive policies.

        Sadly, Tom Donahue (Business Round Table), the Koch brother, US senators (including Mike Lee and Lindsay Graham), Elon Musk and many many more can’t adjust to the reality of 20+ million unemployed Americans. They are dumb as rocks given they are still pushing more immigration at a time when so many Americans are unemployed.

        Thank God for Donald Trump, the best president since George Washington.

        • Svante says:

          “Arguing against globalization is like arguing against gravity” (Koffi Annan).

          It is driven by comparative advantages and creates a net gain as described by David Ricardo in 1817. Still those Mercantilistic ideas pop up from retards like Trump.

          Great handling of the Covid-19 disaster by him. Very good that he cut the budget deficit vigorously at the top of the business cycle, so there is room for massive stimulus in this downturn. Not.

          Let’s fix the trade problems instead, for example varying cost of CO2 pollution.

          • Chic Bowdrie says:

            Only a pinhead could refer to the President that way while making your other stupid comments from the basement of your mother’s house.

          • Nate says:

            More vacuous trolling from our new DREMT.

          • Chic Bowdrie says:

            More hypocrisy from the King of Obfuscation.

          • Svante says:

            Here’s what some of my pinhead friends think about him:
            – John Bolton says he is “unfit for office”
            – Rex Tillerson said he is a “moron”.
            – Jim Mattis says he has “limited cognitive ability”.
            – John Kelly thinks he is harming the US.
            – Colin Powell says that he lies all the time.
            – Mike Mullen says it’s “impossible to remain silent”.
            – John Allen says “awful for the United States and its democracy”.
            – William McRaven says his “leadership was putting the nation at risk”.

          • Chic Bowdrie says:

            The swamp is filled with jealous wannabes and sore losers.

          • Svante says:

            Yes, and people without the moral compass to speak out.

            It’s unfortunate for the Republican Party, the US, the Western World and the World as a whole.

          • Chic Bowdrie says:

            Moral compass. That’s rich. What does your moral compass say about looting and burning buildings in response to normally justified police actions, the murder of George Floyd being a recent exception? Ask the moral compass how removing a statue of Columbus, Washington, or Churchill will have any effect whatsoever on racial bias? Wait a second, make that how will it have any other effect than to exacerbate racial bias?

          • Svante says:

            My moral compass can’t stand destruction, including statues.
            I feel revulsion when I see looting.

            The death of George Floyd was just tragic incompetence.
            It’s not the first time, pressure on chest and neck kills.
            Every policeman should know that, I feel sorry for them.

          • Svante says:

            So my moral compass makes me a conservative, and Chic Bowdrie is a leftist that wants to turn Washington and global climate on its head.

        • gbaikie says:

          I thank the media for Trump.
          I thank Bill Maher for his focus on Political Incorrect.

          Trump is Political Incorrect.
          And Trump is the Destructor summoned by the Media “black magic”.
          To win against Trump, one needs machines which can destroy Space-Time- remember, don’t cross the streams.

          As Trumps suggests, it’s high energy vs low energy.

          But yeah, thank God for Trump.

          The Lord giveth, and the Lord taketh away.

          One can hope, God continues to give.

          • gbaikie says:

            I will say, “Lo and behold, the wicked shall remove their own statues”.

            [God always seems jealous}

            Evidence for God?

            C’mon, what proof do you need?

            Maybe:
            “Behold, children are a heritage from the Lord, the fruit of the womb a reward. Like arrows in the hand of a warrior are the children of one’s youth.”

            But it seems to me, the crazies are inspired.

            Here is something:
            “Follow the way of love and eagerly desire spiritual gifts, especially the gift of prophecy. For anyone who speaks in a tongue does not speak to men but to God. … He who prophesies is greater than one who speaks in tongues,”…

            And we seem to be having a lot speaking in tongues lately, and the rolling on floor- and etc.

        • Nate says:

          “Ask the moral compass how removing a statue of Columbus, Washington, or Churchill?”

          Not so much.

          But I think you forgot all the Confederate Generals statues, and Confederate Symbols.

          Most of these were erected decades after the Civil War when the KKK and its policies were at their peak in the South.

          Same goes for the Military bases named after Confederate Generals who fought against the US Army (Weird!), that DT refuses to consider changing.

          DT clearly aims to please racists.

      • Nate says:

        GC,

        A truly free market is one where production is done by those who can do it cheapest. Materials and products are provided by those who can do it most cheaply.

        Thus, traditionally right-wingers who support a free-market economy are very much for free trade.

        It has been left-wingers like Bernie Sanders who want the government to regulate and limit free-trade.

        So I guess you are a left-winger??

  83. gallopingcamel says:

    @Chic Bowdrie.

    I am much impressed by your efforts. I have some information that I would like you to look at “Off Line”.

    My phone number can be found here:
    https://www.bdidatalynk.com/instructor/peter-morcombe

  84. Rafael Molina Navas, Madrid says:

    AND GLOBAL WARMING IS BEING EVEN LESS AFFECTED:
    An 18C (!!) warming “anomaly” :
    “Temperatures in the Arctic Circle are likely to have hit an all-time record on Saturday, reaching a scorching 38C (100F) in Verkhoyansk, a Siberian town.
    The record still needs to be verified, but it appears to have been 18C (!!!) higher than the average maximum daily temperature in June”.
    https://www.bbc.com/news/science-environment-53140069?intlink_from_url=https://www.bbc.com/news/science_and_environment&link_location=live-reporting-story
    More meaningful is data regarding not one-day local temperature, but monthly (over recent May) averages at North and South Poles:
    “It was the warmest May on record globally with the biggest temperature anomalies at the North and South Poles” (up to +10C !!)
    https://www.bbc.com/weather/features/53109882?intlink_from_url=https://www.bbc.com/news/science_and_environment&link_location=live-reporting-map
    Im afraid “armagedon” is not that far away … Especially if arctic permafrost accelerates thawing, due to those really high temperature increases !!

  85. Chic Bowdrie says:

    The hypocrisy of King Nate knows no bounds.

  86. Dan Pangburn says:

    When you understand the graph at https://drive.google.com/open?id=1k9OpSeNkiavyKjxzgU22i33m_QHNiUt3 you should understand why more CO2 is making it warmer at the poles but more water vapor is making it warmer elsewhere. GCMs assume Global average WV in increasing from just planet warming. Measured global average WV is increasing significantly faster than that because of the added WV from irrigation and other human activity.

  87. Dan Pangburn says:

    Brendan at https://www.drroyspencer.com/2020/06/covid-19-global-economic-downturn-not-affecting-co2-rise-may-2020-update/#comment-490139 above states the relaxation time for molecule rotational excitation is “…just a couple of nanoseconds”. I have found no reference to either confirm or deny this assertion. If true, the ‘notch’ centered on CO2 in graphs of TOA radiation flux mandates that a different mechanism must exist (from that previously described by me which assumed much of the energy absorbed by CO2, especially below the tropopause, was redirected to WV molecules by gas phase thermal conduction, i.e. thermalization) for redirecting energy absorbed in the wavenumber range 600 to 750/cm to WV at wn range (highest probability) 400 to 600/cm for radiation to space.

    The broad absorb/emit spectrum of water vapor makes it unique among ghg at earth temperatures in that a WV molecule can emit at a substantially different wavenumber than it absorbed at. The spectrum in the wn range of interest for water vapor and CO2 generated by Hitran is shown at https://drive.google.com/file/d/1hnJg9TH4mIc5WQSErSrHJK3aigQwSIPB/view?usp=sharing with intensities shown on a log scale. The relative intensities indicate probability of wavenumber for emission. Energy absorbed by WV in the range wn 600 to 750/cm is continuously extracted from the wn range of CO2 and radiated to space producing the ‘notch’.

    The “circuitous pinball journey” and multiple absorb/emits described by Brendan explain the increased warming of the atmosphere and the increased greenhouse effect with more WV in spite of short but finite relaxation time/impact. End result of the two described mechanisms is the same.

    The concept of back radiation is misleading and is not the way engineering heat transfer calculations are done. Valid results are obtained by subtracting the radiation from the colder surface from the radiation from the warmer surface. The difference is the net flow of energy between the two surfaces.

  88. Chic Bowdrie says:

    Dan,

    Your reference to thermalization as synonymous with “gas phase thermal conduction” surprises me. Your website describes it closer to my understanding. Thermalization occurs when radiation is absorbed by CO2 molecules and the energy is transferred to O2/N2 by collision before the molecules have time to emit. This occurs because of the high density of air molecules near the surface. The opposite is true in the thin air of the tropopause. There CO2 molecules are more likely to emit before a collision. The same for water molecules except that they don’t populate the tropopause in any substantial amount. I imagine gas phase thermal conduction to occur between layers of molecules in a temperature gradient which is a less efficient way to transfer energy compared to thermalization and convection.

    I also challenge the simplistic and unproven view that the pin ball process warms the atmosphere directly. The main effect of the atmosphere is to cool during the day and warm during the night. Lessening temperature extremes produces a slight warming effect.

    • gallopingcamel says:

      At pressures of less than 0.1 bar radiation is the dominant heat transfer mechanism in the atmospheres of all the planets for which we have measured data.

      Likewise convection and phase change dominate when the pressure exceeds 0.1 bar. What “Chick Bowdrie” is saying is in accord with “First Principles” physics.

      When the pressure is high excited molecules (CO2, H20 or whatever) don’t have time to radiate. Within nano-seconds they collide with other molecules and transfer kinetic energy.

    • bdgwx says:

      All of Earth’s heat loss is the result of radiation. Earth loses nothing from convection or conduction. If you add a thermal barrier that is inert (mostly) to incoming radiation and active (mostly) to outgoing radiation it will always perturb the energy balance such that it is positive/negative below/above the barrier. The result will be warming below the barrier and cooling above the barrier until a new equilibrium is established. Adding more of the thermal barrier material will always increase its effectiveness but not necessarily linearly. For CO2 the relationship between concentration and radiative forcing is approximated by 5.35*ln(C/C0).

      Be mindful of UAH’s TLT minus TLS trend of +0.42C/decade and the +0.6 W/m^2 surface energy imbalance. The Earth is accumulating energy and doing so via the increased effectiveness of a thermal barrier in the atmosphere.

      • Dr Roys Emergency Moderation Team says:

        Total OLR has increased.

        • bdgwx says:

          Yes. It has. It is an observation predicted by most climate models.

          • Dr Roys Emergency Moderation Team says:

            Of course. Like you said, adding a “thermal barrier” will reduce the outgoing radiation, leading to an energy imbalance, and thus global warming. But, at the same time, what is actually expected is an increase in the outgoing radiation. It’s the good ol’ increase and decrease at the same time. We expect a reduction in outgoing radiation, which is manifested in the form of an increase in outgoing radiation.

            The models say A-OK. Just roll with it, and don’t over-think it.

          • bdgwx says:

            It’s the longwave cloud feedback effect. There’s more ASR and OLR overall. CO2 is active mostly in the so called atmospheric window. OLR is a broad spectrum concept. The closing of the atmospheric windows creates the imbalance. This imbalance has consequences. One consequence is the cloud feedback effect. There is more broad spectrum ASR and OLR as a result. But it was the imbalance catalyzed by CO2 and other GHGs that resulted in the higher broad spectrum ASR and OLR fluxes.

            BTW…I said “most” climate models predict this feedback. Here is a writeup of one such model (ESM2M) that is an outlier in this regard. It is interesting to note that ESM2M’s handling of the cloud feedback may explain the majority of its lower transient climate sensitivity compared to other models. And since we have observational evidence suggesting OLR is increasing this means it would be reasonable to eliminate ESM2M from consideration or at least under weight it some.

            https://www.gfdl.noaa.gov/blog_held/46-how-can-outgoing-longwave-increase-as-co2-increases/

          • Dr Roys Emergency Moderation Team says:

            Naturally. CO2 reduces the OLR in certain bands only, which has the effect of reducing the total OLR, so that there is an imbalance. This reduction in total OLR is manifested in the form of an increase in total OLR. It’s called the reducto-increase effect.

          • bdgwx says:

            Something I just thought off…CO2 has a narrow spectrum effect. H2O has a broad spectrum effect. I wonder if the increasing OLR observation may cause problems with Dan Pangburn’s hypothesis. Dan’s hypothesis is that it is the increased H2O loading from irrigation that is causing the warming. But since H2O has a broad spectrum effect I’m thinking an increasing OLR would falsify it…maybe. It depends on what he thinks the cloud feedback would be. Would more ASR and OLR overall be expected with a high H2O sensitivity and low CO2 sensitivity? I don’t know. Dan can you comment?

          • Dr Roys Emergency Moderation Team says:

            What about the obvious challenge of the increasing OLR observation to the enhanced GHE sub-conjecture?

          • Dan Pangburn says:

            bdg,
            Only about 65% of the warming 1909 to 2019 has been due to WV increase, so OLR could be increased by the rest.

          • bdgwx says:

            What about the obvious challenge of the increasing OLR observation to the enhanced GHE sub-conjecture?

            What about it? Like I said it is expected result. The cloud feedback works to increase both OLR and ASR. The net flux from this feedback remains unchanged (with a caveat that is open for discussion). Remember…CO2 creates the initial energy imbalance by closing off part of the atmospheric window in a narrow channel. The warming that occurs has consequences. One consequence is a change in clouds that raise broad spectrum ASR and OLR in tandem (again with caveat noted). The fact that OLR is increasing is consistent with the CMIP5 model suite overall.

          • Dr Roys Emergency Moderation Team says:

            Obviously. CO2 reduces the OLR in certain bands only, which has the effect of reducing the total OLR, so that there is an imbalance. This reduction in total OLR is manifested in the form of an increase in total OLR. Its called the reducto-increase effect.

          • bdgwx says:

            DREMT said: This reduction in total OLR is manifested in the form of an increase in total OLR.

            That doesn’t make any sense. And it’s certainly not what I said.

          • Dr Roys Emergency Moderation Team says:

            Short sentences. Obnoxious.

          • Svante says:

            OLR has been playing catch-up for two hundred years.

          • Dr Roys Emergency Moderation Team says:

            So how come it tracks with temperatures?

          • bdgwx says:

            That’s a good question. Why does Earth’s surface temperature track linearly? Why is it not exponential with T^4?

            Based on what I’ve read this may be due to the water vapor feedbacks. There’s also tangential topics concerning Earth’s resistance to activating a runaway greenhouse. However, a moist greenhouse cannot be eliminated. Anyway these topics depend on the details of the relationship between T and OLR.

          • ClintR says:

            Svante and bdgwx constantly display their ignorance of the physics.

            Svante tosses out: “OLR has been playing catch-up for two hundred years.”

            Yet Svante has no clue what OLR looked like 200 years ago.

            And bdgwx offers his/her usual blah-blah.

          • Nate says:

            AFAIK, the long term change in OLR has been ~ 0 within error.

            Anyone got data showing otherwise?

            As far as ASR, there is also the ice-albedo feedback going on in the Arctic.

            IE reduced land and sea ice means lower albedo and greater ASR.

          • Dr Roys Emergency Moderation Team says:

            No, bdgwx. What I meant was:

            https://res.mdpi.com/d_attachment/remotesensing/remotesensing-10-01539/article_deploy/remotesensing-10-01539.pdf

            “The OLR has been rising since 1985, and correlates well with the rising global temperature.”

            Where is Svante’s 200-year lag in OLR?

          • bdgwx says:

            I knew what you meant. I was just asking why it doesn’t seem to be proportional to T^4. In the link you cited there was about a 2 W/m^2 increase. But using the SB law you’d expect about 2x that amount. I don’t have the expertise to be able to answer that. It was something I was pondering.

          • Dr Roys Emergency Moderation Team says:

            You are also known to obfuscate wherever possible, so there is that, too.

      • Chic Bowdrie says:

        “Earth loses nothing from convection or conduction.”

        That reminds of the Little Red Hen Story. https://www.youtube.com/watch?v=JTCsL26vob4

        CO2 asks the atmosphere, “Who will help me get the energy from the surface out to space?”

        “Not I,” said convection.

        “Not I,” said conduction.

        Unfortunately, in real life CO2 can’t do it by itself.

        “If you add a thermal barrier….”

        Let me stop you right there. The atmosphere has always had a level of CO2, but there is no proof that “adding more of the thermal barrier material will always increase its effectiveness.” That is your challenge. How do you know the non-linear response is not already maxed out.

        “The result will be warming below the barrier and cooling above the barrier until a new equilibrium is established.”

        I’m not aware that lapse rates have changed. Is there data showing that any new equilibrium has been established?

        • bdgwx says:

          I didn’t think this was controversial. It’s broadly accepted that the atmosphere is mostly confined to Earth. That means there is no convection to space. There’s also very little material in space for heat to conduct towards. I think everyone agrees that all heat transfer from the Earth to space is via radiation. Don’t hear what I’m not saying. I’m not saying that convection and conduction are not at work inside the atmosphere. They certainly are. But they are not at work from the interface between the atmosphere and space at least not in any meaningful way.

          I already gave you references for the evidence that CO2’s radiative force is not saturated or maxed out yet. You said that I was hand waving remember? I’m sorry there’s so much evidence that it would take a lifetime to review. I can’t help that. Maybe take that as a testament to just how much we know about CO2’s radiative force.

          The UAH TLT minus TLS trend is +0.42C/decade. This matches RSS’s value of +0.43C/decade. The stratosphere is cooling and the troposphere is warming.

          • Chic Bowdrie says:

            “That means there is no convection to space.”

            I never said that. Don’t hear what I’m not saying. Without convection moving energy up, there would be little energy for CO2 to radiate away.

            “I already gave you references for the evidence that CO2s radiative force is not saturated or maxed out yet.”

            Where? Just saying “there’s so much evidence” doesn’t cut it.

            “The stratosphere is cooling and the troposphere is warming.”

            And if the atmosphere was a solid with constant conductivity, that would explain why OLR is increasing. But the atmosphere is not a solid and the surface is being warmed by increasing ASR. CO2 is simply trying to cool it off.

          • bdgwx says:

            So your hypothesis is that more CO2 cools the surface and warms upper atmosphere?

          • Chic Bowdrie says:

            You are half right. CO2 also cools the upper atmosphere. How could it not? It is the only major emitter above the point where water vapor condenses.

          • Svante says:

            Chic Bowdrie says:
            “surface is being warmed by increasing ASR”.

            The stratosphere would not be cooling then.

          • bdgwx says:

            How could it not?

            Because it is mostly transparent to incoming SW radiation. And it is mostly opaque to a portion of the atmospheric window. 15um photons that would have otherwise had a free escape path to space now get partially captured. These captured photons either thermalize directly or get reemitted with ~50% of them having downward trajectories. In other words, less photons in this channel escape to space.

            It is the only major emitter above the point where water vapor condenses.

            Ok, but they absorb too. Don’t forget that. Most of Earth’s heat shed occurs from the warmer radiators down lower. If you impede the transmission of this radiation by thermalization or by redirecting it back toward where it came then the heat shed is reduced.

            At any rate if your hypothesis is that CO2 pulls heat off the surface and carrying to the upper atmosphere where it is then shed then you’ll need to reconcile the observation of warming at the surface and cooling at the stratosphere.

          • Dr Roys Emergency Moderation Team says:

            Surface is being warmed by increasing ASR, stratosphere cooled by ozone depletion.

          • Chic Bowdrie says:

            b,

            You are correct that CO2 is mostly transparent to SW, but not totally. Anyway that is a non sequitur and a discussion for another day.

            Photons captured by CO2 in the upper atmosphere are less likely to be thermalized the higher up in the atmosphere they go. They will quickly emit and have no effect on the upper atmosphere temperature. The half that traject downward will soon be intercepted by other CO2 molecules with essentially a negligible number reaching the surface. A photon absorbed at any lower elevation that is not re-emitted will collide with other bulk air molecules and contribute to expanding and rising daytime air or to inhibiting the cooling air at night. Meanwhile the energy flux is upward primarily due to convection. The presence of more CO2 molecules in the upper atmosphere increases the likelihood of a collision transferring enough energy from a bulk air molecule to excite a CO2 which would subsequently emit that energy. That means more photons escaping to space. BTW, a spectrum does not see this movement of energy.

            It seems you are using the term “heat shed” as both a noun and a verb. Other than what goes through the atmospheric window directly to space, all of the surface radiation is captured in the “heat shed” of the troposphere and almost the entirety is captured near the surface. This is confused with saturation and I may have contributed to that confusion earlier. Hopefully we can clear that up now.

            Here is the way the atmosphere works. The sun warms the surface. The surface radiates IR. CO2 and H2O captures the radiation and transfers the energy to the bulk air. It rises and is replaced by cooler air from above which is a surface-cooling process. Meanwhile above, the thermalization process is reversed due to the thinness of the air and emissions now dominate over collisions. The totality of emissions are no longer intercepted in a relatively short distance and thermalized. Gradually more and more emissions are going directly to space as the altitude increases.

            No need to reconcile anything. As DREMT notes, stratosphere cooling my be mostly ozone depletion. The CO2 concentration there is diminished compared to the tropopause and upper troposphere where the main “shedding” occurs.

          • bdgwx says:

            So adding more CO2 allows more 15 um photons to escape to space?

            What about H2O? Does more H2O allow more broad spectrum photons to escape to space?

            The correlation between stratospheric ozone, troposphere warming, and stratosphere cooling does not look very strong to me.

          • Chic Bowdrie says:

            Where are you going with this line of questioning? The atmosphere doesn’t work like a blanket where you can calculate a flux from its conductivity and temperature gradient.

          • Svante says:

            Dr Roys Emergency Moderation Team says:
            “stratosphere cooled by ozone depletion”.

            Wikipedia says:

            The [ozone] ban came into effect in 1989. Ozone levels stabilized by the mid-1990s and began to recover in the 2000s […] and the ozone hole is expected to reach pre-1980 levels by around 2075.

            The Montreal Protocol is considered the most successful international environmental agreement to date.

          • Dr Roys Emergency Moderation Team says:

            Just Google “stratosphere cooled by ozone depletion”, Svante.

          • Svante says:

            DREMT, now I googled it. The sources say:
            1) Ozone warms the stratosphere.
            2) The ozone layer is recovering since the start of the new millenium.

            So how can that cool the stratosphere?

            Perhaps a more specific link will help.
            Bear in mind google tries to give people what they want, so I got no blogs, only NASA and University science.

          • Svante says:

            I read that one.

            It says:
            “scientists are predicting the stratospheric ozone layer will recover to 1980 ozone levels by the year 2050”.

            and:
            “Ozone generates heat in the stratosphere”.

            So how can that explain stratospheric cooling?
            Put the two together and you get the opposite effect.

          • ClintR says:

            Svante, you need to learn how ozone in the stratosphere is formed.

            Oops, I forgot you can’t learn.

            Never mind.

          • bdgwx says:

            I don’t see what difference the mechanism by which ozone concentration is modulated has. An increase/decrease creates a warming/cooling tendency all the same.

            I am glad to see that there doesn’t seem to be any challenges to ozone’s capacity to produce these warming/cooling tendencies in the atmosphere.

          • Svante says:

            bdgwx says:
            “I am glad to see that there doesn’t seem to be any challenges to ozone’s capacity to produce these warming/cooling tendencies in the atmosphere.”

            And like CO2 in accordance with radiative physics.

          • Dr Roys Emergency Moderation Team says:

            Quite unlike CO2, of course.

          • bdgwx says:

            O3 is most active in the SW band whereas CO2 is most active in the IR band. They both impede the transmission of radiation just in different parts of the EM spectrum.

          • Dr Roys Emergency Moderation Team says:

            Ozone absorbs SW and warms. There is no “impeding” going on.

          • Svante says:

            So how can you say more ozone cools the stratosphere?

          • Dr Roys Emergency Moderation Team says:

            I thought I was quite clear in saying that less ozone cools the stratosphere. “Ozone depletion” being the key phrase.

            Can you find a more up-to-date version of this graph?

            https://www.giss.nasa.gov/research/features/200402_tango/ozone_temperature_graph.gif

            Maybe that will help…

          • bdgwx says:

            Ozone absorbs SW and warms. There is no impeding going on.

            How can ozone absorb radiation, warm from it, and then continue to allow it to pass through unimpeded?

          • Dr Roys Emergency Moderation Team says:

            bdgwx, the GHE is not supposed to be, “CO2 absorbs LWIR and warms”.

          • bdgwx says:

            Both O3 and CO2 absorb radiation and then either thermalizes it or reemit it. They just do so in a different part of the EM spectrum. Either way radiation that would have otherwise had a free path is now impeded by the presence of O3 or CO2…again…in the channels in which those molecules are active.

          • Dr Roys Emergency Moderation Team says:

            Agree to disagree.

        • Nate says:

          “Here is the way the atmosphere works. The sun warms the surface. The surface radiates IR. CO2 and H2O captures the radiation and transfers the energy to the bulk air. It rises and is replaced by cooler air from above which is a surface-cooling process. Meanwhile above, the thermalization process is reversed due to the thinness of the air and emissions now dominate over collisions. The totality of emissions are no longer intercepted in a relatively short distance and thermalized. Gradually more and more emissions are going directly to space as the altitude increases.”

          I dont have a problem with this paragraph, because it is explanatory, and I am not Chic.

          If I Chic, I would of course have to label this paragraph OBFUSCATION. I would have to ask ‘where are the data, models numbers, equations?’

          Now let me add my own explanatory words to yours.

          ‘The totality of emissions are no longer intercepted in a relatively short distance and thermalized. Gradually more and more emissions are going directly to space as the altitude increases.’

          Now add more CO2. You should be able to see is that the emissions to space will now be intercepted until a higher altitude is reached than before. This is why the altitude of last emissions to space, is higher, and the temperature lower, therefore the outgoing emissions are REDUCED. This is the essence of the enhanced GHE at work.

          • Chic Bowrie says:

            “You should be able to see is that the emissions to space will now be intercepted until a higher altitude is reached than before.”

            Yes, according to IPCC dogma, you should. Now all you need to do is find evidence that is happening. Do you have data showing a reduction in OLR? Any measurements of higher altitudes and lower temperatures?

          • Nate says:

            At least you now seem to understand the mechanism.

            It does not need to be decreasing, since rising atm temperature will make it increase. The GHE should make it increase slower than the temperature.

            Theory says that in the long run, when balance between OLR and ASR is achieved there should be a small increase in OLR since there will be a small increase in ASR in atm and due to reduced ice albedo.

            In the short term, theory says OLR should be less than ASR.

            That is clearly the case, as measured by the non-stop increase in global ocean heat content.

            https://tinyurl.com/mftkor6

          • Chic Bowdrie says:

            Nate, the King of Obfuscation, makes things clear as mud. Theory says shoulda, woulda, coulda.

            No REDUCED emissions, no balance measurements, no data, no models. Nothing but hand-waving and speculation in either the short term or the long run. Mostly obfuscation with an inkling of truth by coincidence.

            https://okulaer.wordpress.com/2018/06/

            “I was only very recently made aware of the existence of this paper, by a commenter on Dr. Roy Spencers blog, Nate, when he was kind enough to notify me (albeit in an ever so slightly hostile manner).”

            https://okulaer.wordpress.com/2018/03/24/the-data-sun-not-man-is-what-caused-and-causes-global-warming/

            “‘Global warming’ since 1977 was NOT (!!) caused by human CO2 emissions. It was caused by the Sun.”

          • Nate says:

            Again, I dont see a rebttal here, just more lame attacks on the messenger.

            You really really should stop getting your science ‘facts’ from bloggers and start reading published, peer reviewed papers, like the one I pointed out to him!

            Among many problems w this blogger is his work completely lacks error analysis. His work cannot get thru peer review. And he disagrees with publicstions by people who collected the data.

          • Nate says:

            “the King of Obfuscation, makes things clear as mud. Theory says shoulda, woulda, coulda.”

            This simply makes clear that you still dont understand what the basic theory is, nor its basic predictions. Yet you are sure its wrong.

            Classic denialism.

          • Nate says:

            No interest in debating with a blog.

          • Chic Bowdrie says:

            Nate @ June 28 4:22 PM

            “Again, I dont see a rebttal here….”

            There was nothing noteworthy to rebut. I provided the link to Kristian’s post to make you aware of my awareness of your IPCC dogma and theory this, theory that. If you don’t like the way he explains enhanced GHE theory, rebut it or provide an alternative explanation.

            Kristian provided data showing that OLR increase only comes after the ASR increase, not before. You get to the same conclusion (OLR should be less than ASR) as Kristian, but you didn’t use data to back it up. You didn’t even reference the source of your theory. You are entitled to your opinion that Kristian is wrong, but I take Kristian’s opinion over yours. All you have is hand-waving and speculation.

            “His work cannot get thru peer review.And he disagrees with publicstions by people who collected the data.”

            You reviewed it, yes? What were your problems with his analysis? Disagreement is how science advances.

          • Svante says:

            Chic, that’s good progress from your vintage 1900 saturation argument.

            Kristian has the only interesting science based non-AGW argument I’ve seen here. It made us argue “uncertainties” which is the opposite of the norm.

            Still, he also said we had to prove that increased back radiation caused warming, which is rather weird.

            Saying radiation sneaks out when you’re not looking is also rather bizarre, since atmospheric radiative transfer codes work every time you check. Like so:
            http://climatemodels.uchicago.edu/modtran/

          • Chic Bowdrie says:

            Svante,

            I’m curious what my vintage 1900 saturation argument is. Also not sure why asking for proof of back-radiation-caused warming is weird. That’s what I’m asking for, too. Theories are not proof.

            Although your link doesn’t show it, those models do a good job of reproducing the actual radiation as measured from a specific location above the surface. They model how much CO2 and other IR absorbing gases emit from a specific location and time, not everywhere at every time.

            Need any more help with the bizarre and sneaky radiation? Just ask. Dr. Deferhoodler is in.

          • Nate says:

            “You get to the same conclusion (OLR should be less than ASR) as Kristian, but you didn’t use data to back it up.”

            Beg to differ:

            “That is clearly the case, as measured by the non-stop increase in global ocean heat content.

            https://tinyurl.com/mftkor6

            Let me point out that attempts to measure the tiny difference between ASR and OLR using direct measurement of these quantities show that it is impossible with the current systematic error on these measurements.

            They cannot determine the TOTAL Earth OLR or ASR to within 1 W/m^2.

            But the global ocean heat content (OHC) rise CAN determine that the difference is ~ 0.7 W/m^2.

            Thus publications simply use the global OHC measurements to CALIBRATE their data.

            Understanding error on measurements matters, but our blogger friend doesnt.

          • Nate says:

            “You are entitled to your opinion that Kristian is wrong, but I take Kristians opinion over yours.”

            Real skeptics wouldnt ‘take’ either one. Go read the source papers.

          • bdgwx says:

            Chic said: Also not sure why asking for proof of back-radiation-caused warming is weird. Thats what Im asking for, too. Theories are not proof.

            Radiation carries energy. When the net exchange of energy moves from A to B and all other things remain equal A cools and B warms until a new equilibrium is established. This result is the manifestation of the thermodynamic laws.

            We think your challenge is weird because the thermodynamic laws of nature are firmly established. No deviation from these laws has ever been observed. If you cannot be convinced of even the most sacrosanct thermodynamic principals then we will never be able to convince you of anything.

          • Chic Bowdrie says:

            King Nate dives down another rabbit hole of obfuscation using ocean heat content in a failure to show how his conclusion (OLR should be less than ASR) differs from Kristian. Does obfuscating with error analysis to imply that OLR is not less than ASR do anything to support Nate’s claim? “In the short term, theory says OLR should be less than ASR.”

            ASR being greater than OLR explains why ocean heat content is increasing. Where is King Nate’s statistically significant data showing that CO2 radiative forcing makes ASR greater than OLR and/or increases ocean heat content?

            Nate says, “No interest in debating with a blog.” and “Go read the source papers.”

            Did you publish one for us to debate?

            No data, no models, no source papers, nothing but hand-waving and speculation.

            This movie is getting old.

          • Chic Bowdrie says:

            Queen b dives in after King Nate in a blog-addicted attempt at defending his incestuous Bobbsey Twin.

            What sacrosanct thermodynamic principles are violated by asking you to supply data showing back radiation from increasing CO2 causes warming of global temperatures?

          • bdgwx says:

            It’s deduction. It is sufficient to show that since an increase in CO2 returns more of the radiation back to the sender then the sender’s temperature will be modulated by that change in CO2 per the thermodyanmic laws.

          • bdgwx says:

            Chic said: ASR being greater than OLR explains why ocean heat content is increasing.

            Not exactly. ASR is absorbed solar radiation. OLR is outgoing longwave radiation. Earth’s Energy Imbalance isn’t EEI = ASR-OLR. It’s actually EEI = IN – OUT where IN = ASR + DWIR and where DWIR is downwelling infrared radation and where OUT = all radiation bands.

            CO2 is active in the 15 um channel. Adding CO2 increases IN because DWIR increases at 15 um and it decreases OUT because OLR decreases at 15 um. This is what makes the initial imbalance. This imbalance leads to warming which has further consequences. One consequence is the cloud feedback. The cloud feedback increases both ASR and OLR because more SW radiation is allowed and more LW radiation is allowed out. But these changes are in a manner such that dASR – dOLR = 0 (with a caveat that we can discuss later). The initial imbalanced caused by the increase in CO2 remains the same.

            Chic said: Where is King Nates statistically significant data showing that CO2 radiative forcing makes ASR greater than OLR and/or increases ocean heat content?

            CO2 makes IN greater. Remember IN = ASR+DWIR. And it makes OUT lower. Remember OUT = all radiation bands.

            Again…there is a complex feedback occurring with clouds and that modulates ASR and OLR. Understand the state of the system assuming there is no cloud feedback first. Understand how the EEI changes and why warming must occur. Once the trivial case is understood then we can talk about how the cloud feedback modulates ASR and OLR. And after the dASR – dOLR = 0 case is understood then we’ll move on to the case where the cloud feedback might have a non-zero radiative force as well.

          • Nate says:

            “No data, no models, no source papers, nothing but hand-waving and speculation.”

            Lots of falsehoods here.

            Data: obviously yes. See OHC data, dimwit.

            Speculation: No. Just data and basic thermo!

            Hand waving: No just explaining basic theory and results in words.

            Ever heard of that? You apply a different standard as to what is OK in your own posts than to others. Straight from the troll handbook!

            No source papers: Sure. On this occasion. They are easily found. No evidence that me tracking them down makes any difference to you in the end.

            Use some critical thinking skills, my friend.

            Before blindly accepting agenda-filtered blog science, go get yourself informed from the sources!

          • Nate says:

            ” Its actually EEI = IN OUT where IN = ASR + DWIR and where DWIR is downwelling infrared radation and where OUT = all radiation bands.”

            Not my understanding of EEI, BDGWX.

            “The energy radiated by the Earth toward space does not compensate the incoming radiation from the Sun leading to a small positive energy imbalance at the top of the atmosphere (0.41 Wm2).”

            REVIEW ARTICLE
            Front. Mar. Sci., 20 August 2019 | https://doi.org/10.3389/fmars.2019.00432

          • Nate says:

            Chic could also learn a lot from this paper.

            “EEI can be directly measured by estimating the global budget of incoming and outgoing radiation at TOA. The current implementation of this method with the Clouds and the Earths Radiant Energy System (CERES) instruments allows accurate determination of the time variations of EEI (with an uncertainty of 0.17 Wm2 at monthly time scales, Loeb et al., 2018a). But the accuracy on the absolute global mean value of EEI is limited within 4 Wm2 mainly due to instrument calibration uncertainty (Loeb et al., 2018a). ”

            and

            “EEI can be estimated by an inventory of heat content changes in the different reservoirs. Among all reservoirs, the ocean concentrates the vast majority of energy uptake (∼93%) associated with EEI (Trenberth and Fasullo, 2016). For this reason the global Ocean Heat Content (OHC) places a strong constraint on the absolute magnitude of EEI and its uncertainty.”

          • bdgwx says:

            Good point Nate. I was thinking of the surface perspective. But technically EEI is from a TOA perspective. There obviously would not be any DWIR at TOA.

          • Chic Bowdrie says:

            Aha, the King and Queen returned from the rabbit hole. Did you see Alice? You must have been smoking something with the caterpillar, but you seem to have come out alright.

          • bdgwx says:

            Oh I definitely messed that up. Don’t let it be said that I don’t admit my mistakes.

            But my point remains the same. CO2 (and other GHGs) increase DWIR at the surface. All other things being equal the surface accumulates energy and warms.

          • Chic Bowdrie says:

            Acknowledged and appreciated.

            Still, you are in never-never land, my friend. Dream on. May the forcings be with you.

      • ClintR says:

        bdgwx says: “For CO2 the relationship between concentration and radiative forcing is approximated by 5.35*ln(C/C0).”

        That equation is not found in any credible physics book. It is from Arrhenius. It is not science. That’s what leads bdgwx to believe other false ideas like: “The Earth is accumulating energy and doing so via the increased effectiveness of a thermal barrier in the atmosphere.”

        Beliefs are not science.

        • bdgwx says:

          Actually…no. It does not come from Arrhenius. It is an Arrhenius-like model since it is a simple logarithmic approximation but it didn’t actually come from Arrhenius himself. It comes from Myhre et al. 1998. Myhre explains that this approximation is in good agreement with the far more complex NBM and BBM radiative transfer schemes.

          https://agupubs.onlinelibrary.wiley.com/doi/pdf/10.1029/98GL01908

          • ClintR says:

            Wrong again, bdgwx. The “simple logarithmic approximation” came from Arrhenius. There have been numerous attempts to change the “constant”.

            Constanly changing the “constant” should indicate the equaion is invalid.

          • bdgwx says:

            The logarithmic approximation came from Arrhenius. That’s why I described it as Arrhenius-like. But his approach dealt directly with temperature. The 5.35*ln(C/C0) model deals with radiative forcing and leaves the sensitivity in units of C per W/m^2 as a separate challenge. Changing constants does not mean a model is wrong. It just means that as new information is added to the knowledge base we can get more accurate estimations of the true value. Also understand that this model is simple. It’s meant to be a back-of-the-envelope style model for quick estimations. There are obviously more complex models like the NBM and BBM schemes that Myhre discusses in his paper.

          • ClintR says:

            Wrong again, bdgwx.

            Arrhenius’ equation dealt with “radiative forcing”, not temperature.

            You don’t understand your own false religion.

            And if they have to keep changing “constants”, it means the equation is seriously flawed. But, it supports your false religion, so you MUST believe in it.

          • bdgwx says:

            Perhaps you could point out where the 5.35*ln(C/C0) equation and his estimate of C per W/m^2 is in his paper?

            https://www.rsc.org/images/Arrhenius1896_tcm18-173546.pdf

            The gravitational constant has been refined over the years. Does that mean GR field equation is seriously flawed? The constant c has been refined over the years. Does that mean all equations that reference it are seriously flawed?

          • ClintR says:

            See what you do, bdgwx? You always slink away from the issue. Here’s the issue:

            https://www.drroyspencer.com/2020/06/covid-19-global-economic-downturn-not-affecting-co2-rise-may-2020-update/#comment-491729

            And now you’re trying to go to gravity to somehow avoid reality.

            That’s why you never learn.

          • bdgwx says:

            That equation is not found in any credible physics book.

            It comes from Myhre 1998. I posted a link to it. Page 2718 Table 3.

            It is from Arrhenius.

            I can’t find that radiative forcing form in any of Arrhenius’ works. It is my understanding that radiative forcing models did not appear until the 1950’s.

            You always slink away from the issue.

            I’m addressing your statements above.

            And now youre trying to go to gravity to somehow avoid reality.

            I’m addressing the absurdity of your argument that changing a constant in an equation “means the equation is seriously flawed”.

            Thats why you never learn.

            I will be first in line to humbly admit that I have a lot to learn. And with each new thing I learn I come to realize my ignorance is even more profound than before. I will never be capable of learning it all.

          • ClintR says:

            bdgwx, quit playing games. If were actually willing to “humbly admit that you have a lot to learn”, then you would admit that the Arrhenius equation is not found in any credible physics book, instead to trying to imply it is.

            That’s why you never learn.

        • gallopingcamel says:

          @ClintR,
          As you say, the Arrhenius equation is false yet modern GCMs (Global Climate Models) all assume that it is true.

          “Postmodern Science” (e.g. “Climate Science”) exalts beliefs & feelings above facts & evidence.

          Most of what we call “Climate Science” is not science at all.

          There are still a few honest “Climate Scinetists” left including Drs. Spencer & Christy but they are voices crying out in the wilderness.

          • bdgwx says:

            Which GCMs use the Arrhenius equation?

            Can you post a link to a paper that shows it to be false?

            Also…did you read the Myhre 1998 paper?

          • ClintR says:

            The equation is “false” because it is made up from Arrhenius’ imagination. The equation has no mathematical derivation. It has no basics in physics. The units don’t even work out, until you assign units to the bogus “constant”.

            It’s not science, it’s just another false religion.

    • Dan Pangburn says:

      Chi,
      Longer answer would not post. Sorry I was not more clear. Gas phase thermal conduction is only part of thermalization. We pretty much agree. However, I don’t see anything wrong with the idea that the ‘pin ball’ process warms the atmosphere directly. It would just be multiple short periods in place a single long one. Either way, all of the absorbed energy gets shared and emission from a ‘layer’ depends on temperature of the ‘layer’.

      • Chic Bowdrie says:

        Dan,

        Pretty much agree we do. I have not read your WV hypothesis thoroughly, but it makes a lot of sense.

        I don’t see where the pin ball analogy has any direct warming role. The sun warms everything during the day and everything cools at night. Air molecules are just pawns in the process keeping local thermodynamic equilibrium where possible as convection subsides at night and the temperature profile relaxes. They are woken up in the morning to work on reversing the process.

  89. Eben says:

    The population has to be reduced to no more then
    1 billion
    We have to start eating the babies

    https://youtu.be/Tba3g-ASJdI

    • gallopingcamel says:

      I hope that woman in the video follows through on what she advocates.

      Meanwhile I will be fussing over my many children and grand children. My ambition is to live long enough to greet at least one great grand child.

      • Svante says:

        And when they ask why we didn’t save the Earth you can say it was natural.

        • ClintR says:

          Svante, the only problem with Earth is you idiots. Earth is doing just fine. Sane people are doing just fine. You idiot pajama boys try to mess things up for the rest of us.

  90. Rafael Molina Navas, Madrid says:

    The heading figure:
    https://www.drroyspencer.com/wp-content/uploads/MLO-CO2-data-through-May-2020-ann-cyc-removed.jpg
    says:
    “… no atmospheric evidence of reduced global CO2 emissions …”
    I consider that expression rather misleading … Atmospheric CO2 concentration cannot be an evidence of reduced emissions: it just shows the “bottom line” of all CO2 interchanges between earth, seas and mankind and the atmosphere !

  91. Chic Bowdrie says:

    Continued from:
    http://www.drroyspencer.com/2020/06/covid-19-global-economic-downturn-not-affecting-co2-rise-may-2020-update/#comment-492216

    I was hoping the Chen paper would shed (pun intended) new light (pun intended) on the previous papers from Harries’ group. No such luck.

    b, these papers have a common theme: Show changes in spectra then and now. Show that simulated spectra match the observed spectra. Calculate a radiative flux from the difference in simulated spectra then and now. Speculate that the calculated flux will translate into a radiative forcing affecting global temperatures.

    I see several shortcomings in this line of research, the most obvious being that no temperatures are measured. So from the get-go, this is not evidence that a change in CO2 will cause a change in global temperature.

    But what about evidence of a change in radiative flux caused by changes in CO2? Were temperature differences between then and now taken into consideration? If not, that introduces a confounding variable.

    Another issue is how the data is collected. Is it possible that measured flux differences over target areas are compensated for flux differences over areas not sampled? From the Chen paper:

    “In the future, we plan to extend the analysis to more spatial and temporal regions, other models, and to cloudy cases.”

    So again, not all conditions have been considered and confounding variables remain for those that are.

    Thanks for putting up the reference. Do you have any more recent?

    • Nate says:

      “I see several shortcomings in this line of research, the most obvious being that no temperatures are measured. So from the get-go, this is not evidence that a change in CO2 will cause a change in global temperature.”

      The point of these papers is that the mechanism of radiative forcing is real. It can be observed and quantified and compared to theory.

      And the first law of Thermodynamics CAN BE assumed to be valid. Thus it will cause warming unless….you can show us real evidence for a balancing cooling mechanism that kicks into action in response. Can you?

      Warming has been happening. You already call it ‘correlation’. The problem with simply looking at local or global temperature is that it is affected by many factors. Attribution of its changes to just this factor, over a short period of time especially, would be difficult.

      • Chic Bowdrie says:

        Do you see what you are doing here, Nate?

        bdgwx provided papers that he intended as evidence that changes in CO2 will cause a change in radiative flux. I pointed to several reasons why there may be extenuating circumstances. Rather than come back with new evidence or valid counter arguments rebutting those points, you go into obfuscation mode.

        You provided no data to back your assertions, proposed me do work you won’t do, and added nothing but hand-waving and speculation to the conversation. So sad.

      • Nate says:

        “Rather than come back with new evidence or valid counter arguments rebutting those points, you go into obfuscation mode.”

        1LOT requires that you “show us a balancing cooling mechanism that kicks into action in response. Can you?”

        This is a fact and COUNTERARGUMENT that you would prefer to ignore.

        And I also countered your argument that temp rise is the proper test here.

        If you don’t see the counterarguments in there then you must be blinded by your rage.

        • Chic Bowrie says:

          I’ll disregard your misinterpretation of the 1LOT and suppose you meant that a cooling mechanism has to balance the assumed GHE warming mechanism to conserve energy. Actually no enhanced GHE warming mechanism (increasing CO2 increases global temperature) has been unequivocally demonstrated. Warming could easily have and probably has been caused by increasing ASR.

          “And I also countered your argument that temp rise is the proper test here.”

          Huh? My argument is CO2 radiative forcing has not been shown to be a definitive cause of global warming. “It’s the sun, stupid.”

          The doctor is in: I’m not angry Nate. I was annoyed that I could not engage in any meaningful discussions with you. Now I’m just playing with you for fun. Obfuscate at will. It won’t bother me. Doctor Deferhoodler out.

          • bdgwx says:

            How can a radiative forcing of any origin not contribute a temperature change?

          • Chic Bowdrie says:

            If you offer to mow my lawn, when should you expect to be paid? Better yet, if your imaginary friend promises you $100, how much can you deposit?

          • ClintR says:

            bdgwx displays more of his ignorance: “How can a radiative forcing of any origin not contribute a temperature change?”

            bdgwx’s body emits energy. His body could be considered “radiative forcing”. But, if he jumps into a vat of 100F water, the water temperature will not increase.

            If bdgwx jumps into a vat of 200F water, he will LOWER the temperature of the water, even though he had “radiative forcing”.

          • bdgwx says:

            bdgwxs body emits energy. His body could be considered radiative forcing.

            That’s not how that works.

            If bdgwx jumps into a vat of 200F water, he will LOWER the temperature of the water, even though he had radiative forcing.

            So your position is that if a radiative force is acting on a system the system will experience a change in temperature?

          • ClintR says:

            Wrong again, bdgwx. That IS how it works.

            And yes, if you put an ice cube in a cup of hot coffee, the coffee will cool.

          • bdgwx says:

            I don’t think you’re understanding what radiative force means because introducing an object into a system does not necessarily mean that a radiative force has been applied to the system.

            However, I am pleased to see that we both agree that if a radiative force is placed on a system then the temperature of the system will change. Chic believes otherwise or so it seems from his post.

          • Chic Bowdrie says:

            b,

            Still working on detecting your imaginary friend?

            Never be befuddled, Dr. Deferhoodler is here.

          • bdgwx says:

            I’m not sure what you mean Chic.

            I’m only asking for clarification regarding the statement “My argument is CO2 radiative forcing has not been shown to be a definitive cause of global warming.”

            How can a radiative forcing of any origin not contribute to a temperature change?

            We’ll tackle the “It’s the Sun, stupid” later.

          • ClintR says:

            bdgwx admits: “…introducing an object into a system does not necessarily mean that a radiative force has been applied to the system.”

            And that certainly applies to CO2.

          • Chic Bowdrie says:

            The Dr. is in.

            A radiative forcing is the difference between sunlight absorbed by the Earth (ASR) and energy radiated back to space (OLR). Maybe I’m imagining it, but I think more sunlight is being absorbed and causing a “forcing” leading to a global temperature increase. I’m asking you to prove that an increase in CO2 causes any forcing leading to a global temperature increase. Otherwise is just your imagination.

          • bdgwx says:

            Chic said: A radiative forcing is the difference between sunlight absorbed by the Earth (ASR) and energy radiated back to space (OLR).

            Almost. A radiative force is a perturbation in Earth’s energy balance. Specifically it is RF = IN – OUT. That we agree on.

            My issue with your statement above is that ASR – OLR is NOT representative of the energy balance because ASR is only absorbed solar radiation and OLR is only outgoing longwave radiation. There is more radiation directed towards the surface than just ASR (like DWIR). There is more radiation directed towards space than just OLR (like reflected SW radiation).

            But yeah…you have the right idea.

            Chic said: Maybe Im imagining it, but I think more sunlight is being absorbed and causing a forcing leading to a global temperature increase.

            That is certainly one possible explanati