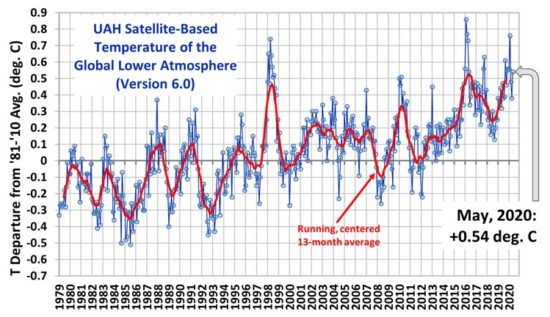
UAH Global Temperature Update for May 2020: +0.54 deg. C

June 2nd, 2020 by Roy W. Spencer, Ph. D.

The Version 6.0 global average lower tropospheric temperature (LT) anomaly for May, 2020 was +0.54 deg. C, up from the April, 2020 value of +0.38 deg. C.

The linear warming trend since January, 1979 is +0.14 C/decade (+0.12 C/decade over the global-averaged oceans, and +0.18 C/decade over global-averaged land).

Various regional LT departures from the 30-year (1981-2010) average for the last 17 months are:

 YEAR MO GLOBE NHEM. SHEM. TROPIC USA48 ARCTIC AUST 
2019 01 +0.38 +0.35 +0.41 +0.36 +0.53 -0.14 +1.15
2019 02 +0.37 +0.47 +0.28 +0.43 -0.02 +1.05 +0.05
2019 03 +0.34 +0.44 +0.25 +0.41 -0.55 +0.97 +0.59
2019 04 +0.44 +0.38 +0.51 +0.54 +0.49 +0.92 +0.91
2019 05 +0.32 +0.29 +0.35 +0.40 -0.61 +0.98 +0.38
2019 06 +0.47 +0.42 +0.52 +0.64 -0.64 +0.91 +0.35
2019 07 +0.38 +0.33 +0.44 +0.45 +0.10 +0.33 +0.87
2019 08 +0.39 +0.38 +0.39 +0.42 +0.17 +0.44 +0.24
2019 09 +0.61 +0.64 +0.59 +0.60 +1.14 +0.75 +0.57
2019 10 +0.46 +0.64 +0.28 +0.31 -0.03 +0.99 +0.50
2019 11 +0.55 +0.56 +0.54 +0.55 +0.21 +0.56 +0.38
2019 12 +0.56 +0.61 +0.50 +0.58 +0.92 +0.66 +0.94
2020 01 +0.56 +0.60 +0.53 +0.62 +0.73 +0.12 +0.66
2020 02 +0.76 +0.96 +0.55 +0.76 +0.38 +0.02 +0.30
2020 03 +0.48 +0.61 +0.34 +0.63 +1.09 -0.72 +0.17
2020 04 +0.38 +0.43 +0.34 +0.45 -0.59 +1.03 +0.97
2020 05 +0.54 +0.60 +0.49 +0.66 +0.17 +1.15 -0.15

The UAH LT global gridpoint anomaly image for May, 2020 should be available within the next week here.

The global and regional monthly anomalies for the various atmospheric layers we monitor should be available in the next few days at the following locations:

Lower Troposphere: http://vortex.nsstc.uah.edu/data/msu/v6.0/tlt/uahncdc_lt_6.0.txt
Mid-Troposphere: http://vortex.nsstc.uah.edu/data/msu/v6.0/tmt/uahncdc_mt_6.0.txt
Tropopause: http://vortex.nsstc.uah.edu/data/msu/v6.0/ttp/uahncdc_tp_6.0.txt
Lower Stratosphere: http://vortex.nsstc.uah.edu/data/msu/v6.0/tls/uahncdc_ls_6.0.txt


398 Responses to “UAH Global Temperature Update for May 2020: +0.54 deg. C”

Toggle Trackbacks

  1. Eben says:

    Back up ? , Are you sure Elon Musk didn’t bump into your satellite on his way to ISS ???

    • Richard M says:

      Remember that satellite data tends to lag the surface temperature trends. What we are seeing in May is the influence from Feb-Mar. If you look back at that data from CFSR you could have predicted this month would be warmer.

      Following this thinking both June and July will drop back to Apr levels and then August will start to pick up on the end of the El Nino.

      • Midas says:

        There was no El Nino this year.

        • bdgwx says:

          According to the ONI there was an El Nino this year. According to the MEI there was not. Different groups qualify ENSO phases differently. The CPC qualification of 5 consecutive readings of +0.5 or higher on the ONI is probably the most widely followed still. For that reason I’m okay with saying there was an El Nino this year. But it was the weakest on record.

          https://origin.cpc.ncep.noaa.gov/products/analysis_monitoring/ensostuff/ONI_v5.php

          https://psl.noaa.gov/enso/mei/

          • Midas says:

            The ONI measures only the oceanic contribution. For it to be an ENSO positive event (which is what everyone means by ‘El Nino’) the atmosphere above must get into lock-step with the ocean.

            If you look at your ONI page, nowhere on the page does it say
            “red = El Nino”.

          • barry says:

            ONI mark off ENSO events based solely on SSTs in the NONI3.4 region. Their chart shows those events as red for el Ninos and blue for la Ninas. They even explain on the page what the temperature and temporal threshholds are.

  2. Svante says:

    How much of the current warming is man-made?

    The IPCC is often quoted saying:

    It is extremely likely that more than half of the observed increase in global average surface temperature from 1951 to 2010 was caused by the anthropogenic increase in GHG concentrations and other anthropogenic forcings together.

    That point is marked by the black arrow on the right here:
    https://tinyurl.com/y4z7sqkz

    The less quoted next sentence reads:

    The best estimate of the human-induced contribution to warming is similar to the observed warming over this period

    Now there is good evidence that it is twice as much:
    https://tinyurl.com/w49fvjx

    Papers:
    https://tinyurl.com/sqmh6bx
    https://tinyurl.com/tjsc8qk

    • Eben says:

      Thanks for pointing out that man-made warming theory is not backed up by any science and solid evidence , The “extremely likely” and the “best estimate” is nothing more than somebody’s opinion, as such cannot be proved or disproved. It it is not science, somebody else can make exact opposite and just as valid claim.

      • Midas says:

        If you had actually read the IPCC reports, you would know that phrases such as “extremely likely” are directly related to probabilities.

        • angech says:

          Probably not

        • Drewski says:

          Each edition of the IPCC report has stated with more confidence man is responsible both for contributing to the observed warming as well as a greater percentage of that warming.

          • Eben says:

            “Each edition of the IPCC report has stated with more confidence man is responsible both for contributing to the observed warming as well as a greater percentage of that warming”

            Yes , their confidence is inversely proportional to their false predictions.

            https://bit.ly/3eJRUX5

          • Midas says:

            Drewski

            Yes. Is your comment a challenge to something that I said?

        • Remus says:

          No, the IPCC are talking about confidence levels. High confidence is described as “Moderate evidence, medium consensus”. Sounds a lot like medium confidence to me, but has absolutely nothing to do with probabilities.

          • barry says:

            “No, the IPCC are talking about confidence levels. High confidence is described as ‘Moderate evidence, medium consensus’. Sounds a lot like medium confidence to me”

            I have little confidence you told the truth here.

        • Mick says:

          So… Not a fact. Hypothesis, or at best a Theory. See the scientific Method

        • Christopher Game says:

          “nothing more than somebody’s opinion”

          “phrases such as “extremely likely” are directly related to probabilities”

          Probabilities are just mathematical statements of reasonable belief, properly specified with rigorous statements of the grounds for the belief. Probabilities in general, and especially as stated by the IPCC, are not facts.

        • “Extremely likely” is subjective. Probabilities are guesses. Neither is science.

          • Drivel. The IPCC clearly tabulates what its language means in terms of probability ranges. Anyone who thinks that probabilties are “guesses” didn’t do maths at school. Anyone who thinks that science does anything but probabilities did not go to school at all.

          • bdgwx says:

            John, I would think of all people you would understand the role probabilities play in science. Your own field of expertise relies heavily on probabilities and statements like “likely” or “unlikely”. Surely you don’t think meteorology isn’t based on science. BTW…I’m still a big fan of your skew-t sounding software.

        • Ann Inquirer says:

          Probabilities are statistically meaningless unless they are derived from statistical analysis. Saying that the Green Bay Packers have a 40% probability of winning the Super Bowl in 2021 may be an educated guess, but it is not a statistical probality.

        • Abder says:

          This science is tailor-made to support the claim of the alleged Anthropocene. The authors cannot demonstrate that human activities thousands of years ago were capable of generating so-called anthropogenic warming. One cannot imagine that agriculture occupied 10 times more space than today, as they claim.

          • Svante says:

            Abder says:
            “One cannot imagine that agriculture occupied 10 times more space than today, as they claim.”

            Which page are you referring to?

          • Abder says:

            W.F. Ruddiman et E.C. Ellis, Effect of per-capita land use changes on Holocene forest clearance and CO2 emissions, Quaternary Science Reviews, 2009 wrote:
            “average per-capita land use appears to have fallen from several ha per person in the middle Holocene to just tenths of one ha near the start of the industrial era, a drop of a full order of magnitude”.

          • Svante says:

            Hi Abder,
            Early farmers used slash and burn techniques, and would move on to clear new land within a few years, so they would cover more ground (even more so if fires went out of control).

            Also, early pristine forests would have much more biomass than later when farmers returned more often to the same area, as explained here:
            https://tinyurl.com/ya4366r8

      • “The ‘extremely likely’ and the ‘best estimate’ is nothing more than somebody’s opinion”

        Can’t you people even read?

        • Eben says:

          Just look at the language they the climate shysters keep using, it is all “could” or “might” , “probability” “something suggests something” ,
          but the one that takes the cake is their claim of “90 percent certainty” , or whatever number is they are using at the time, how can you ever put 90% and certainty together ?, there is only one kind of certainty and that is 100 percent, It is scientific idiocy and nobody even calls them out on it.
          Further more , even if they use the proper word “probability” how could you possibly come with a “probability number” of something that is only just occurring for the first time or has never even occurred ones and it is in the future, a probability can be only calculated from repeated events and experiments , And why am I the only one pointing these things up.
          Is there a One real scientist on this board ???

          • bdgwx says:

            there is only one kind of certainty and that is 100 percent, It is scientific idiocy and nobody even calls them out on it.

            So for you understanding and knowledge is a binary concept? Something is either understood with 100% perfection or 0% ignorance with no possibility of anything in between right?

            And why am I the only one pointing these things up.

            Because we don’t think understanding and knowledge is a binary concept. We don’t think anything can ever be known with 100% certainty nor do we think our ignorance is absolute. We believe understanding and knowledge is a spectrum in which new information is added to it causing it to continually increase.

          • Eben says:

            For the real dense among us , the correct word for if you are anything less than 100% certain is “uncertainty”

          • bdgwx says:

            So if you are prescribed a treatment for a medical condition that has a 90% chance of curing you then you say “there is 90% uncertainty that you will be cured”?

          • “there is only one kind of certainty and that is 100 percent”

            Staggering ignorance. As if one could run ANY kind of real-world venture based on absolute certainty.

        • Apparently reeding and riting and rithmetic are not required in klimate modling.

          • Eben says:

            So lets try it this way

            “The less quoted next sentence reads:

            The best estimate of the human-induced contribution to warming is similar to the observed warming over this period ”

            my question – if this is the best estimate – what is the worst estimate ???

          • bdgwx says:

            Eben, an estimate of the contribution of human induced warming to the observed warming over that period of 0% is probably the worst and the most unlikely to be correct.

          • Svante says:

            The worst estimate would be significantly more than all of it.

          • Eben says:

            Show me that math

          • Svante says:

            Exempli gratia!

            U=UAH Increase.
            A=Anthropogenic contribution.
            N=Natural contribution.

            U=A+N

            So it would be worse than the IPCC estimate if we have e.g.
            N=-1.0
            A=1.6
            U=A+N=1.6-1.0=0.6

            That’s potentially bad because natural contributions are cyclic, but CO2 is only going up. So when the cycle is trough there will be a serious acceleration.

  3. bdgwx says:

    I’ll have to wait until the new data files are available before analyzing this month’s update. It looks like 3 of the previous 16 months got adjusted on this update so it’s possible others that I cannot see yet got adjusted as well.

    2019/3 – 0.35 -> 0.34
    2019/9 – 0.62 -> 0.61
    2020/1 – 0.57 -> 0.56

    What we can say is that this is +0.16C change from April. NCEP/NCAR reanalysis was -0.08C from April.

  4. Rob Mitchell says:

    +0.54 deg. C. I doubt that will boil us. I, for one, am happy to be alive and kicking on this rocky sphere in time and space during this mild interglacial period. And I think a whole lot of other folks are happy too, but just don’t realize it.

    Many thanks to Dr. Spencer and the rest of the UAH team for their continued efforts in monitoring the earth’s temperature and informing us.

    • Aaron S says:

      Exactly, mild interglacial is a good description. And if AGL delays the onset of the next glacial by a century those people will be even more thankful.

      • Svante says:

        More like ten thousand years.

        • Rob Mitchell says:

          That’s a safe forecast Svante. Nobody will be around to verify it. Hopefully, humanity will be technologically advanced enough to deal with the next glacial. A kilometer thick glacial ice sheet on top of New York City might be a tad bit uncomfortable. And many would be shocked to learn that was actually a more “normal” climate.

        • Aaron S says:

          Svante,
          I always find it hard to believe predictions about the timing between orbital forcing and climate change when the milankovitch composite parameters correlate so poorly to actual climate responses in time. The relationship is very poorly constrained and even hard to describe let alone model. For example look at the glacial and interglacial climate event 11c in reference to the composite orbital forcing at 400,000 yrs ago in the Nature paper below. One of the major climate cycles occured during minimal climate forcing from orbital parameters. The debate about the relationship between orbital forcing and climate rages on today. So to suggest you know when the next ice age will start to emerge is highly speculative.

          https://www.nature.com/articles/nature21364

          • Svante says:

            Yes, a small difference in CO2 or regolith removal, or both?
            This model captures it reasonably well though:
            https://tinyurl.com/y7x3kyhg

            However, moderate anthropogenic cumulative CO2 emissions of 1,000 to 1,500 gigatonnes of carbon will postpone the next glacial inception by at least 100,000 years

            https://tinyurl.com/ycf9uo33

          • spike55 says:

            “will postpone the next glacial inception by at least 100,000 years ”

            There is absolutely zero scientific evidence for that baseless conjecture.

            Models, especially climate models, are never scientific evidence of anything.

          • spike – Says the man issuing a baseless assertion and then changing the subject to “models”.

          • bdgwx says:

            It is my understanding that while Milankovitch cycles provide a substantial and predictable long term background forcing the precise timing and magnitude of the glacial cycles still gets contributions from more random and impossible to predict events like volcanism and the circulation of desert dust, circulation of iron rich particles, biosphere feedbacks, etc.

          • Svante says:

            spike55 says:
            “There is absolutely zero scientific evidence for that baseless conjecture.”

            Not exactly, they gave you two references.

  5. Bob Weber says:

    The atmospheric heat gain was from tropical heat loss.

    https://www.tropicaltidbits.com/analysis/ocean/nino34.png

  6. Scott R says:

    We recorded our 2nd highest reading for the tropics last month since the 2016 super enso cycle. This seems like a conflict with the CDAS 3.4 Index which is currently sub-baseline. A 2 month delay is pretty typical between ocean and atmosphere. The ENSO 3.4 region has dropped about 0.6 deg c since the end of last month. I do not think this drop has been appreciated by the UAH dataset yet. Maybe next month we will get a new low for this year in the UAH tropics.

    I never got my question answered on how often during the month each grid is scanned and when, and if I can get the data for my own cell.

    • Midas says:

      The raw data is not a temperature. They have to convert to temperatures.

      • Scott R says:

        Midas,

        The temperature data exists for just my cell, otherwise they would not be able to create the map view. I’d like to see just that and compare it to ground measurements, try to learn more about the heat transfer process. I should also pick a cell in the ocean to do a similar study.

        Depending on WHEN during the month the scan is made of my region is made, could have a huge impact. Some interesting daily high/low averages for Detroit, MI for last month:

        5/2 66.0 F
        5/8 38.5 F
        5/15 64.5 F
        5/17 56.5 F
        5/26 77.0 F
        5/31 55.0 F

        To reiterate, these are the high / low daily average temperatures. Crazy right? So when we are scanned makes a huge difference.

        • Midas says:

          OK – so they are converting to temperatures on the fly. It’s still not the raw data.

          The whole point of a geosynchronous orbit is that they are taking the reading for any given region at the same time each day. The actual temperatures might not be meaningful, but the anomalies are.

          However, these anomalies are not a true reflection of the temperature on the ground/ocean directly below … heat doesn’t move only vertically. So any such analysis would have to involve the entire planet, not just a single region.

        • Bindidon says:

          Scott R

          ” So when we are scanned makes a huge difference. ”

          Your question has been answered already by bill hunter:

          https://www.drroyspencer.com/2020/05/uah-global-temperature-update-for-april-2020-0-38-deg-c/#comment-474952

          *
          I had some idle time this late evening, and generated, for your Detroit corner

          – raw GHCN daily data out of three Detroit stations and
          – UAH 6.0 data for the 2.5 degree cell above them

          for Dec 1978 till March 2020:

          https://drive.google.com/file/d/1596_bKyOf0IZBTXNNUAlhGOgJAxAP17N/view

          The surface is warming a lot faster than the lower troposphere. Nothing new for many CONUS corners.

          J.-P. D.

          • Scott R says:

            Thanks Bindidon… Missed that comment. So every 99 minutes a 1400 mile section from 90N to 90S back to 90N are scanned if I understood correctly. Still, I’d like to see the relationship between the different layers of the atmosphere, and the 2 meter temperature. This will hopefully help me to understand how well Detroit tracks the global temperature. I will then be able to see if it can be used for a global temperature proxy prior to the start of the UAH, because it matches UAH and the AMO very well. Detroit is a very AMO sensitive location, which I believe is creating a multidecadal cycle in the global temperature.

            I see you ran Detroit 1978-present. Had you checked the full data set, you would have realized that 1978 was during the coldest period Detroit has experienced during the last 100 years. From 1932 to 1978, the 12 month running mean fell from 53.6 deg F to 46.5 deg F. It means that we started the UAH dataset at the bottom of the multidecadal cycle for Detroit, and many AMO sensitive locations.

          • Scott R says:

            Bindidon,

            Please provide a link to the UAH cell data download location used to generate your google drive comparison. Much appreciate.

          • Gordon Robertson says:

            binny…”Please provide a link to the UAH cell data download location used to generate your google drive comparison”.

            That’s not Binny’s style. He likes to make it up as he goes along. That’s why he uses Excel rather than the actual algorithms used by UAH et al.

            It would be an act of futility to try sourcing Binny’s data since he uses GHCN station data that NOAA nor anyone else uses. Since 1990, GHCN has dropped 90% of its reporting stations, so comparing anything from 1990 onward based on GHCN data is an act of delusion.

            On top of that, NOAA, which owns GHCN, has fudged the data so badly it is no longer viable.

          • Midas says:

            GR
            He has always provided a link to the data when I have asked. Has it ever occurred to you to ask?

          • Bindidon says:

            Scott R

            Thanks in turn for the convenient reply.

            1. You can’t imho use any single corner on Earth like your Detroit, MI as a global proxy. Even the entire CONUS is far far far away from that.

            I understand your interest to view temperatures as the result of a few superposed cycles, but… I can’t and won’t accept such method.

            *
            Surprisingly, the 3 DETROIT stations in GHCN daily don’t provide for data prior to 1948:

            https://drive.google.com/file/d/19SUxejTF9V5C_OcRi1OBQsZv7FJD4un3/view

            Thus if you want to have relevant surface data,it would be better to collect that of all stations located in the same 2.5 degree grid cell, allowing you to go back to e.g. 1900.

            To this plot I added the (of course) undetrended AMO, so you have an idea of how poorly the grid cell centered around 41.25 N – 83.75 W (encompassing Detroit) does match AMO:

            https://drive.google.com/file/d/1Up4-ivHiaMhUD-OUA3S_H200XGkiGMkM/view

            But that is… your problem.

            *
            2. Now to the UAH grid data.

            As you can see, one of the most ignorant, dumbest persons posting on this blog came along, and urged in spewing his usual discrediting, denigrating, denying and lying nonsense.

            Robertson writes about anything, but has zero dot zero knowledge, in whatever subject. He is a contrarian boaster.

            *
            I understand that you would like to have easy access to a cell-by-cell temperature series management for UAH.

            But UAH grid data is structured by years. In each of the yearly files you find 12 monthly grids of 72 x 144 cells.

            Thus to generate an anomaly series for a specific grid cell, you have to process the entire data and to select the grid anomaly for each month in all the years, and build the corresponding time series.

            The UAH grid data exists in the same format for all four observed atmospheric layers (LT, MT, TP, LS).

            For LT, the yearly files are in

            https://www.nsstc.uah.edu/data/msu/v6.0/tlt/

            and therein are the files ‘tltmonamg.1978_6.0’ till tltmonamg.2020_6.0.

            The file ‘tltmonacg_6.0’ contains the climatology for 1981-2010.

            No data for the latitude bands 82.5N – 90N and 82.5S – 90S is available (but it was for UAH5.6).

            When you look at these files, you quickly understand that you can’t load such data into Excel or a similar software.

            You have to process it by your own, and perform validation & verification using Roy Spencer’s zonal and regional data.

            *
            3. A web site worth a visit!

            I invite you to have a look at a web site engineered by MrZ, a regular commentator on this blog:

            https://cfys.nu/GTA/

            MrZ did among other things a complete processing of UAH grid and GHCN daily data.

            That’s a well done job, and might be helpful to you.

            J.-P. D.

          • Scott R says:

            Thanks for the links Bindidon,

            Yes, I definitely understand that we can not use any given cell as a proxy for the whole planet. Let’s be real about this however… our entire idea of past climate is based on a few proxy locations. That being said, I hope to learn something by studying the cell data closer. I can pick a location in each cell to act as a proxy to the location prior to UAH starting.

            As for Detroit, I have daily and monthly values back to the 1870s. I also have some data from 1820-1880, but the temperatures were recorded by the hour instead of high / low. I have not decided how to use that as proxy if it can even be done. I can build a departure from the average, but there will be a datum shift when we change to high / low temps recorded.

            As for the AMO, I disagree with you about the data alignment. Yes, I realize this is the de-trended version. The cause of the trend is a different forcer which I’ve already discussed with you. (the 42 year cycle) https://www.facebook.com/photo?fbid=2782655421753663&set=pcb.2782656818420190

          • Bindidon says:

            Scott R

            ” I can build a departure from the average, but there will be a datum shift when we change to high / low temps recorded. ”

            Not necessarily!

            This is exactly one of the main reasons to use departures. But you have of course to take, for each proxy series, its mean of the same reference period when subtracting it out of the absolute values.

            As Watts at WUWT was one more time stupidly raging against UHI-biased surface stations (it was Anchorage Airport), I compared this station with the pristine CRN station Kenai located in the near (40 km), but in the middle of nowhere (60.7236N – 150.4483W).

            Here are the absolute values:

            https://drive.google.com/file/d/1D6Plbj3pZiYE3kQS05B6_6mcgOLxNB5n/view

            and here are the anomalies (departures with annual cycle removal):

            https://drive.google.com/file/d/1OhCuDiAFUT80Ws4S8XopciaWQTp4rorn/view

            You see that the linear anomaly trends are identical: differences are only visible here and there when using running means.

            And pretty good visible is that not Anchorage has the bigger peaks and downs, but… Kenai.

            *
            ” The cause of the trend is a different forcer… ”

            You know what I mean about this: AMO is, cycle(s) or not, a… temperature time series.

            J.-P. D.

        • ren says:

          The North Atlantic is quite cool this year.
          https://www.tropicaltidbits.com/analysis/ocean/natlssta.png

    • Richard M says:

      Scott R, you can’t compare current surface data and satellite data. It has never worked and never will. Satellite data lags surface data by 3-4 months.

      • Scott R says:

        You know what Richard M, I might have agreed with you a couple of weeks ago, but Bindidon provided me a slide that shows a very close alignment between the LT data and surface temperatures for my individual cell and it does not appear to be delayed. It deserves investigation. That said based on my individual studies, I found there to be a delay between ENSO 3.4 and UAH. 3-4 months seems right especially when the 3.4 peak occurs in say November. We kind of had a late ocean tropics peak in February, so I don’t think the delay will be as long, but who knows. We could just be experiencing noise in the down trend, and the next month will be colder than April.

        Hopefully someone can link me to the individual cell by cell dataset location.

        • Bindidon says:

          Exactly, Scott R…

          Richard M does not understand much in the field.

          He confounds the lag between lower troposphere temperatures and their original ENSO signal with the difference between lower troposphere and surface temperatures.

          The correlation between LT and surface is by no means given everywhere (and for the oceans it is by far the least).

          But for land areas it is amazing:

          https://drive.google.com/file/d/1p1Cjw4L7WqCZCGKUnNth1lVwergBk-tt/view

          As you can see, the correlation is by far better than at the level of a single cell: that is the power of averaging.

          The GHCN station temperature drop at the end is one of some things due to the fact that you see a ‘raw raw’ evaluation of station data, without even a bit of interpolation.

          If you don’t interpolate, every empty grid cell behaves as if the temperature measured in it was exactly the average of all nonempty cells.

          That is of course complete nonsense (excepted for incompetent denialists).

          J.-P. D.

          • Scott R says:

            Nicely done Bindidon,

            That said, I have my own temperature datasets for my region, and I’d like to do a more detailed study independently to confirm your findings that for land, the UAH does not have a delay. Can you provide the link to the cell data you downloaded to create that chart?

            By the way, based on my calculations, my cell should be getting scanned almost every day. It is doubtful there is much noise generated in the UAH data from scan biases globally.

        • Richard M says:

          Scott R, yes it is the Nino 3.4 data specifically I am referring to. I probably shouldn’t have used the term “surface data”. I think it has to do with a couple of factors.

          First, not all the warm ocean water disappears as the Nino 3.4 starts to cool. Second, it is primarily evaporation of warm water that drives up the atmospheric temperature. As a result you will not see the same effects with land areas.

  7. Nate says:

    “If a city or state refuses to take the actions necessary to defend the life and property of their residents, then I will deploy the United States military and quickly solve the problem for them,”

    Obama said during a hastily organized Rose Garden address.

    • Nate says:

      Just kidding, it was Trump.

      So you can put your gun away..

    • Nate says:

      Thankfully, the Secretary of Defense has come to his senses.

      “The option to use active duty forces in a law enforcement role should only be used as a matter of last resort, and only in the most urgent and dire of situations. We are not in one of those situations now. I do not support invoking the Insurrection Act,” he said during a briefing at the Pentagon.

  8. Midas says:

    Average for past 5 years (60 months) … +0.40

    • Richard M says:

      Midas, 6 or the last 7 years have experienced El Nino events. Why would anyone look at just the last 5 years? Oh right, you aren’t interested in understanding climate change.

      • Midas says:

        Just wrong. In the past five years there were El Ninos in 2016-16 and 2018-19, and a La Nina in 2017-18.

        • Midas says:

          That was meant to be 15-16

        • Richard M says:

          Looks for yourself. See the red? It exists in every year from 2014-2020 except for 2017.

          https://origin.cpc.ncep.noaa.gov/products/analysis_monitoring/ensostuff/ONI_v5.php

          • Midas says:

            Firstly, red doesn’t indicate El Nino. It indicates only the ocean temperature, and not whether the atmosphere was in step with the ocean.

            Secondly, ENSO seasons run from July to June.

            So for those 5 years:
            2015-16 – El Nino
            2016-17 – Ocean temps qualify for La Nina, but atmosphere not in step
            2017-18 – La Nina
            2018-19 – El Nino
            2019-20 – Ocean temps qualify for El Nino, but atmosphere not in step

            So the count is either 3-2 or 2-1, depending on what you deem the qualifications to be.

            Average ONI for this 5-year period: +0.47
            Average ONI for 1986-87 & 1987-88: +0.78
            What was the average UAH for those two seasons?

  9. Bindidon says:

    One thing is 100 % sure: this time we will unfortunately have to live without this great genius’ usual blah blah:

    Richard M says:
    May 1, 2020 at 6:04 PM

    This drop follows what I’ve been saying for a long time.

    What a pity!

    • Gordon Robertson says:

      binny…”One thing is 100 % sure: this time we will unfortunately have to live without this great genius usual blah blah:”

      And you whine about me calling you an idiot. And I’m being kind to you.

      • Midas says:

        Perhaps you would care to EXPLAIN what is idiotic about his comment. I certainly hope you are not being so petty as to pick on his grammar.

    • Richard M says:

      Bindidon, I will admit I was hoping we wouldn’t have to wait for the usual 3-4 month lag in satellite temperatures last month. But, a closer look shows this is exactly what is happening.

      The May data appears to be following the Feb-Mar CFSR surface data. The Apr data was consistent with Jan-Feb. It will take another couple of months before we can see the full effect of the El Nino ending.

      Why is it you are afraid of what might happen when this full effect of the El Nino disappears?

  10. RickWill says:

    It would be useful to see the sea surface temperature from satellite data. It will have much less noise than global surface temperature.

    Nothing that happens on land is meaningful with regard long term climate trends. Land is only relevant to weather, not climate.

  11. CAD says:

    Rarely in the sampling process do we obtain data that are made up of completely uncorrelated observations. In time series there will always be some sort of correlation between data points and a sample may not contain as much information as it would first appear.

    For example, if we have two temperature readings taken an hour apart from each other, there is going to be some dependence between the two readings. This means that knowing information about one of the observations tells us some of the information about the other observation. The question then arises: how does this independence issue affect the information obtained in the sample?

    More often than not, correlation exists between data points in a set of data. When we use the original sample size in deriving a model of the data, we automatically assume that each data point contains one data point’s worth of information. If the data are correlated, then each data point contains less than one data point’s worth of information making our assumption false.

    Implications are wide ranging from OLS regression to frequency analysis. More often than not, researchers may overstate the significance of trends and engineers may underestimate the frequency of severe weather. One must use caution in drawing any conclusions from data, especially from a single point. Rigorous attention to statistical detail is too often forgotten, with foundational assumptions ignored.

    • bdgwx says:

      I’m following you partially…I think. Can you provide commentary how this relates to UAH?

      • CAD says:

        Perhaps it’s time to take a step back and think about what we’re trying to measure and model. What is a sample telling us – how do daily, monthly, annual, decadal, and centennial scale observations relate to the phenomenon we’re exploring? What is the scale of variation, and how are the data correlated over different scales?

        It is possible, in the context of global climate variation, that the entire UAH dataset represents only 1 or 2 meaningful packets of information. It’s also possible UAH represents less than 1 piece of information. In this context, any conclusions drawn from the dataset may only be significant to less than 1 or 2 degrees of freedom.

        It is common for humans to think in scales of months, years, and our expected lifetime. However, natural phenomena do not have these limits. The scale of our analysis and interpretation may be arbitrary.

      • CAD says:

        I might suggest a palatable scale of analysis is 30 years, albeit with no physical basis. In this case, all observations comprising UAH data yields 1.25 samples.

  12. Gordon Robertson says:

    Wherever that warming exists on the planet I know one thing, it does not exist in my part of the world. Here in the Vancouver, Canada region we’ve had below average temps for this time of year.

    Makes me wonder what the global average means.

    Furthermore, I have expressed in the past that NOAA is likely intercepting the satellite data and running it through a warming algorithm before UAH receives the data. I’d like to hear it corroborated by Roy that UAH receives the data directly from the satellites.

    • Rune Valaker says:

      So then we can all conclude if there for a few months has been another global temperature trend then where I am at any given time, then there is evidence that UAH and other temperature series has been fudged. Where is the Nobel Committee in Physics when we need them most?

    • “Makes me wonder what the global average means.”

      Well, for a start it’s global. And secondly, it’s an average. Hell, you’ve even resorted to averages yourself before making it through the second sentence. For some reason that particular “average” seems perfectly meaningful to you.

    • Scott R says:

      Gordon Robertson,

      the UAH trend since 1980 matches HADSTT3 very well. You would have to prove that both datasets are being faked.

      That said, I studied the climate in Swift Current Canada and found no man made warming at all in 130 years of recorded data. Just natural cycles.

      https://www.facebook.com/reddformula350/posts/3243004485718752

    • Richard M says:

      Gordon, you can’t compare surface data and satellite data without using a 3-4 month lag in the satellite data. I see this type of comment all the time. I wish Roy would add a disclaimer in his write ups to mention this lag so people wouldn’t continually do this.

    • Mick says:

      Growing up in that Area, at 50+ Years old. I can say that there has been absolutely no change in the climate here. Exactly like I always remember it. Pours rain for 9 months of the year then a few months of drought. small variations from year to year. Still grow the same things that we grew here 100 years ago.

      Environment Canaduh erased all the historical data, so that future generations will have to take their word for it.

      • bdgwx says:

        Environment Canaduh erased all the historical data, so that future generations will have to take their word for it.

        They did not do a very good job of getting all of the historical data deleted. I was able to easily find Vancouver (GHCND:CA001108446) data back to 1925. I also found nearby White Rock (GHCND:CA001108910) data back to 1929.

      • “Still grow the same things that we grew here 100 years ago.”

        Then you started safely in the middle of the range for those crops. Enjoy it while it lasts. The Swedish wine industry is burgeoning, and even Scottish wines are allegedly quite good these days. Here in the Alps we have lost 40 days off the skiiing season since the 1970s.

    • barry says:

      “Wherever that warming exists on the planet I know one thing, it does not exist in my part of the world. Here in the Vancouver, Canada region weve had below average temps for this time of year.

      Makes me wonder what the global average means.”

      This comment makes me wonder if you can tie your shoelaces.

  13. Russ says:

    Remember how confident Clinton was when he said I did NOT have sexual elations with that woman!

    Confident in an untruth. Just doesnt cut it, does it.

  14. Phew, I’m so glad that cooling phase we keep getting promised is turning up soon. It might be in the top 10 monthly readings ever, otherwise. Instead of the top 15.

    Can anyone from the denialist community explain to me how an increase in trends from 0.13C/decade to 0.14C/decade indicates an imminent cooling, by the way? Warning: Don’t use average or models, or your fellow worshippers may excommunicate you.

    • Richard M says:

      Elliot, come back and tell us all about it after the 3-4 month lag in satellite temperature starts to see the end of the recent El Nino.

      The increase in the trend is easily explain by the fact that 6 of the last 7 years have experienced an El Nino event.

      • bdgwx says:

        I don’t think UAH’s TLT trend is going to be substantially different in 3-4 months or 3-4 years.

        ONI over the last 7 years is about +0.3 as compared to +0.1 from 1979. Sure. That is slightly above average, but not by much.

        Over the last 7 years the planet took up at least 88e21 joules of energy. That is 0.8 W/m^2. We will certainly see ups and down in UAH’s TLT product in the months and years to come, but with an energy imbalance of 0.8 W/m^2 don’t expect any long term cooling.

      • “Elliot, come back and tell us all about it after the 3-4 month lag in satellite temperature starts to see the end of the recent El Nino”

        This already is after several years of that particular fantasy. That was my point. I’m still here, and the overall trend rate has actually increased.

    • gbaikie says:

      We in an interglacial period of Ice Age.
      This Ice Age has been occurring for million of years
      and probably for million of more years
      We are eventually going to return to glacial period.
      If we were actually returning to glacial period at the moment it always take a long time before such things as a ice sheet starts forming in Canada.
      I don’t have opinion about whether we currently sliding into a glacial period, but there has been cooling trend for about 4000 years, and there warmer period which called the Holocene climatic optimum, wiki:
      “The Holocene Climate Optimum (HCO) was a warm period during roughly the interval 9,000 to 5,000 years BP, with a thermal maximum around 8000 years BP.”
      https://en.wikipedia.org/wiki/Holocene_climatic_optimum

      Recently we have leaving a cold period called the Little Ice Age, and glaciers formed during this period still exist and expected to disappear in a few decades.
      The Little Ice Age is agreed to have ended by 1850 AD as glacial started receded and most this retreat of glaciers occurred about 100 years ago. And we had slight increase in sea levels for over 100 years- about 8 inch rise in total.

  15. ren says:

    Cristobal a Flooding Threat to Central America and Eventually the Southern U.S.
    https://www.youtube.com/watch?time_continue=614&v=W3WzNn8Tyns&feature=emb_logo

  16. Charles says:

    God, all these tiresome trolls on here with their back and forth arguments pretending that they understand – even remotely – how the climate works. They don’t and no-one does. Here is the reality of situation:

    (1) The science of climate is a LOT more uncertain and complicated than you have been led to believe

    (2) No-one is sure to what degree man-made CO2 actually affects climate

    (3) The climate movement has long since become hopelessly taken over by a coalition of closet (and not so closet) socialists/communists, rent-seeking crony capitalist and power-hungry bureaucrats and politicians

    (4) The total scientific disarray over how viruses work and how the coronavirus pandemic will play out should give you some idea that our scientific knowledge actually reaches its limits quite quickly and many questions are very hard to resolve if they can’t be tested in a lab. Climate is even more complicated than viruses and pandemics.

    (5) The “solutions” we have to climate change, like windmills, are mostly a total waste of time and mainly a boondoggle for crony capitalists. Many of these so-called “solutions” probably do more environmental harm than good.

    (6) The developing world is not going to reduce its CO2 emissions one iota. They most certainly will not be following the self-destructive lunacy of the West. CO2 emissions will keep on rising.

    (7) In reality we just have to hope that CO2 doesn’t make the climate unpalatable for mankind.

    • Midas says:

      Your “reality” illustrates that you are one of those people who pretend to understand but don’t. It also indicates that your “science” is merely an offshoot of your politics.

      • Richard M says:

        Midas once again projects the views of the typical alarmist. You are the one pretending to know. Charles specifically stated that no one knows.

        • Midas says:

          Funny how all of your comments show you pretending to know, as you draw on your toolbox of “I know all” excuses to explain away the entire rise in the UAH data set.

        • Svante says:

          Richard M says:
          “Charles specifically stated that no one knows.”

          All of Charles points are misleading.

          • Charles says:

            How are they misleading?

          • Svante says:

            They are false and/or incomplete, e.g.
            (1) “The science of climate is a LOT more uncertain and complicated than you have been led to believe”.

            It’s been a function of ln(CO2) for two hundred and fifty years, as predicted by battle proved atmospheric radiative transfer models.
            https://tinyurl.com/y4z7sqkz

            It is a safe bet that it will continue like that, or worse.

          • Stephen Paul Anderson says:

            That chart absolutely proves nothing. It doesn’t tell you whether temperature follows CO2 or the other way around.

          • Svante says:

            Physics says CO2 => temperature.
            The feedback in temperature => CO2 yields something like 10 ppm.

    • gbaikie says:

      –(1) The science of climate is a LOT more uncertain and complicated than you have been led to believe–
      Weather is uncertain and complicated.
      Global climate is somewhat easy.
      We are in an Ice Age. A ice age has cold ocean, Our average temperature of our ocean is about 3.5 and during million year Ice Age the temperature range of ocean is about 1 to 5 C.
      The average ocean surface temperature is about 17 C and average land temperature is about 10 C. Tropical ocean is heat engine of our world.
      (2) No-one is sure to what degree man-made CO2 actually affects climate.
      It’s probably a small effect. And would guess doubling of CO2 is around .5 C warming of surface air temperature, mostly in regions outside the tropics which are the coolest.
      (3)
      Yes it’s religion/belief. And like all religions, within any religion believers disagree about their faith. Best thing is ask any of these religious type what they believe and what they doing to follow their faith.
      (4) Yeah. But US needed to lockdown due to China’s poor governance {or worst}.
      (5) correct
      (6) The developing world is not going to reduce its CO2 emissions one iota…
      I believe China will, as they will run out coal.So, will India.
      Africa does have enough coal to get too worried about. And that is most of world.
      (7) In reality we just have to hope that CO2 doesnt make the climate unpalatable for mankind.

      Increase CO2 level will cause more global greening and increase crop yields. And warming is always good when living in an Ice Age.

      • gbaikie says:

        re: “would guess doubling of CO2 is around .5 C warming of surface air temperature”

        An interesting aspect about that, is does warmer surface air, warm the ocean?
        Does doubling of CO2 or any or all greenhouse gases generally warm the ocean?

        Why is the surface air temperature which globally is 15 C not warm the ocean with average temperature of 3.5 C.
        Even during glacial periods, global average surface temperature is warmer the ocean.
        The reason ocean is cold is that cold polar waters, fall.
        If warm surface waters fall {and they can} one can get a Hothouse climate {if enough warm water falls}.

        A question I have had, is why does ocean only warm up to about 5 C and why does ocean cool down to about 1 C {during last few millions of years of our present Ice Age?

        I have claimed the ocean temperature controls global climate, but going to add the idea that surface air temperature does not control global climate. Which probably seems odd.
        It’s new way saying it, but I long thought it possible to warm the ocean when the air is colder than it is now.
        Though wasn’t thinking that colder global air could warm the ocean- rather I was thinking lines, of ocean not mixing in some way of another.
        Start with what is colder air? Warmer air is warmer polar region, and so colder air is colder polar region. So colder air is polar sea ice that doesn’t melt, or grows more than it melts.
        I think one can have polar ice being say 9 meters thick, is even possible to be 90 meters thick. Is there a limit, 500 meters thick?
        It seems there would be some evidence of having really thick polar sea ice. So I search:
        “Several authors picked up on the ice shelf theory and developed it further (Broecker, 1975, Hughes et al., 1977, Grosswald, 1980, Denton and Hughes, 1981, Grosswald and Hughes, 1999, Grosswald and Hughes, 2008) (Fig. 2). In its most extreme form, a 1000 m thick ice shelf was hypothesized to have covered the entire Arctic Ocean, even south of the Fram Strait.”

        “The hypothesis of an Arctic Ocean ice shelf was considered extreme by much of the glaciological community, although by the mid-1990s evidence indicating deep grounding of ice, likely derived from ice shelves, began to be documented”
        https://www.sciencedirect.com/science/article/pii/S0277379113002989
        So apparently an idea of 500 meter thick polar ice was not actually, extreme enough. Here I am trying to be weird, and I fail.
        How about this for weird, can you have hundred of meters of polar sea ice AND can have warm arctic ocean?
        Which btw wondered if you have this/or do this on Mars- warm lakes with ice on top. Or a colder solar pond. And generally assuming one heating water with nuclear power.
        Anyhow, point is you stop cold water from falling in Arctic. But it is not saying you stop cold water from falling at South Polar region.
        Now basic question I don’t know, how much cold water falls in arctic compared to amount of cold water falling in south polar region.
        It seems that since southern Hemisphere warms northern hemisphere, it seems to indicate more cold water falls in northern hemisphere.

  17. Global Temperature says:

    Dr. Spencer,

    are you familiar with the data collected here:

    http://temperature.global/

    Can you please comment on the discrepancy of satellite data and the NOAA data?

    • Richard M says:

      That is an interesting data processing approach to calculating a global temperature from surface data.

      The baseline is different. Satellites uses 1981-2010 while that product appears to use the most current 30 year period which would start in 1990.

      Finally, what is called the current temperature is actually the 12 month mean. The satellite data is basically a one month mean. Be advised that satellite data appears to lag monthly surface data by 3-4 months.

      • Bindidon says:

        Richard M

        Please stop robertsoning.

        1. ” Satellites uses 1981-2010… ”

        Wrong. RSS’ baseline is 1979-1998, the same as UAH’s before 2010; NOAA’s STAR TMT uses 1998-2007.

        2. ” Be advised that satellite data appears to lag monthly surface data by 3-4 months. ”

        Wrong again. Two examples:

        In 2016, UAH and RSS peaked in February; GHCN in March.
        In 1998, UAH and RSS peaked in April; GHCN in June.

        J.-P. D.

        • Gordon Robertson says:

          binny…”1. ” Satellites uses 1981-2010… ”

          Wrong. RSS’ baseline is 1979-1998, the same as UAH’s before 2010; NOAA’s STAR TMT uses 1998-2007″.

          The only one that counts is UAH since RSS has joined the NOAA fudging team. By satellites is meant the UAH data set, the rest are wannabees.

          • Bindidon says:

            Robertson

            The only one that counts is to know and keep in mind that you are an incompetent, contrarian boaster, ready to discredit and denigrate anything what does not fit into your stubborn, egomaniac narrative.

            J.-P. D.

          • Midas says:

            Bindidon

            To be ‘incompetent’, wouldn’t he first need some related field of endeavour in which he has the potential to display competency? If he has one, it is unrelated to basic science.

      • Global Temperature says:

        Thanks for your post.

        I see what you mean with the different baseline, which explains that the website shows a negative but decreasing deviation as compared to the satellite data, where the baseline is lower and the deviation simply increases.

        How would both datasets compare if set to the same baseline?

    • bdgwx says:

      Even among satellite datasets themselves there are a lot of discrepancies. There are a variety of reasons why satellite, reanalysis, station, balloon, etc. datasets different. It can include the subsets of data used, quality control, bias correction, homogenization, etc. But in many cases it just boils down to them not measuring the same thing. UAH’s TLT product is measuring something different than NOAA’s 2mT product referenced at that site.

      • Gordon Robertson says:

        bdg…”But in many cases it just boils down to them not measuring the same thing”.

        No it doesn’t. UAH is the only data set that has been created through an honest, scientific attempt to present the data. UAH does not homogenize data because they don’t need to. Homogenization is a fudging trick introduced by NOAA to synthesize warmer temps for stations that they thought were too high.

        In other words, all the rest are into pseudo-science aimed at upholding the anthropogenic warming bs. UAH is telling it as it is.

        • Gordon Robertson says:

          type…”to synthesize warmer temps for stations that they thought were too high”.

          Should read…”to synthesize warmer temps for stations that they thought were too low”.

        • Midas says:

          Please describe this detailed mathematical analysis you have done of the UAH method which permits you to come to this conclusion.

        • E. Swanson says:

          Gordo wrote:

          In other words, all the rest are into pseudo-science aimed at upholding the anthropogenic warming bs. UAH is telling it as it is.

          RSS and NOAA STAR also produce temperature products from the same MSU/AMSU data which UAH uses. There’s no need to “homogenize” the data, since they aren’t attempting to correct for biases in individual stations, as might be required for the surface data. All three groups must correct the data from some 13 satellites, each with different corrections due to orbital problems, such as change in Local Equator Crossing Time and decay to lower altitude. There are also other corrections, such as for problems with the “warm target” used for the high end of the temperature scale and for heating/cooling of the instruments due to sunlight around the orbit.

          All that is before corrections are applied for the influence of the known stratospheric cooling trend, which was the original reason S & C produced the first version of the TLT. The latest version 6 is a fundamentally different approach and is based on theoretical models with unknown impact. Three channels are combined and each channel has it’s own set of problems.

          No, Gordo, in spite of your affection for UAH, their work is no better than the others, IMHO.

          • Bindidon says:

            R. E. Swanson

            Good informative job.

            Even if the boaster will endlessly continue to spread out his discrediting nonsense: others who might believe in what he writes can measure the indescribable amount of his ignorance.

            J.-P. D.

    • Bindidon says:

      Global Temperature

      ” This site was created by professional meteorologists and climatologists with over 25 years experience in surface weather observations. ”

      Have you been able to discover any official information concerning the ‘professional’ authors of this web page?

      I wasn’t.

      Anyway, I ask me why to use data
      – going back to 2015 only
      – based on an invisible reference period
      – printed in Fahrenheit (used only in the US and in some of its little backyards).

      Rgds,
      J.-P. D.

      • Global Temperature says:

        J.-P.

        it is not important for me to know of the authors. Also do not know why you put professional in brackets. Since we do not know who the authors are, we cannot judge their credits.

        Why they are using data from 2015 only is easily answered. The website exists only since then.

        The reference temperature can be easily deducted from the given temperature. It looks like they are using 14 Deg C.

        The print is in deg C for me, so cannot comment on how it shows for you.

  18. Hey, did I mention that Mike Mann was elected to the NAS?

  19. Aaron S says:

    Svante,
    I am looking at the paper you provide and a few obvious points emerge. Thanks for using data because it makes a meaningful conversation. https://tinyurl.com/y7x3kyhg

    1. The model totally fails at 0.5 and 0.4 Ma years. The fact is we still had major climate responses and no orbital forcing.
    2. This model assumes climate sensitivity to CO2 is high.

    Point 1. Can you disagree that the climate does not match the model 400,000 yes ago? This implies there is more to glacial interglacial than just orbital forcing (well known fact prior to climate bias). I prefer to consider that there are internal dynamics with climate system memory but choose whatever alternative forcing you want. Point is if you can not isolate natural climate change then you can not attribute modern warming exclusively to CO2 with any confidence. I tend to agree it is AGW creating most of the warming but it could be some natural internal dynamic we dont understand contributing 5 to 95 % of the warming. So we have a false sence of confidence in our models.

    Point 2. How do you establish climate sensitivity when you can not isolate the role of CO2 by eliminating orbital forcing? If climate is highly sensitive to CO2 then we are invoking a significant lag in response to the very high CO2 levels at a minimum. Otherwise the warm climate of glacial stage 5e 125,000 years ago would have been surpassed years ago when CO2 was at 320ppm. We are still 6 m lower sea level today than we were during the last interglacial 125,000 yr ago. So you are suggesting we understand all sorts of complex feedbacks, and I can not see that as having any sort of certainty. It is a delusion.

    Final point 3. Humans are a natural part of the Earth system. Who are we to pick winners and losers? Especially given places like Africa become more green and more habitable when the earth was warmer at 125,000 yr ago and even 2 million years ago. I personally dont feel it is ethical to deny Africa it’s time to return to climate optimum. Not to mention the high latitudes of N America and Asia. What entitles the IPCC to pick winners and losers? Because their high rise condo in New York might loose value? Or do you argue humans are not part of the natural system? In my view there is Irony that the climate change predicted from IPCC models harm Europe but help Africa, and injustice that we want to stop that trend. We should prepare corridors for animal migrations.

    • Svante says:

      Good questions Aaron S,
      1) Looking at fig. 1:(B), MIS 11 was different because CO2 stayed high for a long time.

      You can see it more clearly here:
      https://www.nature.com/articles/s41467-020-15739-2/figures/3

      That paper links it to biosphere productivity:
      https://www.nature.com/articles/s41467-020-15739-2

      2) Yes, the CO2 impact is high when feed backs can run to completion. MIS 11 cleared most of the Greenland ice sheet after thousands of years. The Paris 2 C target can do it again. I suggest the big picture is understood.

      3) But we are picking winners and losers if we mess around with the climate system. Humanity and eco systems are adapted to the climate and sea levels we had. Humans are not part of the natural system, we should stabilize it.

  20. tim wells says:

    I am in the UK. Clear blue skys for weeks. Lots of chemtrails. Now feels like winter age.

  21. Bindidon says:

    Mick

    ” Environment Canaduh erased all the historical data, so that future generations will have to take their word for it. ”

    bdgwx gave you a reply to this already. But I think it might be good to show how wrong you really are.

    Here is the GHCN daily data info for your Canaduh:

    https://drive.google.com/file/d/16VQJrIhip4GRSspdoL0LP0wpy2uSeHE_/view

    And this data collected by the NOAA is certainly only a subset of what the Canadian administration responsible for weather stations is likely to have.

    Of course: only a record of all station activities since begin can be a proof that these measurements exist, and can be used:

    https://drive.google.com/file/d/10dxfi4_0mLIrlDpHeg9jEKezkfE7l3iE/view

    To be honest, I wouldn’t use, for a country with a surface of 10,000,000 km2, any data before 1900, because it is not representative enough.

    J.-P. D.

  22. bdgwx says:

    ERA 2mT reanalysis provided by the Copernicus group is in.

    https://climate.copernicus.eu/surface-air-temperature-may-2020

    +0.623 for May.

    This is a -0.076 change from April.

    May 2020 is the warmest May on record.

  23. Bindidon says:

    RickWill

    ” It would be useful to see the sea surface temperature from satellite data. It will have much less noise than global surface temperature.

    Nothing that happens on land is meaningful with regard long term climate trends. Land is only relevant to weather, not climate. ”

    Wow.

    I’m terribly impressed.

    1. Sea surfaces
    https://drive.google.com/file/d/10FWtzbw-R8FUjI9SX5MoFahbLFIcIMg5/view

    2. Land
    https://drive.google.com/file/d/1p1Cjw4L7WqCZCGKUnNth1lVwergBk-tt/view

    *
    Sources

    – UAH6.0 LT:
    https://tinyurl.com/y62sq3xo

    – HadSST3:
    https://tinyurl.com/yawrfysf

    – GHCN daily:
    https://tinyurl.com/mlsy22x

    • bdgwx says:

      Those are interesting graphs. Thanks.

    • Midas says:

      I assume the fact your running means are not there for the first three years means that they are 18 months out of alignment with the monthly data. Would it not be better to centre them?

      • Bindidon says:

        Midas

        ” … 18 months out of alignment with the monthly data. ”

        Sorry Midas, this is not correct.

        A running mean over 36 months starts… 36 months after data begin.

        Excel and similar guys (like the Libre Office Calc I use on a Linux system) do not provide for centred running means.

        This means that I have to do the job by my self, instead of letting the tool do it automatically for me…

        An example:

        https://tinyurl.com/yalpn5a2

        J.-P. D.

        • Midas says:

          There are many different ways of calculating a running mean.

          The 13-month running mean on THIS site is centred – it begins in the 7th month of the data, as you can see by the fact it begins half-way through the first year and ends 7 months ago.

          S-I-D-C calculates a 12-month running mean on their sunspot data. It actually consists of 13 months, where the 1st and 13th months are each given a 50% weighting. It too is a centred mean. That is, the average of Jan-Jan is stored in July.

          When you use a right-justified running mean as you have, you get out of phase with the actual data by half the period of the mean.

        • Midas says:

          Also, the Covid graph you linked to IS a centred running mean. It is a 7-day running mean, and begins on day 4, not on day 7.

          And the Data Analysis package can easily produce centred means – just offset the output range. But I think it much simpler to type one formula and double-click to fill down.

          • Bindidon says:

            Midas

            ” Also, the Covid graph you linked to IS a centred running mean. ”

            OF COURSE it is!

            Simply because it is based on self-made means, and not what Libre Office Calc generates on demand. Calc does NOT provide for centred means.

            Jesus! I don’t want to add columns in spreadsheets just because somebody thinks only centred means would be correct.

          • Midas says:

            This started with me making a mere suggestion for improvement, and it has turned into “somebody thinks only centred means are correct”, which is absolutely NOT what I said. Why is everyone so hypersensitive? You’d think I was challenging your manhood.

    • Gordon Robertson says:

      Binny…why do you find it necessary to fudge data in your amateur Excel presentation to show sat data agreeing with surface data?

      Had-crut gets it’s data from NOAA which we know is fudged. Your presentation of Had-crut data is a total misrepresentation.

  24. Midas says:

    Had-Crut gets its US data from NOAA – nothing else. Is there no end to your fiction?

    • Midas says:

      Why does this site keep sending my comments to the end instead of where I post them?

      • Bindidon says:

        Midas

        No idea. This never happens to me.

        Scott R complains about the same problem.

        He uses a smartphone.

        I don’t.

        Do you?

        J.-P. D.

        • Svante says:

          The site gives you a different page version on smart phones.
          Orange and blue at the top you know, and it doesn’t work.

        • Midas says:

          I don’t own a smartphone. I’ve seen the complaints before but until the last couple of days it hadn’t happened to me.

          • Svante says:

            So maybe it’s the browser/platform combination then.

          • Midas says:

            I also go through long stretches where I am unable to post on this site. It appears that the two big denier trolls have the same issue, but at different times to me. Interestingly, they both seem to vanish at the same time, but one always reappears a few days before the other, as if by design.

          • Svante says:

            I thought it was two different things.
            The trolls get banned once a year or so,
            and the site has posting problems twice a year?

          • Midas says:

            Hmm – that’s not what I said …
            I typically have posting problems every month, which is why I disappear some time during the month and return when the next update arrives.

          • Svante says:

            I don’t think you should give up that easily.

            I switch between Firefox and Chromium when that happens.
            If that doesn’t help I try again after a few hours or the next day.

            I think it might depend on the targeted adverts you get, some of them might lead to failure (perhaps because they have one of the banned strings), and if you fail too many times I think you’re blocked for hours (but no one else thinks that).

            Plus the usual tactics of posting smaller pieces.

          • Midas says:

            When I feel I have something urgent to say, I do try those strategies, and sometimes they are successful.

            But by about half-way through the month, I have had enough of hanging out with people of low-intellect such as Robertson, DREMT and Flynn (Amazed), so I typically use the opportunity to give myself a rest from these knuckle-draggers before the next month’s figures come out.

          • Svante says:

            Yes, you need a sick sense of humour to mess around with those geniuses. bill hunter has also got full lunatic moon Gish gallop qualifications now, even vitriolic Eben drew the line there.

          • Bindidon says:

            Oh yes!

            This endless stuff about ‘Moon doesn’t rotate about its center of mass’ is more and more amazing.

            This troop discredits, denigrates and discards anything what doesn’t fit to their egocentric narrative.

            Unfortunately, none of these intelligent, attentive Babylonians who observed our Moon during decades and over several generations are present anymore.

            They would get a big, big laugh when reading their comments in that thread.

            J.-P. D.

  25. Gera says:

    If you say that i think you are not familiar with how statiatics models define certenty. Its not only for climate science. Also for covid for example. Their models have certenty levels. Which may turn rigth or wrong but is the best we have.

  26. Eben says:

    `The word of the day “certainty” from various dictionaries
    —————————
    something that cannot be doubted
    something certain; an assured fact
    the state of being completely confident or having no doubt about something:
    the sure knowledge that something is true
    something that has no possibility of any other result; something that you know will happen in a particular way:
    The quality of being reliably true
    —————————

    The use of language like 85% certainty is an oxymoron invented by climate shysters who don’t want to use the correct word uncertainty because those just don’t sound so good
    The lowest common denominators targeted by these stupid tricks don’t know the difference

    • Bindidon says:

      Typical Eben stuff…

      1. Search for “globe surface temperature measurement certainty” excluding “uncertainty” and “heat”

      80,000 links

      2. Search for “globe surface temperature measurement uncertainty excluding “heat” (“certainty” cannot be excluded here)

      950,000 links

      Good grief.

      J.-P. D.

    • Eben says:

      For the newbees on board , if you want to learn about the high “uncertainty” of man made warming claims and the future predictions Judith Curry is the scientist to go to

      https://judithcurry.com/2018/10/11/climate-uncertainty-monster-whats-the-worst-case/

      • Midas says:

        Yes newbies, this is one of the numerous places you can go to get a denial ed- (oops, I mean) indoctrination.

        • Svante says:

          Well she was an actual/active climate scientist until she retired, and it’s a good point that we talk too much about the probable, and not enough about worst case risks.

        • Gordon Robertson says:

          midas…”Yes newbies, this is one of the numerous places you can go to get a denial ed- (oops, I mean) indoctrination”.

          Judith Curry has done more real science than any of you alarmists or any of your gurus at realclimate, SkS, desmogblog, Eli Rabbett, or the musician who passes himself off as a climate expert, Dumbino.

          She was a member of the Berkeley Earth project but had the integrity to distance herself from it when the leader, Mueller, got stupid and started misinterpreting the results of the study.

          Judith Curry has integrity, a character trait not found in any alarmist climatologist. You won’t find her involved in Climategate scandals, Judith just tells it like it is and she won’t get into the National Academy of Science like the clown Michael Mann because NAS is now owned by alarmists and has lost any integrity it had. Those alarmists who managed to weasel themselves into NAS, before taking over, should have known that inducting an misogynist idiot like Mann would have spelled the end of NAS, but that’s how stupid and arrogant the average alarmist seems to be.

          You alarmist groupies cannot stand real scientists like her because her intelligent analysis of the catastrophic global warming fraud reveals all of you as a load of whining, butt-kissing followers who cannot wait to prostrate yourself in an appeal to authority. In fact, I think many of you seek out authority figures so you can lay flat on your faces before them. Some sort of perverted fetish.

          • Midas says:

            Funny how you had to pretend you didn’t see my follow up comment in order to launch that tirade.

          • Gordon Robertson says:

            midas…”Funny how you had to pretend you didnt see my follow up comment in order to launch that tirade”.

            I did notice your correction, claiming you meant Jo Nova. My reply still applies since Jo Nova is a person of integrity unlike the clowns you support.

          • Midas says:

            Who do I “support”? It seems you are personifying science.

      • bdgwx says:

        Eben, if this is the authority you are going to appeal to then understand that JC’s 2xCO2 sensitivity is now up to 1.6C I believe…consistent with the IPCC range.

    • Svante says:

      The statistical term is confidence interval.

    • Midas says:

      Claiming that this language was invented by climate scientists says more about your lack of engagement with (and probably lack of knowledge of) statistics at this level than it says about them. You are one of the many deniers who “learn” on the fly, with the sole purpose of discrediting climate science, and have never actually engaged with this material at a deep level. You have never calculated a confidence interval in your life, let alone understood what one is.

  27. John Wheeldon says:

    Dr. Spencer, I am interested in knowing the 30-year (1981-2010) average temperature used for calculating the temperature anomalies used globally and for the USA. I hope that your family and colleagues are keeping well during this anxious time,

    Sincerely, John Wheeldon

  28. Gordon Robertson says:

    midas…”Had-Crut gets its US data from NOAA nothing else. Is there no end to your fiction?”

    Are you lot really this stupid? Where do you think Had-crut gets its data? There is only one source, GHCN, and it is owned by NOAA.

    GHCN has slashed 90% of it’s reporting stations since 1990 and outfits like Had-crut, GISS, and NOAA draw from that small pool, each one drawing as much as they think they need to do the best fudging. Had-crut draws about 4500 stations and GISS 6000 or so. NOAA doesn’t need as many, they use less than 1500 stations from the GHCN pool and synthesize the rest using a climate model.

    It’s interesting that the major climate shysters belong to these groups, as revealed by the Climategate email scandal. Phil Jones of Had-crut bragged about using Mann’s ‘trick’ (hide the decline) to hide cooling temperatures in Had-crut data. That’s when he was not applauding the death of skeptic John Daly.

    Gavin Schmidt, head of NASA GISS has Michael Mann as his buddy, both of them running realclimate. When Mann’s trick for hiding declining temperatures was exposed in Climategate, Schmidt backed him to the hilt. I am sure he is beside himself with envy since Mann entered the back door of NAS as a janitor and mistakenly got inducted by some drunk alarmists mistaking him for a scientist.

    Jones did not stop there. He is one of the head honchos at IPCC reviews as a Coordinating Lead Author. He is partnered with Kevin Trenberth of NCAR who has been known to interfere in the peer review process. In the Climategate emails, Jones, then head of Had-crut, threatened that “he and Kevin would ensure certain skeptical papers did not reach the reviews stage”. One of those papers was authored by John Christy of UAH.

    Mann referred to their climate shystering in the emails as ‘The Cause’. That’s when he was teeing off on Judith Curry for becoming skeptical of their shenanigans. Later, he insulted her with misonygistic rhetoric.

    When you alarmists appeal to authority you sure pick authority figures from the bottom of the barrel.

    • Midas says:

      GHCN is not a source, it is a collection agency. The sources are the individual meteorological agencies around the world. The Met Office collects their data from them, independently of GHCN. On their website, they thank the various national meteorological agencies for supplying them the data.

      I just downloaded the Had-crut station data. There are 11,081 stations. So you are simply full of BS.

      • Gordon Robertson says:

        midas…”GHCN is not a source, it is a collection agency”.

        yes…it collects data from stations around the world, discards 90% of the station data, then Had-crut, gistemp, NOAA, etc., pick over the remains then fudge it to show warming where there is none.

        • Midas says:

          As data from over 100,000 stations is available via GHCN, you are claiming that there are over a million stations in the world recording temperature that are associated with an official meteorological agency. That is an average of one station in every 12km by 12km square over the surface of the planet.

          Do you believe that is feasible?

    • Svante says:

      Gordon,

      GISTEMP is consistent with AIRS and so is UAH according to Dr. Spencer, see:
      https://www.drroyspencer.com/2019/05/the-weakness-of-tropospheric-warming-as-confirmed-by-airs/

      GISTEMP is broadly consistent with all major surface records.

      So it follows that NOAA is consistent with UAH.

      Mann’s result has also been verified time and time again.

      So just like Mann they kept fudging and ended up with the correct result.

      • Gordon Robertson says:

        svante…with regard to your link, Roy did not confirm gistemp, it was Gavin Schmidt. All Roy claimed was confirmation of UAH LT temps based on AIRS. He did not endorse the pseudo-science at gistemp.

        Mann is a geologist who should stick to rocks. As a climate scientist he is a bust.

        • Svante says:

          Gordon, Spencer had the opportunity to say something about that paper, but he didn’t.

          I do think the surface temperature record has problems. It has been checked against proxies, and there are statistical outliers in 19021905 and 19371945.

          The latter was when ships switched from buckets to engine inlet temperature. Clearly those temperatures have not been adjusted enough, the trend since then is too low.
          https://tinyurl.com/yatctvju

          Mann is off in 1800 and to a lesser extent in 1840.

    • Bindidon says:

      Robertson 080620

      We all know and keep in mind that you are an incompetent, contrarian boaster, ready to discredit and denigrate anything what does not fit into your stubborn, egomaniac narrative, and permanently lying.

      J.-P. D.

      • Gordon Robertson says:

        binny…”We all know and keep in mind that you are an incompetent, contrarian boaster, ready to discredit and denigrate anything what does not fit into your stubborn, egomaniac narrative, and permanently lying”.

        To you, that would be:

        Mr. Incompetent
        Mr. Contrarian
        Mr. Boaster
        Mr. DisCreditor
        Mr. Denigrater
        Mr. Stubborn
        Mr. Egomaniac
        Mr. Liar

        Show some respect to your superiors, please.

        • Bindidon says:

          Robertson

          You, a superior? Of what? At best, of ignorance.
          You do not know anything, not even how to process data.
          You, an engineer? At best, you are a (badly educated) teacher…

          J.-P. D.

          • theRealPlastic says:

            Gordon Robertson is a superior liar – not an engineer but an unemployed, racist, homophobic drop-out. He contributes nothing but belittles everything.

    • Galaxie500 says:

      (Hide the decline) is refering to the decline between actual temps and tree ring proxies from 1950, not hiding cooling temps in Had-Crut data. How do you not know this?

      • Midas says:

        He knows it. But it doesn’t fit his agenda.

      • Gordon Robertson says:

        galaxie…”(Hide the decline) is refering to the decline between actual temps and tree ring proxies from 1950, not hiding cooling temps in Had-Crut data. How do you not know this?”

        It’s in one of the Climategate emails, uttered by Jones when he did not realize someone might see them.

        • Midas says:

          We know who wrote it – you are not supplying any information there. And the meaning was exactly as Galaxie500 stated. Please state precisely what decline you believe he was referring to, with clear references to the context of the email (not just one snippet, which has been fraudulently changed by many commentators).

        • Galaxie500 says:

          Gordon I now where it comes from but I am saying your are misrepresenting its meaning.

          • Gordon Robertson says:

            galaxie…”Gordon I now where it comes from but I am saying your are misrepresenting its meaning”.

            Nothing to misrepresent, Mann et al saw the proxy data showing declining temperatures so they cut off the offending data and substituted real data. Mann saw nothing wrong with that in a study where nearly 1000 years of proxy data was used to infer unprecedented warming.

            I have no time for Mann, I regard him as a pseudo-scientist. Phil Jones is just as bad for supporting him and refusing access to Had-crut data for an independent audit.

            https://climateaudit.org/2014/05/09/mann-misrepresents-the-epa-part-1/

            “However, the incident came into an entirely new light with the release of the Climategate emails, which showed that senior IPCC officials had been concerned that the Briffa reconstruction (with its late 20th century decline) would dilute the message and that Mann was equally worried that showing the Briffa reconstruction would give fodder to the skeptics.

            From a real scientist with integrity, John Chisty of UAH, who was there when the chicanery was committed:

            “Regarding the Hockey Stick of IPCC 2001 evidence now indicates, in my view, that an IPCC Lead Author working with a small cohort of scientists, misrepresented the temperature record of the past 1000 years by (a) promoting his own result as the best estimate, (b) neglecting studies that contradicted his, and (c) amputating anothers result so as to eliminate conflicting data and limit any serious attempt to expose the real uncertainties of these data”.

            Of course: “Christy left out a further fundamental problem in the amputation: there was no disclosure of the amputation in the IPCC 2001 report itself”.

            These are the charlatans you are supporting, the IPCC is rotten from the top down. Even Karl of NOAA knew about it and said nothing.

  29. Midas says:

    GHCN is not a source, it is a collection agency. The sources are the individual meteorological agencies around the world. The Met Office collects their data from them, independently of GHCN. On their website, they thank the various national meteorological agencies for supplying them the data.

    I just downloaded the Had-crut station data. There are 11,081 stations. So you are simply full of BS.

    • Midas says:

      Yet again – this was not supposed to go here.

      • Svante says:

        Hope you don’t start denying science, most bottom feeders do.

        Even barry was down there at one point but he took it well, said he was “no snob”.

        https://tinyurl.com/y8xuwlkh

        • Midas says:

          Huh??? WTH is this about??

        • Midas says:

          Precisely what part of saying my comment posted in the wrong place would mean I “deny science”? What exactly is the relationship between those two circumstances? And in what way have I offended you that would justify referring to me as a “bottom feeder”? Also, your second sentence carries no meaning for me.

          • Svante says:

            I apologize, you have not offended me, and my link is out of order.

          • Midas says:

            Your link was to a page with 2300 comments, so I had no idea which comment or thread you wanted me to look at.

          • barry says:

            Search that page for “snob” and Svante’s cryptic comment becomes clearer.

  30. bdgwx says:

    BEST April value is finally in. +1.16C. That is the warmest April on record. The BEST trend since 1979 increased to +0.1925C/decade +- 0.0054.

    The UAH TLT trend is now +0.1355C/decade +- 0.0067. May is the second warmest on record behind 1998 and tied with 2016. Or using Dr. Spencer’s preferred language it is the 41st least cool May on record. The UAH TLT trendline is at +0.332C.

    The May UAH TLS stratosphere went down to -0.44C from 0.00 in April.

    • Gordon Robertson says:

      bdg…”BEST April value is finally in. +1.16C”.

      BEST is a joke, worse than NOAA.

      • Bindidon says:

        Robertson

        Here, for the umpteenth time, you show where you are our absolute superior: in discrediting, denigrating and lying.

        Your stupid ideas concerning Moon’s spin about its center of mass are perfectly on the same line of ignorance.

        J.-P. D.

  31. Galaxie500 says:

    Gordons the type of bloke who would have an argument with his own shadow.

  32. bdgwx says:

    Cheng’s OHC dataset has been updated through March/2020. The heat uptake since 1979 is 0.530 W/m^2 +- 0.005. Over the last 30 years it is 0.604 W/m^2 +- 0.005. Over the last 10 years it is 0.668 W/m^2 +- 0.020.

    http://159.226.119.60/cheng/images_files/OHC2000m_monthly_timeseries.txt

    • bdgwx says:

      What I find interesting here is that while the temperature continues to increase and drive that energy balance back toward 0 W/m^2 the imbalance itself is actually still increasing.

      What follows is the estimation of the TCR from Cheng’s OHC and UAH TLT trends. It is open for discussion. It’s possible I have made mistakes or made assumptions that might not be valid.

      An OHC uptake of 0.530 W/m^2 over 41 years lead to 0.56C of UAH TLT warming. This is about 1C per W/m^2 of transient response.

      The RF of CO2 from 1979 to present is about 1.0 W/m^2. The OHC uptake was only 0.5 W/m^2 though. This means the net of other GHGs plus human and natural aerosols is about -0.5 W/m^2. Let’s assume that -0.5 W/m^2 remains constant. 2xCO2 gives us an extra +1.7 W/m^2 of forcing and factoring in the -0.5 W/m^2 of other forcing brings us down to +1.2 W/m^2. And using the 1C per W/m^2 from above that yields an extra 1.2C of warming on top of the 0.56C that has already occurred. That’s a total warming of 1.7C from 1979 and would equate to about 1.8xCO2. Normalizing to 2xCO2 this gives us (1.7 / 1.8) * 2 = 1.9C.

      So yeah…based on OHC uptake, UAH TLT trend, and CO2 levels from 1979 to present I estimate that UAH is consistent with a transient climate response of 1.9C.

  33. Gordon Robertson says:

    reposting here, lost my place…

    galaxie…”Gordon I now where it comes from but I am saying your are misrepresenting its meaning”.

    Nothing to misrepresent, Mann et al saw the proxy data showing declining temperatures so they cut off the offending data and substituted real data. Mann saw nothing wrong with that in a study where nearly 1000 years of proxy data was used to infer unprecedented warming.

    I have no time for Mann, I regard him as a pseudo-scientist. Phil Jones is just as bad for supporting him and refusing access to Had-crut data for an independent audit.

    https://climateaudit.org/2014/05/09/mann-misrepresents-the-epa-part-1/

    “However, the incident came into an entirely new light with the release of the Climategate emails, which showed that senior IPCC officials had been concerned that the Briffa reconstruction (with its late 20th century decline) would dilute the message and that Mann was equally worried that showing the Briffa reconstruction would give fodder to the skeptics.

    From a real scientist with integrity, John Chisty of UAH, who was there when the chicanery was committed:

    “Regarding the Hockey Stick of IPCC 2001 evidence now indicates, in my view, that an IPCC Lead Author working with a small cohort of scientists, misrepresented the temperature record of the past 1000 years by (a) promoting his own result as the best estimate, (b) neglecting studies that contradicted his, and (c) amputating anothers result so as to eliminate conflicting data and limit any serious attempt to expose the real uncertainties of these data”.

    Of course: “Christy left out a further fundamental problem in the amputation: there was no disclosure of the amputation in the IPCC 2001 report itself”.

    These are the charlatans you are supporting, the IPCC is rotten from the top down. Even Karl of NOAA knew about it and said nothing.

    • bdgwx says:

      I would utilize the instrumental temperature record where available as well. I would do so even if the proxy model was valid during the tree ring divergence period. What would you do?

      • Gordon Robertson says:

        bdg…”I would utilize the instrumental temperature record where available as well”.

        The study was supposed to show a 1000 year temperature record based on tree ring proxies. They used one tree for the entire 13th century then in the 20th century the tree ring record showed cooling when real temperatures were showing warming.

        It’s not a matter of using real data or not it’s the fact that the tree ring record was proved wrong therefore how good was the rest of it?

        McIntyre and McKittrick proved the algorithm used by Mann et al to calculate their tree ring data would show a hockey stick shape with random data like white noise. The MBH record was rigged to show a hockey stick no matter what. A statistics expert agreed with them.

        • bdgwx says:

          They used one tree for the entire 13th century

          Can you back this claim up?

          in the 20th century the tree ring record showed cooling when real temperatures were showing warming.

          No. Tree rings proxies did NOT show cooling. What they did was show different growth characteristics that were not compatible with the model that maps these growth characteristics to temperatures.

          It’s not a matter of using real data or not it’s the fact that the tree ring record was proved wrong

          Fake news.

          therefore how good was the rest of it?

          MBH98 has been corroborated many times while MM’s criticisms have been discredited many times.

          McIntyre and McKittrick proved the algorithm used by Mann et al to calculate their tree ring data would show a hockey stick shape with random data like white noise.

          No they didn’t.

          The MBH record was rigged to show a hockey stick no matter what.

          Fake news.

          A statistics expert agreed with them.

          Like…as in just one? Was it Wegman?

    • Svante says:

      They hid the divergence problem where Gordon would never find it.
      In a scientific paper.
      A year before the hockeystick hu-ha.

      • Gordon Robertson says:

        svante…”They hid the divergence problem where Gordon would never find it. In a scientific paper”.

        Fortuntely, I am not the one investigating, it is a statistical expert, Steve McIntyre. Is your reading comprehension lacking?

  34. Gordon Robertson says:

    galaxie…”Gordons the type of bloke who would have an argument with his own shadow”.

    I’m not arguing, I am pointing out the truth. It is you who is arguing against the truth.

  35. Gordon Robertson says:

    binny…”Your stupid ideas concerning Moons spin about its center of mass are perfectly on the same line of ignorance”

    Strange to here someone who has never studied physics insulting someone who has studied engineering, arguably one of the toughest disciplines at a university.

    I have provided scientific evidence to back my claims about the non-rotation of the Moon, either about a local axis, or in any frame of reference. I have done it with great deliberation, creating an irrefutable argument about a radial line passing through the Moon, and no one has been able to disprove what I have claimed.

    I have proved further that the motion you spinners call rotation is in fact curvilinear translation. All you do is appeal to authority from scientists of long ago who lacked the proper telemetry to see that the Moon cannot rotate about a local axis.

    I have no doubt that Cassini was a great scientist and likely a great guy to boot, but he was wrong. And so is NASA. You cannot argue with real physics, even if you do misrepresent the meaning of local rotation.

    • Bindidon says:

      Robertson

      ” Strange to here someone who has never studied physics insulting someone who has studied engineering… ”

      YOU, Robertson, NEVER did study engineering at any university worldwide.

      I am a retired engineer and I am perfectly able to make the difference between my past reality and your permanent showing off!

      J.-P. D.

      • Gordon Robertson says:

        binny…”I am a retired engineer …”

        That’s a typo. Obviously you meant a retarded engineer. Did you drive locomotives? You obviously did not study physics.

    • Bindidon says:

      Robertson

      ” All you do is appeal to authority from scientists of long ago who lacked the proper telemetry to see that the Moon cannot rotate about a local axis. ”

      You are a really dense and absolutely ignorant, contrarian person.

      I don’t want to pollute this thread. Look at all my posts in the April temperature thread, and you will see a lot of references to today’s work you would never be able to understand.

      J.-P. D.

      • Gordon Robertson says:

        binny…”You are a really dense and absolutely ignorant, contrarian person”.

        What’s your point? Are you trying to say we can’t be friends? I have several friends who are as you describe. They call me an idiot (when they are being nice) and we laugh about it as I skewer them in some other way.

        Heck, I even call myself an idiot, sometimes several times a day.

    • Svante says:

      A radial line from the moon does not point at earth.
      Sometimes it’s ahead, sometimes behind.
      Our change of view angle can only account for a quarter of it.

      Distance: 384400 km.
      Earth radius: 6371 km.
      Angle: 2*0.95 deg.

      • Svante says:

        That was for Gordon to ponder.

      • Gordon Robertson says:

        svante…”A radial line from the moon does not point at earth.
        Sometimes its ahead, sometimes behind”.

        We covered that already, were you sleeping? The orbit is slightly elliptical, not enough to make a significant difference. If you want to treat it as an ellipse then the radial line is found by drawing lines from each focal point to the orbiting object and bisecting the line. You’ll find there is not much change in Earth’s gravitational force, not enough to be significant.

        The radial line is always perpendicular to the tangent line at any point in the orbit. For most of the orbit around the Earth side of the ellipse the radial line will be close enough to be perpendicular and point to the Earth’s centre. At the other extreme, it won’t be that far off.

        Besides, to clarify matters, I presumed a circular orbit. I don’t care if its round or slightly elliptical, the point is that in the radial line portion through the Moon, all points along that line will be moving in concentric circles (circular orbit) or in elliptical orbits (slight ellipse).

        In the circular orbit near the Earth foci of the ellipse, gravitational force will be directed straight onto the Moon. At the other extreme, that force will be on a slight angle and the sine/cosine component of the force will act on the Moon. That will elongate the elliptical orbit at the far end foci but it won’t apply a torque to the Moon to rotate it in any way.

        If it means that much to you, calculate the real, elliptical orbit and draw lines from the Moon to each foci, Bisect the line and you have your radial component.

      • Gordon Robertson says:

        svante …the angle we are concerned with is the difference between a radial line component of gravitational force in a circular orbit and the equivalent radial line component in a slightly elliptical orbit. In other words, how much does the radial component at the opposite end of the ellipse from Earth vary from the component in the circular end of the orbit at the Earth foci end.

        As far as view angle is concerned don’t forget the complexity of the problem. The Earth is tilted 23 degrees to its orbital plane and the Moon orbital plane is tilted 5 degrees to the Earth’s orbital plane. You can’t work it out from an x-y coordinate system.

      • Svante says:

        Gordon says:
        “The radial line is always perpendicular to the tangent line at any point in the orbit.”

        No. Because lunar rotation is not synchronized with its orbital speed. The rotation is steady but its orbital speed varies.

        • Gordon Robertson says:

          svante…”Gordon says:
          The radial line is always perpendicular to the tangent line at any point in the orbit.

          No. Because lunar rotation is not synchronized with its orbital speed. The rotation is steady but its orbital speed varies”.

          ***

          What are you saying ‘no’ to? A radial line must always be perpendicular to the tangent line at any point on a curve. That’s because the tangent is an emulation of the tangent line to a circle that fits the curve at that point.

          There is no rotation, how can it be steady? You are mistaking a rotating line through the Moon with the radial line of which it is apart. If you extend the radial line to the Earth, the line through the Moon no longer rotates. You can see plainly that the line through the Moon is an extension of a rotating line, just like the string attached to a ball that is orbiting someone’s head.

          The radial line from the Earth is rotating about the Earth’s centre, however, the portion going through the Moon is not rotating internally around the lunar axis.

          Come on, Svante, I know you can get this.

          • Svante says:

            Gordon Robertson says:
            “A radial line must always be perpendicular to the tangent line at any point on a curve.”

            Not if it’s going from the centre of the moon through a fixed point on its surface.

            If it’s not through a fixed point it’s pretty useless for determining rotation, isn’t it?

          • Gordon Robertson says:

            svante…”Gordon Robertson says:
            A radial line must always be perpendicular to the tangent line at any point on a curve.

            Not if its going from the centre of the moon through a fixed point on its surface.

            If its not through a fixed point its pretty useless for determining rotation, isnt it?”

            *****

            The radial line is a vector representing the “component” of the gravitational force affecting the Moon. It does not imply that a force is being applied in that direction. Obviously, gravity is acting along a straight line between the Earth and the Moon no matter where the Moon is in its elliptical orbit. However, when you work out a problem where a force is acting at an angle, you break the force into it’s component parts using a right triangle.

            For example, suppose a mass of 1 Kg is sliding down an incline with no friction at 30 degrees to the horizontal. If you make a freebody diagram of that, you create a vertical vector called Fg = mg = 1kg x 9.8m/s^2. That’s the vertical force acting on the mass.

            It’s laid out here for visualization.

            http://hyperphysics.phy-astr.gsu.edu/hbase/mincl.html

            You can see they have broken Fg into two component vectors, one down the ramp called mg.sin(theta) and the other perpendicular to the ramp as mg.cos(theta), where theta is the 30 degree angle of the incline.

            They do that despite the fact that only one force is acting vertically. Obviously, however, if the ramp’s degree of incline increases, there appears to be a greater force component down the ramp since the mass accelerates more as the incline increases. There is no real force component acting down the ramp just the vertical Fg acting vertically.

            The sine of 30 degrees = 0.5, which means half the gravitational force appears to be applied down the incline and about 0.87 into the ramp. Remember, Fg is a resultant therefore the two values don’t add mathematically.

            It’s the same with the Moon. If the Earth has a force Fg acting on the Moon with a hypothetical circular orbit, then Fg acts full-force. However, on a more eccentric part of an elliptical orbit, the radial line is shifted slightly and the full force has to be broken into components as with the incline.

            Suppose the angle between the full-force vector and the shifted component is 1 degree. Then sin 1 degree = 0.0175. We have to be careful here as to how the angle is calculated. On the incline it was straight-forward, we simply dropped a normal component perpendicular to the ramp and another along the ramp, with Fg as hypotenuse. In this case, the triangle is inverted so it’s the cosine quantity we use as the multiplier.

            If you want to work it out for yourself, draw a fairly accurate ellipse with the Earth at one focal point. Put the Moon at the an eccentric part of the ellipse and join it to the Earth with a straight line. Call that line Fg. Now draw two lines from either focal point to the Moon and bisect that angle. The bisector is now the radial line.

            Complete the right angle triangle by drawing a line perpendicular to the radial line back to the Earth. The angle required is now the angle between the radial line and the direct line Earth to Moon (Fg). Since cosine = adjacent /hypotenuse, that ratio gives you the multiplier to calculate the F component along the radial line.

            Suppose the angle is 1 degree.

            cos 1 degree = 0.9998

            The radial force component would only reduce Fg by a tiny amount with 0.9998 as multiplier. However, it is enough in certain parts of an elliptical orbit to allow the Moon’s momentum to have a greater impact and elongate the orbit.

            If the Moon’s momentum was high enough, the Moon would break free but Fg is still strong enough to turn it back into the elliptical orbit.

            Since the Moon’s momentum is in a linear direction it looks to us as if the Moon is moving away from us on an elliptical orbit, allowing us to see a little more around the edge of the near face. If the orbit was circular, you would not see that effect.

          • Svante says:

            I see, your radial line is irrelevant because it not fixed to the moons rotation, i.e. to fixed point at its surface.

            A fixed radial line will point ahead/behind Earth.
            It will not be perpendicular to the orbit.

            Lunar libration amplitude:
            1) Diurnal: 1 [deg].
            2) Longitudinal: 8 [deg].
            3) Latitudinal: 7 [deg].

            Cause:
            1) View angle.
            2) Rotational speed is steady, orbital speed varies.
            3) Rotation is not aligned with the orbit.

            Contrary to what you suggested before, inclination will not change 1), because the Earth radius is the same.

  36. Eben says:

    skip the flat mooners never ending demented debate, and check new climate shystering 101 update
    https://bit.ly/37BikIp

    • Gordon Robertson says:

      bdg …re MBH using one tree. Here’s an example where two trees were used:

      See page 12 of 18, in fact, read the whole thing, it is an account of how the hockey stick was destroyed by the people who destroyed it. Also, it reveals Mann’s amateur status as a scientist:

      https://web.archive.org/web/20160303213538/http://www.uoguelph.ca/~rmckitri/research/APEC-hockey.pdf

      “Another oddity in MBH98 is that some series are duplicated within the data base. One of these, the Gaspé “northern treeline” series14 is included as a separate proxy (treeline #11) but it is also in the NOAMER PC collation as cana036. The data begin in 1404, but the chronology is based on only one tree up to 1421 and only 2 trees up to 1447. Dendrochronologists do not use site data where only one or two (or zero!) trees are sampled…”

      It is revealed in the article that Mann got the hockey stick blade using the bristle cone series in North America for the 20th century. NAS told them in an investigation that the bristecone proxy could not be used.

      “If the flawed bristlecone pine series are removed, the hockey stick disappears regardless of how the PCs are calculated and regardless of how many are included. The hockey stick shape is not global, it is a local phenomenon associated with eccentric proxies. Mann discovered this long ago and never reported it”.

      A comment from Richard Muller [bottom p.14 – top p.15] of the Berkeley-Earth study. Svante will love this since Mueller is one of the authorities to whom he appeals. Poor old Svante will tie himself in knots trying to get out of this one:

      “[The findings] hit me like a bombshell, and I suspect it is having the same effect on many others. Suddenly the hockey stick, the poster-child of the global warming community, turns out to be an artifact of poor mathematics”.

      All in all, the hockey stick was a travesty of science.

      • Gordon Robertson says:

        Here’s another article revealing more of Mann’s chicanery and incompetence:

        https://www.rossmckitrick.com/uploads/4/8/0/8/4808045/hockey-stick-retrospective.pdf

      • Galaxie500 says:

        Quoting

        In an article on the RealClimate blog on various myths about the graph, Mann mentioned Muller’s article as parroting the claims of McIntyre and McKitrick. Muller’s opinion piece in the reputable MIT journal helped to spread the idea that the hockey stick shape was a statistical artifact, but several peer reviewed studies showed that the PCA methodology had little effect on the shape of the graph. By 2006 there was general acceptance of the conclusion of the graph that recent warming was unprecedented in 1,000 years.

        • Eben says:

          Yeah , it was easy , all they needed was this tool

          https://i.postimg.cc/2ym49KbN/adjustmentkit.jpg

        • Gordon Robertson says:

          galaxie…” several peer reviewed studies showed that the PCA methodology had little effect on the shape of the graph”.

          1)realclimate is owned in part by Mann.

          2)The National Academy of Science, along with statistical expert Wegmann were asked to investigate and both backed McIntyre and McKitrick’s claims about the methodology. Mann et al had used pine tree bristlecone largely from North America, to skew the overall result to get a hockey stick shape.

          NAS told them they should not have used pine bristlecone and limited the scope of their study to 1400 onward. Without that bristlecone the hockey stick disappears. The IPCC went even further, limiting it from 1850 onward in what is now known as the spaghetti graph since there are so many error bars in it. It did re-install the Medieval Warm Period and the Little Ice Age, which MBH98/99 omitted to get a flatter handle.

          The irony is that the IPCC showed a figure in their 1st report in which the Medieval warm period is shown as considerable warmer than today. Then they ignored their own review and published the hockey stick with neither the MWP or the Little Ice Age. They also almost completely ignored satellite data.

          Wegmann was particularly scathing of the statistical analysis, going so far as to criticize section 9 of the IPCC TAR review. He claimed they were all friends of Mann and cited only the work of each other. When Susan Solomon, an IPCC poobah, asked them to investigate the hockey stick, they refused. Talk about nepotism and corruption.

          MBH authors did not rebut Wegmann’s criticism they attacked him for plagiarizing their works. Are they that stupid and desperate? How can you charge someone who is investigating you when they quote from your papers in their investigation?

          The studies to which you refer that support the chicanery were initiated by Wahl and Amman, students of Mann. I’ll bet any other support he got were from insiders like that.

          It was revealed that Mann did not know a lot about statistical analysis and he didn’t care. He did not think it was that important.

          • Galaxie500 says:

            The original graph of the MWP in Ipcc 1st report was a schematic based on one central location in the UK. The shape of the graph changed subsequently because data was used from all over the Northern Hemisphere. No need to appeal to conspiracy theories.

        • Gordon Robertson says:

          galaxie…”In an article on the RealClimate blog on various myths about the graph, Mann mentioned Mullers article as parroting the claims of McIntyre and McKitrick.”

          Let’s get something clear about Mann. He is a geologist who knows little about statistical analysis and he admitted he did not care. At the time he participated in MBH98 he had just received his Ph D. He did not think it important because he had seen other studies use similar methodology. Is he that stupid, did he not understand that the studies he emulated were wrong?

          Mann has contributed very little to science. He did another study with Stieg in which they claimed Antarctica had shown warming over the past 50 years. One of the stations from which they cited data was under 4 feet of snow. It turns out, they interpolated the warming in a small part of the Antarctic panhandle incorrectly to get an overall warming for the continent. This guy is a comedian, along the lines of Inspector Clouseau, but in no way as endearing.

          Now he is in the National Academy of Science, and for what reason? It’s because his climate science buddies forced their way into NAS and took over. There’s no way any scientific work done by Mann has merited his induction into NAS. AFAIC, NAS is now kaput for inducting someone of Mann’s abilities. It is now a climate science old boy’s club.

          • Svante says:

            Gordon says: “He is a geologist”

            Michael Mann, Education:
            1998 Ph.D. Yale University, Department of Geology & Geophysics
            1991 M.Phil. Yale University, Department of Physics
            1991 M.S. Yale University, Department of Physics
            1989 A.B. (double), University of California-Berkeley, Applied Math, Physics (Honors)

            His PhD thesis was “A study of ocean-atmosphere interaction and low-frequency variability of the climate system”, and was awarded the Phillip M. Orville Prize for outstanding dissertation in the earth sciences in the following year.

            That’s geophysics:
            https://en.wikipedia.org/wiki/Geophysics

          • Gordon Robertson says:

            svante…”1989 A.B. (double), University of California-Berkeley, Applied Math, Physics (Honors)”

            It’s even worse than I thought, his undergrad work is in mathematics. That means he did no preparatory work in physics and has likely worked his way through physics departments as a modeler, like Gavin Schmidt.

            Geophycist/geologist same thing, neither have a clue about climate science other than in very localized areas.

            John Christy has a full degree in climate science and Roy in meteorology yet the mathematicians Mann and Schmidt talk down their noses and John and Roy.

          • Svante says:

            Gordon Robertson says:

            “Its even worse than I thought, his undergrad work is in mathematics.”

            So your slander is based on ignorance.

            Look again, it says mathematics and physics.
            Then more physics and Geophysics:

            Geophysics is a subject of natural science concerned with the physical processes and physical properties of the Earth and its surrounding space environment, […] includes the water cycle including snow and ice; fluid dynamics of the oceans and the atmosphere; electricity and magnetism in the ionosphere and magnetosphere and solar-terrestrial relations

          • Gordon Robertson says:

            svante…”Look again, it says mathematics and physics”.

            Yes…the undergrad degree is in mathematics meaning he did not study physics as an undergrad. Ergo, his field is applied mathematics with some geology thrown in.

            He is associated with the physics department, likely as a modeler. A real physicist would not be caught dead working on tree ring proxy studies but a geologist might.

          • Svante says:

            “likely as a modeler.”

            Why do you slander him when you’re just ignorant?

      • Svante says:

        Gordon Robertson says:
        “Svante will love this since Mueller is one of the authorities to whom he appeals.”
        Quite right Gordon.

        Muller was really upset and decided to find out himself.
        The result summarizes the whole climate issue in five minutes:
        https://www.youtube.com/watch?v=kTk8Dhr15Kw

  37. Dr Roys Emergency Moderation Team says:

    Only 260 comments…lame. Maybe you guys should try talking about something interesting? Nearly 4000 comments over on the other article…

    • Eben says:

      I hope Dr. Roy Spencer notice your only objective here is to troll and flood this place with garbage and gets rid of you

      • Dr Roys Emergency Moderation Team says:

        Enjoy your wasted time shouting at the alarmist majority that rule this blog.

      • Gordon Robertson says:

        eben…”I hope Dr. Roy Spencer notice your only objective here is to troll and flood this place with garbage and gets rid of you”

        In that case, you should be first in line to be banned.

        • Eben says:

          I don’t know how he slipped through the last troll purge, but it was a big mistake

          • Dr Roys Emergency Moderation Team says:

            Simple. I am not a troll.

            I am only responsible for my comments on the moon issue. The other thousands of comments come from the people that choose to write them, of their own accord, due to their own interest in it. Try not to be upset that people demonstrate more interest in that subject than the topic of the thread. Just the way it is.

          • Nate says:

            hahahahahaha…riiight

          • Bindidon says:

            Nate

            Unfortunately, Mr Spencer’s blog server software gave a HTTP 403 exception as I tried to download the complete UAH April 2020 thread using ftp or wget commands.

            ‘Copy and paste’ didn’t work, takes too much time.

            What a pity!

            So we can’t generate a weighted list of that thread’s posters… I wouldn’t wonder if Pseudomod appeared at top of the list!

            J.-P. D.

          • Dr Roys Emergency Moderation Team says:

            Yes, I expect I am top of the list. But there are Spinners on that thread with 100s of comments each. I am not responsible for their interest in commenting. It is their choice to comment, end of story.

          • Svante says:

            Quite. bill hunter wins the ‘stupid’ category.

            New: 0 , total: 3984 , latest: 2020-06-16 15:48:00
            No. Words Avg Unique% Stupid Name
            795 22870 28 7.6 4 Dr Roys Emergency Moderation Team
            567 84451 148 7.1 19 bill hunter
            387 25798 66 8.9 0 Ball4
            335 22333 66 12.9 0 Nate
            279 13916 49 12.3 7 bobdroege
            236 21299 90 10.9 0 bdgwx
            196 10960 55 13.6 4 ClintR
            187 32152 171 11.8 10 Gordon Robertson
            180 5104 28 24.7 0 Svante
            150 16253 108 17.2 12 Bindidon
            114 9087 79 23.0 1 barry
            78 9405 120 18.4 1 E. Swanson
            52 7129 137 16.9 0 Tim Folkerts
            45 8535 189 17.1 5 Norman
            42 1769 42 35.4 1 Eben
            40 3506 87 33.1 0 Elliott Bignell

          • Dr Roys Emergency Moderation Team says:

            Seems I am pretty concise. Ball4 wrote more words than I did, and my average number of words per comment is joint lowest.

            Plus, if you removed the “please stop trolling” comments and all the times I had to repeat comments due to various idiots, my total number of comments would be lower also.

            Happy with that.

            You can blame me all you want, but I am not responsible for the Spinners choosing to write those thousands of words. That’s entirely up to them.

          • Gordon Robertson says:

            binny…”So we can’t generate a weighted list of that thread’s posters…”

            What is it with you Teutons and this control fetish? You personally have a fetish about appeals to authority and now you want to control who can disagree with you and who cannot.

          • Svante says:

            Gallic rather than Teutonic I think.

          • barry says:

            What persecution complex one must have to believe that a commenter on a blog with no control of the blog can control comments on the blog. Stop mewling, Gordon.

          • Dr Roys Emergency Moderation Team says:

            What persecution complex one must have to believe that a commenter on a blog with no control of the blog can control comments on the blog. Stop mewling, Eben.

          • Nate says:

            Good Svante. Need another category.

            % of posts containing a made-up fact.

            DREMT > 50 %

            Bill > 80%

          • Svante says:

            Gordon 90%.

          • Dr Roys Emergency Moderation Team says:

            What facts did I make up, Svante?

          • Svante says:

            Heat transfer without temperature difference, for a start.

          • Dr Roys Emergency Moderation Team says:

            A link to the comment where I made the claim that heat flows without a temperature difference, please.

          • Svante says:

            Better up, an image.
            Your miracle heat transfer occurs between the plates here:
            https://postimg.cc/KKx5hx4H

          • Dr Roys Emergency Moderation Team says:

            So you could not link to a comment where I made the claim you suggested I had made. What you have is your own interpretation of a link to a diagram which was not even posted during the discussion we are talking about.

          • Svante says:

            https://tinyurl.com/y7yx57ok

            “there is 400 watts entering the system and 400 watts going out with temperatures at 244 K…244 K…244 K”

            As depicted by the the image.

          • Dr Roys Emergency Moderation Team says:

            So where do I say that heat is flowing without a temperature difference? And your link to my comment is from a different discussion to the one we are talking about.

            We are discussing the 4000+ comment thread from a month or so ago.

            What facts did I make up, Svante?

          • Svante says:

            Heat is net energy. You have net 400 W from blue to green.

          • Dr Roys Emergency Moderation Team says:

            What facts did I make up, Svante?

          • Svante says:

            That a net 400 W will flow between plates of the same temperature.

          • Dr Roys Emergency Moderation Team says:

            You are changing your misrepresentation of that argument with every comment…

            …however, that is from the wrong discussion.

            The 4,000+ comment thread:

            What facts did I make up, Svante?

          • Nate says:

            A small sampling of DREMT made up facts:

            Newtons cannonball must keep one face to the Earth.

            Cannonball doesnt need torque to begin rotation.

            Cannonball does need torque to begin rotation but gravity provides it.

            Moon only has orbital angular momentum.

            Moon not rotating on its axis.

            Moon libration can be explained without Moon’s independent rotation on its axis.

          • Dr Roys Emergency Moderation Team says:

            #2

            You are changing your misrepresentation of that argument with every comment

            however, that is from the wrong discussion.

            The 4,000+ comment thread:

            What facts did I make up, Svante?

          • Svante says:

            Another great one:
            Surrounding temperature can’t influence a warmer object.

          • Dr Roys Emergency Moderation Team says:

            All you have are misrepresentations, Svante. No quotes that support what you think I am saying. And nothing that is even from the right discussion.

          • Nate says:

            Given that DREMT responds to me when he feels like he has a good answer, this is telling…

          • Dr Roys Emergency Moderation Team says:

            #2

            All you have are misrepresentations, Svante. No quotes that support what you think I am saying. And nothing that is even from the right discussion.

          • Svante says:

            “No GHE”, remember:
            https://tinyurl.com/y72g3uas

          • Dr Roys Emergency Moderation Team says:

            I’m not stating “no GHE” as though it’s some one-off fact, “no GHE” is a position built up from dozens of arguments over many years, from many different sources and lines of evidence.

            So you still have not been able to come up with one single fact I have supposedly made up. You come out with this stuff but you can never back it up.

          • Svante says:

            I’m glad you don’t stand by that ridiculous GPE diagram,
            with all plates at 244 K.

          • Dr Roys Emergency Moderation Team says:

            You come out with this stuff but you can never back it up.

          • Svante says:

            Straight answers are not conducive to your goal here.

          • Dr Roys Emergency Moderation Team says:

            So you still have not been able to come up with one single fact I have supposedly made up. You come out with this stuff but you can never back it up.

          • Svante says:

            You’re only here to create confusion.

          • Dr Roys Emergency Moderation Team says:

            So now you switch to a different lie about me.

    • Eben says:

      Nothing to do with censoring but who is getting all the money

      https://i.postimg.cc/T1NGPds7/grants-thumb.jpg

      • Bindidon says:

        Typical, dumb Eben polemics.

        One day you will hopefully understand that you polemic and insulting behavior very efficiently hides your possibly correct and interesting message.

        Bis dahin
        J.-P. D.

    • Gordon Robertson says:

      nate…”You guys cant win on the science facts. What to do?
      Censor them”.

      Great!!! Finally, some sense in Washington. Get rid of the pseudo-scientists and get some real scientists in there. Next we need a purge of NOAA to get rid of the fudging modelers.

      • bdgwx says:

        GR, the TLT-TLS trend is often called the GHG fingerprint. UAH has +0.42C/decade for this trend. RSS has +0.43C/decade. That’s a pretty close match and UAH is not affiliated with NOAA.

        • Gordon Robertson says:

          bdg…”UAH has +0.42C/decade for this trend. RSS has +0.43C/decade. Thats a pretty close match and UAH is not affiliated with NOAA”.

          RSS must be under new management, either that or they have realized the error of their ways. They seemed to be joining the fudgers at NOAA and ramping up the global warming figures. Good to know they are back, unless you are mistaken.

          • Eben says:

            Unfortunately Trump got too busy and sidetracked with other problems, I think in his second term the first thing he will do is stop the climate shystering dead in its tracks

          • barry says:

            Gordon, what was the previous TLT-TLS trend for RSS that you appear to be implying was mch different?

          • Gordon Robertson says:

            barry…”what was the previous TLT-TLS trend for RSS that you appear to be implying was mch different?”

            Barry plays dumb again. I breathlessly await his obfuscated explanation.

            https://wattsupwiththat.com/2018/10/16/the-new-rss-tlt-data-is-unbelievable-or-would-that-be-better-said-not-believable-a-quick-introduction/

            http://www.drroyspencer.com/2017/07/comments-on-the-new-rss-lower-tropospheric-temperature-dataset/

            “Our [UAH] globally-averaged trend is now about +0.12 C/decade, while the new RSS trend has increased to about +0.17 C/decade”.

          • Svante says:

            UAH is at 0.14 now (weighted at higher altitude than RSS).

          • bdgwx says:

            GR…so why is UAH TLT-TLS +0.42 C/decade?

          • barry says:

            Gordon, I’ll ask my question again, as you did not seem to understand it. I’ll spell it out a bit more.

            What was the previous TLT MINUS TLS trend for RSS that you seem to be implying was much different.

            Or did you not understand that was what bdgwx was referring to when you replied to their post?

          • Gordon Robertson says:

            bdg…”GR…so why is UAH TLT-TLS +0.42 C/decade?”

            It has been skewed the past decade by the extreme 2016 El Nino and a slow recovery. Also, I think NOAA is intercepting the UAH data and running it through a warming algorithm. It’s their satellite data and until I see it confirmed that UAH gets that data directly from the sats I suspect NOAA of the same chicanery they are using on the surface data.

          • barry says:

            Apparently Gordon doesn’t realize that RSS and UAH each receive the same satellite data. There is no ‘intercepting’ going on. Roy Spencer has direct access to the data.

            http://www.drroyspencer.com/2010/01/how-the-uah-global-temperatures-are-produced/

            What a fantasy world Gordon lives in. Cloak and dagger and intercepts.

            He still hasn’t quite worked out that the trend we’re mentioning isn’t the TLT trend.

            He has no idea if the ‘previous’ TLT-TLS trend was any different, despite saying it was, which is why he has just avoided responding to that point.

            Sometimes I can’t bring myself to reply directly to him. This level of wilful, obstinate stupidity is hard to treat with respect.

          • bdgwx says:

            The amount of misinformation and unsubstantiated accusations that is being brazenly posted and allowed in the comments section of this blog almost defies credulity.

          • Bindidon says:

            Robertson

            ” Also, I think NOAA is intercepting the UAH data and running it through a warming algorithm. It’s their satellite data and until I see it confirmed that UAH gets that data directly from the sats I suspect NOAA of the same chicanery they are using on the surface data. ”

            *
            You still are the worst informed and most lying person posting here.

            There is here only one chicanery here, and that is YOURS.

            Disgusting.

            J.-P. D.

          • Dr Roys Emergency Moderation Team says:

            “The amount of misinformation and unsubstantiated accusations that is being brazenly posted and allowed in the comments section of this blog almost defies credulity.”

            True, but we do our best to set you people straight, bdgwx.

          • Gordon Robertson says:

            barry…I don’t see anything in the article at the link you provided that verifies Roy has direct access to the data.

            The article confirms a question I raised a while back about the accuracy of the cold temperature set point, whether it could vary enough to skew the temperature readings by a fraction of a degree. It is estimated to be a few degrees above 0K for deep space but the space between Sun and Earth is full of hot plasma (electrons and protons) from the Sun. How do we know the solar wind, as the plasma is called, does not vary in temperature and affect the cold set point?

            The article also reveals that the satellite bodies change temperature and that causes the instruments to change temperature. Roy referred to the oscillators that supply critical reference signals. Normally, oscillators can be compensated for temperature drift.

            In a colour TV, the colour oscillator runs at about 3.58 Mhz. If it was to vary slightly, face colours on the screen would change tints. Although I think the sat temps are pretty accurate, especially since John Christy has compared them altitude-wise to radiosondes, I still wonder if the recent warming in the sat record is being caused by external influences.

            There is really no reason why that warming should be consistently there after over 30 years of it not being there. Something is wrong and I still suspect NOAA of tampering with the data. They had no qualms about tampering with surface data, even retroactively. I think they are climate alarmists who would stop at nothing to show continual warming.

          • bdgwx says:

            GR, what dataset do you trust and use to compare all other datasets too and to make statements like “There is really no reason why that warming should be consistently there after over 30 years of it not being there.”

          • Eben says:

            There is nothing wrong with your computer set. Do not attempt to adjust the data. We control the horizontal. We control the vertical We are controlling the transmission.

          • Gordon Robertson says:

            bdg…”“There is really no reason why that warming should be consistently there after over 30 years of it not being there.””

            I have tried to clarify this statement several times. From 1979 – about 1997, there was a trend measuring a recovery from cooling. Then from 1998 – 2012, as admitted by the IPCC, there was no trend. UAH shows that flat trend extending to 2015.

            UAH offered a statistical trend of about 0.12C/decade over that range even though there was no clear trend. You cannot call a 18 year flat trend a 0.12C/decade trend. Obviously the end points were plugged into an algorithm and the trend was calculated mathematically.

            That is not a knock on UAH since they are following a standard protocol in science to derive trends using data points without explaining what the trend means. UAH did offer an explanation in the 33 year report. They pointed out that the anomalies were largely below the baseline from 1979 – about 1997 due to aerosol cooling. If the cooling factor was removed, UAH offered a trend of 0.09C/decade.

            UAH also revealed that true warming did not occur till the 1998 El Nino drove anomalies positive. For some reason, following the decline of the EN below the baseline, the temps rebounding nearly 0.2C for no known reason and the average remained there till 2015. The same kind of mysterious jump occurred circa 1973, later to be identified as the Pacific Decadal Oscillation. For all we know, the current warming is related to ocean oscillations.

            The trend you are claiming is due to the 2016 EN, which has not subsided as rapidly as the 1998 EN. Since the temps raising the trend to your level have occurred since 2016, it is ingenuous to claim that trend represents the entire range of the UAH record.

            What I meant in my statement above is that ‘based on the UAH record’, 30 years of it have been either below the baseline or a flat trend. The 0.12C/decade trend is represented by 18 years of anomalies below the baseline, which NOAA defines as cooling, and 18 years of a flat trend.

            I do understand that the UAH record is only 41 years long and that absolute temps are likely still showing a warming, however, I think the warming is best explained as a recovery from the Little Ice Age and that it is pretty well finished. I think the claim that CO2 is warming the atmosphere is pseudo-science.

          • Gordon Robertson says:

            binny…”You still are the worst informed and most lying person posting here”.

            Do you have a peer reviewed paper to prove I am wrong? NOAA has admitted to using less than 1500 surface stations to form their surface data sets and to using climate models to synthesize data from adjacent stations. They fabricated a trend from 1998 – 2012, where the IPCC had reported no trend, by fudging the SST to produce a trend.

            The UAH record has been a thorn in the side of NOAA, GISS, Had-crut, and the IPCC. I am sure they would love to muzzle UAH and I don’t think it is beyond them, given the revelations of the Climategate emails, to mess with the satellite data before UAH gets it.

          • Gordon Robertson says:

            barry…”Sometimes I cant bring myself to reply directly to him. This level of wilful, obstinate stupidity is hard to treat with respect”.

            Yes, Barry, you are definitely a candidate for a cult, like Scientology. You would eat it up with your innate need to appeal to authority. You can’t even bring yourself to look at the shenanigans of NOAA, even when they admit on their site to slashing the number of reporting surface stations to less than 1500.

            You have to dig a little deeper to see how they manage to cover 30% of the planet with less than 1500 stations. The surface area of the Earth is about 510 million km^2 with the land surface area = 148,940,000 km^2 and the oceans = 361,132,000 km^2. That means NOAA uses 1 thermometer to cover about 100,000 km^2 of the solid surface.

            But hey, we know they don’t go out into the Siberian wasteland to measure temperatures, they get most of them where it is convenient, right in the good,old US of A. We know they can’t go into China at will and set up stations, and that many parts of the world are still not accessible to them.

            The Canadian Arctic is 3,535 million km^2 and NOAA uses 1 thermometer to cover the entire area. Would not want the global average to be affected by a cooler/colder area. They use 3 thermometers to cover California, with an area of 423,970 km^2 and they are all located near the ocean. Not one covering the cooler Sierra Nevada Mountains.

            No one knows how NOAA covers the oceans, which cover 70% of the planet. We have heard about thermometers inserted in buckets of water drawn from the ocean aboard ships or in the warmer seawater intake manifolds, about Argo buoys, and so on, but come on, in reality, what does all that mean?

            NOAA does not care, they have pretty well abandoned science for the virtual variety where temperatures are guestimated using climate models. Science does not matter to NOAA or GISS anymore, they can calculate and fudge temperatures to their hearts’ desire using models.

            They are all climate alarmists and as one of them put it in the Climategate emails, it’s all about ‘The Cause’. The Cause is a reference to the methods used to enforce anthropogenic warming theory and NOAA, GISS, and Had-crut are right in the middle of the chicanery.

            They are so crooked they do what they can to discredit the only honest outfit among them, UAH. Whether that means blocking papers from John Christy to IPCC reviews, discrediting the sat data by stifling it in the reviews, creating false theories about errors in UAH sat data, and possibly messing with the sat data, they don’t care.

            And here you are, like a smug b***ard, using the UAH blog to spread your alarmist crap while trying to insult a supporter of UAH. Heard it all before Barry, and all you alarmists are pathetic dogmatists who can’t even figure out that the Moon does not rotate on its axis.

          • barry says:

            Gordon says:

            “barry… I don’t see anything in the article at the link you provided that verifies Roy has direct access to the data.”

            Roy Spencer in the article:

            “The UAH global temperatures currently being produced come from the Advanced Microwave Sounding Unit (AMSU) flying on NASA’s Aqua satellite. AMSU is located on the bottom of the spacecraft (seen below); the AMSR-E instrument that I serve as the <b<U.S. Science Team Leader for is the one on top of the satellite with the big dish…

            POST-PROCESSING OF DATA AT UAH

            The millions of calibrated brightness temperature measurements are averaged in space and time, for instance monthly averages in 2.5 degree latitude bands. I have FORTRAN programs I have written to do this. I then pass the averages to John Christy, who inter-calibrates the different satellites’ AMSUs during periods when two or more satellites are operating (which is always the case).”

            Roy Spencer has worked directly with the satellite teams for years. He gets the raw. So does RSS.

            Your posit otherwise is pure fabrication, based on nothing but whatever results you don’t like. If it’s warm, it’s bogus, if it’s the coldest treed, then by God it’s good science. This is how your brain actually rates the validity of global temperature data sets. You concoct a cloak and dagger story to support your opinion because you don’t have anything of substance to back it up. Because you can’t explain technically why you believe UAH is superior, you need to invent stuff that is uncheckable. That is what conspiracy theorists do. They avoid positing anything concrete because that can be checked.

          • barry says:

            Gordon again:

            “You can’t even bring yourself to look at the shenanigans of NOAA, even when they admit on their site to slashing the number of reporting surface stations to less than 1500.”

            Seeing as you and I have discussed this topic at length on around 20 separate occassions over the past 3 years, and I’ve provided documentation and gone into great detail on it, also linking your favourite source and commenting on it at length, as well as bringing the source paper for station count…

            You telling me that I can’t bring myself to look at the topic reveals a woefully porous mind.

            But it makes sense to me regarding the overall trajectory of our conversation. You have said the same thing over and over for years, never deviating, and, importantly, never taking up and dealing with new information (such as Chiefio clarifying he didn’t mean to say that deletions had been deliberate).

            Perhaps you may remember a time, Gordon, when you were able to digest and process information that interfered with your opinion. I wonder if you have enough mind left to realize that this capacity is now lost to you. Do you realize that you’re not even dealing with new information contrary your belief system anymore? It’s just sliding off your mind like water on teflon. Are you conscious of that?

          • Nate says:

            “stop the climate shystering dead in its tracks”

            IOW full on censoring of science.

            Cuz, above all else, we really don’t want to know what the climate is actually doing.

          • Gordon Robertson says:

            barry…”Roy Spencer in the article:”

            I have known for a long time that Roy serves on the NASA team that sets up the AMSU units but at no time has he claimed he receives the data from the sats directly. The data is owned by NOAA and UAH had to ask for the data, which was being stored on tapes.

            Who was receiving that data so they could store it on tapes? It certainly was not UAH. Roy was not involved with the program when NOAA originally set up the sat program. It was the guy who designed the MSU units, long before the AMSU units were available. He would have been involved in the original data collection at NOAA.

            I have seen no evidence to prove that NOAA is not still receiving the data then passing it on to UAH. Do you think UAH and RSS receive the data independently directly to their facilities? I don’t think so.

  38. Tom Tucker says:

    I tried to send this to Dr Spencer via email but could not find a viable one. I hope I’m not contaminating your blog by using it to get him this message.
    Dear Dr Spencer,
    The Purdue Climate Change Center has been issuing Assessments of the future climate in Indiana and is currently holding a series of ZOOM sessions on “What Hoosiers Need to Know About Climate Change”.
    Ever since the first Assessment (9 of a planned 10 have been issued), I have been questioning the Director of the Center (Dr Jeff Dukes) via Letters to the Editor of my local paper about the projected temperature used as the basic input for the Assessments. They project and use “A rise of 5 to 6 degrees F by mid-century”. The Director has responded to my letters but avoids addressing this point. The last letter I wrote noted that I had challenged him three times to address it without a response. I have even written to Mitch Daniels, the President of Purdue, asking that the misleading Assessments by his Center be withdrawn because of this grossly exaggerated warming input.
    Last week I submitted a related question to the ZOOM session and the Director has given me a half-assed answer. Our latest exchange of e-mails are below”

    > Dear Hans,
    > I submitted a question to you via e-mail with the hope that it would be
    > addressed by Dr Dukes . At the 16 June session it was mentioned that an
    > e-mail question had been submitted but it would not be addressed until 18
    > June in the “Myths” session. You later explained that it was not addressed
    > because my registration was unclear (or something to that effect).
    > Again, it was not addressed in today’s session.
    > Perhaps it contained too much background or was too long for some other
    > reason. So, I will try to boil it down for Dr Dukes consideration.
    > Summary of my question.
    > As the basic input to all the Assessments being made by Purdue, it is
    > predicted that Indiana’s average temperature will rise by 5 to 6 degrees F
    > by mid-century.
    > Actual satellite based measurements of the earth’s temperature by the
    > University of Alabama-Huntsville for NASA starting in 1979 (more than 40
    > years ago) show a warming trend of 0.23 degrees F per decade.
    > In the 3.5 decades to 2050 this would indicate a rise of 0,8 degrees F.
    > Can you explain why you would use the higher projection (6.25 to
    > 7.5 times greater than measured data) as the basis for you
    > assessments?
    > Regards, Tom Tucker
    >
    On 6/19/20, Schmitz, Hans F wrote:
    > Tom,
    >
    > Jeff addresses your question beginning at 27:08 in the recording on YouTube
    > here: https://www.youtube.com/watch?v=gs7WRnzN4QA.
    >
    > Briefly, in words: Satellite-based measurements have their own issues that
    > may not be fully resolved at this time. Ground-based temperature monitoring
    > with thermometers has a lot more history and verification involved.
    > Ground-based monitoring consistently shows much more warming than
    > satellite-based measurements. Using ground-based monitoring as a basis for
    > modeling creates the warmer temperatures. Additionally, the Alabama data is
    > widely held as suspect in the scientific community. A full discussion is in
    > the video beginning at 27 minutes and 8 seconds.
    >
    > Thanks, and let me know if you have any further questions.
    Max

    Dr Spencer, I know that you would totally disagree with their using ground based data as a basis for models which are then used to create the projection. But what I particularly wanted you to see is the slanderous statement against UAH.
    Further, if you listen to Dr Dukes on the ZOOM session he says several derogatory things about you and UAH. Some are: Satellites need a lot of correction and are difficult to correct but UAH is particularly problematic, UAH has a lot of errors and corrections made are always toward lower temperatures, the principles at UAH are known skeptics.
    I’m an amateur at Global Warming. I got interested when I read Al Gore’s book and it was obvious how off base it was. I retired 28 years ago from Raytheon where I spent my whole career in the Anti-aircraft guided missile field. So I need help in forcing this biased Purdue Center to recant it’s misleading Assessments. I also thought you might be interested in replying to the slams again UAH.
    What say you, will you help?
    Sincerely, Tom Tucker

    >

    • bdgwx says:

      So I need help in forcing this biased Purdue Center to recant it’s misleading Assessments.

      How do you know it’s misleading?

  39. Gordon Robertson says:

    tom…”I know that you would totally disagree with their using ground based data as a basis for models which are then used to create the projection. But what I particularly wanted you to see is the slanderous statement against UAH”.

    It’s unlikely Roy will reply this late in the thread.

    There are all sorts of idiots…repeat,idiots…who lack the intelligence and courage to think for themselves. Climate alarmists are a peculiar type who appeal to authority, lacking the ability to understand what they have adopted as beliefs.

    There is no point debating them, that’s akin to debating a Jehovah’s Witness who knocks on your door. No matter what point you raise, or question you ask, they resort to quotations from the Bible. A JH refuses a blood transfusion, because a few lines in the Bible, referring mainly to animal blood, ‘seems’ to infer that blood is sacred. There is nothing in the Bible about blood transfusions, it is a looney idea introduced in 1945 at a JH convention.

    The alarmists with whom you are dealing are clearly stupid people who cannot discuss the science on their own. What they call science is unvalidated climate model propaganda based on computer programs programmed with at least two major errors that contradict basic physics. With those errors removed, the catastrophic temperatures to which you post refers disappear. Even the IPCC no longer projects such ridiculous temperatures.

    I don’t think every alarmist can be that stupid so many of them are lying. As climate modeler Stephen Schneider once pondered, is it the duty of scientists to lie to the public in their best interest? Many of these misguided idiots have other causes and they are clearly using green pseudo-science as a vehicle for their causes. The aim is clearly to scare people into accepting their dogma.

    As far as the surface record vs. UAH data, the keepers of the surface record, like NOAA, NASA GISS, and Had-crut are all climate alarmists who have abandoned science in the name of spreading lies about non-existent extreme warming. UAH data sets tell it like it is and they are not alarmists. That is a thorn in the side of the eco-loonies who have artificially elevated global temperatures to further the United Nations cause of universal taxation.

    It’s all political. The IPCC came from a political maneuver by ex-UK Prime Minister Margaret Thatcher. She needed a vehicle to counter striking coal miners and introduced the notion to the UN that coal emissions could lead to catastrophic global warming. They were stupid enough and desperate enough to accept her dogma without question because they saw it as their own political vehicle to collect taxes from member nations.

    When the UN set up the IPCC, with a mandate to only investigate anthropogenic warming, exempt from natural causes of warming, they installed a protege of Thatcher, John Houghton, as the first co-chair. Houghton was a dyed-in-the-wool climate modeler and he steered the IPCC in that direction away from legitimate science. That’s why you read ridiculous claims of catastrophic warming in the 4C – 6C range.

    Such extreme warming from a trace gas representing 0.04% of the atmosphere is absolute pseudo-science. There is no legitimate physics to back the claim.

    • Svante says:

      Why don’t you focus on CH4?
      It traps 84 times more heat per mass unit than CO2.

      • Gordon Robertson says:

        svante…”Why dont you focus on CH4? It traps 84 times more heat per mass unit than CO2″.

        The notion of methane heating the atmosphere is even more of a joke. It makes up 0.00017% of the atmosphere. That’s in the range of 1/10,000 of 1%.

        Neither methane nor CO2 traps heat. If anything both intercept a tiny fraction of infrared energy from the surface. EM is not heat and heat cannot be trapped unless you trap the atoms/molecules which have heat as a property.

        • Svante says:

          EM transfers heat.
          From surface to GHGs for example.

        • bdgwx says:

          Tambora released a measly 100 MtSO2. That makes up 0.000002% of the atmosphere. That’s in the range of 1/1,000,000 of 1%. And it caused the year without a summer.

      • Eben says:

        ” Svante says:
        June 21, 2020 at 1:57 AM

        Why dont you focus on CH4?
        It traps 84 times more heat per mass unit than CO2.”

        Why don’t you put your money where your ass is and stop emitting that methane

      • Eben says:

        “Why dont you focus on CH4?
        It traps 84 times more heat per mass unit than CO2.”

        why don’t you put your money where your a$$ is and stop emitting that methane

  40. Tom Tucker says:

    Gordon.
    Thanks for the reply. I still would like to hear from Dr Spencer,
    Tom

    • Gordon Robertson says:

      tom…best time to catch Roy is early in a new article. He posts one regularly near the beginning of each month for the monthly temperature series. Sometimes he posts a few articles in between.

    • E. Swanson says:

      Tom, I’ve attempted to ask Roy questions on this blog several times. He apparently won’t reply if he doesn’t like the question. FYI, HERE’s a Link to S & C’s latest paper which describes their current Version 6 processing. You might try the e-mail given in the contact info, if you haven’t already tried it.

      As you might have guessed by now, old Gordo is highly opinionated and doesn’t bother with reading the scientific publications.

  41. Nate says:

    Tom,

    If interested in the temperature at the surface, why would you use temperature thousands of meters above as your measure? And why cherry pick the one dataset with the lowest rise?

    The average rise of US Land temperatures in the last 50 y has been ~ 2.5 degrees F.

    https://tinyurl.com/yard47kz

    About the same for all NH land, and US upper midwest.

    • Gordon Robertson says:

      nate…”If interested in the temperature at the surface, why would you use temperature thousands of meters above as your measure? And why cherry pick the one dataset with the lowest rise?”

      Why do you offer such misleading information? There is a direct correlation between temperature and altitude in the atmosphere. If you know the average at a certain altitude you can extrapolate to lower altitudes.

      That has been verified for UAH data using radiosonde data. UAH has verified their surface record as being correct.

    • Nate says:

      Gordon, you know very well about RSS, and UW analyses of LT data. No science reason to ignore these.

      • Gordon Robertson says:

        nate…”you know very well about RSS, and UW analyses of LT data. No science reason to ignore these”.

        I know that UAH and RSS collaborated on satellite orbital errors circa 2005 and resolved them. They found that UAH was reading slightly high and that RSS was reading slightly low. I also know that U of W is full of climate alarmists like Stieg who are out to promote anthropogenic propaganda at the expense of real science.

  42. Tom Tucker says:

    Nate,
    Because I’m loking for a trend to make a projection into the future.
    Tom

    • Nate says:

      You can do that with the surface data set I showed you, and others.

    • Gordon Robertson says:

      tom…”Because Im loking for a trend to make a projection into the future”.

      The IPCC admitted in their Third Assessment Review that future climate states cannot be ‘predicted’. They tried it using climate models till expert reviewer Vincent Gray pointed out the obvious, that unvalidated models cannot ‘predict’. The IPCC were forced to concede the point and resorted to ‘project’ rather than ‘predict’.

      Don’t see how you can project anything temperature-wise.

      Having said that, covid19’s future behavior is being ‘predicted’ by pseudo-scientists using unvalidated models.

      • bdgwx says:

        For the lurkers…

        Specific climate states are in reference to specific values of specific properties at specific locations at specific moments in time. These cannot be predicted because of natural variation.

        This is different than mean values of properties on regional scales over long periods of time.

        For example…scientists cannot say that it will 93.4F at the surface in St. Louis on June 22nd 2050. But what they can predict is that is that temperature averaged over the entire global for one full year will higher in 2050.

        The IPCC quote above was taken out of context. I recommend that lurker read that entire section.

        • Gordon Robertson says:

          bdg…”But what they can predict is that is that temperature averaged over the entire global for one full year will higher in 2050″.

          They can’t ‘predict’ anything because they are using unvalidated models. Vincent Gray convinced the IPCC that the word predict is not applicable to unvalidated models and that’s why the IPCC now uses the word ‘project’.

          No one knows what the global average will be in 2050 for the same reason. The projections of a continued warming due to anthropogenic warming is a theory based largely on unvalidated model theory.

  43. Tom Tucker says:

    Gordon,
    Since you don’t think Dr Spencer will see this, I would like to get his attention some other way. I don’t think that incompetents like the Purdue Center should be able to slander him without a response better than I can give.
    Do you or anyone else on this blog have a direct email address for Dr Spencer?
    Tom

    • bdgwx says:

      Why email just Dr. Spencer? Why not solicit the opinion from many experts?

      • Gordon Robertson says:

        bdg…”Why email just Dr. Spencer? Why not solicit the opinion from many experts?”

        Tom explained it, they are slandering Roy, not the other so-called experts.

    • Bindidon says:

      Tom Tucker

      Please just have a look at the blog’s end.

      There you see an email address I used 4 years ago for asking him about UAH’s grid data, and got a friendly reply.

      J.-P. D.

  44. Tom Tucker says:

    bdgwx,
    Spencer and UAH are the ones that were bad-mouthed by Purdue.

    • Nate says:

      There are legitimate reasons to question the LT analysis. There is a genuine disagreement about how to do it correctly. Its trend has jumped up and down dramtically over the years with revisions of the analysis. It has had much greater variability than the global surface trends.

      • Gordon Robertson says:

        nate…”There are legitimate reasons to question the LT analysis. There is a genuine disagreement about how to do it correctly. Its trend has jumped up and down dramtically over the years with revisions of the analysis. It has had much greater variability than the global surface trends.”

        You should preface such propaganda with a disclaimer that you are an alarmist and that you have no interest in critiquing the out and out fudging of the surface record.

    • bdgwx says:

      Ah…gotcha. Yes. Dr. Spencer should have a chance to defend his work.

      But if you are interested in how predictions of Indiana’s surface temperature trajectory will behave in the future then you’ll want to consider all lines of evidence. And if the question is specifically with the recorded global mean temperature then understand that there are a dozen or more datasets that publish a global mean temperature. They should all be considered. And when considering them all we find that UAH is an outlier.

      • Gordon Robertson says:

        bdg…” And if the question is specifically with the recorded global mean temperature then understand that there are a dozen or more datasets that publish a global mean temperature.”

        Another alarmist comment. There is ample evidence that the surface records are all fudged and no evidence more damning than the Climategate email scandal in which those alarmists were caught:

        1)using a ‘trick’ to hide declining temperatures

        2)interfering with peer review in an attempt to block publication of papers from skeptics, like UAH.

        3)admitting to each other that the warming had stopped but not revealing that to the public.

        4)revealing their misogyny by making snide comments about a female climate scientist (Judith Curry) because she had become skeptical. One of them, Mann, went on to make sexist remarks about her.

        5)urging peers to boycott the attempt of Steve McIntyre to access Had-crut data via an appeal to the UK government for an independent audit.

        6)revealing there is a ‘Cause’ among them to promote climate alarm at the expense of skeptics.

        6)applauding the death of a skeptic, John Daly.

        No, Tom, you can’t rely on surface records at all due to the shady nature of the keepers of the records. They are now blatantly using climate models to fudge temperatures.

  45. Tom Tucker says:

    How much do you guys think Purdue’s projection that the average temperature in Indiana will “rise 5 to 6 degrees F by mid-century” is off?

    • bdgwx says:

      I don’t know…good question. I found the Purdue report here.

      https://ag.purdue.edu/indianaclimate/indiana-climate-report

      The 5F figure is for RCP4.5 (medium). The 6F figure is for RCP8.5 (high).

      Mid-century is defined as 2035-2065.

      Since 1960 the trend is +0.4F/decade. The warming up to 2016 is about 1.2F. 3’ish more decades of +0.4F/decade warming only brings you to 2.6F.

      I have to be honest…5F for RCP4.5 seems high to me.

    • Nate says:

      From what starting point?

      The temp record of one state is noisy as heck. Better to look at record of whole region to get an idea of climate trends, IMO. Here is Central Nat Weather Service Region Trend.

      https://tinyurl.com/yas4e2dp

      It is 5 degrees F/century since 1970.

      And it has lately been about 2.5 F above temps at the start of 20th century

    • Gordon Robertson says:

      tom…”How much do you guys think Purdues projection that the average temperature in Indiana will rise 5 to 6 degrees F by mid-century is off?”

      I’d say by about 5 to 6 degrees F (about 2.78C – 3.33C). I doubt if we will see much more warming since I think most of it is a re-warming from the Little Ice Age cooling. Akasofu predicted about 0.5C re-warming per century. By 2050 we’ll have 200 years since the end of the LIA, meaning warming should have reached 1C above the 1850 temps.

      The 5 to 6 degrees F comes from climate model theory in which alarmists have incorporated two key errors. One of the errors is claiming a 9 to 25% warming factor for CO2. Those numbers were picked out of a hat. The other is claiming a positive feedback that can warm the surface to a temperature higher than it is warmed by solar energy. That kind of PF required an amplifier and there is no amplifier for it in the atmosphere.

      We have seen less than 1C warming in over 1.5 centuries, why should we see 3 times that amount in 30 years? Alarmists are just plain weirdos who cannot let go of their pseudo-science. None of them have explained scientifically how a trace gas making up 0.04% of the atmosphere can warm it anymore than a tiny fraction of a degree C.

    • Gordon Robertson says:

      tom…”Projections show the pace picking up even more speed as heat-trapping gases, produced by humans burning fossil fuels, continue accumulating in the atmosphere”.

      You can tell those alarmists know nothing about physics based on this claim:

      “Projections show the pace picking up even more speed as heat-trapping gases, produced by humans burning fossil fuels, continue accumulating in the atmosphere”.

      There is no such thing as a heat-trapping gas. Heat is the kinetic energy of atoms, and in a gas, whether the atoms are singular or in molecular form, they cannot be trapped by other molecules.

      Gases like CO2 can capture a tiny amount of the infrared energy emitted by the surface, arguably about 5%. No one has proved that capturing that amount of IR can do anything let alone raise temperatures catastrophically. The mistake these clowns make is confusing infrared energy with heat. They have nothing in common.

      Infrared energy is electromagnetic energy. It has no mass and is comprised of an electric field perpendicular to a magnetic field. Heat requires mass (atoms) and without mass, as in a vacuum, heat cannot exist. When the surface emits infrared energy it loses heat. That is heat is converted to EM. That EM will go on forever till it encounters cooler atoms to absorb it.

      The anthropogenic theory is not based on solid physics. The people who wrote your article are likely geography majors or weenies who are mathematicians and program models. Their understanding of physics is slim to none.

  46. Tom Tucker says:

    Nate,
    “From what starting point?
    Here is what they said in response to my same question to them.
    “The model estimates …. projections from the period 2041-2070 to an historical (1971-2000 baseline”
    Tom

    • bdgwx says:

      I got the impression from the report that the warming is relative to 1895.

      If your email response is correct then that’s 70 years. And 70 years of warming at 0.4F/decade is only 2.8F…quite a bit less than 5F.

      The report definitely shows 5-6F warming especially for RCP8.5. I just don’t know the details of how they got that. It seems like an acceleration of the warming would be required to achieve that.

  47. Tom Tucker says:

    Gorden et al,
    I got the following wishy-wasy “answer” from thenDirector of the Purdue Climate Change Center.
    QUOTE
    Hi Tom,

    The model estimates from the Indiana assessment that you are mentioning compare projections from the period 2041 to 2070 to a historical (1971-2000) baseline. You are welcome to read more about this projection in the report: https://ag.purdue.edu/indianaclimate/indiana-climate-report
    Or, take a look at the peer-reviewed paper that fully explains the analysis: https://link.springer.com/article/10.1007/s10584-018-2309-9 If you can’t access that version, you can access it for free at: https://docs.lib.purdue.edu/climatepub/

    I guess there are a few things to take into account here.
    — Thermometers don’t predict future conditions, of course. If you used the ground-based thermometer record from 1940 to 1970 you never would have seen the last 50 years of rapid warming coming.
    — Some of this projected warming that you refer to has already happened, as the baseline is from a few decades ago. So the expected warming between now and that future time period should be a little bit less than that.
    — The warming would likely be a bit less than this in the 2040s and more by the 2060s; this is just an average across that period.
    — Emissions have been increasing approximately exponentially. As emissions accumulate in the atmosphere (i.e., greenhouse gas concentrations rise more rapidly) the strength of the forcing grows rapidly, increasing the rate of change in global average temperatures. This will be true to different extents for different gases. These models don’t do a very good job with some processes that might further accelerate changes, though, such as permafrost melt and related emissions. So they may be underestimating the rate of change.
    — There are certainly a range of possible future conditions; we’re just presenting the average across many different models. Some models suggest the warming will happen faster than this, and other suggest it will happen more slowly. We present the average because we think it’s the best number to illustrate what the group of models projects.
    — At this point, I think the “high” scenario (about 6 degrees F of warming by mid-century) is looking unlikely, as coal is becoming uneconomical in much of the world, so emissions aren’t likely to grow that fast. We are headed closer to the medium trajectory (average of about 5 degrees of warming across the models).
    — In general, models predict much more warming over continents than over the ocean, and more warming at higher northern latitudes than near the equator. So when you cite a global number from satellites as a comparison, that’s a number from the wrong geography and the wrong part of the atmosphere (and as I mentioned in my talk, a pretty complex and sometimes problematic set of measurements).
    — Historically, we think that Indiana’s rate of warming has been slowed by the intensification of farming. Packing more corn plants in our fields, for instance, is like adding more swamp coolers to our region during the growing season. (See this paper: Mueller, N. D., Butler, E. E., McKinnon, K. A., Rhines, A., Tingley, M., Holbrook, N. M., & Huybers, P. (2016). Cooling of US Midwest summer temperature extremes from cropland intensification. Nature Climate Change, 6(3), 317-322.) It’s likely that we’re reaching a limit on how much we can pack our fields with plants, though, so this cooling effect in our area may not continue to increase.

    Anyway, hopefully this gives you some context surrounding our projections. Thanks for your interest in our reports.

    Jeff
    END QUOTE

    He is at least now backing off the 5-6F projection for the rise in Indiana’s temperature between 1971-2000 and 2041-2071 (7decades) and says we’re headed for 5F.
    I still estimate that he’s off-base by a factor of about 3.
    For the first 3.5 decades we have actuals. Even using data from NOAA (Climate.gov) for 1985 to 2020 the temperature rise is less than 0.7C or 1.3F. To reach 5F in the next 3.5 decades would require an increase of 3.7F or almost 3 times the previous period.
    I understand the average trend for all the models is 0.27C per decade or 0.945C(1.7F) for 3.5 decades. Adding this to the actual rise for the previous 3.5 decades (1.3F) gives 3.0F which is only 60% of his projection. So I don’t even see how he can get his projection using models.
    I think Purdue’s use of these exaggerated temperature projection to issue assessments of Indiana’s future climate makes the assessments worthless and they should be withdrawn.
    Am I off base??

    • bdgwx says:

      That actually seems like a pretty reasonable response from the director.

      The factors that may cause an increase warming rate are waning of agriculture suppression, waning of atmospheric aerosol loading, sea ice albedo feedback, and possibly more.

      I agree with his assessment that RCP8.5 is unlikely. I have to caution against dismissing the contents of the report though. Computer model projections have a 3 decade history of skillful forecasts especially when given correct assumptions about human behavior. See Hausfather 2019 for a survey of model skill from older models.

      BTW…I was able to read the Hamlet 2019 paper with more details on the projections. There was nothing out-of-the-ordinary with it. They used the output from the same model suite (CMIP5) used for global projections and statistically downscaled them and focused on Indiana. The CMIP5 suite has a good track record. The biggest issue is with the inputs. How much GHGs will humans pump into the atmosphere? How much aerosols will humans pump into the atmosphere? How much and what types of land use changes (like agriculture) surrounding Indiana will occur? Those are all things models do NOT project. Those are given to them as scenarios. One thing scientists have learned over the decades is that our guesses about future human behavior are more problematic than model physics.

    • Svante says:

      Tom Tucker says:
      “Am I off base??”

      The future hasn’t happened yet, so no one can say you are wrong, but scientists have more knowledge at their disposal. That includes Dr. Spencer.

      US CO2 emissions have fallen since 2008, other countries can follow that example.

      GHGs warm the lower atmosphere and cools the upper.
      UAH is nearer the pivot point and less increase.

  48. Svante says:

    Tesla was a genius and a great person. He was not at his best when he wrote the lunar article in 1919. He deserved better.
    https://tinyurl.com/yaty6jxv

  49. Svante says:

    Thank you.

  50. Gordon Robertson says:

    svante…”Tesla was a genius and a great person. He was not at his best when he wrote the lunar article in 1919″.

    I think he was at his best. He observed something that even Newton missed, that the Moon is not rotating about a local axis.

    Of course, we’ll never know what Newton meant by rotation. He wrote in Latin and the translation likely took liberties.

    With regard to your link, much of it is about charlatans who have misquoted Tesla for their own pseudo-science. Having read the history of Tesla’s life and comparing it to my engineering studies, I found his discoveries to be very interesting, especially his discovery of multi-phase transformers and motors. One part at your link focused on reports of his interest in pyramids of which I read nothing in the history of his study.

    It struck me that much of Tesla’s experiments involved what we call static discharge today. We actually used the Tesla coil in one of our electronics classes and the teacher was able to touch the top of the coil and hold a fluorescent lamp in his other hand, as it lit up.

    There is very little use for that technology since the voltage and it’s frequency must be very high in a relative manner. Tesla was counting on using the atmosphere to transmit this power, something that struck me as impractical. They did not have jetliners in those days which could have been seriously incapacitated by such discharges, not to mention the noise of the discharges. They would likely have caused serious weather disturbances as well.

    Just as well we went with conductors. Tesla contributed to that as well, introducing alternating current in lieu of Edison’s D-C, and 3-phase transformers to step the power up and down. Truly brilliant stuff. Tesla even managed to reduce the number of conductors required, sometimes only using a single conductor.

    • Svante says:

      Yes. It was nice that Westinghouse helped him out, and that Tesla Inc. pays tribute to his name.

      • Gordon Robertson says:

        svante…it was my impression that they took far more than they ever gave back. That was the politics of the day and partially his fault for being somewhat naive. Then, again, he had his principles, and I can’t fault him for that.

        There were many inventors vying to be recognized, another problem. Had he not cooperated as he did, trusting them, someone else would likely have stepped up.

        • Svante says:

          Like other (climate or other) scientists, he wasn’t in for the money. He was quite unique/irreplaceable.

          Even comparatively small payments decades later would have been hard to justify economically, except as PR.
          I prefer to think someone at Westinghouse had a heart.

  51. Pete Sudbury says:

    I don’t think he reads much real science…

Leave a Reply to Eben