Even with Laura, Louisiana Hurricanes Have Not Increased Since 1851

August 26th, 2020 by Roy W. Spencer, Ph. D.

As I write this, it looks like major Hurricane Laura will arrive on the Louisiana coast late tonight as a Category 4 hurricane somewhere south of Lake Charles.
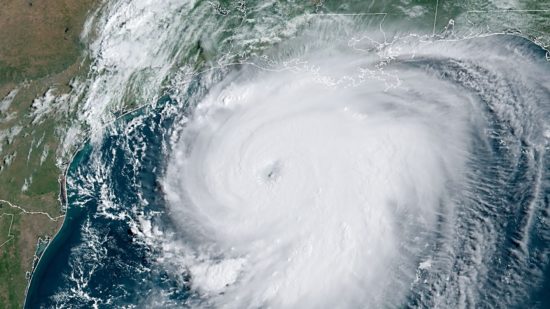
Fig. 1. GOES-East Geocolor image of major Hurricane Laura heading toward the southwest Louisiana coast at 9:50 a.m. CDT 26 August 2020.

There will be the inevitable fake news coverage claiming how U.S. landfalling hurricanes are getting worse, a subject which I addressed in my Amazon Kindle e-book Inevitable Disaster: Why Hurricanes Can’t Be Blamed on Global Warming.

Of course, hurricane damage has increased, as people flock to the nation’s coasts and associated infrastructure increases. But we should remember that (for example) Miami only had 444 residents when incorporated in 1896, and now the Miami metroplex has over 6,000,000 inhabitants.

So, yes, storm damage will increase, but not because the weather has gotten worse.

Given the current event, which is sure to bring major damage to southwest Louisiana, I thought I would present the statistics for all documented hurricanes affecting Louisiana in the last 170 years (1851-2020).

Neither Hurricane Numbers nor Intensities Have Increased in Louisiana

If we examine all of the hurricanes affecting Louisiana in the last 170 years in the National Hurricane Center’s HURDAT database (as summarized on Wikipedia) we find that there has been no long-term increase in either the number of hurricanes or their intensity since 1851.
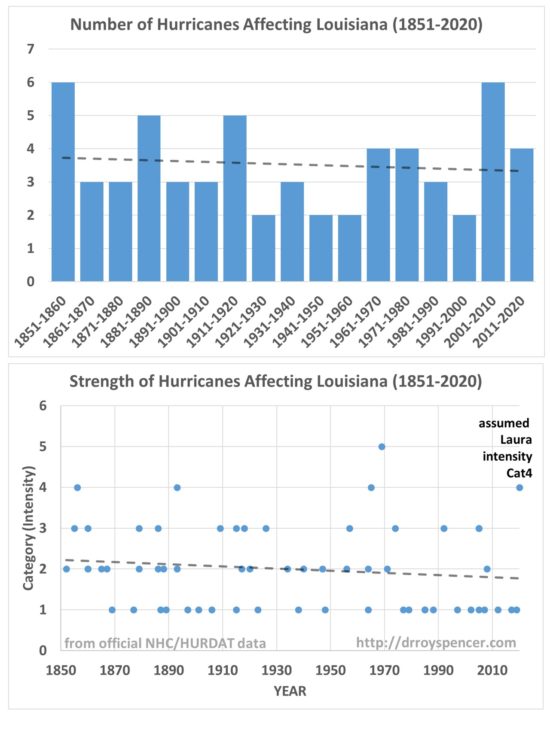
Fig. 2. Neither the number nor intensity of hurricanes impacting Louisiana since 1851 have experienced a long-term increase, assuming major Hurricane Laura (2020) makes landfall as a Cat4 storm. Dashed lines are the linear trends.

Again, this is based upon official NOAA National Hurricane Center (NHC) statistics.


191 Responses to “Even with Laura, Louisiana Hurricanes Have Not Increased Since 1851”

Toggle Trackbacks

  1. Entropic man says:

    Climate change, tbe consequences of global warming, accumulates over time and the damage mostly occurs in the later stages.

    If we haven’t seen a change after 1C warming, it does not indicate that we will see no change after 3C.

  2. Entropic man says:

    May I ask why you expect to see a change in hurricane frequency?

    The literature suggests that increasing sea temperatures will increase frequency while increasing windshear will decrease frequency. The two effects are expected to cancel out, leaving hurricane frequency unchanged by global warming.

    • I didn’t “expect” to see anything. The science on this has changed over time, and might change again. I’m just trying to address both the frequency and intensity questions, in case someone objects, “well, what about the number of hurricanes?”.

      • mick says:

        Science never changes. If it does, it wasnt sound science in the first place. Theory is what we are given. Not science, according to the scientific method.

        • barry says:

          Of course scientific understanding changes with better knowledge. That’s why Copernicus’ views were updated by Newton, and again by Einstein.

          Even though Einstein’s work superceded some Newtonian physics, Newtonian physics are sound enough to send a rocket to the moon.

          It’s not a binary wrong/right equation. That view is for people who are utterly ignorant of science. Science is not dogma, it is a process of understanding.

    • An Inquirer says:

      you can easily find alarmists who say that the number of hurricanes will increase because of global warming.
      you can easily find alarmists who say that the intensity of hurricanes will increase because of global warming.
      you can also find alarmists who say that the # and intensity of hurricanes will decrease because of global warming.
      Therefore, alarmists cannot be wrong.

  3. TQ says:

    “… the statistics for all documented hurricanes affecting Louisiana in the last 170 years (1851-2020).”

    How is ‘affecting’ quantified?

    A Wiki column header lists the ‘Date of closest approach’ but how close is close enough to qualify for the list? If an outer rain band brushes a corner of the state is that counted as the state being ‘affected.’

  4. Jane says:

    Dear Dr. Roy,
    The eye looks like it is 32 miles wide, how can this be?

  5. Brent Auvermann says:

    Dr. Spencer,

    You have plotted Saffir-Simpson intensity index (an ordinal variable) vs. time, generating a negative slope that implies a decrease in intensity over time. Which regression analysis did you use?

    I noted today that the usual suspects have confirmed your prediction, to wit, claiming that climate change is responsible for the more rapid intensification of recent hurricanes. I’d be interested in knowing if there might be a continuous or quasi-continuous dependent variable that would provide a more statistically rigorous test for the null hypothesis that storm intensity has not changed over the past N years. I’m thinking, for example, of either (a) cumulative storm kinetic energy/entropy/something related at landfall or (b) a regression of storm damage vs. { population-weighted GDP per capita within X miles of the coast } or something like that.

  6. Nate says:

    I would suggest again expanding to all Gulf storms, rather than focus on those hitting the single state of Louisiana.

    • E says:

      Anything to increase the sample size.

    • coturnix says:

      Why is it when facing the good news, the climate alarmists always get upset and start looking for a flaw? why can’t you just be happy that may be things are not as bad as you may have thought? You guys remind me of christian milleniarists, who avidly watch the news from the middle east looking for first signs of the impending doom, and then go to bed upset when some politician manages to conduct successful peace talks, meaning that this sinful world will linger for yet another sinful day.

    • Nate says:

      Poor stats because of cherry picking just lead to unfounded conclusions, that mislead people, eg in medical treatments.

    • Nate says:

      To illustrate how bad these stats are notice that on average there has been 1 major hurricane per decade for the entire period. If that had recently increased by 50% to 1.5 per decade, would we have detected that extra half of a major hurricane per decade?

      Unlikely.

    • barry says:

      I’m a skeptic. Does this “good news” stand up to scrutiny?

      Did you check? Or are you so fixated on ‘alarmists’ that you didn’t bother?

      • coturnix says:

        Saying that you are a skeptic actually can mean anything, as technically every honest scientists is one. Being a sceptic you still can be either alarmist or denier.

        Yes, I am fixated, i though it is pretty clear from my comment. I was not questioning their particular argument and yes, it was an ad hominem attack of a kind. Which doesn’t make it any less true. Now, there are many deniers who operate on the same principles, so I’m not saying that it is only the alarmists that are hopelessly biased believers in the climatic apocalypse.

        I’ll repeat it again, my observation is that as I see it, alarmists seem to be so invested into their narrative that they are virtually CHEERING for the catastrophe to happen, just to avoid being proven wrong. In it, they resemble those milleniarist christians, who are so twisted in their faith that they don’t want (why?) to witness their God alone and want the whole world to die with them (that’s what the rapture is afaik).

        Btw, talking about the millenium. The milleniarist christians fell out of favor as the millenium had passed and nothing bad happened (apart from the 911). Bu they are wrong. There were 12 disciples of christ, which means that millenium shall be calculated in thebase-12 numerary system. If you take the ‘Phantom history’ hypothesis to be true, meaning that there were 297 years added to the chronology, we get that the current date is 2020-297=1723. The duodecimal millenium comes at 12**3=1728, or in 2025. Cheers =)

      • barry says:

        I take it form the complete lack of response to my first question that you didn’t apply any scrutiny to the “good news,” coturnix. You just assume it’s correct.

        • coturnix says:

          I don’t care precisely whether it is correct or not, since my opinion on the policy about what to do would not change. The only thing that it would influence is my opinion about the credibility of the bearer of the news, in this case dr spencer. But i already know that he sometimes even so slightly bends the truth, which is understandable since we’re all humans and we’re all biased.

  7. Snape says:

    Dr. Spencer,
    – Of course, hurricane damage has increased, as people flock to the nations coasts and associated infrastructure increases. –

    The increase in people/structures is part of problem, but so is local SLR, which exacerbates storm surge:

    – The sea level around Louisiana is up to 24 inches higher than it was in 1950. This increase is mostly due to sinking land, and its causing major issues. New Orleans is the largest population center at risk from sea level rise in the country and is now experiencing one of the highest rates of sea level rise in the world. –

    https://sealevelrise.org/states/louisiana/

    • Robert Austin says:

      It is land subsidence but you love the ring of ” highest rates of sea level rise in the world”.

      • Swenson says:

        Robert,

        He is a bit of an alarmist, our Snape. Believes all sorts of nonsense. If his supply runs short, he just makes more up.

      • barry says:

        “It is land subsidence”

        And what did you base that off? The article? If so, you just misreprented it.

        Furthermore, Snape already covered that in the quote, so it sounds like you have an axe to grind more than anything to contribute.

        Know what would be great? If ‘skeptics’ made some well-considered cpomments taking all factors into account.

        Instead of peddling their useless, knee-jerk reavtiveness all over the goddamned net.

  8. Aaron S says:

    La Nina historically indicates this will be a bad season for storms. La Nina also reduces global temperatures, whereas El Nino increases global temperatures and decreases storms. Also, as the Earth has warmed ~1C over a century hurricane have decreased. Isotope from tree rings and geologic evidence from storm deposits in basins show hurricane frequency has decreased over intracentury to millennial scales (as earth was leaving an ice age).

    I just dont see empirical evidence at any time scale that hurricane frequency or intensity increases with global warming. I do see evidence a inverse correlation between global temperature and hurricanes may exist.

    So I agree- media communications are fake about storms. At least the media are infallible about coverage of unbiased politics and police shootings? Lol.

    • Gordon Robertson says:

      aaron…”as the Earth has warmed ~1C over a century hurricane have decreased”.

      That would logically be expected, would it not? With warming, the difference between the cold and warm regions decreases, reducing the forces that can lead to more severe storms. I don’t know if 1C would account for such a difference, Roy would know better.

    • barry says:

      “So I agree – media communications are fake about storms.”

      Maybe someone will actually cite a media source instead espousing crap apropos of zilch.

      And maybe someone will do the due dilligence of summing up the medai reporting, instead of cherry-picking the media article or 3 that selectively emphasies their point.

      Because when I’ve done that ion the past, the criticism is almost always in disporportion to the actual media reporting.

      I won’t hold my breath. Pontificating is so much easier than actually corroborating one’s points. And twice as intellectually cheap.

  9. Jane says:

    You can bitch about globul warming all you want. But the truth is when the hydrecarbons run out we are all going to die.

    • gallopingcamel says:

      @Jane,
      You can relax and smell the roses. By the time the fossil fuels run out there will be better technologies to take their place.

      For example dozens of SMR (Small Nuclear Reactor) designs are under development. At least three are under construction. Some are “Generation IV” reactors that have the potential to outperform all existing technologies for generating electricity in terms of cost and safety.

      “Generation IV” nukes can “burn” the nuclear waste from the existing fleet of nuclear reactors and in the process generate 100 times more power than the first burn generated. Given the huge boost in fuel efficiency this technology can sustain our industrial technology for at least 100,000 years.

      Long before the Uranium and Thorium run out we will have thermo-nuclear reactors with an inexhaustible fuel supply.

      • Gordon Robertson says:

        cam…”For example dozens of SMR (Small Nuclear Reactor) designs are under development”.

        That’s what we should be focused on, making nuclear reactors safer. Reactors take up the least space per watt of power output.

        Of course, we’d all have to drive electric cars unless we reverted to the old WW II gasogene car.

        https://www.lowtechmagazine.com/2010/01/wood-gas-cars.html

        Or we could drive bumper cars driven off an electrode on the highway.

        https://en.wikipedia.org/wiki/Bumper_cars#/media/File:Bumper_Cars.jpg

        I presume small portable reactors would be out.

      • Nate says:

        Current nuclear cannot economically compete with wind,
        solar or natural gas, and most coal power plants.

        Yet to be shown that the new designs can.

        “Long before the Uranium and Thorium run out we will have thermo-nuclear reactors with an inexhaustible fuel supply.”

        Small quibble, ‘thermonuclear’ is reserved for fusion reactors.

        • coturnix says:

          To my understanding, due to its fundmentally intermittent and/or unpredictable nature, current wind and solar cnnot be economically used at all, which means that ANYTHING capable of providing baseload will outcompete them in an instant.

        • Nate says:

          Declaration without evidence.

          • coturnix says:

            True. In fact, I more than believe you that current nuclear can’t compete against wind/solar BS, given that there is no competition as all electric energy in the world in a government-controlled and in most countries – government-run enterprise. Only the gas/oil is to any extent privately owned and operated, and it competes extraordinarily well.

            My statement however is mostly based on simple logic. If an energy source produces energy not when it is needed but rather at random, such an energy source is completely useless; doesn’t matter what low ‘competitive’ price government commisars attach to it.

          • Nate says:

            “such an energy source is completely useless”

            Why do skeptics express such certainty about subjects they obviously havent bothered to investigate?

          • coturnix says:

            Lets do an experiment. For a year, any climate alarmist shall only EAT FOOD when the sun shines directly (no cloudliness or low sun) or wind blows with a speed within certain range. Dare to take on the challenge? No? well, that’s pretty much proves my point.

          • Nate says:

            Maybe someone could go find out how the grid manages to match its variable supply to its variable demand and how energy markets help.

          • coturnix says:

            by relying on fossil fuels, is it?

          • Nate says:

            “is it?”

            Ignorance is bliss.

            Several states in great plains of US have lots of wind power consumption, > 25% of generated power. Iowa was 45%.

            Are you aware of lots of blackouts going on these states? I have not heard about any.

            The reason is power grids are connected over vast regions to hundreds of power plants which are switched around as needed to meet demand. Wind simply adds to the mix.

      • Ken says:

        Let us know when it is up and running as well as earning a profit. Until then, claims of future technological advance amount to fairy dust.

        • AngryScotonFraggleRock says:

          Rolls Royce are close to launching a commercial SMR – pity it is not Thorium MSR. Enough ‘fairy dust’ for you?

          • Mike Thefordprefect says:

            Nukes are just heaters. They do not themselves generate electricity.
            They need a fluid to expand – vaporise – to produce pressurised gas that will turn turbines. The hot gas then needs cooling to liquid phase to recirculate. Cooling is generally once through the system water. hot discharge of cooling water will affect the river/sea local environment badly.
            France has shut down nukes because of too hot discharge especially in heatwaves (https://www.theguardian.com/world/2003/aug/12/france.nuclear).

            Assuming this water use is ok (thermal stations do not work well in a dessert!) then there is one major problem for nukes. They do not load follow well. see http://gridwatch.templar.co.uk/france/ note the poor load following of nuke output.

            With many distributed nukes and few fast reacting generators – solar/wind/fossil you would have to safely dump megawatts of heat from the nuke before the core can be brought under control.

            This can to some extent be ameliorated by a smart grid which absorbs the excess energy in EV batteries or grid scale batteries.

          • Gordon Robertson says:

            mike…”Nukes are just heaters. They do not themselves generate electricity”.

            Neither does coal, gas, wind, solar, or hydro. All of them do the same thing, they drive generators that produce the electricity.

          • Ken says:

            Fairy dust until it actually works. ‘Close’ only counts in horseshoes and hand grenades.

          • E. Swanson says:

            Gordo wrote:

            Neither does coal, gas, wind, solar, or hydro. All of them do the same thing, they drive generators that produce the electricity.

            Hey, you “forgot” PV, the most widely used source of solar electricity and PV’s output increases as the temperature declines. For a guy who claims to be an EE, you sure are ignorant. But we already knew that.

    • Swenson says:

      Jane,

      You could have left out the unnecessary words, and just said * . . . we are all going to die.*

  10. Greg says:

    Just an observation, but Katrina was a Cat 5 hurricane and it doesn’t appear on that chart. Weird. Thought it made landfall in Louisiana.

    • Mark B says:

      Katrina’s peak strength was Cat 5, but it was Cat 3 at landfall in Louisiana.

      Picking the category at the instant of landfall in some small region (Loiusiana) rather than more comprehensive metric (accumulated cyclone energy) over a broad region (Atlantic basin) raises suspicion that the objective is scoring rhetorical points rather than providing any real scientific insight.

    • Nate says:

      Exactly.

    • barry says:

      Mark B pinpoints the fallacy.

  11. Snape says:

    Mark B

    [Picking the category at the instant of landfall in some small region (Loiusiana) rather than more comprehensive metric (accumulated cyclone energy) over a broad region (Atlantic basin) raises suspicion that the objective is scoring rhetorical points rather than providing any real scientific insight.]

    Absolutely,
    but the media will claim that Lauras strength at the instant of landfall, in a small region of coastline, is evidence of climate change. Spencer is pushing back in advance.

    • Mark B says:

      No doubt there is/will be rhetoric in the media that is not substantially supported by the best science. Kudos to any and all scientists who works to accurately correct the record and help improve public understanding.

      On the other hand “pushing back in advance” using a rather sketchy statistic doesn’t obviously achieve that end.

    • Mike Thefordprefect says:

      Snape says:August 27, 2020 at 12:26 AM
      Absolutely,
      but the media will claim that Lauras strength at the instant of landfall, in a small region of coastline, is evidence of climate change. Spencer is pushing back in advance
      ———————
      Pushing back with cherry picked data is also invalid

  12. Aaron S says:

    Gordon,

    Yes agreed. As Roy initially pointed out in a previous post- hurricanes require temperature contrast. So the less contrast the less storms. But the issue is the media spin any catastrophe as somehow linked to global warming even women’s rights.

    • Nate says:

      The contrast is between the ocean and upper atmosphere, and is always very high.

      What counts more is the amount of fuel (water vapor) that can be provided and sustained by extra warm waters.

  13. Mark Wapples says:

    Snape could you explain your statement?

    Is the land around louisiana sinking which is increasing the storm surge or is it the continual sea rise we have seen since the last ice age.

    I get confused because we keep getting told the sea is rising faster, but all the examples of cities at risk seem to be where the land is sinking.

  14. Jahren says:

    It is interesting to note that if you remove the first decade that has 6 registered hurricanes from the graph you actually get a positive slope. Shows that the analysis is not very robust.

    Of course people will go crazy saying you can’t just remove data points, even though it is ok if done as a test of robustness of the original analysis. We could then also go back to the discussion on how appropriate it is to start temperature time-series in 1998 etc or why one should not just focus on satellite temperature data.

    A relevant question is perhaps how reliable the historical record of number of hurricanes and their intensity is? One should at least be allowed to ask the question, right?

    Maybe, one might think, the best is to stick to a time frame for which we have “reliable” satellite data for global temperature increase, right? Yep, then the slope is +0.3 (1980-2020).

    Of course the best would be, as others have indicated, to expand the area covered and use more robust metrics. But we will never see such an analysis here I fear.

    • Gordon Robertson says:

      jahren…”We could then also go back to the discussion on how appropriate it is to start temperature time-series in 1998 etc or why one should not just focus on satellite temperature data”.

      For the simple reason, as detailed in the UAH 33 year report, that clear net warming, on the UAH series, did not begin till the 1998 EN. If you talk about warming, on the UAH record, before 1998, you have a trend that shows a recovery from cooling.

      The UAH 33 year report revealed the pre-1998 record as showing little or no warming. The house alarmists statisticians don’t seem to get it that warming has to be above the baseline.

      Even with the 98 EN spike, the following 15 years, according to the IPCC, had a flat trend. The UAH record show an 18 year flat trend.

      It was so flat that NOAA felt compelled to go back and fudge the SST to show a slight trend.

  15. Snape says:

    Jahren

    Good comment. When it comes to hurricane trends, the satellite record is reliable but too short, while the longer term record is not very reliable.

    https://www.gfdl.noaa.gov/historical-atlantic-hurricane-and-tropical-storm-records/

  16. ren says:

    When the North Atlantic jet stream is latitudinal, the temperature and sea level in the Gulf of Mexico must rise.
    As the magnetic activity of the solar wind increases, the strength of the jet stream in the Atlantic will increase.

  17. Snape says:

    Mark Wapples

    The subject of sea level rise is amazingly complicated. I get lost even with the basic terminology.

    In general, though, the global oceans have risen about 8 inches since 1900. Mostly the result of thermal expansion + melting glaciers. They call this eustatic sea level rise.

    At the same time, coastal land areas have been sinking in some places, rising in others (relative sea level).

    As mentioned, the gulf coast has a problem with both, but sinking (subsidence) is the bigger problem.

  18. pochas94 says:

    “there has been no long-term increase in either the number of hurricanes or their intensity since 1851.”

    Yeahbut… How about since 1921? That’s when all of the CO2 was emitted.

    This is not a criticism. I’m just trying to show how by selecting a convenient data range you can “prove” anything.

    • coturnix says:

      That is why you don’t select anything, but rather use all the data available, or a range that is as extensive as possible. That is I believe what dr spencer did, unless there is data before 1851 which he’s conveniently hiding from us. Hence, unless that, dr. spence DID NOT SELECT ANYTHING>

      • bdgwx says:

        To be fair the blog post is a critique of the claim “U.S. landfalling hurricanes are getting worse”. Not that I think the result will change, but choosing only the hurricanes affecting LA to challenge a claim regarding the United States as a whole is the epitome of selection.

        • coturnix says:

          As of writing this comment, the blog post title is “Even with Laura, Louisiana Hurricanes Have Not Increased Since 1851” and it is mostly abut the louisiana landfalls. The only place where the entire US is mentioned is the phrase “There will be the inevitable fake news coverage claiming how U.S. landfalling hurricanes are getting worse”. Indeed, the blog post does not disprove the fakenews claim that US landfalling hurricanes are getting worse. Dr Spencer demonstrates that louisiana Hks are not on the rise, which makes you think that if the total is on the rise, why is NATURE so selective as to single-out louisiana, one of the most exposed states, from the aforementioned alleged increase?

    • Gordon Robertson says:

      pochas…”Yeahbut How about since 1921? Thats when all of the CO2 was emitted”.

      Where is the scientific evidence that CO2 has anything to do with hurricane intensity?

  19. bdgwx says:

    The trend is -0.025 storms/decade +- 0.068. The trend is statistically insignificant.

    • barry says:

      50 years out of 168 had any hurricane activity in Louisiana, according to wiki (one of Spencer’s sources). How well were they monitored in the past? There are 5 to 8 year gaps with no hurricane activity measured.

      Dr Spencer used to focus on Cat 3+ hurricanes while none had made landfall on the US for a few years, but apparently this metric is inappropriate for Louisiana.

      Obviously, these posts are rhetorical. The excuse that they counter some media misrepresentation (which is rarely if ever deomstrated in the articles), does not ameliorate the flaws.

      Countering rhetoric with conveniently picked stats is adding mud to the slide (into ignorance).

  20. Ken says:

    I like Hodges and Elsner finding that US landfall hurricanes correlate to solar minima rather well. Their study suggests the temperature difference from the top to the bottom of the air column is the driver for hurricanes. Sun is very quiet and upper atmosphere is unusually cold as a result, so expect a bad hurricane season. We’re already up to ‘Laura’.

  21. Jahren says:

    Hi Snape
    Thanks! I actually found this PNAS paper (paywall) from June this year where they claim a statistically significant increase (95% CI) in the global tropical Cyclone intensity of 8% per decade over 1979-2017. Analysis based on estimates of cyclone intensity by satellite.
    Wonder if skeptics are gonna argue that satellite estimates are unreliable? 😉

    https://www.pnas.org/content/117/22/11975

    Best wishes!

    • Swenson says:

      Nahren,

      Read the paper again. Remove the homogenisation, extension, guesswork, estimation and wishful thinking. How did you go?

      • studentb says:

        “How did we go?”
        A thorough NOAA analysis of satellite data confirmed that hurricanes are indeed getting stronger. The share of hurricanes observed at categories 3, 4 and 5 has increased by a quarter, from 32% to 40%.

        Do you have a problem with that?

        • Swenson says:

          studentb,

          Read the paper again. You wouldnt fly on an aircraft with a 5% chance of crashing would you?

          Believe guesses where even the authors admit at least a 5% chance they are completely wrong?

          Hope they didnt design any elevators or car brakes. 95% still good enough for you?

          • Mark B says:

            Swenson: You wouldnt fly on an aircraft with a 5% chance of crashing would you?

            One would certainly thing twice about flying on an aircraft that has greater a 95% chance of crashing, which is the better analogy.

          • studentb says:

            Swenson, you certainly do have a problem.
            The question is why you make it so obvious to everybody. Try a bit of restraint now and then.

          • Swenson says:

            Markb,

            The probability seems the same to me. Why is expressing it one way or another better? You choose yours, I choose mine.

            Gavin Schmidt has used the same approach as me,, so it seems acceptable.

          • Swenson says:

            studentb,

            Why are you refusing to answer a simple question?

          • barry says:

            When discussing trends, the uncertainty is a standard feature.

            Something Swenson appears to have zero understanding about. I give that statement a 75% probability of being correct.

            The response should see the probability change. More data tends to reduce uncertainty.

        • An Inquirer says:

          That study did not use historical data. That study re-analyzed data- adjusted it, re-characterized it, manipulated it until it showed what they knew ahead of time they wanted to show.

          And then there is a great statistical trick. As the intensity of disturbances has gone done, the # of hurricanes goes down and the number of tropical storms goes up. If Categories #3, #4, and #5 do not change as much, then the ratio of those three categories to hurricanes goes up.

          Bonus point: why do you think they summed the categories #3, #4, and #5 rather than the traditional major hurricane categories of #4 and #5?

          • barry says:

            Did they re-analyze the data? How did they do that?

            In what ways did they “adjust, recharacterize and manipulate” the data?

            Are you able to substnatiate what you are saying, or are you talking out of your arse?

  22. captain droll says:

    I liked this observation from Davante Lewis:
    “Lake Charles and Calcasieu Parish has been filled with controversy and tension after our parish government by a vote of 10-5 refused to take down the Confederate South’s Defenders Monument. Hurricane Laura had other plans and brought it down herself.”

    See, hurricanes can do some good.

  23. Mark Wapples says:

    Snape.

    Thanks for the reply. I find these areas intriging as some activists make statements which I find difficult to understand and they won’t accept questions about methedology or different hypothesis.

  24. ren says:

    A lot of rain will fall in the coming days in the southeast of the US.

  25. Aaron S says:

    There are known processes that occur outside the length of instrumental records (see below). Without using the paleoclimate records how can we establish modern trends in the context of natural processes? How can we use proxy data given they include large uncertainty?

    “The record indicates that the frequency of intense hurricane landfalls has varied on centennial to millennial scales over this interval.”

    “To accurately predict changes in intense hurricane activity, it is therefore important to understand how the El Nio/Southern Oscillation and the West African monsoon will respond to future climate change.”

    https://scholar.google.com.my/scholar?q=hurricane+record+sediment+record&hl=en&as_sdt=0&as_vis=1&oi=scholart#d=gs_qabs&u=%23p%3DaI7tB7I4YF8J

  26. ren says:

    Geomagnetic activity increases and successive tropical waves move westward along the 10N parallel.
    http://tropic.ssec.wisc.edu/real-time/mtpw2/product.php?color_type=tpw_nrl_colors&prod=natl&timespan=24hrs&anim=html5

  27. Gordon Robertson says:

    snape….”the media will claim that Lauras strength at the instant of landfall, in a small region of coastline, is evidence of climate change. Spencer is pushing back in advance”.

    Roy already addressed them for what they are, fake news artists. They are also scientific dimwits whereas Roy has a degree in meteorology.

  28. Gordon Robertson says:

    nate…”Current nuclear cannot economically compete with wind,
    solar or natural gas, and most coal power plants”.

    You are somewhat anachronistic. Why would you include wind and solar with coal and gas? The former are seriously minor players.

    https://www.world-nuclear.org/information-library/country-profiles/countries-t-z/usa-nuclear-power.aspx

    “In 2018, US electricity generation was 4178 TWh (billion kWh) net, 1468 TWh (35%) of which from gas, 1146 TWh (27%) from coal-fired plant, 807 TWh (19%) nuclear, 292 TWh from hydro, 275 TWh (6.6%) from wind, 67 TWh (1.6%) from solar, 63 TWh from biomass, and 60 TWh from geothermal and other sources (US Energy Information Administration data).

    19% nuclear, from 98 stations, compared to 6.6% from wind and 1.6% from solar. Nuclear could easily compete with gas or coal if people were not so afraid of it.

    “Nuclear power plays a major role. The USA has 98 operating nuclear power reactors in 30 states, operated by 30 different power companies”.

    It surprises me that Hydro accounts for such a minor amount of power. Here in British Columbia, Canada, 95% of our electrical power comes from Hydro.

    I predict that in the not too distant future, nuclear will be the major power source in the US. As soon as the stupidity of the eco-weenie Greens becomes apparent, nuclear will take over.

    BTW…Tucker Carlson released some info about the World Health Organization. Somehow, in their demented minds they are relating the covid nonsense to global warming. They regard covid as a sign that we must all change our way of life.

    If that’s true, it would be nice if someone asked us rather than imposing pseudo-scientific bs on us to scare us in line. It’s beginning to seem as if the conspiracy theories are not that far fetched. Covid is appearing more and more like a hoax, just like anthropogenic warming, aimed at scaring people to accept the guidance of idiots like Bill Gates et al.

    I don’t regard my claims as being totally off-topic since Roy’s article is about media bs, which is related to the catastrophic global warming hoax.

    • bobdroege says:

      Nuclear’s dead Jim,

      And it’s not due to the public’s and the eco-weenies stance against it.

      It’s due to the time it takes to bring a new plant on line, how much money you have to sink into it before you start to get a return on your investment. 10 years is too damn long.

      Utilities, since deregulation, have not been able to raise utility rates to build plants in advance.

      170 6 megawatt wind turbines or 1 1020 megawatt nuclear plant, which one is going to score the investment dollars.

      • gbaikie says:

        If it’s dead, why is China and India making them?

        The way to go is to standardizing a nuclear power plant.
        And way to standardize them, is to put them is the same place.
        And you “make” the same place.

        And would make the same place, on the ocean or large lake.
        And this place has no waves.
        Or making a waveless place on the ocean or large lake.
        Or you making real estate on the Ocean or large lake, having relatively small region not have waves.
        So, need a breakwater. Need a cheap and floating breakwater.
        And need it anchored.

        This related to my question, how do make freshwater lake on an ocean. And nuclear power plant could be in freshwater lake on an ocean. And one also towns in freshwater lakes in the ocean.

    • Ken says:

      I too live in BC. Yeah, we get 95% of our electricity from hydro. I’d say the ‘bankable’ sources of Hydro are saturated. Further, look at how long it took to get Site C approved. Most places don’t have the geography to support Hydro projects like Site C.

      Have you been watching the growing horror as China’s Three Gorges Dam has been tested and found wanting over 4 flood cycles this summer? If the dam broke, there are 300 million people in its path. There is no advantage to Hydro over Nuclear if we are going to consider potential for accidents.

      There is a Huffington Post article that states we’d need 15 more Site C dams if we convert everyone’s car, just in BC, to electric. Or 3 nuclear plants. A back of envelope calculation says 150 000 wind turbines would be needed to generate that much power. Coming soon to a Provincial Park near you. Why not? Its ‘Green’ isn’t it.

      • Gordon Robertson says:

        Ken…”A back of envelope calculation says 150 000 wind turbines would be needed to generate that much power”.

        And that would take a heck of a lot of land and be dangerous to birds. Also, they only turn when the wind blows. That’s cool in Pincher Creek, Alberta, which has a big wind funnel, but how about other places where the wind seldom blows hard? Maybe they could set up a wind farm outside the Legislature.

        Here in BC, I am more concerned about our Provincial government handing over control to bean-counters in the health sector. I am getting a bit PO’d over the province being held up over 130 new cases of covid when our number of deaths has barely exceeded 200.

        I think we’ve pretty well seen the end of deaths due to covid here in BC and we know who is at risk. Yet, here we are with no end in sight to this hysteria.

  29. An Inquirer says:

    2020 Accumulated Cyclone Energy [ACE]
    Basin Current YTD Normal YTD % of Normal YTD Yearly Climo* 2019**
    Northern Hemisphere 138.0175 244 56% 568 586
    Western N Pacific 27.0175 129 20% 302 275
    Eastern + Cent N Pac 48.535 76 63% 138 99
    North Atlantic 43.245 30 144% 104 132
    North Indian 19.22 7 274% 18 81
    Southern Hemisphere 108.925 N/A N/A N/A 144
    Global 246.9425 416 59% 771 821

    Apparently the best measure of hurricane intensity (ACE) is down.

    Graph over the last 40 years is at http://climatlas.com/tropical/global_major_freq.png

  30. Aaron S says:

    That is a great question. After researching paleoclimate one realization was that there are major restrictions between taking local proxy records and making them relevant for global processes. For example many of the solar forcing recorded in tree rings or lakes are regional and may not even be meaningful for global climate. That said each of these low frequency processes add great uncertainty to the instrumental record of whatever to the relationship to CO2. For example, how do we eliminate that a major part of recent warming is to high frequency to detect in glacial isotope records and therefore just part of the natural processes. Or what does modern oxygen 16 stable isotope vostok data upper few meters reconstruct global temperatures at? There is clearly smoothing of that data and we use it for calibration in models. So this realization cuts both ways. Eustatic sea level is the one reliable global source. And it clearly show that 125k years ago sea level was 6 to 9 meters higher than today. So again even if there is a comparable transgression of sea level today to 125k yr ago- why would we assume it was CO2? Well we model orbital forcing as the explanation and difference, but reality is orbital forcing has great uncertainty in timing and there is much more to the story. So both instumental and proxy records come with high uncertainty

  31. Bindidon says:

    I read, somewhere above, from this blog’s most ignorant poster:

    ” Covid is appearing more and more like a hoax… ”

    *
    1. From the US Center of Disease Control

    https://tinyurl.com/yzbcu3lm

    ” While the impact of flu varies, it places a substantial burden on the health of people in the United States each year. CD-C estimates that influenza has resulted in between 9 million 45 million illnesses, between 140,000 810,000 hospitalizations and between 12,000 61,000 deaths annually since 2010. ”

    From Worldometers and the European Center of Disease Control, we see that COVID-19’s total deaths in the US amounted, since January, to over 180,000.

    Thus, the current total death count for COVID in the US is about 4 times higher than the average for the flu.

    Everybody knows that the case mortality for the seasonal flu in the US is about 0.1 %, and that the case mortality for COVID in the US is currently about 3 %, i.e. 30 times higher.

    *
    Dumb people will tell you that the COVID cases and mortalities are highly overestimated.

    Wow.

    But… to which factor are flu cases and mortalities overestimated?

    That they will tell you nothing about, let alone would they show you reliable sources for this alleged overestimation.

    My impression is that nothing has been overestimated. Neither flu, nor COVID.

    *
    Recently I compared COVID for the US, Europe incl. Russia, Canada and the Globe:

    – Cases
    https://drive.google.com/file/d/1S8QwxVH1EldrcV3lki4bIG443DJtdXxq/view

    – Deaths
    https://drive.google.com/file/d/14MLjUkhnhMWbAJQiVGSV9rNyUQCmOMra/view

    *
    To imagine such things being overestimated everywhere, you must be either dumb, ignorant, or all in one.

    The only hint one could extract out of the two graphs is that the right wing in the US politics doesn’t care much about poor people’s health, and… that it shows.

    J.-P. D.

    • ClintR says:

      “The only hint one could extract out of the two graphs is that the right wing in the US politics doesn’t care much about poor people’s health, and… that it shows.”

      Bindidon, such nonsense only makes you more Euro-trash, so jealous of the US that you can’t sleep nights.

      • studentb says:

        “..you must be either dumb, ignorant, or all in one…”

        And, right on cue, I give you ClintR

      • studentb says:

        “so jealous of the US ”
        huh?
        Is that why thousands are trying to escape to Canada?

        • ClintR says:

          Is Canada building a wall too?

          • studentb says:

            The Canadians require the US refugees to pass an intelligence test. Your application failed.

          • Gordon Robertson says:

            clint…”Is Canada building a wall too?”

            Actually, we are having a wall built by the US. Not really a wall but a wire divider. During this covid nonsense, many people in the US with families in Canada are meeting at the US-Canada border near Aldergrove, BC. They are making arrangements to use Peace Arch Park near Blaine, Washington for the same purpose.

            US authorities, who are building the fence, claim it’s to keep drug smugglers out. Along 0 – Avenue, which runs along the US-Canada border, there is a small median separating 0 – Avenue from an equivalent road on the US side. People from both side just wander across it.

            I think it’s dumb for us to keep US citizens out of Canada. Can’t see any possible good in it and all it can accomplish is setting up bad feeling between folks who normally get along just fine.

    • barry k says:

      Bindidon,

      – most asymptomatic and mild symptom cases aren’t counted and this inflates COVID ‘case mortality’
      – some herd immunity to seasonal flu due to previous exposure deflates mortality compared to something new

      COVID seems more on the level of the extreme flu events in 1956-1958 and 1968. That’s probably a better comparison.

      COVID is clearly in a class of its own when it comes to the wide range of outcomes and its level of contagion. When I assess country data from around the world it appears once community spread starts, policy and mandates may only have a minor impact. We’ll be unpacking the understanding and political aspects for years, but much of it won’t come until after the US election…

      Barry

  32. DocSiders says:

    It’s wind and solar that are being priced out of business.

    Look to the developing disaster in Germany where energy prices have risen so much pensioners can’t afford it and had over 10,000 excess deaths from the cold last winter. Energy costs threaten their economic competitiveness. And they are only ~ 15-20% of the way to their emissions goals (and losing some ground this year by firing up more natural gas generation to replace the nuclear power they stupidly decommissioned). The US did far better than Germany in reducing emissions AND WE WEREN’T EVEN TRYING. Germany has many $Trillions of renewable investments to go and the populace is already DONE with the intrusive and ugly and noisy and unreliable and expensive renewables that have failed to meet the wildly unsupportable promises (lies actually). One of the biggest lies was that investing in mountains of battery backup would fix things…leaving out the obvious issue that you need to practically double the wind and solar to charge the batteries. Can’t USE wind and solar while CHARGING BATTETIES with it. Next, in just a few years…worn out solar and wind units will be a cost and environmental disaster. Wind and solar are both environmentally obnoxious during manufacture and construction and at decommissioning….and they cost way more lives than nuclear ever will.

  33. Aaron S says:

    Covid is obviously not a hoax, but I suggest Europe and US data show that it is about 2x or 3x worse than the bad flu mortality rate (US 200,000 dead and a bad flu 60k to 70k per year). There is high uncertainty in that estimate because using the same trendology from climate change the mortality rate is dropping significantly from early US states up North to later states in the South, but also understand we have taken significant measures to slow the spread by distancing and policy. So it becomes a question of optimization between safety and economy and there is no obvious answer (again like climate change). People that are socialist or anti capitalist will obviously have a different view than capitalists about the importance of the economy- so these issues become political.

    • Gordon Robertson says:

      aaron…”Covid is obviously not a hoax, but I suggest Europe and US data show that it is about 2x or 3x worse than the bad flu mortality rate (US 200,000 dead and a bad flu 60k to 70k per year)”.

      You can’t really count on the number of dead in the US since the CD-C is corrupt.

      note…remove * from vaccine*impact in the following URL, copy and paste in a browser.

      https://vaccine*impact.com/2016/the-u-s-centers-for-disease-control-a-history-of-corruption/

      They have lowered the threshold re the definition of a covid death so low that I claim at least half of those deaths are seriously questionable when it comes to claiming covid caused them. They did the same with AIDS deaths, introducing the term IRS to account for AIDS deaths due to prescription drugs, hence lowering the apparent number of AIDS deaths.

      The last figure I saw for the US was 180,000 and based on their population of about 328 million that works out to about 0.06%, the same as Italy and Wuhan, China. Here in the province of BC, Canada we’ve had a little over 200 deaths which works out to 0.004%. That’s right, 4/1000nds of 1%.

      I don’t think the US CD-C has been keeping tract of flu-related deaths since they generously estimated the number as being between 20,000 and 40,000 per year. They certainly were not requiring doctors and coroners to place the cause of death as the flu.

      Most of our deaths across Canada (82%) have been seniors living in rest homes. I was talking to a nurse who works in one of the largest hospitals in Vancouver, Canada, and she claimed many of those people were under a no-resuscitate order.

      I think it’s really sad that we have so many incompetent medical people advising us on covid. When the CD-C can admit that 40% of those testing positive for covid show no symptoms, and brand those people as ‘silent carriers’, rather than suspecting the validity of the tests, I think it reveals corruption.

      • ClintR says:

        Gordon says: “You can’t really count on the number of dead in the US since the CD-C is corrupt.”

        The inflated numbers start with some hospitals. My two favorite examples are the motorcyclist, killed in an accident, reported as dying from Covid. Then, there was the guy working on a roof who got hit by lightning. He fell of the roof. Emergency teams arrived, but could not revive him. He never regained consciousness. His death was counted as a covid-death, even though he had multiple internal injuries. He was likely dead from the lightning strike, before he even hit the ground.

        • Gordon Robertson says:

          clint…”The inflated numbers start with some hospitals”.

          I don’t fall for obvious conspiracy theories but it’s getting downright scary at times thinking about what or who might be behind this.

          We have the Club of Rome who think we’ll never get control of catastrophic warming via democracy. They think we need government along the lines of the Chinese dictatorship.

          Also, when you look at the number of governments who have fallen in line to accept the bs coming out of the IPCC, it becomes a concern that they do it without question. No one seems to want to question anymore.

        • barry says:

          I’ve never seen anyone provide links to these claims about motorcycle accidents and roof falls being cpounted as COVID deaths. And I’m sure that will remain the case after I ask for them here.

      • gbaikie says:

        “and she claimed many of those people were under a no-resuscitate order.”

        Hmm, that interesting aspect of this. With New York city, they apparently returned covid patients to nursing homes, with a body bag and a no-resuscitate order.

        Or if were “more common” to give no-resuscitate order, that seems like sure way to get more deaths.
        Sure it’s safer to not resuscitate someone who is infected, and sure one could have lots good reasons. But if it’s sort of a habit to do this, it’s simply going to cause more deaths.

        Of course the real crazy part was returning covid patients to nursing home {which would infect people more vulnerable at nursing home} particularly when was so much capacity of hospital beds

        • Gordon Robertson says:

          gbaikie…”Sure its safer to not resuscitate someone who is infected, and sure one could have lots good reasons. But if its sort of a habit to do this, its simply going to cause more deaths”.

          It’s the attitude some people have that they can play God. If someone is old and frail they have meetings in hospitals about whether to treat the person aggressively.

          • Svante says:

            ICUs have got better at determining when it’s counter productive, pointless and cruel to subject covid-19 patients to intensive care.

          • gbaikie says:

            “If someone is old and frail they have meetings in hospitals about whether to treat the person aggressively.”

            You don’t have to old and frail, but I guess it’s more common.
            It make some sense in situation where you lack resources- though the point should be to never get to point of lacking resources.
            But it’s a related to the rational of why one does a lockdown- lot’s things go wrong when get in situation of severely “lacking resources”

  34. ren says:

    Average SOI for last 30 days – 8.97

  35. ren says:

    The tropical wave is already in the Caribbean Sea and may form a tropical storm.

  36. Snape says:

    DocSiders,
    [Look to the developing disaster in Germany where energy prices have risen so much pensioners cant afford it and had over 10,000 excess deaths from the cold last winter.]

    This made me curious – how well does the temperature inside a home correlate with excess deaths in winter? After all, if your house is cold you can just put on more clothes, sleep with extra blankets.

    Turns out the correlation is pretty significant:

    [They discovered that the amount of seasonal fluctuation was much larger in people living in the coldest homes than it was for people living in the warmest homes. The risk of death relative to the summer minimum was about 1.5:1.00 in the coldest homes and about 1.3:1.00 in the warmest homes.]

    https://www.ncbi.nlm.nih.gov/pmc/articles/PMC1121691/

    • Gordon Robertson says:

      snape…I hail from Scotland and some of those old homes built of stone are cold even in summer. I feel badly for any old folks who cannot afford to heat their homes.

      As John Christy of UAH has pointed out, we are all living longer because we have access to affordable energy. If the eco-loonies have their way we’ll all be freezing in the dark.

  37. Gordon Robertson says:

    binny…”Recently I compared COVID for the US, Europe incl. Russia, Canada and the Globe:”

    Your graph for deaths is your usual fudged bs. Why have you lumped Europe and Russia together when Italy has the same number of deaths per population as the US and Wuhan, China, all around 0.06%?

    You sure like to obfuscate stats by using remote statistics, like deaths per millions. Why don’t you just use the entire population since that is what matters? And why have you not compared hot spots to see where the US stands? It’s not so far off the rest but when you use bs stats you can make it look that way.

    The US has 328 million people but they are only encountering large numbers of deaths in locations like New York. New York has a large proportion of Afro-Americans and Hispanics, groups known to be susceptible to such contagions.

  38. rah says:

    Concerning Laura. I suspect those here really interested in hurricanes have seen this: https://wattsupwiththat.com/2020/08/28/hurricane-laura-and-the-wind-speed-dilemma/

    Once again, as I have observed happening repeatedly over the years, no recorded sustained windspeed on land came close to the minimum for the CAT IV classification given Laura over water.

    Has anyone seen any wind data from any near shore buoys that Laura’s eyewall passed over?

    • bdgwx says:

      Once again, as I have observed happening repeatedly over the years, no recorded sustained windspeed on land came close to the minimum for the CAT IV classification given Laura over water.

      Yep. Cliff Mass’ blog post explains this well.

      Has anyone seen any wind data from any near shore buoys that Laura’s eyewall passed over?

      Not sure. I haven’t looked yet. But there were many Air Force and NOAA missions (often simultaneously) taking flight level wind measurements and direct surface wind measurements via the stepped frequency microwave radiometer (SFMR) aboard the aircraft.

  39. Snape says:

    Rah,
    There are some problems with relying on buoys. The two main ones:

    1) The fastest winds are located in a small area of the hurricane – somewhere within the right side of the eyewall. it is unlikely a buoy will take a direct hit.

    2) Even if it does, the sustained wind speed is messed up as the buoy sinks into the trough of a wave (sometimes 50 feet high). The trough provides a degree of shelter and the wind is not as fast there.

    https://journals.ametsoc.org/mwr/article/142/8/2814/72088/On-the-Limits-of-Estimating-the-Maximum-Wind

  40. Snape says:

    Another problem with buoys can be inferred from this:

    [There are several reasons buoys are likely to underestimate a hurricane’s wind. First, buoys utilize an eight-minute average maximum wind, and NHC uses one-minute average wind. The shorter the wind averaging time, the stronger the reported winds will be.]

    – WUWT

    ********

    If a hurricane is moving forward at 15 mph, it will cover a mile in 4 minutes. The right side of the eyewall, where winds are fastest, might pass over the buoy in even less time. The 8 minute average would therefore be biased by less than maximum wind speeds.

  41. Bindidon says:

    Is it possible to be as dumb as Robertson?

    He really, really writes:

    ” You sure like to obfuscate stats by using remote statistics, like deaths per millions. Why dont you just use the entire population since that is what matters? ”

    Poor Robertson, who doesn’t understand that ‘deaths per million’ in fact means nothing else than ‘death per capita times 1 million’.

    There are currently 187,624 COVID deaths registered in the US.

    That gives indeed, for a population of 331,325,170 inhabitants, a death toll per capita of 0.000566.

    Who the heck would be dumb enough to produce graphs with y axis values ranging from 0 up to 0.001, thus having three zeroes behind the decimal point everywhere?

    That is the reason why everybody communicating cases or death tolls multiplies the death toll per capita by either 100,000 or one million.

    That gives, for the top ten (according to the European CD-C, numbers differing due to population counts and daily reports differing slightly from those of Worldometers):

    Peru 885
    Belgium 864
    UK 623
    Spain 618
    Chile 593
    Italy 588
    Brazil 573
    Sweden 569
    USA 556
    Mexico 503

    Every 10 year old child understands such simple things.

    • studentb says:

      “Every 10 year old child understands such simple things.”
      Don’t forget that some people regress with old age. Poor old Gordon and ClintR must be approaching 80 or 90 ninety years of age judging by their childish rantings.

    • gbaikie says:

      Let’s include the world’s top 6 leaders:

      New Jersey: 1,807 -deaths per million
      New York: 1,698
      Massachusetts: 1,314
      Connecticut: 1,252
      San Marino: 1,237 {Europe}
      Louisiana: 1,065

      • Bindidon says:

        gbaikie

        San Marino is a town! It’s like including the Vatican in the ‘cases per million’ stat.

        • gbaikie says:

          Yes, and months ago, it was crushing it in terms of having highest deaths per million in the world. Now, it’s fifth, and probably drop even lower.

      • Gordon Robertson says:

        gbaikie…”Lets include the worlds top 6 leaders:”

        Then there’s good, old British Columbia, Canada at about 41.6 per million. Most of the poor souls who died were seniors in rest homes. Like they did in New York, the local health authorities were far too late to realize that staff in the rest homes were working shifts in other facilities and spreading it around.

        Re Louisiana…a while back, it was revealed that although Afro-Americans make up only 30% of Louisiana, they account for 75% of the deaths. Fauci was drawn into that fact and conceded that certain races like Afro-Americans and Hispanics are more susceptible to these contagions than others.

        This is further evidence that covid is harmless to most people in any population.

    • Gordon Robertson says:

      binny…”Who the heck would be dumb enough to produce graphs with y axis values ranging from 0 up to 0.001, thus having three zeroes behind the decimal point everywhere?”

      Who would be dumb enough to suggest plotting a percentage against a population?

    • Gordon Robertson says:

      binny…”Poor Robertson, who doesn’t understand that ‘deaths per million’ in fact means nothing else than ‘death per capita times 1 million’.

      There are currently 187,624 COVID deaths registered in the US.

      That gives indeed, for a population of 331,325,170 inhabitants, a death toll per capita of 0.000566″

      No, not per capita, which means per person, and makes no sense. It means that only 187,624 people have been alleged to have died and that comes out to a ratio of 0.000566 people per 328 million, translating to 0.0566% of the entire population.

      0.000566 people makes no sense but that’s the ratio of 187,624/328 million. You have to multiply the ratio by 100 to get the percent.

      That figure is far more representative of the reality than your bloated 4% per million, or whatever you came up with. If you lower the sample size enough I’m sure you could reach a point where you could claim the number of deaths at 50% or even 100%.

      I am trying to emphasize how little covid is affecting the overall population while you are exaggerating by breaking it into a percentage per million.

      Statistics can be manipulated into making something appear much worse than it is. Take John Cook’s bs at skepticalscience about 95% of scientists agreeing that humans are causing global warming.

      There were two studies preceding his crap, one by Naomi Oreskes, a professor of history, who think consensus is a valid form of science. In her study that reached similar conclusions to Cook, she did a poll with about 1000 scientists. He asked them if humans were causing global warming. How else would a scientists respond other than yes, to whatever degree? Even if the scientist thought the effect was insignificant he would be obliged to respond ‘yes’.

      In another study of 3000, they went through the same exercise. Cook is a cartoonist with an undergrad degree in science. He was caught manipulating the data to get his 95% because he’s an idiot much like you.

  42. Snape says:

    [The track forecast (the prediction of the path of the storm) of Laura was extremely good days in advance. I mean stunningly good. 4-5 days before, the location of landfall was predicted correctly within a few miles and few hours (see proof below). Such small track errors within 4-5 days of landfall has become typical of hurricane predictions and represent an extraordinary accomplishment of numerical modeling and observation. Similarly, track errors of major storms approaching the West Coast have greatly improved (decreased).]

    https://cliffmass.blogspot.com/2020/08/the-lesson-of-hurricane-laura-for.html

  43. barry says:

    Anyone wanting statistics on COVID deaths should definitely check out excess deaths over average, which relies not one whit on COVID definitions or cause of death at all. Just tells you if 2020 is experiencing higher or lower mortality compared to recent years.

    https://ourworldindata.org/excess-mortality-covid

    Good thing about that link – multiple independent sources tracking the same metric.

    • Bindidon says:

      barry

      Interesting, thank you.
      J.-P. D.

    • Svante says:

      Yes, and if you want to make policy judgements you have to consider age demographics. Will be interesting to study when the science settles.

      • Gordon Robertson says:

        svante…”Will be interesting to study when the science settles”.

        If it ever does. I can see the same scenario developing as with HIV wherein 40 years from now we’ll still be wearing masks and experiencing lock downs. It won’t go away because the tests are invalid and keep producing a high number of false positives.

        Until we get tired of the bs and take back our countries at the ballot box it will carry on. Of course, that is dependent on having politicians with the courage to say, enough is enough.

        • Svante says:

          Yes, we can’t afford politicians that are anti-science.
          Ignorance of the GHG emission problem is a good acid test.

          • Swenson says:

            Svante,

            What is the problem with returning plant food and water to the atmosphere? Do you really want to exterminate all life on the planet?

            Alarmist misanthrope, are you?

          • barry says:

            Reducing anthropogenic emissions of CO2 would exterminate all life on the planet?

            How do you manage to continue breathing with so few brain cells, Swenson? Yours is one of stupidest comments I’ve ever seen on the topic, and that is saying something.

        • Swenson says:

          barry,

          I just asked the question. Dont put words in my mouth. You still havent answered. What level of CO2 do you propose, in parts per million?

          You best stop breathing immediately. You are emitting CO2. Anthropogenic, I assume.

  44. Jane says:

    People are part of nature, therefore if people are causing climate change, its ok. Because nature is doing it. Unless you think people are not part of nature.

    • Svante says:

      People often argue that global warming is natural.
      The implication that nothing needs to be done is wrong.
      If it is unsuitable for us and current eco systems it should be avoided, just like major asteroid impacts.

    • Gordon Robertson says:

      jane…”People are part of nature, therefore if people are causing climate change, its ok. Because nature is doing it. Unless you think people are not part of nature”.

      Some eco-weenies claim that humans don’t matter.

    • gbaikie says:

      Well, you say that for some reason people like trees, and some people want a lot more trees and the trees need more CO2.

      Should there be any limit to how many trees that people can have?

      Back when it was warmer, the Sahara Desert was a grassland, wouldn’t be nicer, than rather than just a grassland, the Sahara desert was tropical forest?
      To do that we need more CO2 in the atmosphere.

      The problem is people are stupid and don’t know we are living in Ice Age and don’t know what global warming actually is.

      Some might be aware that global warming involves increasing water vapor and also that deserts don’t have enough rain.
      Algeria is about 80% Sahara Desert.
      Would be the end of the world if it was instead 80% tropical rainforest?

  45. Snape says:

    Jane,

    Thats the big picture, all right, but there is a compelling counter argument:

    I am of part of nature, therefore if I punch you in the face and knock your teeth out, its ok. Because nature is doing it. Unless you think I am not part of nature.

  46. Snape says:

    Sorry Jane,

    a man punching a woman in the face was a terrible example to use. I wish I could delete the comment and find a non-violent way to make the same argument.

  47. jane says:

    I am not saying that everything that happens in nature is good, people die, people vote for demacrats and they destory everything they touch. its all part of nature. the point is people using hydrocarbons is part of nature.

    • Gordon Robertson says:

      jane…”its all part of nature. the point is people using hydrocarbons is part of nature”.

      As John Christy of UAH points out, we live longer because we use fossil fuels.If fossil fuels were made unaffordable, or were no longer available, many people could not survive the cold winters in the Northern Hemisphere.

      People who live in the bush would simply chop down trees to generate heat. Ball4 would not survive since he thinks heat is not real.

      In the major cities, the eco-weenie police would throw you in jail for chopping down a tree to survive. The point is, we have no alternative fuels that can supply the power demands of our current populations.

    • Svante says:

      Yes, not good.

  48. Gordon Robertson says:

    svante…”Yes, we can’t afford politicians that are anti-science.
    Ignorance of the GHG emission problem is a good acid test”.

    Show me scientific proof, based on the scientific method, that CO2 is warming the atmosphere. Then show me proof, using the same method, that a virus called covid exists.

    I am not claiming it does not exist, I am claiming that no one can isolate it and view it with an electron microscope. Until they can, there is no virus.

    Something is causing this contagion but for a couple of hundred years now, whenever such a contagion appears, researchers go rushing to find a virus or a germ. We have virus on the brain because most of the viruses claimed have never been properly isolated.

    Now they are planning a vaccine that will alter our DNA and they cannot find the virus. That’s not science, it more akin to politically-correct witchcraft.

      • Gordon Robertson says:

        svante…wrt to first article, there is still no proof that the IR absorbed produces significant heating in the atmosphere. They are referring to radiative forcing, a nonsense term derived from computer models in which arbitrary values for CO2 warming and warming due to a non-existent positive feedback are incorporated.

        WRT to the second link, the alleged photo of covid is fake.

        1)there is no size marker
        2)the viruses are coloured and an electron microscope works only in black and white.
        3)there is no accompanying proof the photos are of a virus. If they actually had a photo of covid they would not need to use a test designed to amplify RNA, they would have plenty of it straight from the virus.

        The covid test is based exactly on the HIV test which uses the debunked viral load method. They had to invent that method because, as Luc Montagnier, who discovered HIV has admitted, there was not enough HIV to be seen. It’s the same with covid, they cannot isolate a virus using the standard method therefore they have invented a method based on inference.

        Why can they not simply admit they cannot isolate covid using a method that was established for identifying a virus? Why all the bs inferences that they have a genome when they cannot find the damned virus? Lanka has revealed how they got the alleged genome, they took strands of unrelated RNA and pieced them together using a computer model while PRESUMING the RNA is from a virus.

        The virus is not the danger, it’s the idiots spreading the bs about it that are the danger.

      • Svante says:

        Gordon Robertson says:
        “there is still no proof that the IR absorbed produces significant heating in the atmosphere.”

        Slight correction, it cools the upper atmosphere and warms lower layers.

        The measurement shows that +37 ppm CO2 cut 0.43 W/m^2 out of the spectrum. That radiation imbalance means Earth will warm.

        • Gordon Robertson says:

          snape…”The measurement shows that +37 ppm CO2 cut 0.43 W/m^2 out of the spectrum. That radiation imbalance means Earth will warm”.

          Prove that cutting such a tiny portion of the spectrum’s power can cause significant warming. Also, prove that what is claimed is the case. Where did they get those diagrams showing how much CO2 absorbs?

          They admit that the CO2 spectrum is overlaid by the H20 spectrum and a lot of what is claimed is done by speculation via models. Furthermore, the energy budget as prepared by Kiehle/Trenberth is known to be full of speculation, with none of it actually measured.

          Figure it out. How could GHGs possible return as much EM to the surface as what is radiated?

        • Swenson says:

          Svante,

          Unfortunately, CO2 absorbing and radiating at -80 C is not contributing anything to temperatures above that, is it?

          This is why climate shysters use W/m^2. A meaningless unit, unless temperature is known.

          • Svante says:

            Well it shows what increasing CO2 does to spectrum, it creates a radiation imbalance with space, so what’s inside must warm up.

          • Swenson says:

            Snape,

            As I said. All your nonsense is irrelevant. Climate shystering. Pointless units, conveying no useful information at all.

            Put some frozen CO2 in an environment of a lower temperature.

            Now block as much of the CO2 radiation as you like. Create your imbalance. No warming at all.

            You gullible fool.

  49. Snape says:

    Swenson,

    The idea is that without GHGs, the surface would radiate energy to space, an infinite heat sink. None of the energy is returned.

    With GHGs, most of that energy gets absorbed, and a portion is radiated back to the surface.

    This has been explained to you a thousand times.

    • Svante says:

      It’s not just back radiation, check out the video above!

    • gbaikie says:

      –The idea is that without GHGs, the surface would radiate energy to space, an infinite heat sink. None of the energy is returned.

      With GHGs, most of that energy gets absorbed, and a portion is radiated back to the surface.–

      You are missing the elephant which is not GHGs.
      What do think of this:
      “More than 90 percent of the warming that has happened on Earth over the past 50 years has occurred in the ocean. Recent studies estimate that warming of the upper oceans accounts for about 63 percent of the total increase in the amount of stored heat in the climate system from 1971 to 2010, and warming from 700 meters down to the ocean floor adds about another 30 percent.”
      https://www.climate.gov/news-features/understanding-climate/climate-change-ocean-heat-content

      So, ocean water is not a GHG
      Or “90% of the warming” is not due a GHG

      What determines global climate is the temperature of the ocean.
      And at least 70% of global air temperature is the surface temperature of the ocean. I would go further and say 100% of global air temperature of Earth is the surface of the ocean. But since 70% pf Earth’s surface is ocean, it easy to say at least 70%.
      Or for me to support the idea of 100% requires the use of more words.
      But main point is the entire ocean’s average temperature which is about 3.5 C, determines global climate.
      And since you mention an infinite heat sink, the ocean is close enough for practical and immediate considerations to be an infinite heat sink.
      And we in an Ice Age because our ocean is about 3.5 C and we remain in our Ice Age well beyond the foreseeable future.

      • Gordon Robertson says:

        gbaikie…”So, ocean water is not a GHG
        Or 90% of the warming is not due a GHG”

        Good point. My point in a recent reply to Snape is that solar input has established a global average that is claimed to be 33C above what Earth would be without oceans or an atmosphere. The oceans and the atmosphere have the means of storing and dissipating heat naturally and I think those mechanism have been completely overlooked by the anthropogenic theory.

    • Gordon Robertson says:

      snape…”The idea is that without GHGs, the surface would radiate energy to space, an infinite heat sink. None of the energy is returned.

      With GHGs, most of that energy gets absorbed, and a portion is radiated back to the surface”.

      You have forgotten several factors.

      1)The atmosphere gathers heat from the surface by conduction and moves the heated air higher into the atmosphere. As the air rises into thinner air, it expands and cools naturally. Before cooling, it has raised the temperature of the atmosphere by 33C.

      I think an egregious error has been made by claiming that energy in must equal energy out without understanding what energy means. Heat, as energy, is not delivered from the Sun, it is created on Earth when electrons in matter convert EM from the Sun to heat. So, we need to understand what heat is and how it is dissipated. Radiation to space is one means of dissipating heat but the natural cooling of a gas by expansion can also dissipate heat.

      2)that 33C is due to solar input and it’s a maxima for the amount of solar input and the fact that the solar energy only exists for a portion of the day. For the rest of the day, heat can be dissipated internally and naturally. There’s really no need to radiate a lot of energy to space when the heat can be dissipated internally in the atmosphere.

      In other words, the Sun has raised the temperature of the atmosphere by a theoretical 33C and factors within the atmosphere can dissipate the heat naturally.

      3)radiation from the surface is not nearly as important as it is made out to be. According to R. W. Wood, so-called greenhouse warming can be explained by the process of conduction/convection I just explained.

      4)radiation is only effective at very high temperatures. It’s doubtful that surface radiation cools the surface nearly as much as conduction.convection.

      5)there is far too much focus on an energy balance while ignoring internal means of heat dissipation. A 33C warming of the atmosphere has been explained by a gas that makes up 0.04% of the atmosphere while completely ignoring natural means of heat dissipation related to the 99% of the atmosphere made up of nitrogen and oxygen.

      6)Back-radiation from cooler GHGs in the atmosphere cannot raise the temperature of the surface. 2nd law.

      • gbaikie says:

        –I think an egregious error has been made by claiming that energy in must equal energy out without understanding what energy means. —

        I agree. But why do you say warming by 33 C?
        It seems you agreeing the Earth is like an ideal thermally conductive blackbody spherical body {which reflects sunlight}.
        Perhaps you can explain a blackbody which also reflects- as it seems absurd to me.
        Nor is Earth like an ideal thermally conductive blackbody. Or Earth temperature is not uniform.
        The only thing vaguely like ideal thermally conductive blackbody is Earth’s ocean. One could say compared to other planets, Earth is more like a ideal thermally conductive blackbody.
        So ideal thermally conductive blackbody at distance from the Sun in which the sunlight is 1360 watts per square meters, and in full sunlight, the surface warms only to about 5 C. The ground surface is no where close to this, and ocean surface is closer to this.

        Now I think an ideal thermally conductive blackbody spherical body is somewhat useful. So it adsorbs 340 Watts per square meter and we assume that Earth absorbs around 240 watts. Earth absorbs a lot energy like an ideal thermally conductive blackbody spherical body
        does, and no other planet absorbs as much sunlight.
        And I would assume it’s because Earth has 70% of surface area being an Ocean or without an ocean, Earth would be more similar to other planets which lack oceans.
        I don’t think the ocean is full story. But I think all could agree that if Earth was completely covered with ocean, Earth would absorb more energy and emit more energy and would have higher average global temperature.
        Anyone like to dispute this?
        So, like said I don’t think just having ocean is the whole story. Or would not make silly claim the Earth was much warmer when at the time wasn’t an Ice Age due to Earth having a higher percentage ocean {or I assume Earth has roughly had 70% ocean and 30% land for a billion years or more}.
        Rather saying is the ocean is major factor of global climate- and silly pseudo science of Greenhouse Effect theory, ignores Earth’s ocean and a lot of other things. Or it’s a cargo cult.

    • Swenson says:

      Svante,

      Dont be a fool. It doesnt matter. A hot beverage in a vacuum flask still cools. More slowly than otherwise. No heating, just slower cooling.

      This has been explained to you many times. You are incapable of understanding because you are a gullible fanatic.

  50. Praveen smart says:

    Crazy that all of this is happening so fast, the environmental decisions of government can give more better experience this time. I concur a hefty portion of strong focuses made by you dear author.. Keep up your act.Bingo game software development

Leave a Reply