
 Home/Blog
You might have seen reports in the last several days regarding evidence of fraud in ballot totals reported in the presidential election. There is a statistical relationship known as “Benford’s Law” which states that for many real-world distributions of numbers, the frequency distribution of the first digit of those numbers follows a regular pattern. It has been used by the IRS and financial institutions to detect fraud.
It should be emphasized that such statistical analysis cannot prove fraud. But given careful analysis including the probability of getting results substantially different from what is theoretically-expected, I think it is a useful tool. Its utility is especially increased if there is little or no evidence of fraud for one candidate, but strong evidence of fraud from another candidate, across multiple cities or multiple states.
From Wikipedia:
“Benford’s law, also called the Newcomb-Benford law, the law of anomalous numbers, or the first-digit law, is an observation about the frequency distribution of leading digits in many real-life sets of numerical data. The law states that in many naturally occurring collections of numbers, the leading digit is likely to be small. For example, in sets that obey the law, the number 1 appears as the leading significant digit about 30% of the time, while 9 appears as the leading significant digit less than 5% of the time. If the digits were distributed uniformly, they would each occur about 11.1% of the time. Benford’s law also makes predictions about the distribution of second digits, third digits, digit combinations, and so on.”
For example, here’s one widely circulating plot (from Github) of results from Milwaukee’s precincts, showing the Benford-type plots for Trump versus Biden vote totals.
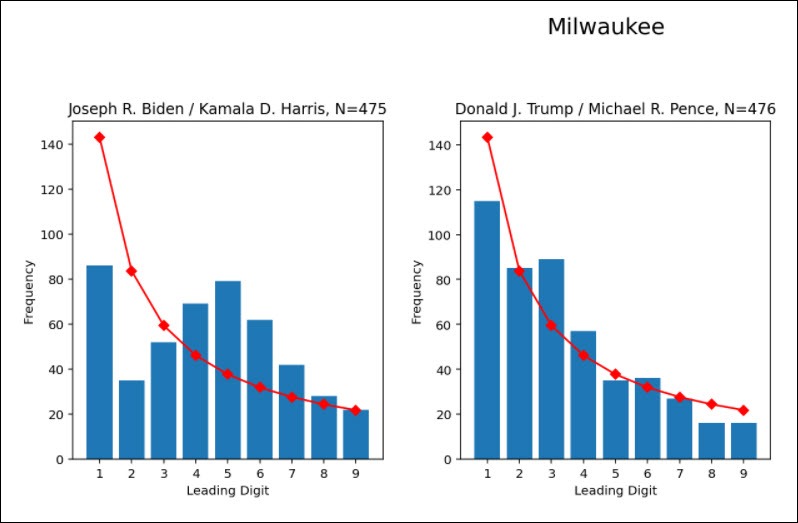
Fig. 1. Benford-type analysis of Milwaukee precinct voting data, showing a large departure of the voting data (blue bars) from the expected relationship (red line) for Biden votes, but agreement for the Trump votes. This is for 475 voting precincts. (This is not my analysis, and I do not have access to the underlying data to check it).
The departure from statistical expectations in the Biden vote counts is what is expected when some semi-arbitrary numbers, presumably small enough to not be easily noticed, are added to some of the precinct totals. (I verified this with simulations using 100,000 random but log-normally distributed numbers, where I then added 1,2,3, etc. votes to individual precinct totals). The frequency of low digit values are reduced, while the frequency of the higher digit values are raised.
Since I like the analysis of large amounts of data, I thought I would look into this issue with some voting data. Unfortunately, I cannot find any precinct-level data for the general election. So, I instead looked at some 2020 presidential primary data, since those are posted at state government websites. So far I have only looked at the data from Philadelphia, which has a LOT (6,812) of precincts (actually, “wards” and “divisions” within those wards). I did not follow the primary election results from Philadelphia, and I have no preconceived notions of what the results might look like; these were just the first data I found on the web.
Results for the Presidential Primary in Philadelphia
I analyzed the results for 4 candidates with the most primary votes in Philadelphia: Biden, Sanders, Trump, and Gabbard (data available here).
Benford’s Law only applies well to data that that covers at least 2-3 orders of magnitude (say, from 0 to in the hundreds or thousands). In the case of a candidate who received very few votes, an adjustment to Benford’s relationship is needed.
The most logical way to do this (for me) was to generate a synthetic set of 100,000 random, but log-normally distributed numbers ranging from zero and up, but adjusted until the mean and standard deviation of the data matched the voting data for each candidate separately. (The importance of using a log-normal distribution was suggested to me by a statistician, Mathew Crawford, who works in this area). Then, you can do the Benford analysis (frequency of the 1st digits of those numbers) to see what is theoretically-expected, and then compare to the actual voting data.
Donald Trump Results
First, let’s look at the analysis for Donald Trump during the 2020 presidential primary in Philadelphia (Fig. 2). Note that the Trump votes agree very well with the theoretically-expected frequencies (purple line). The classical Benford Law values (green line) are quite different because the range of votes for Trump only went up to 124 votes, with an average of only 3.1 votes for Trump per precinct.
So, in the case of Donald Trump primary votes in Philadelphia, the results are extremely close to what is expected for log-normally distributed vote totals.
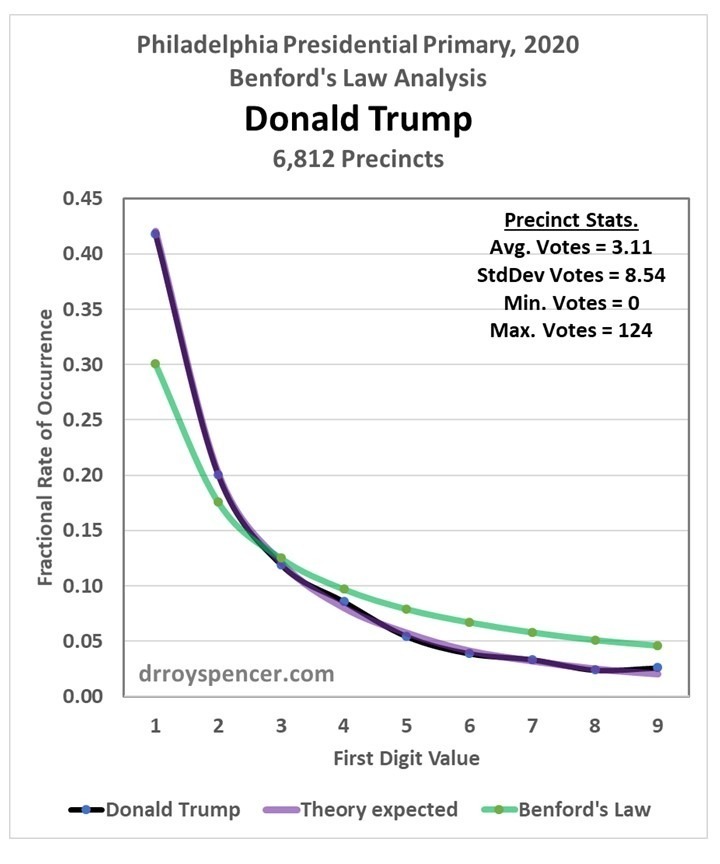
Fig. 2. Benford-type analysis of the number of Trump votes across 6,812 Philadelphia precincts. The classical Benford Law expected distribution of the 1st digits in the vote total is in green. The adjusted Benford Law results based upon 100,000 random but log-normally distributed vote values having the same mean and standard deviation as the vote data in in purple. The actual results from the vote data are in black.
Tulsi Gabbard Results
Next, let’s look at what happens when even fewer votes are cast for a candidate, in this case Tulsi Gabbard (Fig. 3). In this case the number of votes was so small that I could not even get the synthetic log-normal distribution to match the observed precinct mean (0.65 votes) and standard deviation (1.29 votes). So, I do not have high confidence that the purple line is a good expectation of the Gabbard results. (This, of course, will not be a problem with major candidates).
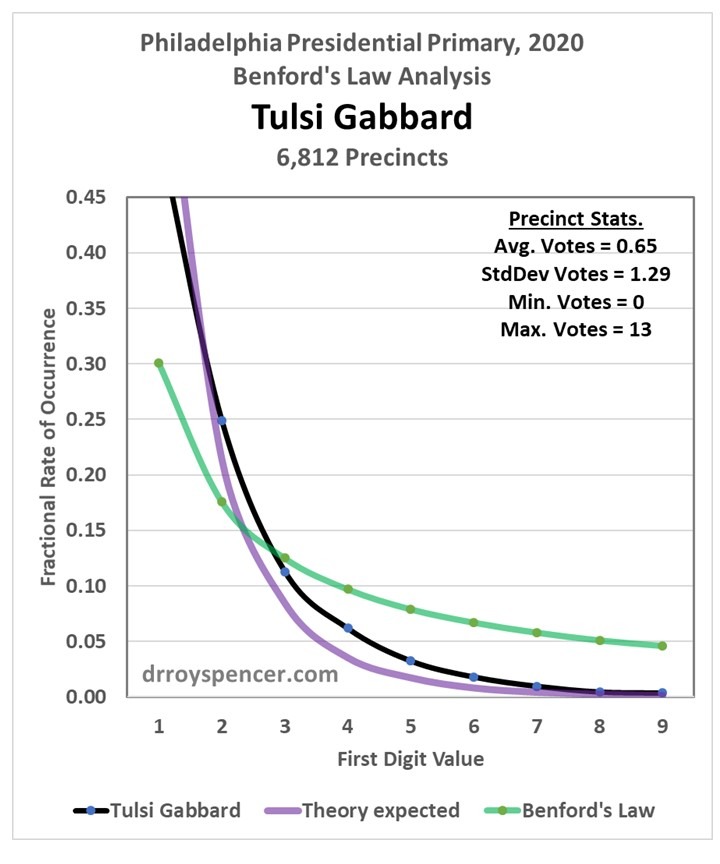
Fig. 3. As in Fig. 2, but for Tulsi Gabbard.
Joe Biden Results
The results for Joe Biden in the Philadelphia primary vote show some evidence for a departure of the reported votes (black line) from theory (purple line) in the direction of inflated votes, but I would need to launch into an analysis of the confidence limits; it could be the observed departure is within what is expected given random variations in this number of data (N=6,812).
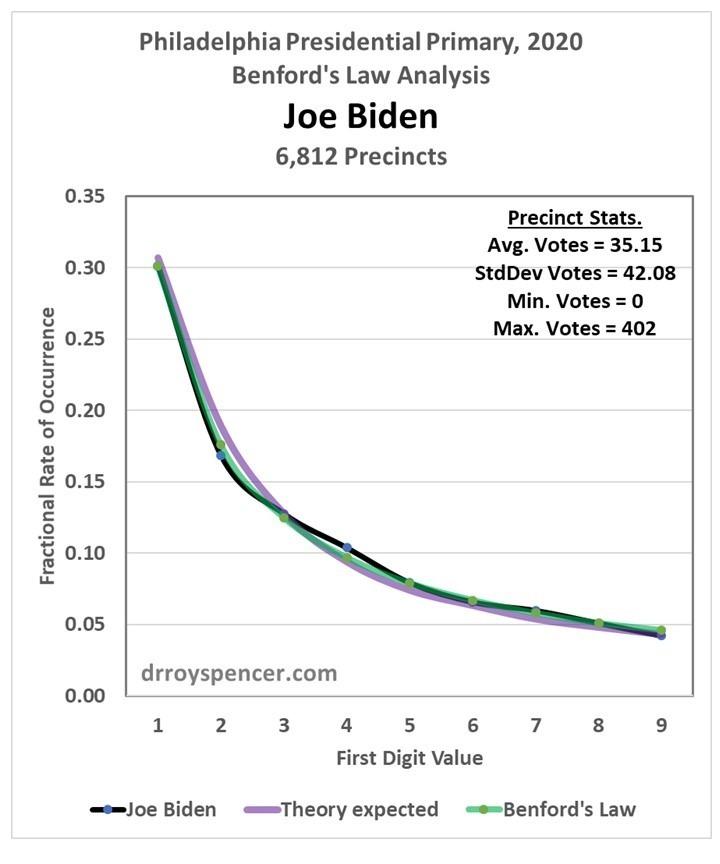
Fig. 4. As in Fig. 2, but for Joe Biden.
Bernie Sanders Results
The most interesting results are for Bernie Sanders (Fig. 5.), where we see the largest departure of the voting data (black line) from theoretical expectations (purple line). But instead of reduced frequency of low digits, and increased frequency of higher digits, we see just the opposite.
Is this evidence of fraud in the form of votes subtracted from Sanders’ totals? I don’t know… I’m just presenting the results.
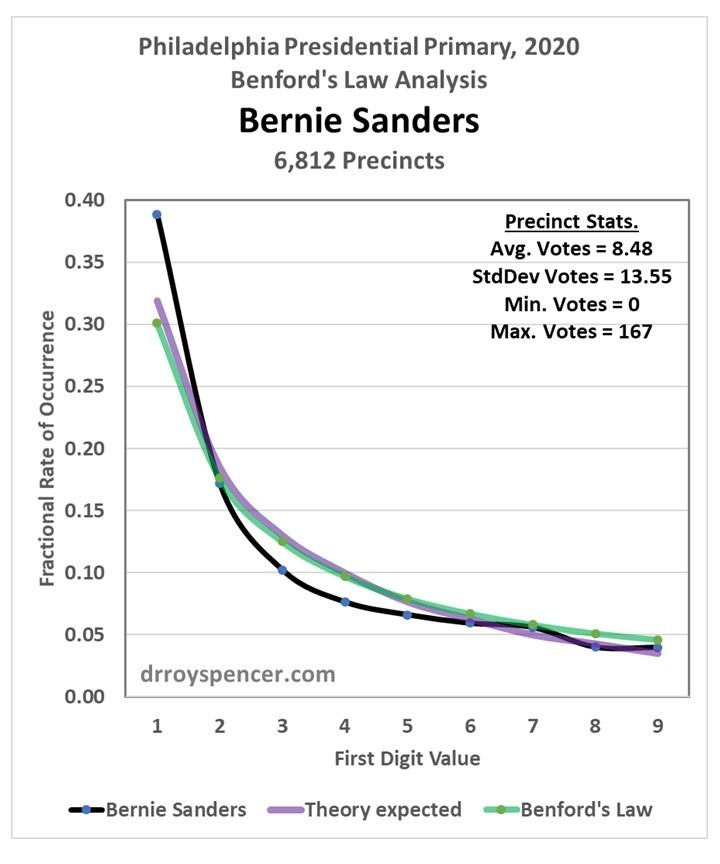
Fig. 5. As in Fig 2, but for Bernie Sanders.
Conclusions
It appears that a Benford’s Law- type of analysis would be useful for finding evidence of fraudulently inflated (or maybe reduced?) voter totals. Careful confidence level calculations would need to be performed, however, so one could say whether the departures from what is theoretically expected are larger than, say, 95% or 99% of what would be expected from just random variations in the reported totals.
I must emphasize that my conclusions are based upon analysis of these data over only a single weekend. There are people who do this stuff for a living. I’d be glad to be corrected on any points I have made. Part of my reason for this post is to introduce people to what is involved in these calculations, after understanding it myself, since it is now part of the public debate over the 2020 presidential election results.


