UAH Global Temperature Update for December 2020: +0.27 deg. C

January 2nd, 2021 by Roy W. Spencer, Ph. D.

The Version 6.0 global average lower tropospheric temperature (LT) anomaly for December, 2020 was +0.27 deg. C, down substantially from the November, 2020 value of +0.53 deg. C.
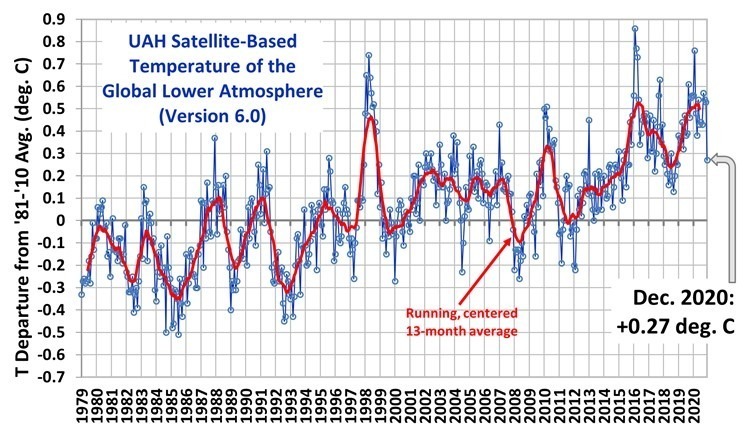
For comparison, the CDAS global surface temperature anomaly for the last 30 days at Weatherbell.com was +0.31 deg. C.

2020 ended as the 2nd warmest year in the 42-year satellite tropospheric temperature record at +0.49 deg. C, behind the 2016 value of +0.53 deg. C.

Cooling in December was largest over land, with 1-month drop of 0.60 deg. C, which is the 6th largest drop out of 504 months. This is likely the result of the La Nina now in progress.

The linear warming trend since January, 1979 remains at +0.14 C/decade (+0.12 C/decade over the global-averaged oceans, and +0.18 C/decade over global-averaged land).

Various regional LT departures from the 30-year (1981-2010) average for the last 24 months are:

YEAR MO GLOBE NHEM. SHEM. TROPIC USA48 ARCTIC AUST 
2019 01 +0.38 +0.35 +0.41 +0.36 +0.53 -0.14 +1.14
2019 02 +0.37 +0.46 +0.28 +0.43 -0.03 +1.05 +0.05
2019 03 +0.34 +0.44 +0.25 +0.41 -0.55 +0.97 +0.58
2019 04 +0.44 +0.38 +0.51 +0.54 +0.49 +0.93 +0.91
2019 05 +0.32 +0.29 +0.35 +0.39 -0.61 +0.99 +0.38
2019 06 +0.47 +0.42 +0.52 +0.64 -0.64 +0.91 +0.35
2019 07 +0.38 +0.32 +0.44 +0.45 +0.10 +0.34 +0.87
2019 08 +0.38 +0.38 +0.39 +0.42 +0.17 +0.44 +0.23
2019 09 +0.61 +0.64 +0.59 +0.60 +1.13 +0.75 +0.57
2019 10 +0.46 +0.64 +0.27 +0.30 -0.04 +1.00 +0.49
2019 11 +0.55 +0.56 +0.54 +0.55 +0.21 +0.56 +0.37
2019 12 +0.56 +0.61 +0.50 +0.58 +0.92 +0.66 +0.94
2020 01 +0.56 +0.60 +0.53 +0.61 +0.73 +0.12 +0.65
2020 02 +0.75 +0.96 +0.55 +0.76 +0.38 +0.02 +0.30
2020 03 +0.47 +0.61 +0.34 +0.63 +1.08 -0.72 +0.16
2020 04 +0.38 +0.43 +0.34 +0.45 -0.59 +1.03 +0.97
2020 05 +0.54 +0.60 +0.49 +0.66 +0.17 +1.15 -0.15
2020 06 +0.43 +0.45 +0.41 +0.46 +0.37 +0.80 +1.20
2020 07 +0.44 +0.45 +0.42 +0.46 +0.55 +0.39 +0.66
2020 08 +0.43 +0.47 +0.38 +0.59 +0.41 +0.47 +0.49
2020 09 +0.57 +0.58 +0.56 +0.46 +0.96 +0.48 +0.92
2020 10 +0.54 +0.71 +0.37 +0.37 +1.09 +1.23 +0.24
2020 11 +0.53 +0.67 +0.39 +0.29 +1.56 +1.38 +1.41
2020 12 +0.27 +0.22 +0.32 +0.05 +0.56 +0.59 +0.23

The full UAH Global Temperature Report, along with the LT global gridpoint anomaly image for December, 2020 should be available within the next few days here.

The global and regional monthly anomalies for the various atmospheric layers we monitor should be available in the next few days at the following locations:

Lower Troposphere: http://vortex.nsstc.uah.edu/data/msu/v6.0/tlt/uahncdc_lt_6.0.txt
Mid-Troposphere: http://vortex.nsstc.uah.edu/data/msu/v6.0/tmt/uahncdc_mt_6.0.txt
Tropopause: http://vortex.nsstc.uah.edu/data/msu/v6.0/ttp/uahncdc_tp_6.0.txt
Lower Stratosphere: http://vortex.nsstc.uah.edu/data/msu/v6.0/tls/uahncdc_ls_6.0.txt


987 Responses to “UAH Global Temperature Update for December 2020: +0.27 deg. C”

Toggle Trackbacks

  1. Dr Roys Emergency Moderation Team says:

    I’m not even going to mention it this month.

    • Svante says:

      Thank you!

    • bill hunter says:

      From the Tesla site:
      ”In this article Dr. Tesla proves conclusively by theory and experiment that all the kinetic energy of a rotating mass is purely translational and that the moon contains absolutely no rotational energy, in other words, does not rotate on its axis.”
      The hard and true fact is that any curvilinear translation is a) in possession of its own angular momentum; and b) is of a concentric nature that it qualifies as its own rotation unless some force or other axis intervenes. Thus:
      1) Rotations are merely a special case of curvilinear translation where other forces or secondary axes do not intervene in its curved path and thus the same rate of turn continues to exist until a full true rotation is completed.
      2) Rotations always require some other force to create an independent deviation from the pure rotation.
      Now obviously this is a conceptual description of rotation. Every rotation can be conceptually viewed as consisting of two parts, a curvilinear translation and a center of mass axial rotation. But this is simply an imaginary conceptualization as a real force or momentum is required to cause a deviation from the curvilinear translation.
      The concept of Tesla’s view of lunar rotation is very well fitted to the practical field of kinematics. The practical field of kinematics demonstrates this pure composition of a curvilinear translation lacking secondary axes thus secondary forces and momentums will always be a pure rotation.
      All this is justified by the law of conservation of angular momentum and supportive of DREMT’s primary position that any rotation away from tidal locked angular momentum requires an additive force. All this is well encapsulated in Kepler’s 2nd law.
      Those who learn their physics and astronomy from a book however, have a very hard time grasping this as one cannot account for orbital motion of some kind of curvilinear translation lacking angular momentum that they want to steal some of it to provide for internal axial rotation of the moon. . . .when in reality orbital angular momentum accounts for the motion of all particles on the merry-go-round or the moon and to vary from that there must be a force of an existing additional angular momentum.

  2. skeptikal says:

    Big drop in December… 2021 will be cooler than 2020.

    • Rob Mitchell says:

      I kinda think that too, but nothing I would bet on. I think that human-caused CO2 adds something to the climate, but to what degree is hard to quantify. I heard Dr. Spencer say on a TV interview years ago that AGW could be 10% or 90% of the cause of our recent warming, but we really don’t have a clue. I do think that human-caused global warming is grossly exaggerated due to previous predictions of gloom and doom that failed to materialize. After all of these failed predictions, now the AGW alarmists are going out to 50-100 years with their predictions because none of us will be around to verify what the alarmists have been calling for.

      Hopefully, AOC and company will get a cold blast of reality blown in their faces during the next decade.

      • Robert Ingersol says:

        The idea that we really don’t have a clue how much of the warming is anthropogenic is belied by the fact that e have been predicting the profound warming for over a century now. Quantitative predictions from the 70s and 80s were very accurate as warming moved well outside the range of natural variability.

        “Previous predictions of gloom and doom that failed to materialize..” The prediction is for warming and sea level rise and both have occurred. All other predictions are more speculative and uncertain, but many seem to be coming true.

        Projections have always extended 50 years out, but the older ones are starting to come due and have proven quite accurate. Look at Broecker (1975).

        • Rob Mitchell says:

          Profound warming Robert? If that isn’t an overstatement, I don’t know what is. The sea level rise is about 1/2 foot per century. The tide gauges do not indicate acceleration. If the sea level stops rising, that will be a sign of the next glacial period is underway. And those things last about 100,000 years.

          I seriously doubt Dr. Spencer is on board your human-caused global warming bandwagon.

          • Svante says:

            https://www.nature.com/articles/nclimate3325

            “Here we show that the rise, from the sum of all observed contributions to GMSL, increases from 2.2 ± 0.3 mm yr−1 in 1993 to 3.3 ± 0.3 mm yr−1 in 2014. “

          • Svante says:

            “Here we show that the rise, from the sum of all observed contributions to GMSL, increases from 2.2 ± 0.3 mm yr−1 in 1993 to 3.3 ± 0.3 mm yr−1 in 2014.”

          • Rune Valaker says:

            Maybe we should stop asking about who is on the “The Human Caused Global Warming Band Wagon,” and rather realize that Roy Spencer is one of this “Bandwagon’s” strongest witnesses. Not because he puts it out bluntly, but for those who have read Spencer over the last five or six years, everyone notices a clear change in his basic understanding. And remember that Spencer’s role is to report UAH, and why should 2020 be the second warmest year? What’s next? An enormous fission reactor that no one has discovered, but which is located at a depth of 5,000 meters in the Pacific Ocean?

        • Nate says:

          ” The sea level rise is about 1/2 foot per century. The tide gauges do not indicate acceleration.”

          Where from?

          The published papers, Church and White, show acceleration of tide-gauges.

          So a steady half-foot per century?? 10 feet lower sea level in Roman times??

          C’mon. Romans built aquaculture pools on the shoreline, and they are still on the shoreline today.

        • Ken says:

          The tide gauge in my town shows relative sea level is dropping. 1.66 mm +/- 0.66 mm per year since the gauge was installed. Most of west coast Canada shows similar dropping trend and very little rise where there is actually a rising trend. The land here is rising faster than sea level due to isostatic rebound and Juan de Fuca Plate tectonics. We’re certainly not going to get 1 meter sea level rise by 2100 that my City and my Province are projecting. You’d think that our governments would be doing at least that much checking on the Climate Change Claptrap before making such predictions.

        • bill hunter says:

          Robert Ingersol says:
          Projections have always extended 50 years out, but the older ones are starting to come due and have proven quite accurate. Look at Broecker (1975).

          ==================================

          Thats about as useful as the last guy that claimed they predicted the last stock market crash and thus we should listen to him again.

          Fact is the ice core record shows a good deal of noise amounting to about a mean 2c deviation in temperatures on a multi-centennial scale. Seems to me the 2c standard for action is extremely conservative. MWP to LIA seems to be supportive of a 2c deviation and it would be useful to understand how that came about. In the meantime the Chicken Little’s will crow and crow and crow.

        • TallDave says:

          ha, there are thousands of wrong global temperature predictions from before 1990, a very small proportion of which coincidentally resemble the actual observations, but generally for reasons we now know are wrong

          this is why we invested billions in GCMs

          of course if any such model was actually predictive, by definition it would no longer need major changes every few years to account for new observations/processes, and naturally the predictions of such a model would necessarily not change materially from one iteration to the next

          obviously, no such model has yet been identified, but don’t worry, a new one comes along every few months!

      • Mark B says:

        I heard Dr. Spencer say on a TV interview years ago that AGW could be 10% or 90% of the cause of our recent warming, but we really don’t have a clue.

        Of course if “we really don’t have a clue”, then AWG attribution higher than 100% of recent warming can’t be ruled out. That is if we can’t reasonably bound attribution, there’s no way to rule out an expectation for cooling without AWG.

        It’s important to point this out, because published attribution studies largely put the central estimate of the AWG contribution since 1950 at around or slightly higher than 100%.

        Uncertainty is a double-edged sword.

        • Rob Mitchell says:

          What a bunch of alarmist garbage Mark. You are basically saying that one molecule of CO2 added to 10,000 molecules of air is responsible for 100+% of the recent multidecadal warming period. Complete delusional nonsense.

          • Svante says:

            Yes, can’t have any impact on plant life either.

          • Mark B says:

            I’m really poking at the nature of uncertainty. The Spencer quote implies that 10% to 90% of recent warming is natural. What is the evidence that constrains natural warming to this range? What is the evidence that even constrains this to be a positive number?

          • Svante says:

            For a start, physics predicts it’s a logarithmic function of CO2 (and other GHGs).
            https://tinyurl.com/y4z7sqkz

    • barry says:

      Pretty safe bet, I think. The Nina coolness should hold for a few motnhs.

  3. Richard M says:

    Looks like most of the heat from the 2018-20 El Nino has finally radiated away. The oceans have been cooling and it was only a matter of time until UAH caught up. Although, I am surprised by the amount of cooling this month.

    It’s starting to look like we could see La Nina conditions for all of 2021. Usually ENSO peaks in Nov-Dec and starts to show signs of waning in Jan if it is a one year event. If anything, the Nino 1-2 area appears to be getting colder.

    A 2 year La Nina would eliminate the effects of 6 years of predominately El Nino conditions. It could also bring on a negative PDO which would stifle future El Nino development.

    To see where this is going keep an eye on the oceans. If they continue to cool it is very possible we will a return to pre-2015 global temps.

    The Arctic will prevent any big drop in global averages so don’t expect too much. The AMO remains positive and will continue to prevent a return to sea ice levels of the 20th century.

    • CO2isLife says:

      Richard, how does CO2 cause El Ninos and La Ninas?

      Also, how much energy is released by an El Nino, and how long out it take the W/M^2 provided by the marginal CO2 since the start of the Industrial Age to replace that energy? Have the frequency of El Ninos been increasing?

      Any insight would be appreciated.

      • Richard M says:

        I have never seen any evidence that CO2 changes cause ENSO variations. Never claimed it did.

        ENSO variations do cause changes in the global temperature. So do other ocean cycles such as the PDO, AMO and millennial salinity cycles. I have yet to see any solid evidence that shows CO2 increase has had any effect on the climate. It might, but so far all the changes in the last few hundred years can be explained without needing to invoke human CO2 emissions

    • Rob says:

      Why did you choose ENSO 1.2 instead of 3.4 to draw your conclusion?

      • Richard M says:

        Rob, the 1-2 area is usually the first area to see upwelling cold water. It then tends to flow westerly with the trade winds during La Nina events. It is often a predictor of the future 3.4 direction.

        If the La Nina was a short term, one year event then it would not be unusual for the 1-2 area to already be showing warming signs. While nothing with ENSO is 100%, this does increase the odds of a longer term event.

        • Rob says:

          Anyone who thinks you could predict what will happen to this La Nina based on 1.2 over the past few months would have been saying “La Nina is ending … no it is deepening … no its ending … no deepening … ending … deepening …”. But of course only the most recent change is important – provided it agrees with the message you want to send.

          • Richard M says:

            The more recent times are more important in the typical La Nina cycle. The later you see evidence for cold upwelling the more often you see the La Nina continue longer into the future.

            As I stated, nothing is 100%. What’s unfortunate is with all the billions spent on climate science we are still in the dark about the most important drivers. Of course, no climate scientist really wants to know as that might put an end to the massive flow of money.

          • Rob says:

            ENSO is not climate. And I’m pretty sure that first paragraph is made up and not based on observation.

        • angech says:

          While nothing with ENSO is 100%,
          BOM Australia were way out with their predictions this year and had to fall in behind the Overseas predictions.
          No explanation given as usual.

          • barry says:

            Can you substantiate the BoM being way out?

          • angech says:

            Can you substantiate the BoM being way out?
            BOM give a forecast fortnightly under Climate Driver Update and have archives going back fortnightly.
            Not once have they led in a prediction of the La Nina that was coming though NASA did.
            see 26/5/2020 for example.

            ” While neutral ENSO is likely for the southern hemisphere winter, some model outlooks suggest a La Niña-like state will develop in the tropical Pacific Ocean during spring. However, by early-to-mid spring, three models of the eight models currently reach or exceed La Niña levels.”

            Their current prediction is for it to end quickly.
            See for yourself.
            The NASA prediction is the only one aiming for a strong La Nina to come.

          • Rob says:

            angech

            The BOM’s model was one of those three models that on that date (May 26) predicted La Nina conditions. For October, NASA had the ONI at -1.1, BOM at -0.9 and the Met Office at -0.8. All the other models showed ENSO short of La Nina threshholds by October. Maybe next time, instead of just reading the overview, you might consider digging into the details before being caught out making making false claims. Did you even consider clicking on the other tabs?

          • barry says:

            May 27 BoM said neutral in near future, with possible la Nina beyond.

            May 28 NOAA said ENSO neutral in near future, with no mention of la Nina in their headline.

            June 10 NOAA still not mentioning la Nina in their headline. Like BoM, their long range forecasting sees potential la Nina months down the track.

            June 10JMA ENSO forecast predicts ENSO neutral conditions for the foreseeable future.

            BoM didn’t “lead” la Nina reporting?

            I don’t know what you are talking about.

            BTW BoM el Nino/la Nina threshhold is different to NOAA and others. It is an extended SST anomaly of +/- 0.8 C in the NINO3.4 region.

    • barry says:

      “A 2 year La Nina would eliminate the effects of 6 years of predominately El Nino conditions”

      What ‘effects’ are you referring to?

      • Richard M says:

        Barry, El Nino events reduce upwelling cold water and spread warm water from the PWP over vast areas of the Pacific. We’ve seen this for much of the last 6 years. Without reinforcement these waters will cool (aka eliminate the warming effects).

        Since the SH sees less of these effects it happens there first. The NH follows

        https://www.woodfortrees.org/plot/hadsst3sh/from:2020.25/to/plot/hadsst3nh/from:2020.25/to

        Did you think CO2 was driving the warmth of the last 6 years?

        • Midas says:

          When this La Nina event is over, will temperatures return to post La Nina averages of the 1980s, or to post La Nina averages of a decade ago, or higher?

          • Richard M says:

            Midas, it depends on how long the La Nina runs. A few months is unlikely to have a big impact. A 2-year event probably gets us back to the early 21st century. Probably more important to GAST is whether the AMO changes modes in the near future.

          • Svante says:

            It depends on whether El Niño has internal combustion.

          • bdgwx says:

            RM, the ONI was < 0 for 25 consecutive months of which 21 were official La Nina from 2010 to 2012. The 13 month mean dropped to 0.0C from 0.3C on UAH back then. We are at 0.5C now. What do you think the odds are that the 13 month mean drops to 0.0C again?

          • Richard M says:

            Bdwgx asks: “What do you think the odds are that the 13 month mean drops to 0.0C again?”

            The odds are low but not zero. However, that is not really the important question. The real issue is where we end up after the La Nina ends.

            If the La Nina ends this Spring as 1 year events typically do then I would guess a return to around values of .2 C for the summer months and higher in the Arctic winter.

            If La Nina continues through the summer then we are likely to see some values go negative. However, with a positive AMO the Arctic fall/winter low sea ice levels will drive the numbers back to positive values. That’s why I doubt we can achieve a 13 month average below zero.

            If we do have a longer La Nina then that could drive the PDO negative which would reduce the likelihood of future El Nino events. We would still need to see the AMO go negative to drive Arctic sea ice levels back up. That will take some time. However, I would expect the anomalies to return to early 21st century averages. AKA we would be right back into the what was called “the pause”.

      • barry says:

        “eliminate the warming effects”

        Excellent Richard, we have a prediction.

        How will we establish that the warming effects of the last 6 years will be eliminated by the 2 year mark, if this la Nina persists?

        I see a few methods, climate-based and not.

        Non-climate based:

        Average temperature anomaly for the 6 years up to Dec 2020 minus the average temperature anomaly for the next 2 years.

        Lowest monthly temperature anomaly for each of the two periods.

        Climate based:

        Linear regression from Jan 1979 to Dec 2014, another from Jan 1979 to Dec 2020, and another from Jan 1979 to Dec 2022.

        How would you measure the prediction? Asking as your point seems to be about CO2 warming (or not).

        • Richard M says:

          Barry, what part of “I would expect the anomalies to return to early 21st century averages.” did you fail to understand?

          As I’ve stated many times trends are useless in noisy data. For example, you are going through a flat valley and after a lengthy drive come to a hill. You go up and over the hill and back down the other side. Where are you? According to a linear trend analysis you are hanging in the air. In this example the hill is a big chunk of noise.

          The key to determining if my prediction is right the key is find similar circumstances. We saw this already after the 2014-2016 El Nino. We returned to prior anomaly values just before the 2018-2020 El Nino took off.

        • barry says:

          “Barry, what part of “I would expect the anomalies to return to early 21st century averages.” did you fail to understand?”

          The part where you posted that 2 days after my comment. The Time Lord council revoked my tardis privileges, unfortunately.

          When, if your prediction is correct, would you expect the anomalies to return to early 21st century averages?

    • Stephen Richards says:

      Do yu mean the Arctic sea ice of the early 20th century the middle of the end. They were all different.

  4. Afterthought says:

    So literally nothing is happening?

  5. Paul Sessler says:

    Thank you Mr. Spencer for your continued work. Always appreciate your input.

  6. Good news although it is just one month. That said 2021 wil very likely be cooler then 2020.

    Volcanic activity will have to be watched along with La Nina , and oceanic surface cooling in general.

    Also want to watch solar activity and see how low it may or may not be this year.

    But +.27 is good and let’s see if that trend continues. I think it will.

    • Rawandi says:

      Will we cross the zero line next month or in two months?

      • Richard M says:

        Rawandi. I’d guess it will take until the NH summer to go negative. Most likely around June. The Arctic will keep the global temperature elevated for a few more months. That effect disappears every NH summer.

        If it does go negative prior to that it will mean the cooling has been very substantial.

    • Bindidon says:

      Salvatore

      I think its the right moment to send you here:
      https://www.wetteronline.de/wetter/ojmjakon

      or here:
      https://www.wetteronline.de/wetter/werchojansk

      so you’ll have the opportunity to really appreciate what you wish.

      Maybe the US fracking mania will get the Yellowstone magma chamber awake, and then… wherever you live, Ojmjakon, Werchojansk etc will come to you (but not only in the usual winter time).

      Do you really wish that? Are you serious?

      J.-P. D.

  7. John W. Garrett says:

    Thank you, Dr. Spencer.

  8. CO2isLife says:

    Dr. Spencer, great work as usual, it is much appreciated.

    Would you consider producing charts to help remove the natural forces from those contributed by man-made CO2?

    The Global Temperatures include the impact of H2O and the Urban Heat Island effect.

    1) Sea measurement should have a relatively constant H2O and would have no Urban Heat Island Effect.
    2) Artic Temperatures should have minimal water vapor and no heat island effect.
    3) A chart showing the differential between land and sea would also show warming that can’t be explained by CO2, as would the differential between the N and S Hemisphere.

    Also, something that is sorely needed is that climate charts should replace CO2 on the Y-Axis with W/M^2 absorbed by CO2. CO2 doesn’t cause warming, the thermalization of LWIR of 15 Microns does. Temperatrues change due to changes in W/M^2, not the concentration of CO2.

  9. Tim Wells says:

    The Maunder minimum is coming that I predicted in 2006 when I walked out of UK Carbon Management company, because I knew CO2 warming to be a fraud.

  10. Rob Mitchell says:

    According to the latest data from Dr. Spencer, it looks like the Arctic is the warmest place on earth! Well, not actually but relatively speaking. Since the Arctic ice has below 30-year average extent, there is more Arctic Ocean water to allow more heat escape – I think. Eventually, this heat escape valve will lead to a gradual Arctic sea ice expansion over the next 3-4 decades – I think. I’m not absolutely certain of this. But I am more certain that the idea of increasing CO2 content leading to a runaway positive feedback that increases water vapor, thus more greenhouse trapping heat till we turn into Venus (per the late Dr. Hawking) is just simply off the chart nuts!

    I am 64 now. I hope I live long enough to see a reversal of the Arctic sea ice extent. These things just don’t change on a dime. This is climate by the way, and climate changes on a time scale way beyond our lifetimes. But if the Arctic climate does have a multi-decadal cycle, I might be lucky enough to see the trend reversal. I think we can all agree now that the Arctic ice will not melt away to oblivion like the AGW zealots were alarming us about during the past 10-15 years.

    • Richard M says:

      The energy released by the added open Arctic water is indeed a big factor in the global temperature. It is obvious in graphs of the SST differences between the NH and SH. The effect is prominent in the NH cold months as the temperature of the Arctic goes above freezing during the summer.

      https://www.woodfortrees.org/plot/hadsst3sh/from:1997.66/to/plot/hadsst3nh/from:1997.66/to

      The SH oceans are already cooling and the NH will follow suit like it does every year. The big question is will it revert all the way back to the pre-2014 levels?

      El Nino tends to pump more warm water into the N Pacific. It may take some time before the effect of the last 6 years of El Nino dominant conditions is lost.

    • CO2isLife says:

      Ooops, I should have said Antarctic, not Arctic. Ocean currents, wind and volcanic greatly impact the temperature of the N Pole. The ANtarctic is a great location to isolate the impact of CO2 on temperature because it is removed from the Urban Heat Island and H2O effect.

      What would be interesting is a comparison of the N to S Pole. Any differential would be due to something other than CO2, and might help tease out the non-man made natural climate change variability.

      N Pole has X variability, S Pole has Y Variability, X-Y = Non-CO2 variability.

      The “Unadjusted” data of this chart shows the impact of CO2 on temperatures when the Urban Heat Island and H2O Effect are removed.
      https://data.giss.nasa.gov/cgi-bin/gistemp/stdata_show_v3.cgi?id=501943260000&dt=1&ds=5

      Basically, temperatures haven’t changed for 140 years. Any variability is due to non-CO2 factors.

    • Bindidon says:

      Rob Mitchell

      I have nothing to do with those you name AGW zealots.

      Nevertheless, numbers are numbers, the reality is as it is:

      1. Arctic

      https://drive.google.com/file/d/19I6WWxw-xavC0H7K7tS_Ocef8BE2gzcs/view

      Yearly ice extent average

      81-10: 11.63
      2015: 10.57
      2012: 10.40
      2017: 10.39
      2018: 10.36
      15-19: 10.33
      2019: 10.18
      2020: 10.16
      2016: 10.16

      2. Antarctic

      https://drive.google.com/file/d/1BCEkUrq8b2d_DwZZZRM43rQwMDrWnEdM/view

      Yearly ice extent average

      2015: 12.41
      2012: 12.02
      81-10: 11.63
      2020: 11.55
      15-19: 11.24
      2016: 11.22
      2018: 11.00
      2019: 10.83
      2017: 10.75

      *
      ” I hope I live long enough to see a reversal of the Arctic sea ice extent. ”

      Me too, I’m over 70. But to see what happens going the other way ’round will take much more time than the rest of my life.

      The reason for a rather sound skepticism about such a turnaround coming soon:

      Arctic since 1891 (HadISST1 ICE)

      https://drive.google.com/file/d/10qA6klNnFn_bo1DNOQZrPPa0fzWSvRYG/view

      J.-P. D.

    • barry says:

      “I am more certain that the idea of increasing CO2 content leading to a runaway positive feedback that increases water vapor, thus more greenhouse trapping heat till we turn into Venus (per the late Dr. Hawking) is just simply off the chart nuts!”

      Virtually no one agrees with Hawking’s view of runaway feedbacks on Earth.

      • Entropic man says:

        We are safe from a runaway greenhouse effect for the moment.

        It’s not widely known, but a runaway is calculated to begin when the amount of energy ab*sorb*ed by the climate system reaches 340W/m^2.

        https://en.m.wikipedia.org/wiki/Komabayashi-Ingersoll_limit

        At the moment the atmosphere and surface ab*sorb 240W/m^2.

        https://en.m.wikipedia.org/wiki/Earth%27s_energy_budget

        Hawking was mistaken.

        • CO2isLife says:

          Entropic Mans Says “We are safe from a runaway greenhouse effect for the moment.”

          CAGW is pure nonsense. We’ve had CO2 as high as 7,000 ppm and life thrived. We fell into an ice age when CO2 was 4,000 ppm. Unless you find some way to end El Ninos, we will never have run away warming, just more frequent El Ninos. El Ninos are like pressure valves for the climate system. If too much energy is added to the system, El Ninos quickly release energy into outer space and cool the oceans. Until you end El Ninos, we will never have CAGW.

          • bdgwx says:

            CO2isLife said: El Ninos are like pressure valves for the climate system. If too much energy is added to the system, El Ninos quickly release energy into outer space and cool the oceans.

            They haven’t been doing a very good job then. See Cheng 2020: Record Setting Ocean Warmth Continued in 2019. Data File: https://tinyurl.com/y7hlqlzm

        • barry says:

          “El Ninos are like pressure valves for the climate system. If too much energy is added to the system, El Ninos quickly release energy into outer space and cool the oceans.”

          Then why do we see long-term warming? Are the el Ninos not strong enough to counteract other causes of change?

  11. Robert Ingersol says:

    So, will 2021 with this postulated Super La Nina (or even just a routine la Nina) be warmer or colder than the 1981-2010 average? When will we be talking about a year that is the second coldest on record? Does anyone seriously believe that they will live to see that?

    2020 ENSO index was more negative than positive. Didn’t stop it from being warmer than the Super El Nino year of 1998. Most of the time ENSO is neutral and there is no apparent long-term trend. ENSO has nothing to do with the long-term warming trend seen in all the global temperature datasets and it certainly doesn’t explain why the last ten years were warmer now than anytime during the Holocene.

    Climate Science Deniers have been predicting cooling for at least a couple decades now, but it keeps getting warmer. At what point do you just admit you were wrong?

    • Dave G says:

      Exactly, Robert, and very well put. ENSO is a normal, natural, and well understood phenomenon. It is cyclical, and its effects are temporary and transient. ENSO has no impact on nor implications for anthropogenic climate change, which is not normal, not natural, and whose effects are roughly linear. ENSO cycles have always been with us and will continue to be with us, but they are now taking place within the context of long-term warming. Thus, to answer your question, we will never again be talking about a year that is the second coldest on record.

      Additionally, the same thing goes for sunspot cycles. Solar irradiance does wax and wane and it does have an effect on global temperature. But the effects are relatively small, and as with any cyclical phenomenon, the effects are temporary and transient. It has no implications whatsoever for long-term anthropogenic climate change.

      We shouldn’t get all worked up over one month’s results or even one year’s results. The only thing that really matters is the long term trend. That continues at an increase of .14 C degrees per decade in the UAH data set, somewhat higher in other data sets. As long as that number holds steady or, God forbid, increases, we’ve got a big problem on our hands. The Maunder Minimum came and went and so will any future minima, but as long as we are burning fossil fuels and emitting greenhouse gases, climate change is here to stay.

    • rtremblay says:

      One month reduction of global temperature is not statistical cooling effect !

      Stay calm with your hypothesis of return to a coolest period of time.

      Thank Robert Ingersol, you have a better explanation than other person in this blog !

    • barry says:

      “2020 ENSO index was more negative than positive. Didnt stop it from being warmer than the Super El Nino year of 1998.”

      That’s a point worth highlighting.

    • barry says:

      2020 ENSO index was more negative than positive. Didn’t stop it from being warmer than the super el Nino year of 1998.

      That’s worth highlighting.

    • Richard M says:

      Robert. you are living in denial of the short term effects of ENSO. While it may average out over centuries it does indeed have periods of time where it affects the global temperature one way or the other. Lately, it has been having a warming effect.

      If you thought the recent warming was AGW related then you are likely to suffer some major disappointment in the near future.

      In addition to ENSO there are other ocean cycles that influence the global temperature. Both the PDO and AMO have been mainly having a warming influence over the past 30 years. The millennial salinity cycle has been having a warming influence for the past ~400 years.

      As a result you are right about not expecting to see any major cooling. The people pushing that idea are generally those who think the sun is the only driver of the climate. They are likely to be disappointed as well.

      The La Nina itself will only take us back to where we were in the early 21st century. However, it is very possible the PDO and AMO could turn negative in the 2020s which would enhance that cooling.

    • Bindidon says:

      Here are two charts giving (till end of 2019, I still didn’t update some of the data) a comparison of solar irradiance (based on SILSO’s Sun Spot Numbers), AMO (undetrended!!!), temperature (from JMA, the Japanese Met Agency).

      1. 1900-2019

      https://drive.google.com/file/d/12HtQq7eVIaJ4zn182I6Kzs5fhxxvZzT7/view

      2. 1979-2019

      https://drive.google.com/file/d/1XwvXfhkL5XcRBbsT09CybDsVNI_d7s-m/view

      It is primordial to take AMO’s undetrended variant when comparing AMO with other climate time series.

      The detrended variant is useful only to show AMO’s underlying cyclic behavior, and leads you astray when comparing it with e.g. a temperature time series.

      PDO appears, in comparison with AMO and temperatures, nearly trendless, and has much lower deviations from the mean.

      J.-P. D.

    • barry says:

      “If you thought the recent warming was AGW related then you are likely to suffer some major disappointment in the near future.”

      As the AGW signal takes multidecadal periods to tease out from the natural fluctuations, I’m not sure you know what you are talking about when you espouse disappointment for AGW theory “in the near future.”

      You’d think people would learn the difference between climate and weatgher before commenting.

      • Richard M says:

        Barry,

        If the UAH anomalies return to early 21st century averages then there would have been no warming for 2 decades while AGW predicts it should have warmed .4-.5 C. Anyone still espousing AGW as a threat at that time would be anti-science shills.

        • Dave G says:

          Richard,

          If 25 years from today, when I have just passed my 89th birthday, I have regrown a full head of hair and I can dunk a basketball on a regulation-height basket, then there will have been no aging over a good number of decades. Anyone still espousing aging as a real process at that time would be anti-science shills.

          • Svante says:

            Let’s hope for that.

          • Richard M says:

            Dave G, you really need to work on your analogies. Your time scales are out of sync.

            The earth appears to be pretty close to a self healing entity over millennia if not millions of years. I doubt your body qualifies over 25 years.

            PS. I never could dunk a basketball and began losing hair in my 20s. If at age 64 you are able to dunk and have a great head of hair then I’d consider you pretty darn lucky.

          • Nate says:

            His analogy is spot on Richard.

            You’re report of the demise of AGW are highly exaggerated, and rather premature.

          • Dave G says:

            Ah, Richard. I was hoping my humorous comment, or perhaps my lame attempt at a humorous comment, would stand on its own and not require any clarification or explanation. I see that’s not the case. Let me give it a shot.

            You proposed a hypothetical reversal of a trend, that is, the ongoing warming of the earth’s atmosphere. Likewise, I proposed a hypothetical reversal of a trend, that is the ongoing process of aging that I, like everyone else, am experiencing. You then say that if we return to the global temperatures of several decades ago, then there will have been no warming over that period of time. Which, of course, is true, simply by definition. I say that if my aging trend is reversed, I will regain the appearance and the physical capabilities I had many decades ago. That is equally true, also by definition. I set up my hypothetical to be true, just as you did.

            While my hypothetical is true, it is also invalid, because my aging process will never reverse itself. Your hypothetical is equally invalid, because as long as the greenhouse gas concentration level in the atmosphere continues to rise, the warming trend will not reverse itself. We will not set a new global heat record every year; there are too many sources of natural variability for that. But over the long haul, we will see a clear and inexorable rise in global temperatures as long as the CO2 level keeps rising, or even if it stays steady at its current elevated level.

            In other posts, you attribute our current warming trend to other, natural sources of variability. I touched on the problems with that kind of thinking in my original response to Robert Ingersol’s comment, way up at the top of this thread. Rather than repeating those points or elaborating on them, I’d like to refer you to the story of Richard Muller. He was a physicist at Berkeley, and about eight to ten years ago, he was skeptical of climate change. He thought there were major problems in the way that climate scientists reached their conclusions, so he gathered up a group of crack data analysts to study and analyze historical climate data. Personally, I think he was ignorant of the excellent work done by climate scientists and arrogant to think he could do a better job than they could, but he went ahead and did what he wanted to do. He called his project the Berkeley Earth Surface Temperature project, or BEST. He even got funding for it from the Koch brothers, who assumed that his work would disprove the conclusions of climate science. It did not. I will allow Prof. Muller to speak for himself:

            https://www.youtube.com/watch?v=Sme8WQ4Wb5w

            The bottom line for Prof. Muller is that once he analyzed the data, none of the alternative explanations for warming held up. Those other factors are real, but their effects on global temperature are transient and temporary. Only the steady rise in CO2 in the atmosphere could satisfactorily explain the steady rise in global temperatures.

            I didn’t mean to be rude or hostile of condescending, but the time for debating the reality of climate change is long past. Climate change is real and it is well understood. Let’s stop distracting ourselves with talk about ENSO, PDO, sunspot activity, volcanic eruptions, and the Milankovich cycle. Let’s get to work on solving this problem. Will you join us? You will be welcomed with open arms, I assure you.

          • Richard M says:

            Dave G,

            The Muller story fabrication has been laughed out of existence many times over. That you still quote that nonsense really does show a lack of effort on your part to separate fact from fiction.

            Muller has always been a big supporter of AGW. He had some doubts about things such as the Mann hockey stick. On that he was right. More and more evidence is turning up every year supporting long term climate variability.

            The modern temperature record is a mess prior to 1980. The only data I trust at all is UAH and HadSST3 over the last 40 years.

            https://woodfortrees.org/plot/uah6/from:1979/to/plot/uah6/from:1979/to/trend/plot/hadsst3gl/from:1979/to/offset:-0.2/plot/hadsst3gl/from:1979/to/offset:-0.2/trend

            If you can read this graph you will understand why I believe the oceans control the global temperature.

          • Dave G says:

            OK, Richard. I give up. Best of luck to you.

          • Richard M says:

            Dave G is pretty typical among the true believer sect in that he does not want to know the truth. That would be very uncomfortable. I like to make people uncomfortable.

            https://realclimatescience.com/wp-content/uploads/2017/06/Image696_shadow.png

            https://realclimatescience.com/wp-content/uploads/2017/06/Image699_shadow.png

            Muller admits he was never a skeptic yet we see claims that he is a converted skeptic. Now you know those claims are lies.

            Now add in the silly claim that because he doesn’t know what else might have caused warming, that it must be AGW. In other words he is claiming 100% knowledge of climate drivers. Hilarious.

            It really is hilarious that anyone with even a smidgeon of common sense can’t recognize this entire story as pure propaganda.

          • Nate says:

            “Muller has always been a big supporter of AGW.”

            As a physicist, he was aware of the correctness of the physics in the theory.

            He was skeptical, however, of the quality of the evidence for the effect, and was concerned about the urban heat island effect and whether it was properly dealt with by the existing temperature records.

            “He had some doubts about things such as the Mann hockey stick.”

            Indeed he was quite critical and even supported the view that it was probably a statistical artifact.

            Of course that has since been thoroughly debunked.

          • Svante says:

            He really didn’t like the “hide the decline”.
            In retrospect, he was right, you don’t do that, even if the problem was well known among experts.

  12. Cliff_G says:

    If I calculated correctly -22 Celsius is the black body temperature required to emit at 15 microns. Not a large percentage of the Earth surface at that temperature throughout the year. This is the only window left that would allow thermalizing co2.

    • Blackbody radiation has a wide bandwidth. A blackbody radiation curve, plotted in terms of power per unit wavelength bandwidth as a function of temperature and wavelength, has power exceeding half that at its peak wavelength from about 2/3 of the peak wavelength to almost twice the peak wavelength. Also, power at all wavelengths increases directly with increasing temperature, even though the increase varies with wavelength.

    • CO2isLife says:

      Cliff, -80°C is consistent with 15&micron; LWIR. That is evidenced by the temperature at 20km, where CO2 is the only real GHG, bottoms around -80°C. SpectralCalc also has a blackbody calculator. Just enter Band 13 to 18&micron;, temperature -80°C.

      You will see that 15&micron; peak corresponds with -80°C.

    • bdgwx says:

      Cliff, 15 um radiation is emitted at all temperatures. The temperature at which 15 um represents the wavelength with the highest spectral radiance is -80C. But, and this is crucial, the spectral radiance of 15 um increases as temperature increases. In other words, there is more energy in the 15 um carrier channel at 0C than -80C.

      • Clint R says:

        bdgwx tries to deceive: “In other words, there is more energy in the 15 um carrier channel at 0C than -80C.”

        But, and this is crucial, adding more 15μ photons is like adding more ice cubes. More energy is being added, but more ice cannot warm more than less ice.

        • Tim Folkerts says:

          It would be fascinating to hash this out in a Zoom call. There are a variety of correct ideas, but the blanket state that “more ice cannot — under any circumstances — lead to more warming than less ice” is simply not true. It is important to know just what circumstances you have in mind (and that others might have in mind) before trying to analyze energy flows and find final temperatures).

          For example, an object in deep space will equilibrate at 3K
          That object half-surrounded by 273K ice will equilibrate at 230 K
          That object fully -surrounded by 273K ice will equilibrate at 273 K

          This is an example of “more ice warms more than less ice” — directly refuting your statement. Perhaps you could clarify more precisely the circumstances you meant.

          • Clint R says:

            Folkerts, don’t feel bad that you forgot already. It’s been almost a week….

            http://www.drroyspencer.com/2020/12/500-years-of-global-sst-variations-from-a-1d-forcing-feedback-model/#comment-580385

          • Tim Folkerts says:

            Clint, I just directly refuted the exact words you said. If you want to specify additional conditions to your statement, now would be the time.

            For instance, that link adds the stipulation “above the 32F ice”. It also adds the stipulation that ONLY 32F ice is used as a source of radiation. With these extra stipulations, then your conclusion is true. I (and every scientist I know) will happily agree that 32F is the max temperature attainable using only radiation from 32F ice.

            But no one has ever claimed that you could surround an object with 32F ice and then ‘re-surround it’ and get twice as much energy and raise the temperature about 32F. This is a classic strawman — attacking a position that your opponent never held. Feel free to find a scientist making this claim to prove me wrong — provide an exact quote or link. Yeah … I didn’t think so.

          • Clint R says:

            Folkerts, you throw out so much nonsense that I can’t keep up.

            YOU are the one adding “under any circumstance”, not me.

            And I agree, no REAL scientist would claim an ice cube can warm another ice cube. So, I’ll let you argue with yourself:

            “And since this might still not be clear enough, I could add the sunlight [273K] first and then the ice [273K], and [t]he final temperature would still be 325 K.”

          • Tim Folkerts says:

            “YOU are the one adding ‘under any circumstance’, not me.”
            Good to know that you agree that under some circumstances adding ice at 32F might warm up other ice above 32F.

            And thanks for providing the relevant context where ice can do that. Put an ice cube (or any rock or space probe) orbiting the sun (far from any other planet, moon, etc) where sunlight is strong enough to warm the object to 0 C. The remaining sides face empty space. Then add a shell of ice around the satellite (leaving a hole for sunlight to still get inside to the satellite).

            What will the new temperature of the satellite be? The ice itself would get the satellite to 0 C. The sun itself would get the satellite to 0 C. Together what will they be? The only conclusion is the satellite will be WARMER than 0 C.

            The 0 C ice — in conjunction with the sun — led to a warmer temperature than just the sun. The ice’s radiation at 0 C — added to the sun’s radiation at 5500 C — led to the satellite getting warmer. The energies did add, and did result in warming.

            This is what scientists are talking about. The earth always has sunlight as part of the energy budge.
            Cold + Hot = warm
            Not cold + cold = warm

            You are clinging to an interesting and valuable example. But you are missing the next step up!

          • Clint R says:

            Folkerts got caught claiming two ice cubes will heat something to 325K (52C, 125F)! Now he’s typing long meandering comments trying to justify his nonsense.

            That’s why this is so much fun.

            And idiots like Nate, Norman, Ball4, et al., will believe all of it, making it even funnier.

          • Nate says:

            We believe that you, Clint, are working very hard to miss the simple point.

            Lets drill down so you cant miss it. An object heated with a constant heat source views 4pi steradians of 3 K. It is surrounded by space. If a portion of that view is now REPLACED with a view of a 273 K ice surface, then the object MUST WARM.

            Its that simple.

            IF you disagree, explain why. For once try to skip the insults and squirrels.

          • bdgwx says:

            Exactly Nate. And if you further eclipse the 3K view with even more of the 273K stuff then the body warms further still. Adding more “ice” does indeed make another body warmer.

          • bill hunter says:

            Tim Folkerts says:
            This is an example of more ice warms more than less ice directly refuting your statement. Perhaps you could clarify more precisely the circumstances you meant.
            ================================

            Tim thats apples and oranges. You are demonstrating a change in the view variable which does nothing whatsoever to establish the one-way glass theory that is fundamental global warming.

          • Nate says:

            The discussion is about ice.

            You want to discuss fruit? Start a new thread elsewhere.

          • Nate says:

            Where’s Clint? He’s abandoned the field.

            In chess, war, and debate, if one party departs the field of battle, its an admission of defeat.

          • Tim Folkerts says:

            bdgwx says: “Exactly Nate. And if you further eclipse the 3K view with even more of the 273K stuff then the body warms further still.”
            Nate had already postulated 4 pi steradians = completely surrounded. You can’t “further eclipse” what is already completely eclipsed. You could eclipse less and get less warming.

            bill hunter says: “Tim thats apples and oranges. You are demonstrating a change in the view variable which does nothing whatsoever to establish the one-way glass theory that is fundamental global warming.”
            Actually, is goes a long way to establishing the GH theory. Just use “glass” instead of “Ice”
            With no glass (ie surrouneded by 3 K space), the object heated by the sun would have some temperature.

            If we add glass around all sides, the sunlight goes through the glass and still warms the object. If the glass is at 3 K, then the temperature of the object is the same as above.

            But the LWIR radiation leaving the object hits the glass, gets absorbed, and warms the glass. The warm glass surrounding the object does the same as the ice did — it radiates to the object and warms the object above the temperature without the glass.

  13. Rob Mitchell says:

    Robert, the AGW Zealots have been predicting the demise of the Arctic sea ice for the past few decades. When will you admit you were wrong?

    The climate/social justice warriors have all predicted storms will get worse due to human-caused climate change. This too has failed to happen.

    And the claim that the past 10 years were warmer than anytime during the Holocene? Apparently, you are a hockey stick believer.

    • bdgwx says:

      Actually, it is the other way around. Scientists have consistently underestimated< the rate of Arctic sea ice decline. For example, 2001 the IPPC predicted that the first occurrence of < 10.5e6 km^2 extent would not occur until after 2040. It first happened in 2007 and then again in 2011, 2012, 2016, 2017, 2018, 2019, and finally in 2020 which now replaces 2016 as the new record lowest value. Predictions for the first "ice-free" summer were around 2100 in the 1990's. They have since come in sooner and sooner as scientists play catch up with rapid pace of sea ice loss. The consensus is now around 2050 and many scientists think even that is too conservative.

      • Clint R says:

        bdgwx, how many times has the Arctic been ice-free in the last 5000 years?

      • barry says:

        “Based on the paleoclimate record from ice and ocean cores, the last warm period in the Arctic peaked about 8,000 years ago, during the so-called Holocene Thermal Maximum. Some studies suggest that as recent as 5,500 years ago, the Arctic had less summertime sea ice than today. However, it is not clear that the Arctic was completely free of summertime sea ice during this time.

        The next earliest era when the Arctic was quite possibly free of summertime ice was 125,000 years ago, during the height of the last major interglacial period, known as the Eemian. Temperatures in the Arctic were higher than now and sea level was also 4 to 6 meters (13 to 20 feet) higher than it is today because the Greenland and Antarctic ice sheets had partly melted.”

        https://tinyurl.com/y9fad795

  14. Scott Rose says:

    We finally have started to realize the la nina conditions. Check out the NH plunge to +0.12 are you kidding me? Tropics are barely above baseline +0.05 which indicates this will drop more next month. We haven’t realized the la nina 100% yet. Tropics can absolutely go below baseline. The plunge also is right on time with the 60 year and 42 year cycles aligning to the downside at the conclusion of the great conjunction.

  15. All that is needed is continued La Nina conditions, some major volcanic activity, PDO/AMO cooperation and all the warming will be wiped out. Just that fast.

  16. I noticed, and a friend of mine pointed out to me, that the average of reported figures for NH and SH is +.22 (half of .12 + .32), while the reported figure for the globe is +.27. (For December 2020.) What is the cause of this discrepancy?

  17. This is just one month but it has to start sometime maybe it is this time maybe it is not but this is better then having the temperatures continue to go up. Only time will tell.

  18. Richard W says:

    I enjoy reading these updates, so many thanks, even if I am not an expert. Can someone help me?
    For every other month the global change is the average of the NH and SH figure eg for 2020 11 Globe = (.67+.39)/2 =1.06/2 =0.53. But for 2020 12 the NH SH average is 0.22 not the quoted figure of 0.27. Is one of the figures wrong or am I?

    • Richard Willmer says:

      Further to my previous post, I am not sure if the figures have been updated or I misread them, but they look OK now.

    • barry says:

      They were amended after the host was alerted to an error. Your eyes and brain are working fine.

  19. .27 c still lower.

    N.H +.22C I wish it as still +.12c

  20. CO2isLife says:

    Simple question, temperatures are below where they were in 1987. How is that possible if CO2 is the main driver of temperatures?

    Using this data site, temperatures are no different than they were 140 years ago. How is that possible if CO2 is the main driver of temperatures?
    Use the Unadjusted Data. For some reason, NASA “adjusts” a desert station for both H2O and the Urban Heat Island effect which clearly aren’t present.

    • co2 is life it is possible because it is not so.

    • Lou Maytrees says:

      C02is,
      Temperatures were below 1987’s high anomaly in 2018 too, and then they rose higher than 1998’s extreme high anomaly in 2020 according to the UAH Lower Atmosphere graph above.

      It’s possible CO2 is the driver b/c as Dr Spencer states temperature is still rising in the UAH Lower Atmosphere at +.14*C per decade.

      • CO2isLife says:

        Lou, thanks, but heat isn’t maintained in the atmosphere. It isn’t like a battery, radiation travels at the speed of light. If temperatures fall below a distant period, that energy is gone, and resets. Energy has to be added back in. How can CO2 cause the variability seen in the temperature? The physics of the CO2 molecule are constant. How can temperatures spike, collapse, and flat line if CO2 is the cause of the variability?

        • Svante says:

          CO2 is only causing the long term rise.
          The variation is caused by 20+ other factors.
          https://tinyurl.com/y4z7sqkz

          • CO2isLife says:

            Svante, “CO2 is only causing the long term rise.”

            There is a problem with that theory. Once you take out a previous low, the system resets. The atmosphere isn’t like a battery. If CO2 is causing the warming, you wouldn’t take out previous multi-year lows. CO2 wouldn’t allow for pauses, or multi-year declines. The temperatures appear to follow “steps” not trends. That is inconsistent with the physics of the CO2 molecule and its interaction with 15µ LWIR.

          • barry says:

            If variance is +/1 10 per year and the steady rise is 1 per year, then you would need 20 years to get a clear view, and there could be plenty of ups and downs in that period.

            The amplitude of the variance is much greater than the estimated signal, so, yes seeing a few years of lows is entirely expected.

            What would be really weird is if we saw a monotonic, year on year rise, as if CO2 warming somehow stopped all weather happening.

            Roy Spencer shows how you can get ‘steps’ appearing when actually there is an underlying trend and more than one kind of variance overlaid.

            http://www.drroyspencer.com/2013/11/the-magical-mystery-climate-index-luis-salas-nails-it/

            Do you see why it’s possible?

            And not just possible – it’s inevitable you would see what look like ‘steps’ if there was a semi-regular oscillation every few years or so.

            Like el Ninos.

            CO2 – what methodology would you use to determine whether el Ninos were causing ‘steps’ absent CO2 warming, or el Ninos making it look like steps with CO2 warming?

            I mean, there is an issue with positing that el Ninos cause all the warming, right? Once you track that back in time, suddenly you have to ‘predict’ that the world was -10C colder a couple hundred years ago. Or you’d have to posit that it is only *now* that el Ninos cause warming, whereas they didn’t before a few decades ago.

        • barry says:

          CO2 is not the cause of short-term variability. No one serious says it is.

          • CO2isLife says:

            Barry, that is good news. Unfortunately I haven’t seen any models trying to explain that variability or to tease out the impact of CO2 in existing data sets. All I’ve seen are “adjustments” to make the temperature more linear and to better correlate with the trend in CO2.

            Anyway, here is a 140 year data set removed from the impact of H2O and the Urban Heat Island Effect. This is the best way I can think of to identify the long-term impact of higher CO2, isolate its impact by removing H20 and the UHI Effect.

            Basically, you find that when CO2 is the only factor, it doesn’t cause any warming at all when CO2 increases from 270 to 410. That is pretty much what one would expect because of the trivial change in W/M^2 is easily negated by natural factors such as a cloud or weather front.

            Use the Unadjusted Data:
            https://data.giss.nasa.gov/cgi-bin/gistemp/stdata_show_v3.cgi?id=501943260000&dt=1&ds=5

          • barry says:

            Well you have two problems there.

            1. You’re using a single location as a proxy for global.

            2. The weather station has had changes over time, including different temperature sensors (thermometers etc) replacing previous.

            1.) Here is a station where the raw data shows RAW temps much cooler in the past.

            https://tinyurl.com/yaeerncw

            So which station is a better proxy for global?

            Answer = neither.

            2.) Alice Springs’ weather station metadata shows multiple changes of temperature measuring intruments.

            https://tinyurl.com/yaeerncw

            Your method rests on the assumption that these changed instruments are all perfectly calibrated with each other. Your assumption also rests on the notion that there have been no other non-climatc changes affecting the data at the station.

            Fortunately, the people compiling these data sets make no such assumptions.

          • barry says:

            “Unfortunately I haven’t seen any models trying to explain that variability or to tease out the impact of CO2 in existing data sets.”

            Have you looked?

            https://agupubs.onlinelibrary.wiley.com/doi/full/10.1029/2008GL034864

            https://iopscience.iop.org/article/10.1088/1748-9326/6/4/044022

            https://www.ipcc.ch/site/assets/uploads/2018/02/ar4-wg1-chapter9-1.pdf

          • CO2isLife says:

            Barry says: Have you looked?

            CO2isLife says: Yep, I guess Climate Science creates models different from what everyone else does. I’m looking for Y = mX11 + m2X2 + m3X3 + m4X4…+ e. Climate science seems to name factors without every publishing the coefficients or R-Squares of the models. I’m 1,000% confident that any CO2 based temperature model will have an R-Squared close to 0.00, unless some serious data “adjustments” have occurred.

            Once again, simply look at a desert. CO2 doesn’t change temperature.
            https://data.giss.nasa.gov/cgi-bin/gistemp/stdata_show_v3.cgi?id=501943260000&dt=1&ds=5

            The physics of the CO2 molecule are constant regardless of the location and how many sites you chose, only some will have been corrupted by Water Vapor and the Urban Heat Island effect. Choose a location for control for those two factors and you will find no warming.

          • barry says:

            Ok, I’m looking at a desert:

            https://tinyurl.com/yb97gthb

            Temps are hotter now than before.

            So which ocation is the better proxy for global temps?

            Neither are. And obviously so. Or they would show the same temperature profile.

            And you are, consistently, assuming that the raw data is untainted by non-climate effects, which we know not to be the case.

            You are having to deny the impurity of the data, and deny that there are other places in the world (even desert towns) with a different profile to Alice Springs (meaning that one location cannot represent global), in order to make your case.

            Which, therefore, is just not convincing.

          • barry says:

            “I’m looking for Y = mX11 + m2X2 + m3X3 + m4X4…+e. Climate science seems to name factors without every publishing the coefficients or R-Squares of the models.”

            Um, did you read anything I linked? How about the first link?

            “A reconstruction of monthly mean surface temperature anomalies, TR, is determined from zero mean, unit variance time series of ENSO, E, volcanic aerosols, V, solar irradiance, S, and anthropogenic forcing, A, as TR(t) = c0 + cEE(t − ΔtE) + cVV(t − ΔtV) + cSS(t − ΔtS) + cAA(t − ΔtA) where the lags (in months) are ΔtE = 4, ΔtV = 6, ΔtS = 1 and ΔtA = 120 (chosen to maximize the explained variance). The fitted coefficients, c0…, their one sigma uncertainties, Δc0…, and the correlation matrix are obtained by multiple linear regression….

            The given uncertainty is the square root of the summed variance of the one‐sigma uncertainties (from the multiple regression).”

            As they are using multiple variables that operate with different time lags, your methodology has limited utility. The correlation coefficient is given in the first graph.

            From the second study:

            “Also listed are the total variances of the raw data sets, and the variance of the residuals as well as R2 values (which gives the fraction of variance explained by the model) both for a simple linear trend with no other factors, and for the full model.”

            So now you’ve seen some attempts to winnow out natural variability and rather than be interested in something you’ve never seen before and spending some time investigating, you flick through to see what you can find to dismiss it?

            But it seems you did not even look at the papers.

          • Nate says:

            “I haven’t seen any models trying to explain that variability or to tease out the impact of CO2 in existing data sets. ”

            Don’t equate your own ignorance with science’s. They are not the same.

            The variability has been teased out by many groups.

            https://journals.ametsoc.org/view/journals/clim/22/22/2009jcli3089.1.xml?tab_body=fulltext-display

    • bdgwx says:

      The 13 month average in 1987 was 0.04. 2020 ended at 0.50. Temperatures are WAY higher this year than they were in 1987. Month to month variation is quite high though with an SD of 0.2C. So the odds of finding a month from years ago that is lower than the current month is actually very high even with a warming rate of +0.14C/decade. That’s just the way the math works out.

    • barry says:

      The initial adjustment for station moves and other non-climatic effects produces the same plot as the following two homogenisation methods, so I’m not sure if adjustment for urbanisation has actually happened. (I’ve been to Alice Springs a few times).

    • bdgwx says:

      CO2isLife,

      Speaking of adjustments maybe you can tell us why UAH adjusted 3 of the last 24 months down on this update?

  21. bdgwx says:

    On this update the warming trend is 0.1376C/decade +/- 0.066. The trend line has increased to +0.35 which puts December 0.08 below the trend line. This is the highest December relative to the trend line for a La Nina year where the ONI value was >= 1.0. I think it is unlikely that the 13 month average will drop below the 1981-2010 average. I’m not even confident that it will drop below +0.2, but we’ll see.

    • Richard M says:

      Bdgwx, I agree with you to a degree. Our oceans provide a buffer against big changes. Hence, it is unlikely we will see levels of cooling to temperatures seen decades ago.

      With this in mind the drop of .26 C in a single month is unusual. The one possibility is both poles were very warm and they are not included in the UAH measurement system. If this is true then we aren’t likely to see similar drops in the next few months.

      It is likely to take persistent La Nina continuing to bring cold water to the surface to generate enough ocean cooling to return to 20th century temperatures. Or, we could see changes in the PDO and AMO that would return the overall state of the oceans back to when it was cooler.

      The bottom line is the atmosphere will follow the oceans.

      • Richard M says:

        To take this thought a bit further consider that UAH covers about 95% of the globe. If the 5% would 2 C different that would increase or decrease the anomaly by ~.1 C.

        For example, the 5% could have been 2 C colder in November and 2 C warmer in December. The true anomaly would then have been ,43 in November or a .11 drop from October and making this months drop lower at .16.

        The poles tend to have the greatest variance which is why we are sometimes surprised by results. However, they do eventually average out.

  22. ren says:

    This winter, the temperatures in Scandinavia will compete with those in Siberia.
    https://i.ibb.co/rGHW34c/hgt300.png

  23. CO2isLife says:

    Here is the link to Spectralcalc which has a blackbody calculator. Enter -80C° and 13 and 18µ as the range. You will find that the peak is 15µ.

    On another note, has anyone bothered to uses these data sets to tease out the long-term trend of CO2? CO2 evenly blankets the globe, and the physics are the same at each location. The differentials between the N and S Hemi, Sea and Land, Arctic and Antarctic, desert and rain forest all have the same contribution by CO2, so the differentials have to be due to something other than CO2. All the climate models I’ve seen focus on CO2, but that isn’t how a real modeler would build a climate model. Temperature is highly variable, whereas the W/M^2 from CO2 increases gradually, and has a log decay. That is easy to model, and can be converted to ΔT/Δ(W/M^2). That can be calculated by simply using a desert weather station like Alica Springs.
    https://data.giss.nasa.gov/cgi-bin/gistemp/stdata_show_v3.cgi?id=501943260000&dt=1&ds=5

    Temperature is highly volatile, but there is no trend, so all the variability is due to something other than CO2, which gradually trended higher as did W/M^2 over the past 140 years.

    Once you use Alice Springs to determine the ΔT for a ΔW/M^2 of 15µ LWIR, then the modeling should start to give some solid results.

    Take the above concepts over to the Econometrics department. From what I’ve gathered, these modeling techniques seem to be foreign to the field of Climate Science. Multi-variable modeling is what economists do on a daily basis.

  24. ren says:

    Events called stratospheric ozone intrusions occur most often in spring and early summer, and can raise ground-level ozone concentrations in some areas to potentially unhealthy levels.

    This visualization shows one such event that occurred on April 6, 2012
    https://youtu.be/XIAuaC_8br4

  25. Bindidon says:

    Another view on H2O vs CO2 using the HITRAN data base at SpectralCalc

    Comparison of the two gases

    – at the surface

    https://drive.google.com/file/d/1I32co5V0Zjp4I-kU-cuW3ayTE-iIFWkW/view

    – at 15 km altitude

    https://drive.google.com/file/d/1I53h9NLc-5mFZroYg2BrOp3AagWyRQiJ/view

    Caution: please look at the difference in absorp-tivity/emissivity in cm-1/cm in the two graphs, before drawing wrong conclusions about CO2’s power vs. that of H2O.

    The two graphs do not show how strong or weak CO2 is; they rather show how they respectively behave at the two altitudes.

    Scaling respects the respective atmospheric abundances.

    Yeah: viewed that way, CO2’s effect indeed is extremely tiny…

    Wait and see.

    Anyway: both graphs pretty good show that the atmospheric window isn’t about to get filled by either gas!

    J.-P. D.

    • CO2isLife says:

      Bindidon, interesting graphic. It appears that on the surface, CO2 is basically dwarfed by H2O, and that CO2 absorbs far higher energy LWIR. Way up at 70km, where only CO2 exists as a GHG, all the 15µ LWIR is thermalized, and that is why the temperature bottoms out around -80C°. I guess if you have a glacier at 70km, that would be a problem that would melt at -80C°, that would be a problem. Other than that, your charts pretty much prove that CO2 doesn’t so much at the surface.

    • barry says:

      It does have an effect at the surface, and what happens elsewhere in the atmosphere translates througout. If the tropopause raises in height, then the temperature at the surface gets warmer, as the lapse rate remains virtually the same (lapse rate change in this circumstance is a small negative feedback).

      Unless there is some kind of thermal shield, temperature changes in one part of a thermally interconnected system will affect the whole system.

      • Clint R says:

        Surface warming would raise the tropopause, not the other way around. That allows more radiation to space.

  26. Maz says:

    Could a kind reader here please assist me ?
    I believe that from now that for the next ten years the temperature anomalies will be based upon the average of 1991-2020 ?
    If someone could give me the base in actual degrees rather than as a variatiation I’d very much appreciate it. Although I can see why variations are important, I simply can’t find the actual average temperature anywhere.

    • Along those lines temperature deviations should NOT be based upon the 1991-2020 baseline. That would be a mistake and be so misleading. The baseline should stay as is or even go back to the 1979-2000 baseline which is what the climate analyzer uses.

      Using a 1991-2020 based line will not give us a clear indication.

      We need really to go back further in time as far as the baseline is concerned. Ideally 1961-1990 would be even better.

    • Clint R says:

      Maz, you may be looking for the actual base temperature the anomalies are based on. I don’t remember where I saw it, but it’s close to 263K. Maybe someone can supply a link to the exact value.

    • bdgwx says:

      I believe it is around -10C if I’m remembering correctly.

    • Bindidon says:

      Maz

      The numbers communicated are correct.

      What isn’t correct is Salavatore’s meaning that a mean over 1971-2000, or over 161-1990 would give better info.

      1. There is anyway no absolute data in UAH for such periods, so you can’t calculate any absolute average for them.

      2. For GHCN daily (about 40,000 weather stations worldwide since 1763, about 15,000 in 1971 and 18,000 in 2010) the 30 year land average was

      – for 1981-2010: 15.286 C
      – for 1971-2000: 15.283 C

      Maybe I manage to compute the average for HadISST1 and mix the two, so we would then have an absolute worldwide raw mean.

      J.-P. D.

    • Bindidon says:

      I don’t have Dec 2020 absolute for UAH yet.

      For 2019, the average of the 12 monthly absolute values was:
      -8.76 C
      i.e. 0.39 C warmer than the average for 1979-2019:
      -9.15 C

      J.-P. D.

  27. My prediction- no one can predict what the climate is going to do.

    This is why we will all have to wait and see.

    • Salvatore:
      The climate has been intermittently warming for over 300 years, since the Little Ice Age centuries. So why not just assume the warming trend will continue? It has not harmed anyone, and a sensible person would say it was good news.

      That continued mild warming assumption makes a lot more sense than predicting the warming will end, or accelerate.

      Why is it that FUTURE global warming is always predicted to be 100 percent bad news, when PAST global warming was 100 percent good news?

      “Climate change” has always been nothing more than always wrong, wild guess PREDICTIONS of a coming climate crisis. Coming for the past 60 years, but a crisis never arrives … as our climate actually gets better and better over the decades !

    • gbaikie says:

      I can predict what global climate going to do.
      It’s going to remain in Ice Age for thousands of years.
      I can’t predict global weather, nor regional weather.
      What we have doing for last few decade is talk about global weather
      being the same as global climate.
      And it seems to me, solar min has an effect upon global weather.
      But in terms of less than century, a grand solar min, is not going have much effect upon global climate, nor would grand solar Max.
      But both would effect weather.
      So predict what going to happen in 100 years- our ocean which has average temperature of about 3.5 C {though we don’t know it’s exact temperature} will remain around 3.5 C.
      Large slabs of ocean could warm by say 1 C within 100 years, and could change weather.
      But entire ocean temperature determine global climate, and entire ocean will warm or cool by as much as .5 C within 100 years.

      If or when ocean warms by .5 C, our interglacial period will get closer to the warmest interglacial period we have had in 1/2 million years. If cools by .5 C we on the road to a glaciation period and could coolest it’s been in say, the last 40,000 years.
      And with billions people living in our world, a ocean which .5 C will add challenges, and very severe weather would be part of world with ocean which is about 3 C.
      Centuries of a grand solar min, might get ocean near 3 C, but predicting anything 100 or more years in the future is pointless in terms things like governmental polices.

      I think it’s possible we could become a spacefaring civilization within 50 years- if was going likely take more than century, I would not have much interest in the topic.
      A related topic to spacefaring civilization is ocean settlements, and likewise I think we will have ocean settlements in less than 100 years.
      Of course within 50 years, we going have issues related to AI- both good and bad things. Though there is good and bad things, related ocean settlements and/or spacefaring civilization- but in terms which comes first, I think, AI is likely to be sooner.

  28. joe says:

    “December, 2020 was +0.27 deg. C, down substantially from the November, 2020 value of +0.53 deg. C.”

    Well, I guess global warming is over.

    • bdgwx says:

      Nah…just La Nina doing its thing. Well…actually…with the ONI index < 1.0 we would normally expect December to be even lower than what was reported. In fact, relative the trendline this is the highest December value for a < 1.0 La Nina in the record. So maybe this La Nina isn't doing its thing very well?

    • Bindidon says:

      joe

      ” Well, I guess global warming is over. ”

      Are you serious?

      I guess you aren’t, but I just computed and sorted extra for you the differences between each month and its predecessor, here the two top5:

      lower:

      2013 2 -0.32
      1984 9 -0.29
      1987 3 -0.29
      1998 11 -0.28
      2020 3 -0.28

      higher:

      1984 10 0.43
      2010 1 0.39
      2009 7 0.37
      2013 1 0.33
      1983 3 0.32

      Hope it helps.

      J.-P. D.

  29. Dr. Luke Warmer says:

    I do wonder how the mainstream media would handle a significantly cool 2021 year? Silence?

    Also the COP26 climate conference might have a different energy, but obviously the academics know this is the La Nina, but without the media support there would be less coverage.

    • barry says:

      Let’s say 2021 ends up being ranked 13th warmest out of the full 41 year UAH temp record.

      How do you think that should be covered?

    • Gordon Robertson says:

      doc…”I do wonder how the mainstream media would handle a significantly cool 2021 year? Silence? ”

      Oh, no…they have their pat answers prepared. They will claim it was predicted by the anthropogenic theory.

      • Gordon Robertson says:

        ps. NOAA and GISS will reach a higher level of fudging to compensate for any cooling.

      • barry says:

        “They will claim it was predicted by the anthropogenic theory.”

        No, that won’t happen at all, you nitwit. If it is mentioned at all it will be described as the normal ups and downs you will see, even with a rising trend. AGW does not prevent natural, short-term variation. Obviously.

      • barry says:

        “ps. NOAA and GISS will reach a higher level of fudging to compensate for any cooling.”

        No, nitwit.

        If that were the case every year would be warmer than the previous in the temperature record.

        The amount of BS you spout could green a desert.

  30. Mick says:

    Hey remember when chemtrails were a conspiracy theory…oops

    https://news.trust.org/item/20201218140025-po1gu

  31. CANOVA0099 says:

    Thank you!!1

  32. SAMURAI says:

    Finally, the La nina cooling cycle has begun.

    The current la nina has already peaked and was not as cold as some models projected, however, it is the coldest la nina event in 10 years, and will finally offset some of the warming spike from the 2015/16 Super El Nino.

    By May of this year, the UAH 6.0 global temp anomaly should fall to around -0.1~-0.2C.

    At some point relatively soon, the PDO and AMO cycles will reenter their respective 30-year cool cycles and bring decades of global cooling, despite record CO2 emissions, and this insane CAGW scam will laughed onto the trash heap of history.

    • barry says:

      Glad to see you doubling down on your predictions. I’ll just remind you of a previous one from August 2019:

      “The CMIP5 5 climate model ensemble predicts the global temp anomaly will be +1.2C by 2020, with a global warming trend of 0.2C/decade, when reality will be a -0.2C global temp anomaly”

      http://www.drroyspencer.com/2019/08/uah-global-temperature-update-for-july-2019-0-38-deg-c/#comment-370872

      Well, you can’t win them all.

      • SAMURAI says:

        Barry-san;

        My 2019 prediction was based on a strong la nina at the end of 2020. It turns out a moderate la Nina occurred (still the strongest in 10 years) which caused, as predicted, global temp anomalies to fall precipitously at the end of 2020, and falling global temps will continue for the next 4~5 months.

        There is a 5~6 month lag in UAH global temp anomalies and ENSO 3.4 SST anomalies, so global temps will continue to fall through April~May of 2021.

        Let’s see how far UAH 6 temp anomalies fall by the end of April~May and you’ll see my predictions by -0.1~-0.2C will be much more accurate than CAGW lunatics who predicted +1.2C by 2020…

        What you silly CAGW lunatics should be terrified about is falling global ocean SSTs in the: North Atlantic, South Atlantic, equatorial Pacific, South Pacific, the Southern Ocean, and the Southern Indian Ocean:

        These falling SSTs show the PDO and AMO are moving towards their respective 30-year cool cycles, which will mean 30 years of cooling (as occurred in 1880~1910 and 1945~1978) leading to the hilarious CAGW scam being laughed onto the trash heap of history.

        • Rob Mitchell says:

          Samurai, in one way I hope you are right, but the other way I hope you aren’t. I will be happy to see a cooling trend for the purpose of discrediting the CAGW scam as you mentioned. Plus, it will show that once a trend begins, you can’t just extrapolate that out till the Apocalypse. Temperature trends do eventually change over several decades of time.

          But if we do go cooler, that will make our storms more severe due to the stronger gradient that will exist between the poles and the equator. Tornadic thunderstorms were more numerous during the 1960s and 1970s than they are today. More deaths will result from a cooling climate than a warming one. So in regards to that, I am not so eager to see it happen.

          If the global temperature just stayed roughly the same over the next 3 decades, I would be happy with that.

          • SAMURAI says:

            I agree a colder earth is terrible for the earth as are low CO2 levels, but, alas…

            The Left is insane.

          • barry says:

            Yeah, the left are always the first in a science discussion to start pointing political finge… oh wait.

    • Richard M says:

      I am totally in agreement with Samarai that the oceans are the primary driver of the global climates. However, we need to factor in new information as it comes available.

      A new paper on the PDO from a few years ago indicated it has multiple cycle times with some half cycles as low as 8 years. I wouldn’t expect to see a 30 year negative PDO.

      Another new paper shows newly discovered active geothermal plumes in the Arctic that may be having a warming effect on the Arctic ocean.

      https://agupubs.onlinelibrary.wiley.com/doi/10.1029/2020JB019837

      It is possible the decreases in Arctic sea ice over the last few decades has multiple causes. If this geothermal factor is a large part of that ice loss then the AMO going negative may not lead to any large increases in sea ice. The net result would be a continued warm Arctic which is the biggest single factor in GAST increases of the last 4 decades.

  33. coturnix says:

    Btw, Happy Aphelion everyone!

    • coturnix says:

      sorry, i meant perihelion. so stupid.

      • Clint R says:

        That’s okay coturnix. People get the two confused often. I use the simple memory trick–

        Aphelion — “Apart”.

        Perihelion — “Perty” close. (“Perty” being the backwoods translation of “pretty”.)

  34. Mark Wapples says:

    Could somebody tell me why a rise in temperature is global warming, but a drop in temperature is Weather?

    This is the one thing that has always confused me.

    Similar rules seem to apply to la nina and El nino.

    • barry says:

      Any short-term stuff is weather, warmth or coldness.

      Long term stuff is climate.

      El Ninos and la Ninas are both weather.

      • Svante says:

        Thirty years is the usual benchmark, although the AMO and PDO may be twice that.

      • SAMURAI says:

        Barry-san:

        You are precisely correct that AMO/PDO cycles are weather and not climate…

        However, the ENTIRE CAGW scam is based on the PDO/AMO warm cycles since 1980 and a few Super el nino spikes…

        Once the PDO and AMO both switch to their respective 30-year cool cycles, and we have 30 years of cooling despite massive increases in CO2 emissions, the absurd CAGW hoax is toast…

      • barry says:

        Good morning, SAMURAI-san.

        “the ENTIRE CAGW scam is based on the PDO/AMO warm cycles since 1980 and a few Super el nino spikes…”

        Allow me to plot PDO and AMO against global temps since 1900.

        https://tinyurl.com/y77x3pn3

        Results:

        Global surface temp trend = 0.06 C/decade

        PDO trend = 0.002 C/decade

        AMO trend = 0.02 C/decade

        That works out to 0.04 C/decade from forcings other than PDO and AMO.

        • SAMURAI says:

          Barry-san:

          You’re a little slow….

          The global warming trend form 1979~2020 is now 0.14C/decade which was primarily caused by the PDO/AMO entering their respective 30-year warm cycles within this time frame, residual LIA recovery, a couple of Super El Niño events, and the strongest string of solar cycles in 11,400 years from 1933 to 1996 and a teeny tiny amount of CO2 forcing…

          Once the PDO and AMO reenter their respective 30-year cool cycles, global temps will again start to fall as they did in previous PDO/AMO cool cycles (1880~1910 and 1944~1977)..

          You REALLY haven’t thought this through very well, have you…

          Your sophomoric arguments are working against you, but you’re to ignorant to appreciate that reality…

          You make me laugh.

        • barry says:

          Civility is a delicate flower.

          UAH temp trend 1979 to 2020 = 0.14 C/decade

          AMO temp trend 1979 to 2020 = 0.11 C/decade

          PDO temp trend 1979 to 2020 = -0.20 C/decade

          Combined trend AMO/PDO = -0.09 C/decade : general cooling trend

          https://tinyurl.com/yxqucatp

          Now maybe you don’t like trends. So let’s plot the data as best we can to visualise what has happened in that period.

          https://tinyurl.com/y44psppl

          Here is the result without any smoothing.

          https://tinyurl.com/y3ky37w2

          Your claim is that PDO/AMO conspired to cause warming over 1979-2020. The PDO mostly cooled over that period. And the cooling trend was stronger than the AMO warming trend.

          I see you’ve added solar cycles to the mix in your latest comment. Ok then.

          https://tinyurl.com/yxddtzxr

    • bdgwx says:

      Both rises and falls in temperature on short time scales and small spatial scales is weather. Global warming is the long term secular increase in the global mean temperature. El Nino and La Nina are transient cycles that provide no long term perturbation either way in Earth’s energy balance or global mean temperature.

      • Clint R says:

        You got something right, bdgwx! Way to go.

        A molecule of CO2 is a model of ENSO. When the molecule absorbs, that’s “La Niña”. When the molecule emits, that’s “El Niño”. It’s a transient cycle that provides no long term perturbation either way to Earth’s energy balance or global mean temperature.

      • Richard M says:

        Bdgwx, I agree as long as you define long term correctly. ENSO over short periods such as the satellite record can influence trends unless the data is corrected.

        As the Cristy/McNider 2017 paper demonstrated, correcting for ENSO and volcanoes significantly reduces the UAH trend.

  35. Darwin Wyatt says:

    SDP- “Good news”.

    Good news? I’m freezing my arse off in Alaska. Take it back! Just kidding, I know you’re vindicated. Congrats.

    Minus nine f this morning in Alaska.

    Been too sick to feed the blazeking and had to turn my natural gas boiler on yesterday. Lifesaver. I could get use to it too. If I wanted a two hundred dollar monthly heating bill that is.

    I still think geo-thermal is the cause of the ocean warming. Like a geyser but on a vast scale. I think they all synchronize at times. What else explains it? It’s surely not a trace trace gas. I know I’m not the first to suggest it. Or maybe I am. In which case i’ll take my Nobel prize money now please. Again congrats on the cooling prediction.

    • barry says:

      “I still think geo-thermal is the cause of the ocean warming.”

      Is that one of those fact things that you don’t need any evidence for?

    • barry says:

      Just read a global temp researcher on the topic:

      “The vertical profile of ocean warming (if it can be believed) suggests warming decreasing with depth. It’s hard to imagine that the heat is originating from below. Also, we need to distinguish between the average geothermal heat flux versus any increasing in that over time, the latter being “forcing”. Finally, any increase in geothermal heat flux would probably take centuries to be felt at the surface… the ocean abyss has stable stratification, and so must be slowly forced upward on the large scale by convective sinking in certain polar regions.”

      https://judithcurry.com/2019/07/21/geothermal-ocean-warming-discussion-thread/

    • Bindidon says:

      Darwin Wyatt

      Geothermal is on average about 1 W/m^2.

      Sun’s normal surface irradiance is approximately 1000 W/m^2 at sea level on a clear day.

      Hope it helps…

      J.-P. D.

      • Bindidon says:

        Of course: we have to apply a cosine weighting here, and to consider cloudy skys.

        The cosine weighting for your latitude (60N I guess) is 0.5, and 50 % cloudy sky added gives 0.25.

        We are still far away from geothermal!

        Even the ridiculous 2 W/m^2 coming from backradiation is twice that…

        J.-P. D.

      • CO2isLife says:

        “Suns normal surface irradiance is approximately 1000 W/m^2 at sea level on a clear day.”

        Removing H20 and changing CO2 from 270 to 410 ppm adds 2.83 W/M^2.

        Compare a single sunny day to the back radiation of CO2, and that ignores that the CO2 back radiation is very low energy 15µ LWIR.

        From your own data, and that the sun only falls on 1/2 the earth at a time, and irridance per M^2 decreases with incidence angle, let’s say solar radiance = 250 W/M^2 of high energy wavelength light that actually warms the oceans.

        1 Sunny day is the equivalence of about 100 days of CO2. Throw in H20 and the numbers for CO2 being the cause of warming even dwindle more. Worse yet, find a desert station. CO2 hasn’t caused warming in over 140 years. Use the “Unadjusted” data.
        https://data.giss.nasa.gov/cgi-bin/gistemp/stdata_show_v3.cgi?id=501943260000&dt=1&ds=5

        • Nate says:

          “Compare a single sunny day to the back radiation of CO2, and that ignores that the CO2 back radiation is very low energy 15 LWIR.”

          My microwave oven uses radiation with MUCH longer wavelengths.

          I wonder, how can such low energy photons possibly heat my cup of coffee?!

          • Clint R says:

            Troll Nate, first you should realize that there are no microwave ovens in the atmosphere. That realization is called “common sense”.

            Second, you could study how a microwave oven works and learn about things like “magnetrons” and “waveguides”. That is called “science”.

            But, idiots have no common sense and can’t learn.

            I guess you’re destined to always be a troll. At least you know how to type….

          • Nate says:

            And as expected, we get ‘Look a squirrel’ from Clint the professional point misser.

            To repeat for the mentally deficient:

            Microwave wavelengths are LONGER than IR wavelengths. Thus microwave photons contain lower energy. And yet with enough of these photons, they can very effectively heat things.

            Thus with respect to heating ability, ‘back radiation is very low energy 15 LWIR’, is a big red herring.

      • Bindidon says:

        Jesus.

        I’m getting sad of these stoopid, endlessly repeated comments fixated on CO2.

        I didn’t imagine that one day, somebody would appear as being even worse, even more egocentric than the Robertson plague.

        Terrifying.

        JU.-P. D.

        • CO2isLife says:

          I sorry, Bindidon, did you refute anything I posted, or just insults? Are you claiming that Climate Science isn’t 100% based upon getting funding to prove CO2 is the cause of warming? Is that your position? Are you agreeing with me? Or are you claiming that this CO2 Centric Science shouldn’t be CO2 centric?

    • bdgwx says:

      Darwin said: I still think geo-thermal is the cause of the ocean warming.

      Geothermal is about 0.1 W/m^2. Radiothermal energy accounts for the majority of that with the Earth/Moon tidal dissipation only accounting for a small fraction. Anyway, the Earth Energy Imbalance is currently at about +0.8 W/m^2. Obviously geothermal cannot explain the magnitude of the EEI nevermind that a jump in geothermal energy of 9x has not been observed nor is there a mechanism that could explain a jump of that magnitude.

      • CO2isLife says:

        “Geothermal is about 0.1 W/m^2.”

        That is a complete joke, just where did you get that data? How was it reached? Where are the instruments located that provided that data? Whhat is the standard deviation of that data set?

        The facts are Climate Science makes definitive statements with absolutely no credible data sets to support them. There entire CO2 model is like doing an experiment on weight loss and ignoring exercise and caloric intake. They simply lack the critical data on significant variables. They don’t even model H20 effectively. Without that, no model is valid, none. Step outside the bubble of climate science and every real scientist will say the exact same thing.

        • Tim Folkerts says:

          “That is a complete joke, just where did you get that data? … Climate Science makes definitive statements with absolutely no credible data sets”

          That would actually be geology, not climate science. You can read more with the url below, like “One recent estimate is 47 TW, equivalent to an average heat flux of 91.6 mW/m2, and is based on more than 38,000 measurements.” Just because *you* don’t know something does not mean it is unknown or unknowable! Geologists and been thinking about this and collecting data about this for years.

          https://en.wikipedia.org/wiki/Earth%27s_internal_heat_budget

          • Clint R says:

            The joke is how an insignificant flux from geothermal does not “add”, but an insignificant flux from the atmosphere does “add”!

          • barry says:

            The estimated value for geothermal is a steady state value. It doesn’t add because it is not a changing quantity.

          • Clint R says:

            That’s creative…and funny, barry.

            But, it ain’t science.

    • Richard M says:

      Darwin asks “I still think geo-thermal is the cause of the ocean warming. Like a geyser but on a vast scale. I think they all synchronize at times. What else explains it?”

      Salinity. The overall salinity of the ocean mixed layer (top ~100 meters) has been increasing for around 400 years. Water that is more saline requires more energy for evaporation. Since evaporation is a cooling effect, the reduction over time will lead to warmer water.

      That said, there may be some important areas where geothermal is having an effect. A newly discovered plume near Svalbard would directly effect water flowing into the Arctic Ocean.

      https://agupubs.onlinelibrary.wiley.com/doi/10.1029/2020JB019837

      No one knows yet if this is new or just a discovery of something that has always been there, so the effects are yet to be determined.

  36. ren says:

    Feedback weak wave in the western Pacific announces no major changes on the surface of the equatorial Pacific.
    http://www.bom.gov.au/archive/oceanography/ocean_anals/IDYOC007/IDYOC007.202101.gif
    https://www.tropicaltidbits.com/analysis/ocean/cdas-sflux_ssta_global_1.png

    • ren says:

      SOI values for 3 Jan, 2021
      Average SOI for last 30 days 17.41
      Average SOI for last 90 days 10.26
      Daily contribution to SOI calculation 23.42

  37. Bindidon says:

    I read, somewhere above:

    ” Finally, the La nina cooling cycle has begun. ”

    Typical Coolista blah blah.

    Look at the current La Nina forecasts:

    1. BoM ENSO

    http://www.bom.gov.au/climate/ocean/outlooks/archive/20201219//plumes/sstOutlooks.nino34.hr.png

    2. JMA ENSO (Japan)
    http://ds.data.jma.go.jp/tcc/tcc/products/elnino/elmonout.html#fig2

    The only vague hint on a possible Nina survival:

    3. BoM IOD (Indian Oceanic Dipole)

    http://www.bom.gov.au/climate/ocean/outlooks/archive/20201219//plumes/sstOutlooks.iod.hr.png

    Wait and see.

    J.-P. D.

    • forecasting ENSO is not accurate. Means nothing.

    • Richard M says:

      Bindidon, if you look back at government ENSO forecasts over the years you will find they are generally over zealous in predicting El Nino conditions. As late as last summer some were forecasting El Nino for this season. oops.

      I’d say the odds favor La Nina to be the main ENSO mode for the next year or so (60-40). We went from 2011 until this recent event without any strong events. No sign at the moment of the current La Nina ending.

      What’s educational is ENSO is the dominant factor in global temperature and yet we still don’t understand what drives it. That alone tells anyone with half a brain the current state of affairs in climate science.

  38. Maz says:

    Thanks to everyone for the temperature bases – very handy

  39. CO2isLife says:

    Something to Consider:
    1) I’ve heard multiple times that CO2 is the only forcing factor that has changed over time. All the other natural forces are constant. That is simply untrue. Vegetation has a huge impact on water vapor in the atmosphere. Ever since the start of fire prevention programs and high yield crop agriculture the globe has greened…a whole lot.
    Human Activity in China and India Dominates the Greening of Earth, NASA Study Shows
    https://www.nasa.gov/feature/ames/human-activity-in-china-and-india-dominates-the-greening-of-earth-nasa-study-shows
    2) Water Vapor by far is the most significant GHG, and an increase in atmospheric H2O would easily dwarf any impact of CO2.

    Case in Point:
    Using Alice Springs, a desert location shielded from the Urban Heat Island Effect and Water Vapor, you find that increasing CO2 from 270 to 410 over the past 140 years did nothing to cause any warming.

    Using MODRAN for a Desert Location, set Water Vapor to 0.00. Changing CO2 from 270 to 410 results in an additional 2.83 W/M^2. That additional W/M^2 resulted in Δ0.00C° (use the unadjusted data)
    https://data.giss.nasa.gov/cgi-bin/gistemp/stdata_show_v3.cgi?id=501943260000&dt=1&ds=5

    Now, let’s add 10% of normal water vapor to this model (Water Vapor setting = 0.1) The W/M^2 explodes to 55.89, Dwarfing anything CO2 could ever hope to achieve.

    If we use full water vapor (setting = 1.0) the W/M^2 = 94.38

    Clearly, a small increase in atmospheric H20 could easily explain any global warming if the cause of warming is an increase in W/M^2.

    This exercise proves that if climate science keeps ignoring water vapor they will never ever develop credible models. Simply look at a temperature chart, it is highly volatile. The impact on W/M^2 by slight increases by CO2 are gradual and show a log decay. Desert locations show no warming due to CO2 over the past 140 years. If additional W/M^2 is the cause of warming, look at H20, not CO2.

    BTW, if H20 is the cause and not CO2, you will find differentials between Land and Sea, N and S Hemi, N and S Poles, Deserts and Rain Forests, farmland and forests and cities.

    • bdgwx says:

      CO2isLife said: Ive heard multiple times that CO2 is the only forcing factor that has changed over time.

      Where are you hearing that? And why do you choose to believe it?

      • Tim Folkerts says:

        “Ive heard multiple times that CO2 is the only forcing factor that has changed over time” seems like a clear strawman argument. Create a false narrative and attack that narrative.

        Scientists acknowledge many factors that come into play. There is perhaps an over-emphasis on CO2, but it is certainly not the only factor that is considered. Sure, there are some general-public-level websites that only mention CO2. But most of these general-public-level mention multiple causes, and I doubt you could find any scientist anywhere who says CO2 is the only contributing factor that has changed over time.

        • CO2isLife says:

          Strawman?

          In its Fifth Assessment Report, the Intergovernmental Panel on Climate Change, a group of 1,300 independent scientific experts from countries all over the world under the auspices of the United Nations, concluded there’s a more than 95 percent probability that human activities over the past 50 years have warmed our planet.
          https://climate.nasa.gov/causes/

          Since 1750, the average amount of energy coming from the Sun either remained constant or increased slightly.
          https://climate.nasa.gov/causes/

          Climate models that include solar irradiance changes cant reproduce the observed temperature trend over the past century or more without including a rise in greenhouse gases.
          https://climate.nasa.gov/causes/

          Analysis: Why scientists think 100% of global warming is due to humans
          Natural variability in the Earths climate is unlikely to play a major role in long-term warming.
          https://www.carbonbrief.org/analysis-why-scientists-think-100-of-global-warming-is-due-to-humans

          And I could go on and on and on and on. Show me a single IPCC model that doesn’t have CO2 as the most significant variable.

          NASA links to this:

          The Very Simple Climate Model
          Use this model to explore how the rate of carbon dioxide emissions affects the amount of CO2 in the atmosphere and Earth’s temperature. You can also explore scenarios for future climate using the model with more detailed instructions. Using the Very Simple Climate Model in the classroom? If so, check out the The Very Simple Climate Model Activity.
          https://scied.ucar.edu/interactive/simple-climate-model

          • bdgwx says:

            Neither NASA nor the IPCC suggest that CO2 is the only factor that effects the climate. I’m definitely getting the impression that you may not be aware of even the most trivial aspects of what is currently known about the climate system and this may be negatively affecting your understanding of the material you are reading. My advice is to read the IPCC AR5 WGI Physical Science Basis report in its entirety. It’s short, maybe 1500 pages, so it is something you can get through in a few of days. It will give a very high level overview and summary of the topics. If you want to drill down into the details there are about 30,000 primary citations that you can dive into at your discretion. A lot of this stuff is complex so it can be overwhelming. If there is something you don’t understand ask clarifying questions.

        • barry says:

          You think that by finding websites that don’t delve into the details of natural variability that it is therefore ignored by the climate science community?

          I can’t believe that you are this ignorant. All you have to do is read any of the IPCC reports – or even just look at the indices and check out the relevant sections – to know that natural variability is well-studied.

          No, you can’t have been commenting for as long as you have without knowing this, unless you are so tightly focussed on some agenda that it never occured to you to look in the most obvious place.

          Here are a couple of primers – for anyone else who is actually curious perhaps.

          From the 2001 IPCC report: https://www.ipcc.ch/site/assets/uploads/2018/03/TAR-01.pdf

          From the 2007 IPCC report:
          https://www.ipcc.ch/site/assets/uploads/2018/03/ar4-wg1-chapter1.pdf

          These are introductory. For more detailed look at natural variation you have to dig deeper into the body of the reports. Even better, you can read the literature on the topics that interest you.

          Natural variability is part of the study of meteorology, so even without a UN framework on AGW these things would be studied, but the efforts of the IPCC have very likely accelerated interest in natural variation.

        • CO2isLife says:

          bdgwx says:

          Neither NASA nor the IPCC suggest that CO2 is the only factor that effects the climate. Im definitely getting the impression that you may not be aware of even the most trivial aspects of what is currently known about the climate system and this may be negatively affecting your understanding of the material you are reading.

          That is a Strawman. Yes, the climate models do have more than 1 factor. What is important is the coefficient they place on those factors. All the models start with the assumption that warming is due to man-made CO2. Prove me wrong. They start with the assumption that the one thing that has changed that could cause the warming is CO2. Try getting funding if your Theory is what I laid out, that the Greening is what is causing the warming, not CO2. Show me any IPCC and “Peer” reviewed paper that concludes anything other than Man is the cause. If Man isn’t the cause, there is no money to be had. We can’t tax the Sun, we can only tax the Oil Companies. That is the unfortunate reality, and that is the only way you get a “consensus” if a field that attempts to model the most complex system known to man.

          • bdgwx says:

            I can find a several peer reviewed studies that give natural attribution > 50% weight. I bet you’d be better at finding those than me though. What I cannot do is find one of those publications that employs models that ignore CO2 (and other GHGs) that matches observations with equal skill than those models that do consider CO2’s radiative force in the appropriate proportion. In fact, most the models in these papers are so bad that they can’t even get the direction of the temperature change correct. And that’s if they even provide an alternate model at all which many do not. Maybe search for Soon, Baliunas, Lindzen, Curry, Spencer, Christy, Easterbrook, Lewis, McKitrick, McIntyre. I believe all of these people scientists who have made it through peer review.

        • barry says:

          “All the models start with the assumption that warming is due to man-made CO2”

          Indices of various forcings are fed into the model run, and the software codes the physics and parametrizes some processes that it doesn’t have enough physical explanation for (like ENSO) or processes that occur on a resolution that the model doesn’t capture (computing power), to see what the result is.

          The atmosphere uses empirical observations of radiative emission from data bases like HITRAN for various gases and aerosols. Warming isn’t baked in, it comes from the coded physics of the radiative-convective model.

          There has been a lot of experimenting. Sometimes CO2 levels are held constant and other indices ‘force’ the system. This is to get an estimate on how various factors contribute to global (and regional) climate/variability on their own. These types of experiments are revisited time and again as models change and (hopefully) improve.

          Often the first thing a new model gets tested for is how it holds together if there are no ‘forcings’, called a control run.

          There was a great side by side comparison of a visualised model run of atmospheric processes, based on the data output by the model, with a satellite derived obervational video. The match of atm,ospheric flows was stunning. I found only the model-based simulation online today.

          https://scied.ucar.edu/learning-zone/how-climate-works/vizualizing-earth

          There are some good primers on how models are made and run. Here’s one:

          https://www.carbonbrief.org/qa-how-do-climate-models-work

    • CO2isLife says:

      BTW, it looks like this greening and water vapor theory has already been thought of…only in reverse.

      Wright thinks this is exactly what happened. By overgrazing the grasses, they were reducing the amount of atmospheric moistureplants give off moisture, which produces cloudsand enhancing albedo, Wright said. He suggests this may have triggered the end of the humid period more abruptly than can be explained by the orbital changes. These nomadic humans also may have used fire as a land management tool, which would have exacerbated the speed at which the desert took hold.
      https://www.smithsonianmag.com/science-nature/what-really-turned-sahara-desert-green-oasis-wasteland-180962668/

  40. Maz says:

    Gents what are your thoughts on warming being caused by stratospheric ozone depletion ?

    Surely when more UV hits the Earth’s surface it must add to the temperature ( unless more energy also leaves ) ? I thought UV will also go straight into ocean warming ?

    By my calcs this energy is substantially higher ( 40-50 times) than 15 micrometre IR ?

    • ren says:

      This happens with low cloud cover. Everyone can feel it on their own skin.

    • CO2isLife says:

      “Gents what are your thoughts on warming being caused by stratospheric ozone depletion ?”

      What is the impact on Antarctica Temperatures? The Ozone Hole is isolated over the S Pole. Has that area been warming? Nope.

      BTW, O2 is transparent to 10µ LWIR, O3 isn’t. Lack of O3 would simply result in cooling, not warming.

      https://ars.els-cdn.com/content/image/3-s2.0-B9780123822253003376-f00337-03-9780123822253.jpg?_

    • bdgwx says:

      IPCC AR5 WGI chapter 8 section 8.3 has a good high level introductory summary of ozone’s effects.

      Here is the ACCMIP breakdown by radiation channel and layer.

      Shortwave troposphere = +0.08 W/m^2
      Longwave troposphere = +0.33 W/m^2
      Shortwave stratosphere = +0.11 W/m^2
      Longwave stratosphere = -0.13 W/m^2

      And here is the multiple study consensus broken down only by layer.

      Troposphere = +0.40 W/m^2
      Stratosphere = -0.05 W/m^2

      So stratospheric ozone depletion results in a small net cooling effect.

      BTW…chapter 8 has a wealth of information in there regarding dozens of climate forcing agents.

    • Tim Folkerts says:

      “By my calcs this energy is substantially higher ( 40-50 times) than 15 micrometre IR ?”

      Yes and no. The energy of an individual UV photon is indeed much higher than an individual IR photon. A single 0.3 um UV is 50x more energy than a single 15 um IR photon. But there are a lot more photons near 15 um than near 0.3 um. You would need specify just what band of UV and IR you are considering to know which is more overall energy (and then specify if you mean energy coming in at the top, or energy arriving at the ground).

      As a rough approximation, 10% of solar energy radiated by the sun is UV, 40% is visible, and 50% is IR.

      • Clint R says:

        A single UV 0.3μ photon has 50 times more energy than a CO2 15μ photon, and 50 such CO2 photons have the same energy as the UV photon. BUT, the 50 CO2 photons can NOT raise temperature to the same as UV. Energy adds, but frequency does NOT add.

        That’s why a liter of 40° water added to another liter of 40° water remains at 40°.

        That’s why adding 50 ice cubes does not raise the temperature over one ice cube.

        Trying to always claim adding energy will raise temperatures is one of the many mistakes made in the AGW nonsense.

        • bobdroege says:

          We are not adding frequencies, we are adding energy.

          Or watts/meter squared, which we can add.

        • Tim Folkerts says:

          Clint says: “That’s why …”

          0.3 um vs 15 um is focusing on difference of photon energy
          The water example is focusing on differences in mass.
          More ice is focusing on difference is the total radiation.

          None of these explains the others. Each is fundamentally different.

          • Clint R says:

            In the water example, all the water molecules have the same frequency of motion. Same with the ice cubes–all emitting the same flux.

            Just simple examples that even idiots should be able to understand.

    • ren says:

      An increase in UVB at the surface, with a decrease in total UV radiation during weak solar cycles, will not increase the surface temperature.
      https://www.iup.uni-bremen.de/gome/solar/mgii_composite_2.png
      https://www.iup.uni-bremen.de/gome/gomemgii.html

      • ren says:

        A comparison of UV solar activity in the three most recent solar cycles (SC) 22-24 shows very faint solar flares in the 25th cycle.

    • barry says:

      “The Ozone Hole is isolated over the S Pole.”

      It ebbs and flows across Antarctica, and sometimes nips at the Southernmost tips of Australia and Souith America.

      This graphic shows its seasonality, and evolution over time.

      https://www.youtube.com/watch?v=kyGoqC9FTFc

  41. CO2isLife says:

    A simple way to debunk the AGW theory:

    Simply look at this NASA Chart, it shows the Greening of the Earth by rates of change over a decade.
    https://www.nasa.gov/sites/default/files/thumbnails/image/global_tamo_2017_full.png

    1) Saraharian Africa and the Arabian Peninsula show no Greening at all.

    2) Other Areas show a great deal of Greening

    My bet is that if you examine the weather station data from areas where there was no greening to areas where there is greening, you will find a huge temperature differential, with the Deserts showing no warming, and the greening areas showing warming.

    That is very easy to test. When you pick the desert locations, be sure to select the ones with a BI of less than 10 to control for the Urban Heat Island Effect. The other ones you can use any BI because the exercise to to capture all the factors other than CO2 that can cause warming. Also, be sure to use “unadjusted” data.

    This is my 2021 Challenge to all serious climate scientists.

    Snows of Kilimanjaro may be gone by 2020
    https://www.seattlepi.com/national/article/Snows-of-Kilimanjaro-may-be-gone-by-2020-1098760.php

    The Snows of Kilimanjaro Could Be Gone by 2022
    https://www.discovermagazine.com/environment/the-snows-of-kilimanjaro-could-be-gone-by-2022

    It’s time for climate science to stop being the laughing stock of the scientific community.

    • barry says:

      “Could” be gone by 2020 was the view of one researcher. Both articles are about Thompson’s ‘maybe’ prediction.

      • CO2isLife says:

        “Could be gone by 2020 was the view of one researcher. Both articles are about Thompsons maybe prediction.”

        What kind of real scientist would allow his name to be attached to a claim of “could?” His failed prognications influence public policy. A real scientist would have spoken in probabilities like there is a 99.99999% chance that the Kilimanjaro Glacier is disappearing due to sublimation, and is not due to warming, and that it will still be there in 2020 and 2021. Instead, he picks the most extreme and now proven to be the inaccurate, outcome.

        BTW, the Climategate Emails prove Dr Thompson knows it is sublimation, not warming that is causing the shrinking of the glacier. Worse yet, he is a member of the NAS. What kinds of standards does the organization have? Are any skeptics a member of the NAS?

        Global Warming Not Behind Kilimanjaro Meltdown
        https://www.livescience.com/1600-global-warming-kilimanjaro-meltdown.html

        OSU’s Dr. Lonnie Thompson pushes gloom and doom, still thinks the snows of Kilimanjaro are melting due to global warming
        https://wattsupwiththat.com/2010/12/10/osudr-lonnie-thompson-pushes-gloom-and-doom-still-thinks-the-snows-of-kilimanjaro-are-melting-due-to-global-warming/

        This is why climate science is the laughing stock of the sciences. The have the credibility of the Journalism Department.

      • barry says:

        “What kind of real scientist would allow his name to be attached to a claim of “could?”

        All science is provisional and qualified. I can’t believe you asked such a dumb question. Scientists routinely speak in terms of probabilities, and sometimes they enumerate them for public consumption.

        The literature behind Thompson’s comment has the numerical estimate – and the news media of course picked the most sensational estimate they could get.

        If you want to complain about how the media represents science, get in line. It’s a complaint as old as science journalism. Trashing science because of media reporting of it is ill-aimed criticism.

        If you want to learn the science, don’t rely on news media. RTFR.

        • CO2isLife says:

          “All science is provisional and qualified. I cant believe you asked such a dumb question. Scientists routinely speak in terms of probabilities, and sometimes they enumerate them for public consumption.”

          If I know a glacier is disappearing due to sublimination and I allow my work to be used in an award-winning documentary to promote the global warming hoax and fail to tell the viewer that the glacier isn’t melting than that is guilt by omission.

          In case you have forgotten:
          https://youtu.be/6hFxG-8I0Go

        • barry says:

          Ah, your concern is not with the science but with the messaging from pundits and media.

          Well, that’s great. I think it could be much better, too. Lonnie Thompson was wrong, his view was an outlier and it got promoted by some sources, including by an ex-politician, a go-to source for anyone who likes their messaging hot!

          I think you and I see this quite differently. I’ve known for years not to rely on the news and get my understanding from a broad readiong of the science.

          You seem to be more interested in the optics, and your understanding of the science seems to be chiselled out of your reaction to it.

          I’ve come to this provisional conclusion because I’ve linked you up to research papers recently and you’ve rejected them without having read them (claiming R2 values not present when they are, for example).

          I spend my time here mostly setting the record straight on the various misrepresentations of science that come up. You will pretty much never see me advocating any kind of policy options or anything. I’m not interested in persuading anyone of that, only of being clear-eyed about the science.

          • bdgwx says:

            +1 and ditto. It doesn’t matter which side of the topic it is. I am equally skeptical of extreme viewpoints from the media on both ends of the spectrum. I too can say that I have never advocated for any specific policy. I just want to learn as much as I can about the science and hopefully steer others in the direction of what the abundance of evidence actually says.

          • Svante says:

            Better still, be skeptical of media full stop.
            And politicians, special interest groups, blogs, …

            Find science from institutions with a long history of achievements.

    • bdgwx says:

      I read the study regarding Kilimanjaro. The authors actually provide a range of 2022 to 2033 using linear extrapolation say that 2033 is probably the better fit to the data. Either way it appears that Thompson’s prediction is aggressive compared to his peers. The prevailing estimate seems to be after 2050 from what I’m seeing.

  42. ren says:

    Water vapor distributes heat from the surface of the oceans throughout the globe. Thanks to the jetstreams from 700 hPa (an average of about 3500 m).
    https://earth.nullschool.net/#2021/01/03/1800Z/wind/isobaric/700hPa/patterson
    You can see that the winter polar vortex in the south is still strong. This is probably due to the drop in temperature in the lower stratosphere.

    • CO2isLife says:

      “Water vapor distributes heat from the surface of the oceans throughout the globe. Thanks to the jetstreams from 700 hPa (an average of about 3500 m).”

      And I imagine climate models accurately model that effect?

  43. Bindidon says:

    It’s amazing to read all the time about El Nino being the only source of warming, and even acting as Earth’s warmth regulator. Hmmmh.

    Firstly, let us have a look at the three recent greater El Ninos, namely 1982/83, 1997/98 and 2015/16:

    https://psl.noaa.gov/enso/mei/img/meiv2.timeseries.png

    As we can see, 1982/83 is the top guy in the trio, and 2015/16 is at the bottom.

    Why it is called ‘the Super El Nino’ is very probably due to the fact that at the time it was active, UAH6.0 LT had its topmost anomaly, what of course is misleading.

    Conversely, this equating of El Ninos with LT temperatures is also very probably the reason why the 1982/83 event is known to nearly nobody, as its power was hidden by the El Chichon eruption in 1982.

    Here is, for example, another comparison of the El Ninos in 1997/98 and 2015/16, by looking at UAH’s absolute temperatures, reconstructed out of Roy Spencer’s anomaly and climatology files:

    https://drive.google.com/file/d/1EeNGcBpI1lIlB7IByn08xgFMfX2nl5cH/view

    There you see that 1998 has the highest value: the ‘supremacy’ of 2016 in the usual anomaly chart is due to the annual cycle removal.
    *
    Now let us look at global surface temperature distributions made by the Japanese Met agency, for the years 1982, 1997 and 2015 (the first year is the stronger at surface, the second one in the LT due to the 4-5 month lag).

    I selected JMA because it shows, among all temperature series, the least trends for both 1891-present and 1979-present, due to a lack of infilling and low SSTs.

    1982

    https://ds.data.jma.go.jp/tcc/tcc/products/gwp/temp/map//gridtemp/y1982/gridtemp1982ane.png

    Even a big El Nino can’t keep up with violent SO2 aerosol bursts.

    1997

    https://ds.data.jma.go.jp/tcc/tcc/products/gwp/temp/map//gridtemp/y1997/gridtemp1997ane.png

    2015

    https://ds.data.jma.go.jp/tcc/tcc/products/gwp/temp/map//gridtemp/y2015/gridtemp2015ane.png

    No volcano eruptions in these years.

    *
    If there was a heavier El Nino during 1997/98 than in 2015/16: why then does JMA’s global temperature distribution for 2015 show much higher anomalies nearly everywhere than for 1997?

    I don’t know. Some say it’s CO2, some say it isn’t.

    J.-P. D.

    • Clint R says:

      JD, the New Year has hardly started and you’re already building straw men:

      “It’s amazing to read all the time about El Nino being the only source of warming, and even acting as Earth’s warmth regulator.”

      And, that one will be hard to top….

    • Gordon Robertson says:

      binny…”Firstly, let us have a look at the three recent greater El Ninos, namely 1982/83, 1997/98 and 2015/16:”

      ***

      Then you reference a NOAA graphic based on seriously fudged data.

      The UAH graph shows 1982/83 to be nearly 0.3C below the baseline, one of the coldest years in the UAH record, yet you claim NOAA shows it as one of the hottest.

      NOAA is full of crap.

      In the follow fiction, they show a clear positive warming trend from 1970 onward whereas UAH only shows a clear positive trend from 1998 onward (anomalies above the baseline).

      https://www.climate.gov/news-features/understanding-climate/climate-change-global-temperature

      • Bindidon says:

        Robertson the cheating SOB

        If something is full of crap, Robertson, then it is all the absolutely incompetent nonsense you write all the time on this blog.

        You are only able to discredit, denigrate, distort, and… lie.

        Even those who did wonderful work, e.g. Andrew Motte, who translated in 1729 the third edition of Newton’s Principia, you dumb ass manage to insult as a ‘cheating SOB’.

        J.-P. D.

    • barry says:

      Gordon, it’s amazing how many things you can get wrong in a single post.

      Bindidon wasn’t using NOAA global temp data – that index was the ENSO multivariate index, which uses multiple indices to calculate ENSO fluctuations, like wind speed, for example.

      Bindidon doesn’t claim, nor does NOAA, that 19882/83 was a hot year. Again that is the ENSO index you are looking at, and Bindidon noted in his post that a volcanic eruption neutered the effects of that el Nino on global temperatures.

      Finally, you continue to misconstrue the most basic concept in statistical analysis – the choice of baseline. Whether a group of anomalies are positive or negative says absolutely nothing about the trend.

      This is one of your most fatuous misconceptions. The baseline is arbitrary to establishing whether there is a trend or not.

      Here, I’ll show you what it looks like when you put GISS* and UAH on the same baseline, including the trend since 1979.

      https://www.woodfortrees.org/plot/gistemp/from:1979/mean:12/plot/uah6/from:1979/offset:0.43/mean:12/plot/uah6/from:1979/trend/offset:0.43/plot/gistemp/from:1979/trend

      The trends?

      UAH 0.14 C/decade
      GIS 0.17 C/decade

      Over a hundred years that is the difference of 0.3 of a degree.

      The baseline has nothing to do with the trend. The GISS trend is the same if I move the zero line up or down the y axis by any amount. As long as the anomalies stay the same relative to each other, then the trend will always be the same.

      (* NOAA data not available at the website where you can plot those graphs, but it is pretty much the same as GISS, so the comparison works fine – NOAA ttend for the same period is 0.17 C/decade)

    • “Firstly, let us have a look at the three recent greater El Ninos, namely 1982/83, 1997/98 and 2015/16:
      https://psl.noaa.gov/enso/mei/img/meiv2.timeseries.png
      As we can see, 1982/83 is the top guy in the trio, and 2015/16 is at the bottom.”

      This is not correct Bindidon.

      1982-83 has at the most an ONI-value of 2,2
      1997-98 has at the most an ONI-value of 2,4
      2015-16 has at the most an ONI-value of 2,6
      So I dont think there are any doubt that the 2015-16 La Nina was the strongest:
      https://ggweather.com/enso/oni.htm

      • Bindidon says:

        Frank Marella Olsen

        I understand your point, but what I wrote is the list as published by the group computing the MEI index (topmost at 1983 AM since 1979):

        https://psl.noaa.gov/enso/mei/data/meiv2.data

        If I understand well, he difference between MEI and ONI is that it is based on many more aspects than the NINO3+4 area

        – sea level pressure
        – sea surface temperature
        – zonal and meridional components of the surface wind
        – outgoing longwave radiation
        over the tropical Pacific basin (30°S-30°N and 100°E-70°W).

        See the paragraph “Key features of composite positive MEI events” in

        https://psl.noaa.gov/enso/mei/

        J.-P. D.

  44. CO2isLife says:

    Results from the Above Challenge:

    Greening Map:
    https://www.nasa.gov/sites/default/files/thumbnails/image/global_tamo_2017_full.png

    Non-Greening Area: No warming since 1880
    Oran/Es Senia Algeria (35.60N, 0.6W) ID:101604900000
    https://data.giss.nasa.gov/cgi-bin/gistemp/stdata_show_v3.cgi?id=101604900000&ds=5&dt=1

    Greening Area: Plenty of warming.
    Indore (22.72N, 75.80E) ID:207427540000
    https://data.giss.nasa.gov/cgi-bin/gistemp/stdata_show_v3.cgi?id=207427540000&dt=1&ds=5

    I’m pretty sure that if I continued to tie warming to greening, the results would be the same. Will this simple experiment ever get published? A simple experiment anyone can run to debunk CO2 driven warming? Not a chance is Hades.

    • E. Swanson says:

      CO2isLife, the Earth’s major desert regions tend to be at specific latitude bands. Why is that?

      • CO2isLife says:

        E. Swanson: “CO2isLife, the Earths major desert regions tend to be at specific latitude bands. Why is that?”

        Not sure, but the greatest increase in greening also happened in that range. Also, a large % of unfrozen landmass also falls in that range, so just by probability, one would expect them there.

        Lastly, the Saraha used to be a rainforest.
        What Really Turned the Sahara Desert From a Green Oasis Into a Wasteland?
        10,000 years ago, this iconic desert was unrecognizable. A new hypothesis suggests that humans may have tipped the balance
        https://www.smithsonianmag.com/science-nature/what-really-turned-sahara-desert-green-oasis-wasteland-180962668/

        Predictably, Cavemen driving SUVs caused the deserts.

      • CO2isLife says:

        BTW E. Swanson, please prove my theory wrong. I identified a way to debunk AGW. Please prove me wrong. Find desert locations showing warming and greening areas that show less warming.

        That is about as easy and a logically designed experiment as you can find. If CO2 is really the cause of warming, it should be easy to reject my hypothesis.

        • E. Swanson says:

          CO2isLife, Your “theory” doesn’t even rise to the level of a hypothesis. And, it’s your responsibility to “prove” your claim, not mine. Start with the Arctic winter desert…

      • Entropic man says:

        The desert latitudes coincide with the downwelling latitude of the Hadley cells. This pushes low altitude air away from those regions, blocking incoming humid air and giving low rainfall.

        https://en.m.wikipedia.org/wiki/Hadley_cell

        • E. Swanson says:

          Entropic man, BINGO!

          • Swenson says:

            Swanny,

            Really? So Antarctica ad all the other cold deserts dont count?

            Now you can start complaining that everybody knew what you meant, and should ignore what you wrote.

            If you disagree, maybe you should have defined what a desert is, so everybody knew where the goalposts were. It looks like your triumphant winning call of * Bingo * may have a bit premature.

            So whats the relevance to the mythical GHE? Only seen in hot places, during the day, in fine conditions?

            It looks like CO2 is a non-starter, if that is the case. What do you think?

          • Entropic man says:

            Swenson

            Take a look at the Hadley circulation map in my link.

            There are two latitudes where the circulation produces downwelling air and low precipitation (The definition of a desert) occurs. One is 30N and 30S. This other is the N and S Polar regions.

          • E. Swanson says:

            Swenson wrote:

            So whats the relevance to the mythical GHE? Only seen in hot places, during the day, in fine conditions?

            It looks like CO2 is a non-starter, if that is the case. What do you think?

            Thanks for pointing to the Arctic, which I intentionally didn’t mention. The Arctic is reported to be warming much faster than the rest of the Earth and the largest increase is during the Winter half of the year. The Antarctic is a different situation, with the appearance of the ozone hole, given that ozone is another greenhouse gas.

          • Entropic man says:

            In Winter in the Arctic and Antarctic the greenhouse effect has very little effect because it redirects upward longwave radiation from the surface. At Winter Arctic temperatures there is not much upward longwave radiation to redirect.

            The Winter warming is because the weather is more active nowadays and more heat is being carried up from lower latitudes. The effect is less pronounced in the Antarctic Winter because it’s altitude and the Southern Ocean allow less southward heat transfer.

  45. Eben says:

    People with no education and knowledge on the subject are the first to give you the forecast

    https://youtu.be/K18yV5NlKKE

  46. Kevin Kennedy says:

    Can you explain why you use a 13 month runing average and not 12 months?

    • E. Swanson says:

      K Kennedy, When using a centered average, one should use an odd number of points in the average, since the resulting average is dated at the middle of the period. A 13 month average is the value for the center month averaged with the 6 preceding and 6 following months.

  47. CC says:

    Curious:

    Due to these stats on major cooldown of UAH in December, how will this affect the “Annual Average Anomaly” as reported by NASA? (given that as of now, the final data is yet to be published).

    Are we still on track then to be hotter than 2016’s previous NASA record? https://climate.nasa.gov/vital-signs/global-temperature/

    • bdgwx says:

      It won’t have much of an effect. UAH does not correlate very well with NASA GISS. Yes, 2020 will likely move ahead of 2016 though the difference could be quite small.

    • barry says:

      On annual time scales all the global temp data sets correlate very well, with some minor differences in trend. But month to month they are less well correlated. The temp lag to ENSO changes can vary for surface temp (GISS) and lower troposphere temp (UAH).

  48. CO2isLife says:

    Dr. Spencer can explain it better than I, but the issue as I understand it is that the data is published at the end of the month, but represents the full month, so the data point is actually for the middle of the month. To create an average of the year, they “center” it, but 12 months doesn’t work well because the centering is unbalanced. (Jan/Feb/Mar/Apr/May)-June-(July/Aug/Sept/Oct/Nov/Dec), so the average has 6 forward months and 5 backward months. To “center” it, you make it 13 months which puts June is the center of 6 back and 6 forward.

    Personally, I think that double counts one rolling month, and misses the critical point that a year has 12 months, so by using 12 months, you capture the true variation of a solar cycle. Simply taking the average of the past 12 months and shifting the data set backward 6 months strikes me as a possibly better solution. Unless the variation for January is the same for July, the double-counting will distort the volatility depending on what month it is.

    • CO2isLife says:

      In the Finance world, they calculate a year based on a TTM, or trailing 12 months. That may be a better solution than a centered 13 month value. Once again, the double-counting of a select month may distort the variability.

    • barry says:

      There’s no double counting, you just add up the values for the 13 months and divide by 13. That’s the value for the central month.

      The ~11-year solar cycle is independent of Earth’s annual orbit, and therefore it doesn’t make any difference whether you use 12 months or 13. It’s just more straightforward and balanced to compute 13.

      “Simply taking the average of the past 12 months and shifting the data set backward 6 months strikes me as a possibly better solution.”

      I don’t quite get this. Let’s say you do that right now, and you’ve got Jan-Dec.

      The mid point for that average is July 1. Which month does the average belong to?

      • Bindidon says:

        barry

        You are communicating that to a PhD-ed person…
        It is amazing to see how terribly educated some people can be.

        J.-P. D.

      • barry says:

        I can’t get too smug. I’m an arts major, nothing more educated. Science is only a hobby, and my math is pretty average.

      • CO2isLife says:

        barry says: Theres no double counting, you just add up the values for the 13 months and divide by 13. Thats the value for the central month.

        CO2isLife Says: Barry, please list the months of the year that are included in your 13 month average. If there is no double counting, I’d like to know what the 13th month is.

        In reality this is how it is calculated to center the yearly average in Mid-June: Dec/Jan/Feb/Mar/Apr/May-(June)-July/Aug/Sept/Oct/Nov/Dec

        Note: Dec of 2019 and 2020 are included in the Average. That is what I mean by double counting

        Bindidon Says: You are communicating that to a PhD-ed person
        It is amazing to see how terribly educated some people can be.

        CO2isLife says: Bindidon, please provide any corrections as needed. You seem to imply that I am wrong. Please prove it.

      • barry says:

        It seems you are a little stuck on the idea of a calendar year, or a twelvemonth. There’s no reason to be. The values are different for the two Decembers, so it is not double counting. Double counting is when you add the same value twice. That isn’t happening.

        The point of using anomalies is to remove annual cycles (like Summer/Winter), so it doesn’t matter whether two Decembers are counted – it won’t skew anything.

        Solar cycles are not bound to twelvemonth cycles, so counting two Decembers won’t interfere with that.

        Can you answer my question? Which month is assigned the average for Jan-Dec if the mid-point is July 1? If you pick June, then the second half of the year gets slightly more weighting in the calculation. If you assign to average to July, the opposite occurs.

        If you use 13 months you avoid weighting the average to data before or after the selected month.

        It’s not terribly important – the values are going to be similar anyway. Here’s the difference between a 12 and 13 month average.

        https://www.woodfortrees.org/plot/uah6/mean:12/plot/uah6/mean:13

  49. Dr. Luke Warmer says:

    I guess everyone makes mistakes, but I have to be concerned for experts that are not aware about the lags between Nino 3.4 and global temperatures in ENSO. Almost like the ideology is detached from reality.

    https://insideclimatenews.org/news/03012021/five-aspects-climate-change-2020/

  50. Gregory J. says:

    Regarding NASA GISTEMP, Karsten Haustein, the guy who runs the Daily Global Temperature website, has predicted (on Twitter) an exact tie between 2016 and 2020.

    • angech says:

      Wish you were right
      GISTEMP would have to drop by more than Roy’s UAH for that to hold true.
      Still no claims of absolute warmest year ever yet and they usually start well before this if there is any substance to it.

      Global surface temperature anomalies(relative to 1880-1920)in2016 and 2020.
      Global Warming Acceleration 14December 2020
      James Hansen and Makiko Sato
      “Record global temperature in 2020, despite a strong La Nia in recent months, reaffirms a global warming acceleration that is too large to be unforced noise it implies an increased growth rate of the total global climate forcing and Earths energy imbalance. Growth of measured forcings (greenhouse gases plus solar irradiance) decreased during the period of increased warming, implying that atmospheric aerosols probably decreased in the past decade.There is a need for accurate aerosol measurements and improved monitoring of Earths energy imbalance.November 2020 was the warmest November in the period of instrumental data, thus jumping 2020 ahead of 2016 in the 11-month averages(Fig. 1). December 2016 was relatively cool, so it is clear that 2020 will slightly edge 2016 for the warmest year, at least in the GISTEMP analysis.”

      • Richard M says:

        Using the phrase “despite a strong La Nina” shows a lack of understanding of how ENSO affects the global temperature. Nothing is “reaffirmed” by the warmth hanging on for a few months.

        The lag between ENSO and global temperature appears to be dependent on the length of the ENSO event. With multi-year events the lag appears to be about double what we see with single year events. Makes sense as a 2 year El Nino is really about 18 months vs. 6 month for a single year event.

        The El Nino ended in early May which means the warmth normally would hang around until November. That is when the La Nina would start being the driver. Amazing the amount of pure ignorance espoused by climate “experts”.

        The way to follow this is by looking at the oceans.

        https://woodfortrees.org/plot/hadsst3gl/from:2014/to/plot/hadsst3gl/from:2014/to:2018.1/trend/plot/none

        As is obvious the temperature doesn’t drop significantly right away and even as of the end of Sept it was still elevated. That would mean surface data sets couldn’t see any effect until October at the earliest and Satellites in December.

    • barry says:

      “Still no claims of absolute warmest year ever yet and they usually start well before this if there is any substance to it.”

      There is a link to the letter the quote comes from. If you go there you’ll find what you’re looking for beyond the abstract.

    • barry says:

      Or have you already accessed the letter? Just read a bit more of it.

      • angech says:

        Hansen makes the astonishing claim that the rate of warming should be de accelerating over the last 5 years. Then explains his version of increasing warming by quoting fairy dust as the cause i.e. unmeasurable to date aerosols.
        .
        “We are showing the response function to explain how we know that if the only forcing changes were the GHGs and the Sun (black curve in Fig. 4) there would be no acceleration of global warming in the past five years –indeed, there should be a decrease in the warming rate. The real-world acceleration tells us that there must be another forcing, which is unmeasured. There is only one good candidate: aerosols”

        Seems to be having it both ways.
        Cut down on the fossil fuels and the temp goes up ass well!

        To be fair in most of his monthly letters he did caution against expecting a warmest year until Sept/Oct/November were so hot.

      • barry says:

        Looks like you missed the bit you were initially interested in.

        “December 2016 was relatively cool, so it is clear that 2020 will slightly edge 2016 for the warmest year, at least in the GISTEMP analysis.”

        In terms of the rankings, anyway. It will actually be the most likely warmest year, but not by much.

        It’s a letter rather than a formal study, and the rigour is pretty lax to my mind, but there is still some qualification you may have forgotten:

        “Record global temperature in 2020, despite a strong La Nina in recent months, reaffirms a global warming acceleration that is too large to be unforced noise it implies an increased growth rate of the total global climate forcing and Earth’s energy imbalance…”

        You quoted that bit, so you probably saw the qualifier earlier.

        In any case, I agree that it is way too much to determine acceleration over such a short time period. The data suggest…? Yeah, maybe that could fly, but the language is too strong elsewhere in the paper. The bit about the grandkids makes it clear it’s an opinion piece rather than a serious submission.

        • CC says:

          RE: December 2016 was relatively cool”.

          Check out this analysis… According to it, the anomaly plummeted in December. https://moyhu.blogspot.com/p/latest-ice-and-temperature-data.html#comment-form

          NCEP/NCAR reanalysis surface temp anomaly area weighted global average:
          December 2020: 0.152
          December 2016: 0.391
          (a factor of 2.565x LESS in 2020!)

          Would not applying this same value and reasoning to Nasa’s December 2016 anomaly of 0.88 yield an expected Nasa value of 0.34?

          One would think it’s going to be lower than 0.61 for December, (the value needed to tie the annual LOTI record average for 2016 of 1.01.
          What am I missing here? Humbly, -C

          • bdgwx says:

            CC,

            I track this quite closely and run my own models to predict the next GISS update. I do everything with GISS’s official baseline of 1951-1980. At that baseline my model using only NCEP/NCAR outputs +0.82 +/- 0.12 (95% CI) for the December GISS value. Note the large error. This is because the NCEP/NCAR coupling is not perfect. I’m still waiting for data to roll in, but based on what data is available from various predictors I’m currently at +0.83 +/- 0.10. My model will drive down to +/- 0.06 with all of the predictors prior to the GISS release. I’ve seen other modelers who do a better job than I reporting +0.88 +/- 0.05 as their expectation.

        • barry says:

          First of all, if you wanted to extrapolate to GISS from NCEP/NCAR in the way you’re trying, you would do a straight subtraction. While the data is on the same scale, the data sets have different baselines – working by ratio is going to skew results

          0.391 – 0.152 = 0.239 C

          GISS Dec 2016 anomaly was 0.86

          subtract 0.239

          If GISS perfectly matched NCEP/NCAR, December 2020 anomaly would be 0.621

          • angech says:

            Fun and Games.
            In past years claims for worlds warmest year usually are made well before the end of December.
            Hansen has confidently predicted GISTEMP warmest 1 month ago. Barring an exceptional fall this will happen.
            UAH and GISTEMP measure different temperature sets so quite often do not show similar rises or drops.

            However no claims yet so must be very close.
            I tried to add up the GISTEMP 2016 12.09
            and the GISTEMP 2020 to November 11.44
            but got lost a couple of times.
            Does anyone have the correct figures?

            If these are right GISTEMP would have to come in at 0.65C anomaly.
            Way below bdgwx claim of 0.82. but higher than Barry’s “December 2020 anomaly would be 0.621”

            Interestingly both years started with a January of 1.17 C anomaly.

            I would assure bdgwx that if his claim were right we would already have heard it from the rooftops.
            Like the USA elections a lot of crosschecking of the votes [temps] must be going on.
            Exclude a couple in the right areas and we have a new yearly winner.

          • CC says:

            Kudos, thanks much.
            I see my flawed (factored) thinking. Cheers! -C

          • bdgwx says:

            angech,

            Just to clarify…I’m currently predicting GISS will report 0.83 +/- 0.07 as published at [https://data.giss.nasa.gov/gistemp/tabledata_v4/GLB.Ts+dSST.txt].

            As of right now Dec 2020 would need to come in at 0.77 (give or take) to eclipse 2016. Note that since I run the code with more recent data than what you have available I’m going to get a slightly more refined estimate.

            I give it an 80% chance that 2020 will take position #1 in the ranking. However, because these yearly anomalies have +/- 0.05 margins we can’t say definitively that 2020 was the warmest.

  51. barry says:

    CO2isLife:

    Check this out – you can explore natural influences on global temps maually.

    https://tinyurl.com/yabyu2a4

    • CO2isLife says:

      Thanks Barry, I’m pretty familiar with the data sets. Adjusted NASA data doesn’t really prove much to me as I’ve demonstrated. Simply look up the temperature stations on the GISS site and look for desert stations. You will see there is no warming due to CO2. Look up sites that have been exposed to increasing H2O and you will find warming. NASA takes those stations, combine them into one composite, and then implies CO2 is the cause of the warming. It isn’t, and I just provided the explanation of the warming and a way to prove it.

    • CO2isLife says:

      Barry, when you review the models, clearly the only ones with explanatory power are the ocean cycles, Sun and Volcanoes.
      https://mrooijer.shinyapps.io/graphic/

      There are multiple problems with these climate models and conclusions:
      1) The oceans are warming, 15µ LWIR won’t warm the oceans
      2) What is warming the oceans is warming the atmosphere
      3) CO2 appears to trend with temperature, but the CO2 W/M^2 shows a log decay. That to me is a dead giveaway of fraud. Their model isn’t consistent with the physics of the CO2 molecule
      4) A warming ocean would outgas CO2, so there would be multicollinearity in the models if both CO2 and Ocean Temperatures are included, atmospheric CO2 is a function of ocean temperatures
      5) More radiation reaching the oceans would warm them, so once again, having the Sun and Warming Oceans would be a problem with multi-colinearity, anyway, what is important is that the oceans are warming, so you know more solar radiation is reaching them, so the sun is redundant. And a hotter sun is irrelevant is cloud cover blocks the rays from reaching the oceans.

      • bdgwx says:

        1. Yes it does. Water greedily takes up IR including 15 um.

        2. I agree.

        3. First…CO2 isn’t the only factor. Aerosols are a huge component too plus dozens of other factors. Second…we all know that CO2 forcing is logarithmic. The models the scientific community work on match quite nicely with the net of all radiative forcing agents including CO2. If YOUR model does not match observations then perhaps it is YOUR model that is wrong. May I recommend taking a look at the models the scientific community are working on?

        4. All other things being equal a warming ocean outgasses CO2. But not all other things are equal. Humans are emitting huge amounts of carbon into the atmosphere. This creates a large partial pressure difference between the atmosphere and hydrosphere. As a result the hydrosphere takes up the carbon. What is believed will happen is that the rate of uptake will begin to decline as the ocean warms reducing the ocean’s buffering ability.

        5. That is correct. More radiation is reaching the ocean. A lot of things can cause that including but not limited to increased CO2 concentrations.

        • Swenson says:

          b,

          1. Water speedily cools at night.
          2. Depends whether the sun is shining.
          3. If 131 models give different results, at least 130 are wrong. How silly is someone who believes that averaging 130 (at least) incorrect results leads to a correct answer?
          4. You are talking irrelevant gibberish. Maybe you dont understand what partial pressure is, and that carbon is completely different to carbon dioxide.
          5. One thing that cannot result in more radiation reaching the ocean, is reducing the amount of radiation reaching it by increasing the amount of CO2 between the ocean and the Sun. No magical energy multiplication by CO2 (or anything else).

          In other words, you are just another brainwashed acolyte, demonstrating your gullibility.

          Carry on.

        • CO2isLife says:

          “Yes it does. Water greedily takes up IR including 15 um.”

          Show me 1 single experiment where 15µ LWIR penetrates and warms water, just 1. Show me 1 single controlled experiment where additional energy from 15µ LWIR will warm water. Then, calculate out how much energy it takes to warm the ocean by the amount of an El Nino cooling, and then calculate out how long it would take CO2 to return that energy to the oceans. Once you do that, you will understand how ridiculous it is to claim that CO2 is causing the warming. 15µ is very very very low energy and has a black body temp of -80C°

          Shine 15µ LWIR on ice and it won’t melt. Ice of 0.00C° emits LWIR of a shorter wavelength, that is how insane these arguments are. Ice emits more energy than CO2.

          • bdgwx says:

            https://tinyurl.com/n22hjv6

            Liquid water’s absor.p.tion coefficient is 10,000. It so greedily takes it up that nearly 100% is taken up right on the skin of the surface.

            Here is a paper that explains the microphysics of how the oceans take up the infrared radiation and how it gets distributed through the layers.

            https://tinyurl.com/yd55m2to

            BTW…you can do the experiment yourself. Get an infrared lamp and shine it on a pan of water. The water will warm up. This experiment is repeated continuously everyday in countless cafes around the world where they use heat lamps to keep food warm.

          • Clint R says:

            bdgwx, this is another example that you can’t think for yourself. The very first sentence of the abstract: “Ocean warming trends are observed and coincide with the increase in concentrations of green-house gases in the atmosphere resulting from human activities.”

            Does that sound like they’re a teensy bit biased?

          • Richard M says:

            Clint R, biased doesn’t even come close. I think the proper term is brainwashed.

            They have is 180 backwards. The oceans are the driver of the climate.

      • CO2isLife says:

        Funny, I went to test my theory that the greening of the Earth has contributed to warming, and guess what? The CLimate Model doesn’t have the ability to change H2O, the most potent GHG in the atmosphere. Funny, if you never look for the real answer, you will never find it. Funny how they have CO2, and insignificant trace gas, but not H2O. Now why is that?
        https://mrooijer.shinyapps.io/graphic/

    • barry says:

      “1) The oceans are warming, 15µ LWIR won’t warm the oceans
      2) What is warming the oceans is warming the atmosphere”

      Of course a warming atmosphere can cause warmer oceans and vise versa.

      In a thermally connected system, if one part of the sytem warms, so does the rest, even if they are at different temps. The ocean and atmosphere are both stratified – equilibrium is never achieved, only steady state. If one layer warms, the rest do – unless there is a physical (as in actual physical maeterial) reason why that isn’t happening.

      If the atmosphere isn’t warming the oceans then the only other thing I can think of is geothermal heating from below, but it’s fairly clear with the data we have that this is not the case. Eg, the top layer of the ocean is warming faster than lower layers. I’ll let someone with more qualifications comment:

      “The vertical profile of ocean warming (if it can be believed) suggests warming decreasing with depth. It’s hard to imagine that the heat is originating from below. Also, we need to distinguish between the average geothermal heat flux versus any increasing in that over time, the latter being “forcing”. Finally, any increase in geothermal heat flux would probably take centuries to be felt at the surface… the ocean abyss has stable stratification, and so must be slowly forced upward on the large scale by convective sinking in certain polar regions.”

      https://judithcurry.com/2019/07/21/geothermal-ocean-warming-discussion-thread/

      • angech says:

        “1) The oceans are warming, 15 LWIR wont warm the oceans
        2) What is warming the oceans is warming the atmosphere”

        Not sure what your argument is here.
        The basis of the GHG effect is 15 LWIR or whatever low temp inducing LWIR it is being multiplied many, many times in effect in the atmosphere due to increasing the speed of the CO2 molecules and H20 molecules with lots of this extra though small energy.

        puzzled?

      • Swenson says:

        barry,

        The oceans are separated from the 1000 C mantle by a thin crust of not-terribly-effective-insulation (rocks).

        A system of mid-ocean ridges split the solid crust into at least two sections (joining around the globe). Molten magma impacts directly on the ocean water, solidifies, and forms new crust in a continuous process.

        An unknown number of hydrothermal vents emit water at up to 400 C directly into the abyssal depths. Pretty much unsuspected before 1977, so I dont know if these sources of heat are incorporated into climatological models.

        As to heating any deep body of water from the top, this is just unphysical nonsense. The warmer water floats, and promptly radiates its heat away at night. Convective polar sinking of water, flowing around the Earth is just delusional nonsense. The sort of thing that NOAA and NASA (knowing no better) try to foist on a gullible audience. Just as silly as claiming deep ocean currents are due to surface wind!

        Truly did Richard Feynman promote the idea that science was belief in the ignorance of experts!

      • CO2isLife says:

        “Of course a warming atmosphere can cause warmer oceans and vise versa.”

        Prove it.

        1) The Oceans hold 2,000x the energy of the atmosphere. Do the math. You can take 100% of the energy in the atmosphere and put it in the oceans and it won’t register a blip.

        2) What warms the atmosphere? Certainly not incoming solar radiation. Where does the energy to warm the atmosphere come from?

        3) CO2 and 15µ LWIR doesn’t penetrate or warm the oceans, so regardless, CO2 isn’t the cause, which is what this is all about. You can’t tax the sun, so you have to blame CO2. That is where the money is.

        • bdgwx says:

          Here is paper that describes how the Earth Energy Imbalance is distributed throughout the climate system.

          https://tinyurl.com/y9dzpkc3

          Here is aper that describes the microphysics of how the ocean is warmed by infrared radiation.

          https://tinyurl.com/yd55m2to

          1. Correct.

          2. Heat transfer from the hydrosphere is a significant factor.

          3. That’s right. Liquid water so greedily takes up infrared radiation that it is almost entirely thermalized on the skin. Read the paper above for an explanation regarding the microphysics of how this heat is distributed through the ocean layers.

          • Clint R says:

            bdgwx, thanks for the laughs.

            That first “paper” starts off with the usual bias: “Human-induced atmospheric composition changes cause a radiative imbalance at the top of the atmosphere which is driving global warming.:

            They’ve already convinced themselves. Why go any further?

            Because it’s all about “agenda”: “The UN 2030 Agenda for Sustainable Development states that climate change is “one of the greatest challenges of our time . . . ” and warns “. . . the survival of many societies, and of the biological support systems of the planet, is at risk”

            And the second paper continues the bias, with the first sentence: “Ocean warming trends are observed and coincide with the increase in concentrations of greenhouse gases in the atmosphere resulting from human activities.”

            But, it gets even funnier.

            The Figure 1 shows the only meaningful infrared that makes it into the oceans is about 3.7μ and about 2.7-2.5μ. The corresponding temperatures are 783K and 1073-1159K!

            Those temperatures don’t exist on Earth, bdgwx. Those photons come from SUN!

            Hope you can find some more funny papers….

        • barry says:

          The oceans, like everything else, give off the energy they receive. They must, or they would evenually boil.

          In a non-changing climate, the oceans release energy at the same rate as they receive it. The averaged temperature is constant.

          If something were to reduce the rate at which the oceans release enery, the oceans would warm.

          The atmosphere can do that if it warms.

          The ocean average surface temp is warmer than the atmosphere. The knuckleheads here would tell you that the cooler atmosphere can’t cause the warmer ocean surface to get warmer.

          But you know that a car engine overheats no hot days more readily than cold ones, even though the engine is always hotter than the ambient air. The warmer air means the engine releases its heat less efficiently.

          The same way a car engine gets hotter when the ambient air temp rises, the oceans can warm via the surface layer when the ambient air temperature rises.

          The climate system is made of stratified layers of ocean and atmosphere that thermally respond to each other over different time scales.

          In a steady state system where thermally connected components are at fixed different temperatures, any change in temperature of one component will impact the rest.

          • Clint R says:

            barry, everything you said applies to conductive heat transfer. So, you’ve just eliminated radiative gases from the issue.

            Very good.

  52. Eben says:

    A prolonged even if shallow LaNina will have more cooling effect than a deep but short one

    https://www.cpc.ncep.noaa.gov/products/CFSv2/imagesInd3/nino34Mon.gif

    • Richard M says:

      Eben, that is true. La Nina cooling is primarily via upwelling colder water. The longer it runs the more cold water is brought to the surface. However, warm water is also bottled up in the PWP these events so the total ocean heat content probably increases.

      El Nino releases built up ocean heat and therefore cools the total ocean.

      The SSTs don’t reflect the overall effect.

  53. CO2isLife says:

    Public Policies based on these predictions cost society a fortune.

    10 Failed Predictions: Video
    https://youtu.be/acxQbaDkhRc

    • barry says:

      Gah, I checked the very first paper cited, and it was so misrepresented that I gave up on the rest of the video.

      Video says 1978 paper states that CO2 will double by 2020.

      Paper actually investigates this as an upper limit assuming all commerically available fossil fuels are burned at a production rate that increases by 5% per year from 1970.

      The upper limit doesn’t make it into the charts and graphs, and the paper suggests that doubling could actually occur some time between 2160 and 2480.

      Here’s the paper to check for yourself.

      https://sci-hub.do/10.2307/1745786

      That estimate of doubled CO2 is now outdated, by the way. Looks more likely to occur towards the end of this century, under BAU.

      Video is sourced from blogger Steve Milloy of Junk Science. Aptly named. That site is just propaganda by cherry-picking.

      • CO2isLife says:

        OK, Barry, let’s try this from a different angle. What predictions have they made that have been accurate? I don’t count adjusting data as an accurate prediction. I look at desert stations that show no warming based upon sound scientific reasoning and support of empirical evidence.

        Name a single major claim that was proven correct, just 1. Let’s start with the coming ice age and the population bomb.

        I chose the NYT so you will like the “unbiased” source.

        The Unrealized Horrors of Population Explosion
        https://www.nytimes.com/2015/06/01/us/the-unrealized-horrors-of-population-explosion.html

      • barry says:

        “OK, Barry, lets try this from a different angle.”

        Rather than play whack-a-mole, how about you acknowledge that the ’10 Failed Predictions’ video has misrepresented the science it cites.

    • bdgwx says:

      I’ll take the second one. The video says EPA scientistis predicted a 2 ft rise by 2020. First…the article which the video cites says no such thing. It provides a range of 2-12 ft by 2100 with the possibility that it could be as high as 2 ft by 2020. Second…this article quotes James Titus. You can actually go straight to the source and see what Titus said.

      http://papers.risingsea.net/federal_reports/sea-level-rise-and-wetlands-chap1-Titus.pdf

      Note that the sea level rise predictions come from Hoffman et al. of which Titus is a coauthor. You can quite clearly see that their 1986 prediction for 2025 is 10-21 cm or 4-8 inches. Compare this to the sea level rise that actually occurred from 1986 to 2020 of a little over 10 cm. Add on another 1-2 cm to account for another 5 years and we’re not too far off from the middle of his range. So it looks like his prediction is at least consistent with observations and dare I say pretty good actually.

      • Swenson says:

        b,

        I suppose your authorities took into account the measured rate of Atlantic coast subsidence due to isostatic responses and aquifer depletion? Note I said measured, not estimated.

        No? Bit sloppy, that. You might think they were ignorant of basic geophysical concepts and research.

        Maybe they also dont realise that claiming to measure sea levels to 0.1 mm might look impressive, but seeing that 0.1 mm is about 4/1000 in. it might seem a little far fetched to claim that level of precision.

        Do you think it might be justified by appeal to the miracle of averaging? Like claiming to measure global temperatures to 0.01 K?

        I find it all a bit hard to believe. What about you?

        • Entropic man says:

          Swenson

          Talk to a mathematician. The precision of a mean, the number of significant figures, improves as the sample size n increases.

          The formula is

          Precision of the mean = Measurenment accuracy *(1/√sample size).

          Suppose a tide gauge measures to a pessimistic +/-1mm

          The mean of ten measurements would have a precision of

          1*(1/√10) = +/- 0.32mm

          For 100 readings

          1*(1/√100) = +/-0.1

          For 10,000 readings

          1*(1/√10,000) = 0.01mm

          For a digital tide gauge 10,000 readings a year would be 10,000/365 = 27.3 readings per day or one reading every 57 minutes.

          For a global annual mean temperature, even a mercury thermometer can record to +/-1C.

          With 10,000 stations recording twice a day the annual sample size is 10,000*365*2 = 7,300,000.

          Precision of the mean =1*(1/√7300000) = +/-0.0004C

      • CO2isLife says:

        I’m sorry, maybe you missed this in An Inconvenient Truth, you know, the movie shown to every Middle School Student on earth? This one. Maybe you missed it.
        https://youtu.be/1KkrlhoFbBM

        • bdgwx says:

          I didn’t watch Al Gore’s Inconvenient Truth. I have no interest. I prefer to spend my time peer reviewed scientific publications and commentary from bona-fide climate scientists. Al Gore is not a climate scientist. He’s not even a scientist of any kind.

    • bdgwx says:

      Let’s go ahead and tackle the 3rd one now. The video says James Hansen predicted that the global mean temperature would be 3 degrees higher by 2020. Let’s break this down.

      First…Hansen did not say that. The unnamed journalist who wrote the article said that.

      Second…you can see what Hansen’s model actually predicted [https://tinyurl.com/yd56aohp]. Notice that he provides his model with 3 different scenarios A, B, and C. He says in the text that scenario B is his best guess at how humans will behave. Looking at figure 1 on pg. 9347 you see that 2020 will end around 1.10C. Right now 2020 is likely to end at 1.02C. Hansen’s prediction as-is was only 0.08C off. And according to Hausfather 2019 [https://tinyurl.com/sbr37y9] when Hansen’s model is given the scenario that actually played out the output is nearly indistinguishable from observations. In other words, the physics from his model from 1988 effectively nailed the global mean temperature trajectory for the 30 year period.

      You tell us…should we move on to the next item in the gish gallop or have you seen enough?

    • barry says:

      “OK, Barry, lets try this from a different angle.”

      Rather than play whack-a-mole, how about you acknowledge that the 10 Failed Predictions video has misrepresented the science it cites.

    • barry says:

      Another item from the video was a leaked 2003 DoD report on climate predictions by the year 2020.

      The video-maker obviously didn’t read the report itself, or he would have learned in 10 seconds that the ‘predictions’ offered were actually “what if” scenarios based on the notion that climate has changed abruptly in the past.

      Here’s the report:

      https://www.iatp.org/sites/default/files/An_Abrupt_Climate_Change_Scenario_and_Its_Impl.pdf

      Of course, the press were as sensational as the video-maker. Mainly because the Observer had the report and other papers repeated what the Observer wrote.

      So, not a failed prediction, because it wasn’t a prediction.

  54. Laws of Nature says:

    Dear Roy,

    could you comment on the “spikiness” of the Temperature data? It should impossible for the global temperature to jump by more than 0.2°C within a month!? Yet in your data set it does that.. is there some high uncertainty in the measurement (in which case your graph would need to indicate that.

    I know my comment might read highly critical, but I am really curious and try to understand what is happening.

    Thank you and have a Happy New Year!

    • angech says:

      Basically clouds.
      An extra cloudy month in the right areas causes a large change in albedo.
      book quote Spencer
      The most obvious way for warming to be caused naturally is for small, natural fluctuations in the circulation patterns of the atmosphere and ocean to result in a 1% or 2% decrease in global cloud cover. Clouds are the Earths sunshade, and if cloud cover changes for any reason, you have global warming or global cooling.”

    • Entropic man says:

      Laws of Nature

      Weather causes an internal variation of about +/- 0.1C in global temperatures either side of the long term average.

      Thus it is quite normal to see a monthly drop of 0.2C just by random chance, as you jump from the top to the bottom of
      the normal range.

      Larger changes are rarer, and sometimes associated with cycles. El Nino can push temperature up by 0.2C, 0.1C outside the normal range.

    • Richard M says:

      I mentioned one other factor above. The data represents 95% of the planet. However, the 5% it doesn’t is probably the most volatile. As a result another .1 to .2 C of variation is added.

  55. CO2isLife says:

    BTW, I notice that Dr. Spencer puts his work out for public scrutiny, and I’m sure that he welcomes it, and it helps improve his research. Would someone point me to the Website where Dr Thompson, Mann, and Hansen do the same? I’d like to see how they defend their research and to look at the data and logic behind the Hockeystick. I really want to learn about this new statistical technique of Mikes Nature Trick to Hide the Decline. I seem to have missed that in my stats course.

      • Entropic man says:

        Behave. You won’t get a serious reply by behaving like a denialist conspiracy theorist.

      • CO2isLife says:

        I’m sorry, I wasn’t able to find the mathematics supporting “Mike’s Nature Trick to Hide the Decline,” nor was I able to find out why Mike didn’t include instrumental data, even though we know it exists gong back to 1650. Funny, there just seems to be a lack of transparency, but I’m welcome to any “expert” explaining the logic behind those observations.

        • bdgwx says:

          First…at a minimum you’ll need to actually read MBH98 and MBH99 to have a meaningful discussions on Mann’s work. Go ahead and do that now.

          Second…”Mike’s Nature Trick” is in reference to the technique of calibrating and merging the PCA proxy result to the instrumental temperature record. Personally I don’t think it is more obvious than clever. “Hide the decline” is not uniquely related to MBH98 or MBH99. It is actually more related to Briffa’s model for mapping dyndrochronology characteristics to a meaningful temperature anomaly. Specifically, it is in reference to the tree-ring divergence problem and the fact that this model does not handle post 1960 proxies. I recommend reading up on the divergence problem before we have a discussion about this.

          Third…there is insufficient data to produce a statistically meaningful global mean temperature via instrumental records back to 1650. Even the results in the 1800’s have large error margins which is why most datasets only attempt this starting in 1850-1880 or so.

          I think you’re confusing “lack of transparency” with your own lack of understanding. It is okay and even encouraged to be critical of other’s work. But you must first understand it and be familiar with the state of understanding in the field as whole. My advice here is to spend more time reading the actual publications and immersing yourself in the relevant published literature and less time reading non-expert blogger opinions who often mislead and misrepresent the topics.

          • Clint R says:

            bdgwx, what you don’t understand is NO temperature “guesses” from the past will ever be REAL science. There weren’t even any thermometers, over 400 years ago. So NOTHING from you cult will ever have any value, except to you cult followers.

            Learn to accept and appreciate reality.

    • bdgwx says:

      Sorry…UAH is not open for examination by the public.

      I posted the links to the MBH98 and GISTEMP materials above. Unlike UAH it’s open for public examination. I’ll post the links again for your convenience.

      MBH98: https://tinyurl.com/y72vcqmx

      GISTEMP: https://data.giss.nasa.gov/gistemp/

      Perhaps you could email Dr. Spencer and Dr. Christy and ask them to make an equivalent step towards providing their materials so that we can replicate their work.

      • CO2isLife says:

        I’m sorry bdgwx, I wasn’t able to discover why NASA would “adjust” the trend is desert stations even though they aren’t exposed to the Urban Heat Island Effect? Nor did I discover what evidence they have that the thermometers at the time were systematically giving wrong data across the entire globe. Given the complete lack of standardization for any of the metrics and collection processes, that doesn’t surprise me.

        • bdgwx says:

          NASA only adjusts for the urban heat island effect. GHCN-M makes many adjustments so that’s probably what you are seeing. I already went over some of those adjustments with you earlier. They are documented here [https://tinyurl.com/yxr35ctt]. Yes, the lack of standardization or the change in standardization is one huge factor necessitating the adjustments.

          • CO2isLife says:

            This is the “adjustment” I’m talking about:

            Alice Springs (23.8S, 133.88E) ID:501943260000
            https://data.giss.nasa.gov/cgi-bin/gistemp/stdata_show_v3.cgi?id=501943260000&dt=1&ds=5

            Suddenly you go from no warming to warming, yet the location is in the middle of the Desert, far removed from any Cities. Google Earth the Location.

            1) Is this location impacted by the UHI Effect? Nope
            2) Was it “Adjusted”? Yep
            3) Is that location even available in v4? Nope, it “disappeared”
            4) Was any evidence given as to why the instrumental data had to be “adjusted” for that location? Nope.
            5) Did anyone bother to inspect the equipment back in 1880 to verify that the thermometers were giving bad data? Nope.
            6) I could go on and on and on

            I’ve been involved in a trial where the person was let go for serious crimes due to errors far less than those I just listed.

            Could you imagine having to try to justify this nonsense in a court of law under cross-examination? It would be a bloodbath and the credibility of NASA would be destroyed.

          • bdgwx says:

            It looks like Alice Springs got split into two stations in v4.

            Did you read the GHCN-M documentation? Which adjustment would you characterize as fraud?

            Have you downloaded the GHCN-M gcu (unadjusted) file and run it through GISTEMP to see what difference it makes yet?

          • barry says:

            The instruments measuring temperature were also changed over time in Alice Springs. I linked the metadata sheet on that weather station upthread.

          • barry says:

            Also, the Alice Springs temp record is made from at least two different sources, Alice Springs Post Office for the early part of the record, and Alice Springs airport for the latter. Airport weather station commenced in 1941, Post Office weather station closed in 1953, and has data from 1878.

  56. CO2isLife says:

    Okay, I think I’ve stumbled upon a way to demonstrate how absolutely insane some of this argument are that are presented by the “experts.” CO2 absorbs and emits 15µ LWIR. No one disputes that. That is the only wavelength band that CO2 impacts in reference to the GHG effect.

    15µ is the LWIR wavelength emitted by a black body of -80C°

    No one denies that and it can be demonstrated with any blackbody calculator.
    https://www.spectralcalc.com/blackbody_calculator/blackbody.php

    Ice, frozen H20, a Glacier, Sea Ice, Ice of temperature 0.00C° emits higher energy 10.5µ LWIR.

    In what world do we live in can something of -80C° melt something with a melting point of 0.00C°?

    I repeat, Ice emits 15µ LWIR. If 15µ LWIR could melt ice, ice would melt itself. Don’t you climate “scientists” understand how absolutely insane these arguments are?

    • ren says:

      CO2 can warm you up when you are close enough to a burning fire. Provided you’ve collected enough brushwood.

    • angech says:

      Co2isLife.

      “15µ is the LWIR wavelength emitted by a black body of -80C°

      No one denies that and it can be demonstrated with any blackbody calculator.
      https://www.spectralcalc.com/blackbody_calculator/blackbody.php

      Ice, frozen H20, a Glacier, Sea Ice, Ice of temperature 0.00C° emits higher energy 10.5µ LWIR.

      In what world do we live in can something of -80C° melt something with a melting point of 0.00C°?”

      I realise this will get nowhere.
      There is a theory explaining the GHG effect.
      A lot of genuine scientists, including Dr Spencer, have looked at and found the theory to be sensible.
      The theory does explain the world we live in.
      Like you and Dr Spencer we all agree that the application of the theory is flawed.
      Unlike you we do not blame the misapplication of the theory on the theory being wrong.

      When you use the above analogy you are skipping some very important steps that explain how emitted heat at low temperatures is retained and accumulates energy in the system .

      If, everything else stayed equal (never does) then the atmosphere of a planet with GHG is “warmer” than that of a planet without GHG.
      Now the energy in and out stays the same.

      Think of a city with kids on buses coming in and leaving at a constant rate. Now make them hop onto a hundred other buses in turn before being allowed to leave . City fills up with kids on extra buses?

      I agree a lot of it seems wrong.
      In reaching the equilibrium point for transfer of energy the earth does this twice a day at any one location as the sun comes overhead and then at night.
      It is hard to appreciate the bigger picture of how this can cause a permanent increase in the amount of energy in the system.

      Just think of all those school buses going all over the world, billions of kids in them trying to find the right bus home.
      Same thing with all those little 15 microns IR. They add up.

      • Bindidon says:

        angech

        Thank you.

        J.-P. D.

      • Clint R says:

        angech, you are making the same mistake as is made in the AGW nonsense.

        Photons are not kids. Photons are NOT conserved.

        It is more than possible to have more photons absorbed by a surface, than are emitted, yet the temperature does not increase.

        A simple analogy is bringing a block of ice into a 25C room. The ice is emitting photons. It is emitting about 300 W/m^2. Photons are being added to the room, but the temperature does not increase.

  57. Robert Evans says:

    Are the Maldives under water yet? Al? Al Gore? Wtf?

  58. Understanding climate change:

    The “science”
    = wild guess predictions of a horrible climate in 100 years — repeated every year since the 1960s. The future climate can never get better, only worse !

    Warming from year to year
    = climate change

    Cooling from year to year
    = just weather

    Bad weather event
    = climate change

    Good weather event
    = just weather

    Anything bad that happened
    = caused by climate change, or Trump

    Anything good that happened
    = caused by Obama, or Biden

    2019
    = Earth is doomed from climate change in 12 years

    2020
    = Worse than we expected (11 years left)

    2021
    = Worse than worse than we expected (10 years left)

    • Bindidon says:

      Richard Greene

      What a ridiculous, simple-minded polemic (but nothing unusual from your side, however).

      Why don’t you write that at WUWT?
      There you’d find the people adulating you for writing it.

      J.-P. D.

    • Clint R says:

      Richard Greene, you know you got it right when Bindidon emerges from his cave.

      Good job.

      • Richard Greene says:

        Leftists have no sense of humor.

        They love to be miserable, and believe the future will be worse than the present, unless they are put in charge of everything.

        And after they are put in charge of everything, they will find trouble everywhere, diagnose it incorrectly, apply the wrong remedies, and make things worse!

        • E says:

          And Rightists have no sense of reality.

          • Rixhard Greene says:

            Would “reality” be that warmer winter nights in Alaska are an “existential” climate crisis ?

        • Bindidon says:

          Richard Greene

          50 years of life among Germans have teached me that they can be surprisingly self-critical and even gossip about their own humor.

          When they speak of ‘German humor’, they actually mean humor that actually is none.

          Like yours. Thanks.

          J.-P. D.

          • Richard Greene says:

            That was almost funny, Blandidon. Keep practicing your jokes. In a few years you will be entertaining audiences at the local comedy club. In about 25 years. Maybe 30.

  59. Clint R says:

    Sometimes the bloviating is just too much to ignore.

    Two recent examples from bdgwx:

    “I prefer to spend my time peer reviewed scientific publications and commentary from bona-fide climate scientists.”

    “I just want to learn as much as I can about the science and hopefully steer others in the direction of what the abundance of evidence actually says.”

    But the reality is bdgwx doesn’t know crap about REAL science. A classic example:

    “BTW…you can do the experiment yourself. Get an infrared lamp and shine it on a pan of water. The water will warm up. This experiment is repeated continuously everyday in countless cafes around the world where they use heat lamps to keep food warm.”

    An infrared lamp emits much higher energy than the 15μ photon contains. An infrared lamp can burn your skin, if too close.

    bdgwx doesn’t understand ANYTHING about the subject. He just believes in the nonsense from $cience papers and his cargo cult.

    And bdgwx is not the only one. A more complete list would include Norman, Bindidon, Ball4, Svante, E. Swanson, Entropic man, Folkerts, and several others. The common thread among them all is their avoidance of reality. They have different personalities and talents, but they all avoid reality.

  60. CO2isLife says:

    Bindidon, stop attacking other and take the Challenge I outlined above:
    1) H2O is by far the most potent GHG
    2) NASA claims that Earth is Greening: https://earthobservatory.nasa.gov/images/146296/global-green-up-slows-warming
    3) Identify Locations of Greening and Non-Greening, and determine the temperature differential between Greening and Non-Greening Location. We know that vegetation increases water vapor. https://www.smithsonianmag.com/science-nature/what-really-turned-sahara-desert-green-oasis-wasteland-180962668/
    4) We know that current climate models haven’t incorporated the Green of the globe in their coding. https://mrooijer.shinyapps.io/graphic/

    Be the first to totally debunk AGW with this extremely simple experiment.

    Here is an example: (Use the Unadjusted Data)
    Non-Greening
    Oran/Es Senia Algeria (35.60N, 0.6W) ID:101604900000
    https://data.giss.nasa.gov/cgi-bin/gistemp/stdata_show_v3.cgi?id=101604900000&ds=5&dt=1

    Greening:
    Indore (22.72N, 75.80E) ID:207427540000
    https://data.giss.nasa.gov/cgi-bin/gistemp/stdata_show_v3.cgi?id=207427540000&dt=1&ds=5

    Do a study for the temperature differentials between greening and non-greening locations, and you will be able to tease out the impact of H20 on the global temperature charts created by NASA. NASA for some reason thinks that a composite of apples and oranges somehow forms a meaningful composite, it doesn’t, it simply creates a confusing and inconsistent data salad. Identify locations controlled for the UHI and Water Vapor, and you will discover the true impact of CO2 and H2O on the climate. NASA hasn’t done that for a reason. Their funding depends upon the garbage chart that they create. Charts like this would destroy their funding.

    Alice Springs (23.8S, 133.88E) ID:501943260000
    https://data.giss.nasa.gov/cgi-bin/gistemp/stdata_show_v3.cgi?id=501943260000&dt=1&ds=5

    No CO2 driven warming, no funding, it is that simple.

  61. Bindidon says:

    barry

    A propos ‘cherry-picking’…

    I see below one of your comments, somewhere above

    ” I look at desert stations that show no warming based upon sound scientific reasoning and support of empirical evidence. ”

    and somewhere else:

    ” Simply look up the temperature stations on the GISS site and look for desert stations. You will see there is no warming due to CO2. Look up sites that have been exposed to increasing H2O and you will find warming. ”

    Hmmmh. About the umpteenth time within ONLY ONE month…

    Here you can see how cherry-picking is one of the foundation of reasoning for people like CO2isLife.

    He takes a little few stations out of GHCN V3, and says: look, desert, no warming.

    Reminds me the cherry-picking of Goddard aka Heller when comparing unadjusted/adjusted V3 station data.

    The best is that he tries, in the comment above, to prove his claim by using a station located directly near a great Algerian town (Oran), a corner having few in common with a desertic area.

    ***

    Let us see what happens when, instead of picking the red cherries, you average all cherries (here: 108 ‘desert’ stations, after elimination of stations giving spurious data, and of all non-rural stations):

    https://drive.google.com/file/d/1Maa7AKnB7RblEG7-qQU-v4mq_FAHNgyj/view

    Trend for ‘desert’ stations within 1890-2019: 0.9 C / decade, compared with 0.06 C for the V3 average over the GREEN 20N-20S band of the Tropics a la UAH, and 0.07 C for all stations worldwide.

    *
    To make the statistics a bit more complete, here is a chart showing the time series of the running 30 year linear trends over the ‘desert’ data:

    https://drive.google.com/file/d/1hOTENXnOTD_on25ssCIJuE3KaL8H2JCb/view

    Both backward and forward trends were plotted (though being identical) because some people might ‘guess’ they don’t.

    ***

    Yesterday I recalled that our CO2 genius also mentioned, in the previous thread, the Californian GHCN V3 station ‘DEATH VALLEY’.

    In the station list, it is not recorded as ‘desert’ but as ‘shrub’. Thus I collected all these stations too (but ignoring all non rural ones, like for the ‘desert’ stations).

    Additionally, all stations within the Tropics were ignored.

    Result of ‘desert’ + ‘shrub’: 0.08 C / decade.

    Let’s recapitulate:

    – desert: 0.09 C / decade
    – desert + shrub: 0.08 C / decade
    – Globe: 0.07 C / decade
    – Tropics: 0.06 C / decade

    Thus, it seems that the more green stuff you have around you, the less warm it has become for you in the last 130 years.

    This is exactly the opposite of what CO2isLife claims.

    And what is then really dishonest: instead of simply acknowledging, such people say instead: ” Thanks for making my point” !

    *
    Oh, I forgot a nice detail: if you create a a UAH6.0 LT time series out of all grid cells encompassing ‘desert’ stations, you obtain a trend of 0.18 C / decade for 1979/2019, and… of 0.14 C for those encompassing all Tropics stations.

    Wonderful.

    ***
    His idea – to demonstrate that the more H2O aka water vapor there is, the more warming you get – sorry: that is really nonsense.

    Exactly as it is nonsense is to discuss warming related to the ridiculous CO2 backradiation (2 W/m^2).

    If CO2 has ANY REAL effect, then it is certainly NOT this backradiation. Measuring it is merely a proof that not all IR gets radiated to outer space.

    I’m no CO2 expert at all, let alone is CO2isLife: this is what he never will accept.

    He really believes that his simple examples are like a proof, just like others think they can disprove lunar spin using coins.

    CO2isLife should imho better concentrate on CO2’s effect at altitudes between 15 and 50 km.

    J.-P. D.

    • Bindidon says:

      Oops! Typo, should read

      ” Trend for desert stations within 1890-2019: 0.09 C / decade

      • CO2isLife says:

        Bindidon, I’m not sure you know how to read your own Chart:
        https://drive.google.com/file/d/1Maa7AKnB7RblEG7-qQU-v4mq_FAHNgyj/view

        1) It doesn’t show an uptrend, you maybe have slight warming at the end. Is this “adjusted” data? If yes, that is the “adjustment” not warming
        2) 100% of the recent measurement fall within the range of temperatures reached between 1880 and 1900, 100%
        3) Current readings were substantially below 0.00 as recent as 2112
        4) The variability is enormous in the early period and small in the recent period, you have heteroskedasticity in your data set, so I’m not sure how reliable it is. Is the data set consistent from 1880, or is it an apples and oranges data set that is meaningless
        5) All readings, 100%, are below the peak temperatures reached early in the data set, 100%.

        Once again, I bet that is “adjusted” data, and the only warming you identified is the “adjustment.”

        Is that true?

        Not sure what this chart is intended to prove, other than I am 100% correct.
        https://drive.google.com/file/d/1hOTENXnOTD_on25ssCIJuE3KaL8H2JCb/view

        This chart states that you used Unadjusted data, and you picked a 30 year moving average. Interesting time period, but what does it tell us? Temperature FELL from 1920 to 1990, they don’t reach a new high until 2002, and then then flat line from 2004 to current.

        Did something happen in 1990 related to CO2 to cause the rise in temperatures? Nope. Your chart shows 0.00 trend related to CO2. Zip.

        Facts are, look at the variability. That can’t be caused by CO2, and the temperature ranges all stay within the range defined early in the data set before the large increase in CO2.

        Anyway, let’s go about this in another way.

        1) I can find many desert locations that show no warming at all.
        Alice Springs (23.8S, 133.88E) ID:501943260000
        https://data.giss.nasa.gov/cgi-bin/gistemp/stdata_show_v3.cgi?id=501943260000&dt=1&ds=5
        2) Please explain why the laws of quantum physics cease to exist in those desert locations. Why did an increase in CO2 not cause warming. Answer that very very simple question.

        Also, Bindidon, please post a spreadsheet on the station locations that you used for your graphs and their BI if possible. I’d like to take a look at your sample.

        • CO2isLife says:

          I went back and checked, you did use Unadjusted Data for that first chart. Please post a spreadsheet of those locations and their BI if possible. Even though your charts prove my point, I would like to see your sampling technique.

      • CO2isLife says:

        Bindidon: Yesterday I recalled that our CO2 genius also mentioned, in the previous thread, the Californian GHCN V3 station DEATH VALLEY.

        This is exactly the opposite of what CO2isLife claims.

        If you want to claim that there is warming in this chart due to CO2, have at it, but only the most gullible fool on earth would believe that. Once again I ask, why have the laws of Quantum Physics cease to exist in Desert Locations? Why doesn’t CO2 cause warming?

        BTW, a regression on a chart with this much variability is completely meaningless. What is the R-Squared? 0.00?

        Death Valley (36.4622N, 116.8669W) ID:USC00042319
        https://data.giss.nasa.gov/cgi-bin/gistemp/stdata_show_v4.cgi?id=USC00042319&ds=14&dt=1

    • CO2isLife says:

      “Here you can see how cherry-picking is one of the foundation of reasoning for people like CO2isLife.”

      Nice Try Bindidon, you clearly don’t understand how to build a controlled experiment. I’m not “Cherry Picking” locations anymore than the FDA “Cherry Picks” obese people to do diabetes studies.

      Let me go back and speak real slowly. We are trying to tease out the impact of H20 vs CO2 in the temperature readings. That requires 2 samples.
      1) Cherry Picked Desert/Non-Greening Locations
      2) Cherry Picked Greening Locations

      That isn’t “Cherry Picking” as you are used to in the field of CLimate science when you pick and choose only the data sets that favor your outcome, and “adjust” those that don’t.

      I challenge all you “expert” Climate “Scientists” to do a very simple experiment.

      Download all the Data for the Temperature Stations with a BI of 10 or Below. Bindidon would call this “Cherry Pick” the locations controlled for the UHI Effect. Then Download the data for all the stations with BIs over 30. Run a recession of the two “samples” ie “Cherry Picked” Stations. Compare the slope coefficient on the regression of the two samples.

      My bet is you will get a substantially higher slope for the stations impacted by the UHI. The temperature differential that you will identify is baked into the NASA GISS Temperature chart which everyone here is trying to model using CO2. The insanity of that exercise is beyond words to anyone familiar with modeling.

      I can think of countless ways to use NASA’s own data to debunk their theory od AGW, and yet the Experts never seem to be able to figure out the simple models that I’ve explained in the Blog.

      Anyway, to identify the real impact of CO2 on temperature all you need to do is identify desert locations with a BI of 0, download the raw “unadjusted” data, run a regression and record the slope. That slope is the ΔT over Time. You can then create another time series of not CO2, which the amateur climate scientists seem to use, and replace CO2 with the marginal ΔW/M^2 attributed to CO2’s increase. Regressing the 2 new data sets, with T being the dependent variable and ΔW/M^2 being the independent variable, you can then identify the ΔT/ΔW/M^2.

      Once again, I challenge all the Experts to identify the Desert Locations, locations controlled for the UHI and Water Vapor, record the slope and average them out. That is the true impact of CO2 on temperatures and my bet is is 0.00.

      Prove me wrong.

  62. Ken says:

    I’m not sure why we are all excited about the la nina temperature drop. Sure, we’d all like to see the AGW crowd find their hypothesis proven wrong to the point of indefensible. The reality though, is that warmer is better than cooler. Cooler temperatures means a shorter growing season and wilder weather due to larger temperature gradients. I’d hate to go through a mini ice age scenario; last time Europe lost half its population. No one has died from the modest warming that has been observed. There are still tens of thousands dying every winter from exposure to cold.

    • Bindidon says:

      Ken

      101 % agreed. Warm is better than cold.

      With the exception that in Germany for example, many 100,000 ha of forrests are really endangered, due to recent warmth and dryness increase.

      And I really don’t know whether or not all the millions of people living above 60N really enjoy their current situation like I do here in Northern Germany, a corner where harsh winters become an absolute exception (the last one was 2010).

      J.-P. D.

    • Eben says:

      Yes the warmer would be better , but the world right now is in the state of CO2 warming psychosis which needs to be broken

      The reason excitement is there was a long about 16-18 years period of no warming , this was broken by strong double ElNino , a good Lanina could bring the level back down to zero trend and the pause would resume , this time over 22 years long.

      • Gordon Robertson says:

        eben…”Yes the warmer would be better , but the world right now is in the state of CO2 warming psychosis which needs to be broken”

        Actually, the warming psychosis has been displaced by a virus psychosis of the hebephrenic variety. From Britannica…

        “The hebephrenic or disorganized subtype of schizophrenia is typified by shallow and inappropriate emotional responses, foolish or bizarre behaviour, false beliefs (delusions), and false perceptions (hallucinations)”.

    • Gordon Robertson says:

      ken…”There are still tens of thousands dying every winter from exposure to cold”.

      This winter, they are blaming that on a variant of a virus no one has ever seen.

  63. Eben says:

    Good climate shystering update

    https://youtu.be/9MQ2lI_pDJw

  64. Bindidon says:

    Incompetence… or dishonesty?

    About CO2isLife’s comment on the GHCN V3 station

    Alice Springs (23.8S, 133.88E) ID:501943260000

    https://data.giss.nasa.gov/cgi-bin/gistemp/stdata_show_v3.cgi?id=501943260000&dt=1&ds=5

    *
    Suddenly you go from no warming to warming, yet the location is in the middle of the Desert, far removed from any Cities. Google Earth the Location.

    3) Is that location even available in v4? Nope, it ‘disappeared’

    **
    1. My very first remark is that if you are so incompetent that you don’t even know where to find the data you need to properly discuss about a station, you become dishonest as soon as you write about what you were not able to discover.

    Here is how Alice Springs ‘disappeared’ out of GHCN V4:

    ASN00015540 -23.7100 133.8683 580.0 ALICE_SPRINGS_POST_OFFICE
    ASN00015590 -23.7951 133.8890 546.0 ALICE_SPRINGS_AIRPORT

    found on Jan 3 in the files

    ghcnm.v4.0.1.20210103/ghcnm.tavg.v4.0.1.20210103.qcu.inv

    and associated.

    The second station is the same as that existing
    – in GHCN V3

    50194326000 -23.8000 133.8800 547.0 ALICE SPRINGS 559S
    18HIxxno-9A10HIGHLAND SHRUB A

    and in GHCN daily (same record as in GHCN V4).

    *
    2. Incompetence and dishonesty you furthermore see when people look at a bloody NASA chart, and decide – on the base of simple eye-balling !!! – that the unadjusted variant shows no warming, while the adjusted one very well does.

    Here are more elaborated charts showing us the tremendous difference betweeen the two variants for Alice Springs:

    1. 1880-2019

    https://drive.google.com/file/d/17P0mR7NEa7z8usFxlw5qQV_WwSDiRijh/view

    Trends in C / decade for 1880-2019
    – unadj: 0.04
    – adj: 0.09

    Woooaaah! I’m terrified.

    Here, the WUWT specialists would immediately tell you: “They cooled the past to make the present warmer”, while of course hiding the fact that for 1979-2019, you obtain
    – unadj: 0.19
    – adj: 0.05

    2. 1900-2019

    https://drive.google.com/file/d/1Sizen80qbYt1qJp786bTTinYsHvbadzJ/view

    Ooops?! Now we have the same trend: 0.08 C / decade.

    My question: are we here really competent enough to decide that the people having adjusted the Alice Springs data between 1880 and 1900 were fraudsters, jsut because that results in a trend increase of 0.05 C / decade?

    *
    Who the heck is this guy nicknamed CO2isLife?

    Why does he discuss here such complex problems as the effect of CO2, while not even being able to understand what is a centered running mean, or to find station data?

    From now on, as intended a few days ago, I won’t react to any further comment made by this absolutely incompetent guy.

    J.-P. D.

    • CO2isLife says:

      Bididion? Are you calling me a liar?

      3) Is that location even available in v4? Nope, it disappeared

      Here is V3:
      Alice Springs (23.8S, 133.88E) ID:501943260000
      https://data.giss.nasa.gov/cgi-bin/gistemp/stdata_show_v3.cgi?id=501943260000&dt=1&ds=5

      Does that chart look like these 2?
      Alice Springs Post Office (23.71S, 133.8683E) ID:ASN00015540
      https://data.giss.nasa.gov/cgi-bin/gistemp/stdata_show_v4.cgi?id=ASN00015540&ds=14&dt=1

      Alice Springs Airport (23.7951S, 133.8890E) ID:ASN00015590
      https://data.giss.nasa.gov/cgi-bin/gistemp/stdata_show_v4.cgi?id=ASN00015590&ds=14&dt=1

      The very reason I use v3 is because it doesn’t have the continual data set in one chart. Calling me a liar for that is pathetic, and it is you that is wrong.

      In any case, I’m waiting on your explanation as to why CO2 didn’t cause warming in any of the Alice SPrings Charts? Pick and choose anyone you want, there is still no warming. Why is that?

      • CO2isLife says:

        Bididion, do you not know how to read a chart? A regression on a data set with this much variability is nonsense. What is your R-Squared? 0.00? If you understood your chart, IT MAKED MY POINT!!!

        https://drive.google.com/file/d/1Sizen80qbYt1qJp786bTTinYsHvbadzJ/view

      • Gordon Robertson says:

        CO2…”Bididion? Are you calling me a liar?”

        Binny calls anyone names who disagree with his pseudo-science. For that, and his pseudo-science, I have labeled him an idiot. He regards being called an idiot as being tantamount to a physical assault, since he has no sense of humour. I might change it to the vernacular, and call him an ijit, something that does not translate easily in Google translator.

        • Clint R says:

          Bindidon tested positive for “idiot” some months ago, due to his aversion to reality. There is no known cure….

      • Bindidon says:

        Definitely last reply

        1. Where did I call you a liar?

        I told about your lack of competence and the resulting dishonesty when insinuating that people would be fraudsters.

        2. ” Im waiting on your explanation as to why CO2 didnt cause warming in any of the Alice Springs Charts? ”

        How many times shall I repeat that neither I let alone you are competent to discuss about CO2 ?

        That becomes really boring.

        Talk with other people, CO2isLife!

        Robertson, Swenson, ClintR: aren’t they enough for you?

        J.-P. D.

        • Swenson says:

          Binny,

          Pleased to see you saying you are not competent to * discuss about CO2 *.

          I agree with you, as that has been my opinion for some time.

          Maybe you can find some jackboots, a peaked cap, and a riding crop, and strut back and forth in front of a large mirror, whacking yourself on the thigh! Oooh, the pain!

    • Gordon Robertson says:

      binny…”Incompetence or dishonesty?

      About CO2isLifes comment on the GHCN V3 station”

      Glad to see you have come around to the fact that the NOAA people running GHCN are both incompetent and dishonest.

      • Bindidon says:

        Robertson the cheating SOB

        Stop trying to discredit and to denigrate NOAA, you pretentious boaster.

        You are even less competent and more dishonest than the CO2 genius I’m talking about.

        J.-P. D.

  65. Gordon Robertson says:

    barry…”Warming isn’t baked in, it comes from the coded physics of the radiative-convective model”.

    Barry…you suffer from terminal naivete and appeal to authority. Coded physics??? The modelers used a set of differential equations that describe flow in gases and liquids then made up physics theories that do not exist in the atmosphere, like positive feedback and a percentage of warming created by CO2, which is unknown.

    There is no decent physics in the models. The physics they use contradicts the 2nd law of thermodynamics in that it permits a transfer of heat, by its own means, from a cooler atmosphere to a warmer surface that warmed the atmosphere. Their physics allows perpetual motion in that heat is recycled via the atmosphere to raise the temperature of the source, the surface.

    It’s too bad these charlatans cannot be prosecuted. When the Trump admin ordered NOAA to release papers they outright refused. Why Trump did not throw their sorry butts in jail is the mystery.

    • Bindidon says:

      Robertson the cheating SOB

      ” Its too bad these charlatans cannot be prosecuted. ”

      If there has ever been a REAL charlatan, then that’s you, Robertson.

      You are the one who should be prosecuted for your endless lies and insults on this blog, against people very probably doing better work than you ever did.

      Isn’t it time, Robertson, to admit how stupid and incredibly unfair you were in insulting Andrew (Benjamin) Motte

      https://en.wikipedia.org/wiki/Benjamin_Motte

      so viciously, as you wrote in a previous thread “Motte was a cheating SOB” ?

      How about a public apology ?

      What are you in comparison with such persons?
      A little foul smelling dust.

      J.-P. D.

      • Swenson says:

        * When warming temperatures gradually melt sea ice over time, fewer bright surfaces are available to reflect sunlight back into the atmosphere. More solar energy is absorbed at the surface and ocean temperatures rise. This begins a cycle of warming and melting. Warmer water temperatures delay ice growth in the fall and winter, and the ice melts faster the following spring, exposing dark ocean waters for a longer period the following summer. *

        That is NOAA for you.They dont seem to realise that sea ice forms in cold regions – which are cold because the Suns rays become increasingly oblique towards the poles. Lamberts Law, Beers Law, Fresnels equations, and all that. The land of the midnight sun is also the land of the noonday night. Up to 6 months of no sun at all. No wonder it gets cold!

        NOAA also dont seem to realise the Earth is spherical, and gravity acts towards the centre, rather than from the North Pole to the South Pole.

        Of course, anybody pointing out reality would be considered for a position in NOAA, so the nonsense that NOAA promotes will no doubt continue for generations.

        Pity.

        • Bindidon says:

          Flynn

          You are exactly as dumb, ignorant and pretentious as is Robertson.

          Indeed: pity.

          J.-P. D.

          • Swenson says:

            Binny,

            I assume you were replying to me.

            You seem to have accidentally addressed your comment to your mythical bete noir, Flynn.

            Still cant produce anything remotely resembling a useful GHE description?

            Just like NOAA and NASA?

            Pity.

    • bobdroege says:

      Gordon,

      Why I bother, but you say

      “The physics they use contradicts the 2nd law of thermodynamics in that it permits a transfer of heat, by its own means, from a cooler atmosphere to a warmer surface that warmed the atmosphere. ”

      No contradiction of the second law, as the heat transfer is not of its own means, it has help, and it is not the only thing happening. I believe honest understanding of the second law of thermodynamics is beyond your comprehension.

      “Their physics allows perpetual motion in that heat is recycled via the atmosphere to raise the temperature of the source, the surface.”

      No perpetual motion, as the source is not the surface, but the Sun.

      And Trump just can’t throw anyone in jail, shows your understanding of our constitution is just as good as your understanding of physics and chemistry.

  66. ren says:

    The strong ozone blockade over the Chukchi Sea from January 7 will break the polar vortex.
    https://i.ibb.co/hFXQJvg/fn-4-n-to-e-0122725435tn20210107.gif
    https://i.ibb.co/m0sMGw3/gfs-z100-nh-f72.png

  67. Bindidon says:

    It is amazing to see the similarity often existing between surface station and LT anomalies.

    This graph compares the average of the data of GHCN V3 stations located in desert environments, with the UAH6.0 LT 2.5 degree grid cells above them:

    https://drive.google.com/file/d/1LAfWGbs6l5Kv9WsEJJ445o7DjEjJm-QX/view

    After 2000, the correlation becomes weaker (as is the case in most comparisons between UAH LT and the surface). But a bit of it remains.

    J.-P. D.

    • CO2isLife says:

      Bindidon, that is some really impressive work. Fascinating charts. One thing to note is that:
      1) There is no uptrend in temperatures, the current temperatures are around the temperatures at the start
      2) The variability is rather large

      Now that you demonstrated that you can choose locations, and have demonstrated that there has been no warming in the deserts, how about identifying the “Greening” areas and see if there is warming there. Identify the locations with relatively high BI, and measure the trends there. Identify all locations with a BI below 10 and average them out.

      Personally, I think the 100% desert locations is the most impressive, but it needs to be compared against other locations.

      Other differentials:
      N Hemi vs S Hemi
      Land vs Sea
      N Pole vs S Pole

      Ball Game Stats:
      1) # 0-10 BI Stations and average temp increase
      2) #10-30 BI Stations and average temp increase
      3) #30-50 BI Stations and average temp increase

      By creating those stats you can start to understand the weighting that occurs in the composite so you can see if the high BI stations dominate.

    • barry says:

      There isd very obviously an upward trend. The 36-month running mean of desert temps starts in the -0.5 to 0.0 range and end in the 0.5 to 1.0 range. That’s a rise of about a degree for desert temps worldwide.

      The smaller the location sample the greater the variability, so you’re going to see a variance much larger than the signal.

      In terms of whether desert temps have changed over the period, the signal is what will tell that to you.

      Bindidon, are you able to calculate a linear regression with uncertainty for the desert data?

      • Swenson says:

        The Antarctic is a large desert. A cold one.

        From Nature –

        * A paradoxical negative greenhouse effect has been found over the Antarctic Plateau, indicating that greenhouse gases enhance energy loss to space. Using 13 years of NASA satellite observations, we verify the existence of the negative greenhouse effect and find that the magnitude and sign of the effect varies seasonally and spectrally. *

        Peer reviewed.

        Read the paper if you want want to see egregious examples of fluxious nonsense.Nature obviously publishes anything they are paid to publish.

      • Bindidon says:

        barry

        Of course! Maybe you are still up in Downunder…

        Linear estimate for the average of 108 desert stations, in C / decade:
        1890-2019: 0.09 +- 0.01
        1979-2019: 0.29 +- 0.02

        Including the Antarctic stations

        https://drive.google.com/file/d/1Maa7AKnB7RblEG7-qQU-v4mq_FAHNgyj/view

        in the average:
        1890-2019: 0.09 +- 0.01
        1979-2019: 0.26 +- 0.02

        (Antarctic starts around 1960.)

        For the UAH cells above the stations:
        1979-2019: 0.18 +- 0.01

        The trend over the trends for the desert stations:
        1890-2019: 0.02 +- 0.001 C / decade^2

        Rgds
        J.-P. D.

      • CO2isLife says:

        Barry, if you think you see an uptrend, then you don’t know what an uptrend is. The variation is huge, and can’t be attributed to CO2, The moving average constantly hovers around 0.00. The lowest temperatures occurred relatively recently, current levels are below the early measurements. The atmosphere isn’t like a battery, it doesn’t store energy. Once you fall below 0.00, you have to add back in energy. If CO2 was trapping heat, you wouldn’t hover around 0.00. Lastly, run a rolling regression, you will see that depending upon the time period selected you will get wildly different slopes and r-squareds. None of that volatility can be attributed to CO2 unless you can explain how CO2 causes both warming and cooling.

        https://drive.google.com/file/d/1LAfWGbs6l5Kv9WsEJJ445o7DjEjJm-QX/view

        This chart shows the same, only over a longer time period. Regression lines on data with such volatility are meaningless. Look how the new highs are reached very often, current measurements are the same as the early measurements. temps hover around 0.00. There is no credible uptrend, and depending upon the time period, you get completely opposite results.

        https://drive.google.com/file/d/1Sizen80qbYt1qJp786bTTinYsHvbadzJ/view

      • barry says:

        Thanks again, Bindidon. I got an early night last night, bad cough.

        CO2isLife, Bindidon has kindly calculated the linear trend including uncertainties, which accounts for the variability vs the signal.

        The results are, quoting Bindidon, and putting the uncertainty in brackets:

        Linear estimate for the average of 108 desert stations, in C / decade:
        1890-2019: 0.09 (+/- 0.01)
        1979-2019: 0.29 (+/- 0.02)

        That is strong statistical significance, confirming that deserts have warmed over the period.

      • barry says:

        “The variation is huge, and can’t be attributed to CO2”

        Correct. CO2 has virtually no impact on short term (ie monthly) variation. It only has long-term effect per AGW. Weather still happens. ENSO still happens. Solar cycles still happen. These have impacts on the month to multiannual scale. CO2 has effect on the multidecadal scale. According to the IPCC its effect has been primary – globally – only since the middle of last century. CO2 increase has accelerated since then.

        So if you start at 1950, you should see, according to IPCC the effect of CO2 on global temps. You’re still going to have variation, you’re still going to have weather, and you’re still going to have to look at multidecadal periods to see the CO2 signal.

        Local temperatures are more strongly affected by local condistions that by global ones, even CO2. There are a few parts of the world (a patch in the North Atlantic) that have actually cooled over the last 100 years. Making that area a proxy for global would be a huge mistake.

        Linear trends are only useful for seeing if there has been a change from beginning to end of a series. They don’t of course, capture the variability, or any wave patterns in the data. There are other toold for that. But any polynomial regression is going to give you a warming trend for global deserts.

  68. Clint, the way you always kiss Gordon’s ass is embarrassing to observe.

  69. CO2isLife says:

    Bindidion Says: Who the heck is this guy nicknamed CO2isLife?

    Why does he discuss here such complex problems as the effect of CO2, while not even being able to understand what is a centered running mean, or to find station data?

    CO2isLife says: He is the guy that asks questions the experts can’t or don’t want to answer.

    Complex problems as CO2? I’ve pretty much defined the CO2 problem, and laid out experiments to test the AGW Theory. CO2 emits 15&Micro; LWIR, which is consistent with -80C°. Ice emits 10.5&Micro; LWIR. That means that if in fact CO2 warms water and Ice, Ice would melt itself. Wrap your head around that one. Does that sound like someone that doesn’t understand the quantum physics of a CO2 molecule? Have you ever heard an “expert” point out such a hole in the AGW theory?

    I explained the centered running mean, are you saying my explanation is wrong? Please explain.

    I can’t find a station? Really? Where does that even come from? Do you think I was able to find v3 by accident and locate Alice Springs? Does that strike you as something someone on the street would be able to do? Is that common wisdom? Trust me, I can find stations. I would like to know how you download stations in bulk the parse them out into groups so easily. I’ve been doing it manually and I can only get the “Adjusted” data.

    • bdgwx says:

      Something is not clicking. Let me see if I can clarify things here. Black bodies emit 15 um radiation at all temperatures. The higher the temperature the more energetic that channel is. For example…at -80C the spectral radiance is 1.1 W/m^2 per sr/um while at 0C it is 4.8 W/m^2 per sr/um. 4x more energy is carried in that channel at 0C than at -80C despite the fact that the peak channel is 10.6 um vs 15 um.

      Let’s do another comparison. Consider the same blackbody above. At -80C the 14-16 um band emits 2.2 W/m^2 per sr while at 0C it emits 9.6 W/m^2 per sr. Again…even though the peak frequency has shifted the warmer body still carriers more energy in the select band.

      So saying things like “CO2 emits 15 um; LWIR, which is consistent with -80C” is no more or less correct than saying “CO2 emits 1 um; LWIR, which is consistent with -80C”. And that’s the crux of the problem. Your statement is meaningless and useless. As Pauli often says your understanding of the radiation physics (or at least articulation of it) is not even wrong.

      • Clint R says:

        bdgwx, you appear to be desperately throwing out things trying to somehow pervert reality, again.

        You are, purposely or incompetently, confusing a gas line spectrum with a full BB spectrum. That leads you to end up with nonsense like “CO2 emits 1μ LWIR, which is consistent with -80C”.

        You really have no clue.

      • bdgwx says:

        Err…typo. That should say So saying things like “CO2 emits 15 um; LWIR, which is consistent with -80C” is no more or less correct than saying “CO2 emits 15 um; LWIR, which is consistent with 0C”

    • barry says:

      I believe Bin uses GHCN daily data, which is raw daily summaries of temp, rain, humidity etc for weather stations. It’s a much larger repository than GHCN monthly – around 35 000 stations, if memory serves me correctly. The data isn’t adjusted, but they do quality control checks to reduce duplication and to winnow out unrealistic values (like maximum temp at location X of 323 degrees C.)

      I don’t know how Bin compiles the data into climate regions, but he has consistently here posted graphs of subsets of the data depending on the topic of the moment, like desert temperatures.

      One drawback of using the daily records is that as you go back in time the temp records become more clustered in the US and Europe, so ‘global’ temps in the 19th century and early 20th century are weighted to the average temps of US and Europe.

      • Swenson says:

        barry,

        The main drawback of using daily temperature records is that you will probably fool yourself into believing that climate is an average of temperatures. As you point out, weather is more than just temperature, and average temperatures tell you nothing about extremes.

        Somebody who fools himself in this matter is capable of believing that CO2 makes thermometers hotter, that the director of GISS (Gavin Schmidt) is a scientist, or similar foolish things.

        Correlation is not causation. Climate science is an oxymoron. There is nothing scientific about averaging irrelevant averages, and then claiming that the average somehow influences weather!

        Carry on being as foolish as you like. Variety is the spice of life, isnt it?

      • angech says:

        Barry
        “GHCN daily data, which is raw daily summaries of temp, rain, humidity etc for weather stations. Its a much larger repository than GHCN monthly around 35 000 stations, if memory serves me correctly. The data isnt adjusted, but they do quality control checks to reduce duplication and to winnow out unrealistic values”

        Memories are not the same things as facts.
        “There is continual reprocessing of the GHCN-Daily”
        ‘GHCN-Daily contains records from over 100,000 stations in 180 countries and territories.
        But
        daily maximum and minimum temperatures are available from more than 25,000 sites.”

        Not 35,000.

        Both the record length and period of record vary by station and cover intervals ranging from less than a year to more than 175 years.”

        They do adjust the data, it is not raw in the form you see.
        Nor should it be.

        “Every day there are updates to GHCN-Daily station data from a variety of data streams, which also undergo a suite of quality checks. In addition the dataset is reconstructed each weekend from its 25-plus data source components to ensure that GHCN-Daily is generally in sync with its growing list of constituent sources.’
        “announcements of significant data additions to GHCN-Daily are provide in the GHCN-Daily status reports”
        confirm that a real-time data source for a particular station/day has been replaced by an archive-quality data source. real-time ASOS summaries are subject to change upon receipt of archive-quality sources.”

        How GISTEMP works
        “December 14, 2020: A closer look at the reports of the station Gateshead Island (70.6333N, 100.2667W) showed a clear discontinuity near the end of 2011. There are also a lot of months missing after that point. Hence we deleted all records of that station starting with 12/2011.”
        Changing the past one cold spot at a time?
        Surely they could have just used an adjustment rather than throwing out real data?

      • barry says:

        angech, quality checks are not adjustments. I already described some of the things they do. This paper describes them in more detail.

        I could be wrong, but I think the 25,000 number is outdated (and should be updated). It’s been that number for the last 8 years

        https://tinyurl.com/y5c4ttj2 [Wayback Machine archived this page in June 2012]

        …but the full database has grown from 75,000 to over 100,000 in the last 8 years.

        My memory is pretty good. Bindidon will be able to determine the matter.

      • Bindidon says:

        barry

        ” One drawback of using the daily records is that as you go back in time the temp records become more clustered in the US and Europe, so ‘global’ temps in the 19th century and early 20th century are weighted to the average temps of US and Europe. ”

        No, this is, apart from very early times (1750-1850), not quite correct, because of the gridding function nearly everybody uses (called also binning, or area weighting).

        This has nothing to do with the time series’ unit: hour, day, month etc.

        It has only to do with the number of measuring devices per area, regardless what they measure: temperature, precipitation, snow cover, sea level etc.

        By using area weighting, e.g. based on UAH’s grid cell size (2.5 degree, i.e. 70,000 km^2), you switch, when using GHCN daily

        – from 20,000 US stations competing with 20,000 outside of the US

        – to a competition between 200 US grid cells and 2,000 cells outside of the US.

        In the gridding case, US measurements are about 9 % of the total, quite near to the US/Globe land ratio of 6 %.

        Here are the 20 grid cells encompassing the most stations:

        43.75 | -78.75: 364
        38.75 | -76.25: 331
        48.75 | -123.75: 325
        41.25 | -73.75: 318
        43.75 | -71.25: 298
        38.75 | -121.25: 274
        41.25 | -111.25: 271
        38.75 | -78.75: 258
        41.25 | -76.25: 244
        43.75 | -73.75: 231
        46.25 | -121.25: 227
        43.75 | -81.25: 225
        41.25 | -78.75: 217
        38.75 | -81.25: 215
        48.75 | 8.75: 209
        46.25 | -71.25: 209
        36.25 | -83.75: 206
        46.25 | -73.75: 203
        36.25 | -81.25: 200
        41.25 | -71.25: 199

        19 of them are in the US (with a few Canadian stations in). One cell is in Germany near Stuttgart.

        Even if you consider the US, you see a difference when gridding, as many US cells have far less stations than the top20.

        The best is to look at the grid distribution:

        https://drive.google.com/file/d/17ZgjmYUL43320EoLQ5bL0Hs3aYwas-gt/view

        When gridding, each cell has the same weight…

        The most perceptible difference between the two you see in a computation of the daily maxima per station per year I made in 2019, using GHCN daily:

        – without gridding

        https://drive.google.com/file/d/1GMuNs9ptRzDd7KxFQbKv0o5ySR5VNc9b/view

        – with gridding

        https://drive.google.com/file/d/1TFdltVVFSyDLPM4ftZUCEl33GmjJnasT/view

        J.-P. D.

      • Bindidon says:

        barry

        The last time I made a full download of GHCN daily was in the beginning of October.

        At that time, there were 115,084 stations busy with lots of measurements, and 40,347 of them measured TMIN/TMAX, TAVG or both. 19,442 were in the US.

        It is very easy to be informed about the number of GHCN daily stations: you just need to look at the size of the file

        https://tinyurl.com/ydbymtp6

        and to divide it by 85 if I well remember.

        To get the number of stations busy with temperature is a bit less simple: you must

        – download the file
        https://tinyurl.com/yae4aydn

        – construct the unique subset of station ids having one of the properties TMIN, TMAX, TAVG (I didn’t use TOBS until now).

        J.-P. D.

      • barry says:

        Thanks, Bindidon, I knew my memory works ok. I see more stations have been added, as they have been doing througout, more than 40,000 stations with temp data now.

        The links you provided:

        https://tinyurl.com/ydbymtp6

        https://tinyurl.com/yae4aydn

        open on a blank page for me. I also remember that to access the data requires certain software not native to my computer – the files had an unusual suffix – .gz or something for compressed files. Anyway, my machine doesn’t handle it, and I gave up after learning I had to buy some software to do it.

        My point was that a user needs to do the proper weighting with the data or it skews toward the US and Europe. Once you extract the data, what software do you use to process it, or is there a web service that does that?

      • barry says:

        The gridded and ungridded charts are very interesting! I didn’t realize the difference would be so large. Thanks again.

        • angech says:

          Barry,
          Temp , Temp, Temp.
          Daily and Monthly.
          From NOAA.
          Not Bindinon.
          Look it up.
          Global Historical Climate Network Daily – Description
          There are not 115,084 weather stations reporting temperatures.
          Only 40,347 of them might measure TMIN/TMAX, TAVG but possibly not the both needed?
          GHCN “brings the total number of monthly temperature stations in v4 to approximately 26,000 compared to 7200 in v2 and v3.”
          GHCNm v4 consists of mean monthly temperature data only.
          There are more than 100,000 stations contained in GHCN-Daily. Many sites report only precipitation, daily maximum and minimum temperatures are also available from more than 25,000 sites”

          From Nick Stokes site.
          This should be authorative enough.
          “The TempLS result is based on 8603 land stations of GHCN V4 which have reported to date, . More (about 800) land stations will post results during January, and this will alter the result a little. An increase of 0.054°C needed to put 2020 ahead is possible, but not very likely. TempLS usually matches GISS NASA fairly well, but given the closeness, whether GISS 2020 comes out ahead is not predictable from this.”

          • Bindidon says:

            angech

            1. ” There are not 115,084 weather stations reporting temperatures. ”

            Could you please correctly read posts before commenting them?

            At that time, there were 115,084 stations busy with lots of measurements, and 40,347 of them measured TMIN/TMAX, TAVG or both. 19,442 were in the US.

            And what you do not seem to understand is that the GHCN V4 selection out of GHCN daily (only 68 %) is in itself an ‘adjustment’.

            That is the reason why I still didn’t move to V4 yet.

            2. ” …but possibly not the both needed?”

            Why do you write that? You did never make the comparison, otherwise you wouldn’t write ‘possibly’. You would KNOW both are needed for some corners in the world!

            OMG…thanks a lot.

            Sorry angech: you are currently quite a lot in the near of Robertson, Swenson, ClintR!

            But maybe you feel quite well in their mental corner.

            J.-P. D.

  70. Maz says:

    CO2…
    Climate science has the Credibility of a Journalist….
    Are you daring to question the “eminent” Zeke Stay at home dad pretending it’s possible to be both ?
    Despite qualifications and positions ( long ago), I never thought I was really a scientist because I had an emotional attachment to my opinions of what results meant. Apparently these days that’s not an instant disqualification ?

  71. Gordon Robertson says:

    angeck…”When you use the above analogy you are skipping some very important steps that explain how emitted heat at low temperatures is retained and accumulates energy in the system.

    Heat cannot be emitted, it has to be converted to electromagnetic energy to be emitted and in that process the heat is lost. EM is not heat, it is a different form of energy with different properties. EM has no mass whereas heat requires atoms to exist.

    Having said that, I should add a qualifier, heat cannot be emitted in a terrestrial environment. It can be emitted from the Sun as a plasma of protons and electrons, but that’s not the same kind of emission as EM.

    Neither can heat be trapped in the atmosphere as claimed by the heat trapping crowd.It can be trapped by glass in a greenhouse since the glass traps excited molecules of air. There is nothing in the atmosphere can trap molecules.

    • Rob says:

      Nothing in the atmosphere that can trap molecules?
      (Ignoring the fact that that is a ridiculous statement given that the atmosphere is made of molecules which are trapped by gravity), if the atmosphere traps electromagnetic radiation then it ultimately traps heat. You seem to have a picture of electromagnetic radiation just sitting motionless in space. If it is redirected back to the earth’s surface then it is either going to get reflected or get absorbed and warm the earth. There is absolutely no other possibility unless the wavelength is extremely short or extremely long.

  72. Swenson says:

    Just for fun.

    Compressing a gas quickly can increase its temperature.

    Compress some CO2 to 200 bar. At a temperature of 800 C, what is the peak frequency of the photons emitted by the CO2? Where did they come from?

    At a temperature of 400 C, does the peak frequency change? If it does, how can this be?

    Feel free to go into raptures talking about rotational, vibrational, translational, or any other modes.

    You cant actually explain what happens in any rational manner, because you really have no understanding of the physics involved, have you?

    Now, explain why a cylinder of CO2 at 50 bar can be at ambient temperature of 20 C, exactly the same as a cylinder at 1 bar. What is the peak frequency of photons emitted by CO2 in both cases?

    No clue? The peer reviewed literature by self appointed climate scientists not helping? What a pity!

    • Tim Folkerts says:

      “Now, explain why a cylinder of CO2 at 50 bar can be at ambient temperature of 20 C, exactly the same as a cylinder at 1 bar. ”

      This is high school chemistry. Come back when you have mastered that. If you can’t understand this, no one will be able to explain quantum mechanics to you.

      • Swenson says:

        Tim,

        In other words, you cant explain it at the quantum level, can you?

        Thats my point.

        Your only response is to pretend to have knowledge which you dont. This is quite obvious to anyone who understands the difference between coherent light as emitted by a CO2 laser, and non coherent light emitted by CO2 naturally. Whats the relevance?

        In previous comments you used the coherent output from a laser to support your alarmist argument that non coherent 15 um light emitted by CO2 had similar heating properties.

        At least you havent been stupid enough to attempt to explain any of the trivial questions I posed. Your evasion will be obvious to anyone who has followed our interactions in the past!

        Have fun!

        • Tim Folkerts says:

          “In other words, you cant explain it at the quantum level, can you?”

          Wrong.
          In other words, you don’t understand it at the quantum level.
          In other words, graduate level physics cannot be taught in a blog to people with a high school level of understanding.

          “In previous comments you used the coherent output from a laser to support your alarmist argument that non coherent 15 um light emitted by CO2 had similar heating properties.”

          Mostly wrong. And not worth explaining to someone who is proud of his ignorance about quantum physics and radiation.

    • gbaikie says:

      “Compress some CO2 to 200 bar. At a temperature of 800 C, what is the peak frequency of the photons emitted by the CO2? Where did they come from?”

      If you compress any gas, each molecule has more interaction {or collision} with each other.
      And the container confining the CO2 to 200 bars will radiate at blackbody spectrum {depending the material and surface of container} of 800 C. In terms of insulation, it seems one put reflective surface on outside container if wanted to keep it from cooling as quickly. And if in vacuum, one would use multiple layers of reflective material. If in atmosphere and want to insulate it, one would concerned heat loss to atmosphere, so could wrap in house fiberglass insulation.
      The peak frequency of the photons emitted by the CO2 will depend on what interior of container is radiating at the gas. And would I tend to ignore it, but it seems one alter it by what material of container is. And it seems one could alter it by adding gas purities {such as N2} to the CO2.

      • Swenson says:

        g,

        Molecules dont collide, but its a start. At least you gave the matter some thought.

        As to the rest, you might reconsider your view that altering the material of a container might change the peak frequency of photons emitted by CO2 at particular temperatures (pressure being irrelevant).

        Maybe you could think about whether a mixture of materials at say 20 C in a dark room could be analysed by merely inspecting the photons they were emitting.

        Some people believe that certain compounds can only absorb and emit photons of certain wavelengths. This sort of nonsense is even being taught in some university courses.

        For example, is the temperature of CO2 in a cold carbonated beverage different from the beverage? Some people would claim this to be true. What do you think?

        • gbaikie says:

          –g,

          Molecules dont collide, but its a start. At least you gave the matter some thought.–

          Gases at low temperature such as 800 C or lower would have frictionless interaction with each other- one might save the word “collision” regarding gases colliding at very high temperature.

          Co2 molecule average velocity in our atmosphere is less than 500 m/s
          {500 m/s = 1,116 mph}.

          And I was asking myself the question of how fast these CO2 molecule would be traveling in the 200 bar container at 800 C.

          Do you know?

          If had to make a wild guess, I would say not much faster 500 m/s.

          “As to the rest, you might reconsider your view that altering the material of a container might change the peak frequency of photons emitted by CO2 at particular temperatures (pressure being irrelevant).”

          The issue is the container would be hot and emitting somewhere close to lower end of red light. Oh, actually, well into red:
          –At what temperature does iron glow red?
          Observation and use. In practice, virtually all solid or liquid substances start to glow around 798 K (525 C; 977 F), with a mildly dull red color, whether or not a chemical reaction takes place that produces light as a result of an exothermic process. This limit is called the Draper point.–

          I was going guess tungsten, wouldn’t, but apparently it does.
          But tungsten would not weaken much, unlike Iron. And it would matter what kind surface it had.

          • Swenson says:

            g,

            At say 300 K, CO2 molecule average velocity is around 240 m/s.

            At 1100 K, it is around 1.9 times greater. Feel free to check my mental arithmetic.

            You are right about tungsten glowing at the same temperature as iron. So does glass, and so on.

            The melting point and hardness of tungsten have nothing to do with the wavelengths it emits. Nor does surface treatment. Most alarmists have distorted ideas about physics. Unfortunately, so do many highly qualified people who should know better.

            For example some people think that a dark object is hotter than a shiny one. Enclose both in a block of ice, or even leave both out overnight. Same temperature, youll find. People confuse rate of energy absorp*tion with final temperature.

            Have fun.

          • gbaikie says:

            –g,

            At say 300 K, CO2 molecule average velocity is around 240 m/s.

            At 1100 K, it is around 1.9 times greater. Feel free to check my mental arithmetic.–

            It seems about right, but this applies to sea level air, correct?

            But after looking at it a bit more, there an elephant related to: “Compress some CO2 to 200 bar. At a temperature of 800 C”
            As it would seem to describe Supercritical CO2.
            Though it could be “somehow” beyond Supercritical CO2
            Or supercritical start at 73.8 bar and graph show up 400 K
            https://en.wikipedia.org/wiki/Supercritical_carbon_dioxide

            And after some wandering to see if anyone would brag about pressure and hottest.
            Supercritical CO2 seems it might be replacement for water in steam turbines.
            Apparently doesn’t have water phase change issue and it’s denser than high pressure steam
            But I couldn’t find the properties of 800 C and 200 bar CO2.

            Though some mention of using just over 700 C and 240 bars of pressure. And at some pressure and temperature, it it gets quite dense. But perhaps, the 800 C and 200 bar CO2 is more like air than liquid

            And was wondering if it would glow red if denser.

            And apparently the supercritical CO2 in Venus atmosphere “has not yet been proven”.
            [{because?? it’s got all that nitrogen impurity?? Or what??]

  73. Nate says:

    Dont see it discussing acceleration…or the lack of it.

  74. Nate says:

    Meanwhile, Swenson is off his meds again, determined to find a new strawman. Pressure and optics???

  75. Entropic man says:

    Co2islife,Bindidon

    May I congratulate you both on the success of your thought experiment.

    The two of you have shown that desert stations have risen by an average of 0.9C over the last century while the overall land warming grew by 1.5C.

    This indicates that direct CO2 forcing accounts for no more than 60% of warming and feedbacks account for at least 40%.

    It also means that climate sensitivity for CO2 is greater than 1.6.

    • CO2isLife says:

      Entropic Man, you can only reach that conclusion if you don’t know how to read a chart. Here, let me help you.

      1) A moving average is basically a moving trend line. The shorter the time period the more responsive, and the longer the time period the less responsive to new data. In the graphic so masterfully created by Bindidon, you will see that the moving averages are constantly below 0.00, in fact, I would estimate at least 75% of the time. The “Unadjusted” data is closer to 90%.
      2) Data with this much variability, variability that clearly can’t be explained by the gradual increases in CO2, make long-term regressions meaningless. The explanatory power of the regression or R-Squared is likely 0.00.
      3) What Bididion could do is apply a moving regression of maybe 5 years, and record the changing of the slope over time, as well as the R-Squared.
      4) There is no way anyone familiar with chart reading would see a significant trend being caused by CO2 in any of the graphs Bindidion created.
      5) BTW, the real way to answer these questions is with multi-variable linear regression analysis, you can create an ANOVA Table using Excel in the data/data analysis tab. Problem is, what are the variables other than CO2 that you want to use.

      https://drive.google.com/file/d/1Sizen80qbYt1qJp786bTTinYsHvbadzJ/view

      • Entropic man says:

        ” Data with this much variability, variability that clearly cant be explained by the gradual increases in CO2, make long-term regressions meaningless. ”

        1) For the nth time.

        The gradual increase in temperature over the last 140 years is due to the direct forcing from increasing CO2 and the amplifying feedbacks it induces.

        The shorter term variability is due to other factors. For example, Queensland is currently being hit by a cyclone.

        https://www.bbc.co.uk/news/av/world-australia-55541183

        If some of that reaches Alice Springs it will drastically change the monthly average.

        2) You have been claiming that Alice Springs shows no change in temperature, ie no warming trend.

        If the variability is too large for any trend analysis to be meaningful, how can you claim that there is no trend? Naughty!

        • CO2isLife says:

          “The gradual increase in temperature over the last 140 years is due to the direct forcing from increasing CO2 and the amplifying feedbacks it induces.”

          Prove it. Models based upon that nonsense fail on an epic scale.
          https://www.nsstc.uah.edu/aosc/testimonials/ChristyJR_Written_170329.pdf

          This Feedback argument is 100% pure nonsense because H2O dominates the Troposphere up to about 3km. With or Without CO2, H2O will absorb 100% of outgoing LWIR of 15µ. H20 absorbs the mast majority of the GHG relevant IR and has concentrations up to 4 parts per hundred. CO2 is 1 molecule out of 2,500. If is far far far more likely that H2O will absorb that photon that CO2.

          Understand this graphic and you understand the CO2 Centric Flaws.
          http://www.ces.fau.edu/ces/nasa/images/Energy/GHGAbsoprtionSpectrum-690×776.jpg

          Remember, Ice emits 10.5µ LWIR, whereas CO2 emits 15µ LWIR. If CO2 and 15µ warmed water, Ice would melt itself.

        • CO2isLife says:

          2) You have been claiming that Alice Springs shows no change in temperature, ie no warming trend.

          If the variability is too large for any trend analysis to be meaningful, how can you claim that there is no trend? Naughty!

          Really? You really posted that? An uptrend, something Alarmists claim CO2 causes, is defined as a series of higher highs and higher lows. Clearly, you can’t find many if any desert stations that show warming that meets that definition. Using a regression line slope with such variability is meaningless. Claiming that the effect of a change in one variable due to another has a positive slope, you have to show that along with that positive slope the highs are getting higher and the lows are getting lower. That is Elementary School Chart Reading 101. You have to show the highs are getting higher if you are going to claim CO2 is causing the warming. You can’t do that.

      • bdgwx says:

        CO2isLife,

        2) We know monthly variation cannot be explained by CO2 and CO2 alone. That’s what we’ve been trying to tell you.

        5) There are a lot of variables you would want to look at for long term analysis (decadal time scales). For short term analysis there would be even more (monthly/yearly time scales). That’s what we’ve been trying to tell you.

        Have you researched what variables other scientists have already been considering?

        • CO2isLife says:

          bdgwx, in my world when a claim is made regarding a model and its results, I produce an ANOVA table and can explain to you each variable, its coefficient and its R-Squared. In my world, that is how modeling is done. In the world of statistics, that is how it is done. In the world of econometrics, that is how it is done, and in the world of real science, that is how it is done.

          In Climate Science, they have highly significant factors of clouds, factors I can prove with MODTRAN are far more significant than CO2, and the IPCC list their understanding of clouds and solar activity as “Very Low.” That is the equivalent of claiming to understand weightloss without defining the variables for caloric intake and exercise. BTW, I don’t see actual water vapor anywhere on this IPCC Graphic. I guess they just ignore what they don’t want to understand.
          http://www.realclimate.org/images/ipcc_tar_spm_rad_forc_fig.jpg

          When they do produce models, they are pure 100% garbage. If something is understood, it can be modeled. Well, the CO2 centric Climate Scientists can’t model the climate.
          https://www.nsstc.uah.edu/aosc/testimonials/ChristyJR_Written_170329.pdf

          Only 1 out of 102 models even came close to observations, 1. That is insane. That is complete and utter evidence of an absolute failure of understanding. With 0.00 background in Climate “Science,” having never taken a single class in Climate “Science,” I can tell you with 1,000% certainty that if your model is using CO2 in PPM, and not Δ W/M^2, there is 0.00% chance of that Climate Model ever having valid results. They completely ignore the Physics of the CO2 molecule and its interaction with LWIR of 15&Micro; Temperature changes due to a change in W/M^2, not changes in CO2. Using a linear variable to explain a log variable will never ever ever work.

          • bdgwx says:

            CO2isLife,

            I wrote a big long reply addressing your points and then I realized you aren’t even staying on topic with the points you’ve raised prior. You are doing the equivalent of blinding throwing darts and missing the board altogether. We try to address one dart that has gone of course with you and instead of making corrections you throw another dart and miss wildly again. Look, this is probably going to come of harsh and I certainly don’t want you to think this is personal because I think you are smart guy, but your posts wreak of Dunning-Kruger right now. I say this because you’re talking points suggest you do not understand the current state of the science and what it says. Once again I advise you to at least start with reading the IPCC AR5 WGI report. It is short, maybe 1500 pages, so it will only take a few days to get though. If there are things that you don’t understand then ask questions. That way you can at least be starting off with an understanding of what you are trying to criticize. I also recommend putting your skeptical hat and cross checking claims you see from bloggers and youtubers with bona-fide scientific literature.

          • Clint R says:

            bdgwx, I see you’re out making messes again.

            How about cleaning up some of your previous messes?

            “So you made up some model where a sphere with 1 m^2 surface area which is supplied a 240 W input must somehow emit 480 W/m^2.”

            What in the world were you talking about there? Explain your nonsense.

          • Svante says:

            bdgwx says:
            “We try to address one dart that has gone of course with you and instead of making corrections you throw another dart and miss wildly again.”

            Quite a common syndrome here.

          • Clint R says:

            Yes silly snowflake Svante, it’s certainly common for bdgwx.

            Here’s another mess he left:

            “Finally you used the SB law (which you think is bogus) to determine that 303K must be the right temperature now even though earlier you thought it should be 231.7K.”

            Where did I ever say the S/B Law was bogus?

            Where did I ever say 231.7K was the right temperature?

            bdgwx just makes messes without any responsibility, just like all trolls.

        • Bindidon says:

          bdgwx

          Just a little remark: I have been often wondering why some scientists produced comparisons of CMIP models, but did not mention which RCP level they used.

          It is evident at the power of 10 that using RCP8.5 is simply unscientific, to say the least.

          J.-P. D.

          • bobdroege says:

            One has to have a worst case scenario, RCP 8.5 being among other things, the only one that doesn’t have CO2 removal as part of the scenario.

            CO2 removal scheme seem totally off the table, and emissions reductions so far have pretty much been done only because solar and wind are cheaper than some other methods and natural gas being the only other option being for new power plants in most civilized places. If China continues to build coal plants then RCP 8.5 is definitely still on the table.

            RCP 2.6 is totally missed.

            RCP 4.5 and 6.0 still in play, if we can stop emissions this century and start drawing CO2 down, but I don’t see that happening.

            So I think RCP 8.5 is still the one we are on, and until I see some evidence that we are not going down that path, I would call it the best estimate and scientifically sound.

    • Bindidon says:

      Entropic man

      ” May I congratulate you both on the success of your thought experiment.

      The two of you have shown that desert stations have risen by an average of 0.9C over the last century while the overall land warming grew by 1.5C. ”

      Neither did CO2isLife show any temperature raising in desert stations (that is exactly what he persistently denies using single station graphs and eye-balling their trend).

      *
      Let alone did I perform any ‘thought experiment’ !

      I constructed time series out of existing data, Entropic man.

      J.-P. D.

      • Entropic man says:

        “I constructed time series out of existing data, Entropic man. ”

        Somebody had to. It wasn’t as if CO2islife was going to do it, despite his bluster.

        • CO2isLife says:

          Now now, now that Bindidion showed my how to do it, I’ll create the models in the future. Once again, thanks Bindidion for the data source. That one is new to me. I usually used Wood for Trees which isn’t as robust.

  76. Broadlands says:

    When was the last time that a strong La-Nina did not follow from a strong El-Nino? The current ENSO, the Nino 3.4 has been in neutral (El-Nada) for quite a while and has been below the -0.5° threshold for only a few months.

  77. Broadlands says:

    They are not the same… “The Southern Oscillation Index (SOI) is based on the difference between sea level pressures at Tahiti and Darwin, Australia. The Oceanic Nino Index (ONI) is based on sea surface temperatures in the eastern equatorial Pacific Ocean.”

    The ONI Nino 3.4 is the most widely used. Both, of course, are part of natural variability and are not influenced by the human additions of CO2.

  78. bdgwx says:

    CO2isLife,

    I’m curious…what is your explanation for UAH’s TLT (+0.14) minus TLS (-0.28) trend of +0.42C/decade?

    • CO2isLife says:

      bdgwx, Lower Troposphere increased due to more solar radiation reaching the oceans and increase in H20 Vapor. Lower Stratosphere is cooling due to more CO2 aiding LWIR to outer space.

      Increasing CO2 near the surface is irrelevant because H2O absorbs 100% of the LWIR of 15µ. Increasing CO2 from 1/2600 to 1/2500 doesn’t change much. Increasing CO2 in the stratosphere where the air is very thin, increasing CO2 helps speed LWIR out of the atmosphere.

      The Atmosphere is like a giant Peg Board, with gaps between the pegs small at the bottom and large at the top, so a ball goes easier bottom to top than top to bottom. The distance between the ball connecting with a peg is larger the higher you go on the pegboard. As the air thins, the gaps grow, so a photon travels a greater distance leaving the atmosphere than when it is sent back down towards the earth.

      • bdgwx says:

        What is causing more solar radiation to reach the surface?

        What mechanism causes CO2 in the stratosphere to result in more 15 um radiation escaping to space? Please be detailed enough such that the following are considered: 1) radiation from below that is absorbed by CO2 2) radiation from below that passes through CO2 3) radiation emitted by CO2 directed towards space and 4) radiation emitted by CO2 directed towards the surface. I’m hoping we can agree to ignore 15 um radiation entering from space at least for now.

  79. Broadlands says:

    My point was to try and emphasize the futility of humans and their technology to affect the Earth’s natural variability which includes all of these natural oscillations that are unpredictable and unaffected by the CO2 “control knob”. The trade winds, the jet streams, the volcanic eruptions. The fact remains that the ONI Nino 3.4 is the most widely used and followed index. From the HadlSST 1.1 database the TMin Nina was -1.796 in January, 2000. The TMax Nino was 2.585 in November 2015.

  80. Bindidon says:

    Little, incompetent boasters with the real experience of a 12 year old child should move to the KNMI explorer, and

    – learn there how to generate model data (best based on RCP4.5)
    – compare that data with temperature time series (UAH6.0 LT, RSS4.0 LT, GISSTEMP-V4, Had-CRUT4.x, etc).

    And then they might come back here and present their results.

    J.-P. D.

    • CO2isLife says:

      Wow, thanks a Million Bindidon. That looks like a Gold Mine of data. Once gain, thanks a million.

      Here is the link of Bindidon’s source mentioned above.
      https://climexp.knmi.nl/[email protected]

    • Swenson says:

      Binny,

      Generate model data? About what?

      Climate is the average of weather, but alarmists simplify even further, and assume climate is the average of average temperatures.

      Do you really believe anyone can usefully predict future climate states? The IPCC claims it is impossible. Maybe you should read their reports.

  81. Broadlands says:

    NOAA… “The El Niño/Southern Oscillation (ENSO) – a naturally occurring anomalous state of tropical Pacific coupled ocean-atmosphere conditions – is the primary predictor for global climate disruptions.”

    sea surface temperatures.

  82. Gordon Robertson says:

    co2…”When they do produce models, they are pure 100% garbage”.

    It helps to understand the history of NASA GISS going back to the 1980s. The head honcho was James Hansen, a physicist who worked much of his career in astronomy. He was hung up on the theory of Carl Sagan, who turned astronomy into theatre with little regard for actual scientific fact. Sagan had hypothesized that the current atmosphere on Venus was caused by a runaway greenhouse effect, whatever that means.

    Hansen brought that notion to climate modeling at GISS. He was looking for evidence that CO2 in the atmosphere would lead to the same runaway greenhouse effect theorized for Venus. Actually, he went further, he preached that cockamamey theory.

    Hansen was also an activist. He was arrested at one time with actress(??) Daryl Hannah, protesting the Keystone Pipeline project. She did a decent job in Bladerunner as a freaked out robot. The head of NASA at the time wanted to get rid of Hansen but his effort was blocked by Hansen’s friends in high places, like Al Gore.

    The current head of GISS, Gavin Schmidt, in my opinion, is an arrogant buffoon. He has a degree in applied mathematics and he seems to have absorbed everything spoon fed him by Hansen. He runs realclimate with his buddy Michael Mann, another arrogant SOB. I call him an SOB due to the sexist remarks he made about Judith Curry when she became skeptical about the climate religion, aka AGW.

    Schmidt put out a paper, part of which had his definition of positive feedback, the ingredient required for a sci-fi runaway greenhouse effect. In a critique of the paper, engineer Jeffrey Glassman pointed out that the equation given by Schmidt for positive feedback would not produce positive feedback. The mathematician, Gavin Schmidt, could not describe positive feedback or give the equation for it, yet he programs climate models at GISS that have positive feedback in them.

    Furthermore, in the paper, Schmidt suggested that feedback caused the amplification that could theoretically lead to a runaway effect (tipping point, as Hansen called it). In general, positive feedback requires an amplifier, without which it wont do anything.

    For example, if you have a microphone plugged into an amplifier, and the gain control on the amp is too high, output (air pressure) from the speakers will enter the microphone, go back through the amplifier, come out the speakers, and back into the amplifier. You know the result, an ear-piercing feedback squeal that drives people nuts. That’s positive feedback.

    It’s not as simple as I have described it, I am just making the point that if you turn off the amplifier, the feedback stops instantly. Positive feedback cannot exist normally without an amplifier. There are exceptions in nature, like the resonant feedback that caused the Tacoma-Narrows Bridge to collapse. It was a suspension bridge with a naturally resonant frequency between the support cables and the deck. When the wind started the cables vibrating, like a huge guitar, the vibrations were transferred to the deck and back to the cables.

    That kind of natural resonance is possible and it involves a form of positive feedback. However, there is nothing in the atmosphere can cause such a feedback. Every process in the atmosphere must be negative feedback. But, every climate model is programmed with positive feedback and they show a potentially catastrophic warming that cannot exist.

    • CO2isLife says:

      Wow Gordon Robertson, great post. Wonderful information.

      You may like this:
      https://youtu.be/DPUMztYMuis

      I absolutely love Judith Curry. What courage.

    • Clint R says:

      Good job, Gordon. And don’t forget the time Schmidt ran away from debating Dr. Spencer. They were both on John Stossel show, and Schmidt bolted for the door rather than stay and face Spencer.

    • barry says:

      That reads loke a potted hatchet job to me. Not much of substance but plenty of name-calling.

      Positive feedbacks abound in nature – population growth where the population improves the environment for population to grow, blood clotting, childbirth, ripening of fruit, etc etc.

      If the power of the sun increases, positive feedbacks include the melting of snow caps, reducing albedo contributing further to the rise in temperature at the surface. The ‘amplifier’ is the melting ice darkening the surface of the planet, thereby absorbing more solar radiation. In that warming world the sea level rises, covering brighter land with darker water, another positive feedback. There are negative feedbacks, too. A warmer world has more cloud cover from increased humidity, reflecting more solar radiation, for one.

      While Hansen has prognosticated a runaway greenhouse effect based on burning the entirety of fossil fuel available on Earth, Schmidt disagrees as far as I am aware, and views the runaway greenhouse effect on Earth as essentially impossible. “Tipping points” are not runaway processes, just sudden, quasi-permanent changes, of which the geological record is abundant.

      There are very few climate scientsts that think a runaway greenhouse effect is of any concern on Earth. It’s not a serious part of the discussion, nor does it impact on policy.

      • Clint R says:

        barry, you appear to be moving away from the nonsense. Keep moving in that direction.

        Reality is where you want to get to.

      • barry says:

        I held these views long before I met your trolling self. Whatever strange agenda spurs you to waste bandwidth here is no doubt the cause of your late awakening to what my putlook actually is.

        • Clint R says:

          I can understand your need to defend your troubled past.

          But keep moving toward reality. You won’t regret it.

  83. CO2isLife says:

    Global Sea Surface Temperatures are flat between 1840 and 1980, and then suddenly increase a full 0.5C°
    https://www.woodfortrees.org/graph/crutem4vgl/every/plot/hadsst3gl/every

    What caused the sudden increase? My bet is decreased cloud cover.

    Sure enough.
    https://notalotofpeopleknowthat.files.wordpress.com/2018/10/cc-
    hc4.png

    https://wattsupwiththat.com/2018/11/01/data-global-temperatures-rose-as-cloud-cover-fell-in-the-1980s-and-90s/

    That is exactly what you discover. Fewer clouds, warmer oceans, higher temperatures. Absolutely nothing to do with CO2.

    Once again, I don’t have a Ph.D in climate “science” but seem to be able to find very obvious non-CO2 related explanations for the Climate change.

    • barry says:

      You and WUWT seem to believe that you have discovered something climate scientists haven’t considered.

      I’ve been reading this same old refrain for years. The earliest one was, “They haven’t considered the sun!”

      It’s been an active area of research since the beginning of the IPCC reports and has been discussed in every report. It remains one of the significant uncertainties for various reasons. One is that they can have a different effect on surface temp owing to their height. Low hanging clouds have a stronger effect on incoming solar radiation, whereas higher clouds have a more greenhouse effect, impeding upwelling infrared more strongly than solar radiation – in short, more low-lying clouds have a cooling effect, morte high flying clouds have a warming effect.

      Next thing you know someone will announce that water vapour is the key, as if that hasn’t been studied to death by climate scientists.

      I guess it’s nice to see newbies have a Eureka moment about stuff that has thousands of papers written about.

      • Clint R says:

        barry, someone has misled you, again.

        How clouds affect temperatures depends on if its day or night.

        Maybe if you forgot about reading the “thousands of papers”, and learned some REAL science?

      • barry says:

        The greenhouse effect of clouds is diurnal, while the albedo effect is mostly daytime.

        I say mostly because temperatures fall from a peak during the day. Generally, if it has been a hotter day, it will be followed by a warmer night.

        Your need to triumph in every interaction makes you quite stupid.

        • Clint R says:

          Exactly barry. As I stated, “How clouds affect temperatures depends on if its day or night.”

          See?

          You can learn.

    • Nate says:

      They sure dont make skeptics like they used to. The only ones we get these days are dim and off their rocker.

      • Swenson says:

        N,

        Alarmists never change. No facts, no hypotheses, no theories.

        Just unsupported assertions,

      • barry says:

        I don’t get around as much as I used to, and thought it was probably just the ‘skeptics’ at this website that are as dense as they are in denial. But yes, I used to have much more in depth, progressive conversations with AGW ‘skeptics’. The quality of debate was better here too before the trolls began to dominate the ‘skeptic’ milieu.

        • Clint R says:

          What you may be seeing is more knowledgeable Skeptics. All of your little tricks don’t work anymore.

          We have reality on our side, which means you always lose.

        • Swenson says:

          b,

          As I said to Nate –

          Alarmists never change. No facts, no hypotheses, no theories.

          Just unsupported assertions.

  84. CO2isLife says:

    Never in your life will you find CO2 correlate with temperatures like water vapor does. The charts of water vapor and temperature are almost indistinguishable, and that is according to NASA.

    In the deep tropics, changes in water vapor are very strongly correlated with changes in atmospheric temperatures. Figure 7 shows time series of water vapor and temperature anomalies from the different satellite temperature datasets. The data have been averaged over the oceans in the latitude band from 20S to 20N.
    http://images.remss.com/figures/climate/temperature_and_vapor_trop20_V4.png

    Uh Oh, looks like the NASA Models do an awful job as well. Ironic given the above chart highlights the only variable you need to model temperature. Instead, they ignore H20 and focus on CO2. Strange, very strange when they have the answer right there in front of their face.
    http://images.remss.com/figures/climate/RSS_Model_TS_compare_trop30v4.png

    • barry says:

      “Instead, they ignore H20 and focus on CO2.”

      You really have to read the IPCC reports, even just the introducatory parts.

      In 2007, when I first got involved in online debates about all this, the very first interaction I had was a guy announcing that the upcoming IPCC report would not even mention water vapour and SO2 from volcanoes.

      When the report came out I did a manual word count of every chapter, and got hundreds and hundreds of hits. Furthermore, there were whole sections titled about and devoted to water vapour and SO2.

      So what you’ve just done here is what I first encountered, and was the first step towards my understanding of how arrogant and ignorant AGW skeptics are. Nearly 14 years later and history repeats, as it has over and over in these ‘debates’.

      RTFR!

      • Swenson says:

        b,

        I like the parts of the IPCC reports which say it is impossible to predict future climate states, making the rest of the reports somewhat irrelevant.

        Your turn. Obfuscate, deny, wriggle like the alarmist worm you are.

        From NASA GISS –

        * Atmospheric CO2: Principal control knob governing Earth’s temperature. *

        Notice the word * Principal *.

        From the abstract –

        * Without the radiative forcing supplied by CO2 and the other non-condensing greenhouse gases, the terrestrial greenhouse would collapse, plunging the global climate into an icebound Earth state. *

        Do you really believe all of this nonsense, or only parts of it?

      • CO2isLife says:

        Barry, cut the nonsense. Where are the data sets they have in these models for cloud cover and water vapor? Show me a single climate model that has a focus on water vapor? Why in the world would all this effort be given to model the climate if the Sun and Water Vapor are the cause of the warming? If they are natural causes of the warming, why does everyone claim man is 100% the cause of the warming? Just what is the consensus if man-made CO2 isn’t the cause? Why to they call it Anthropogenic</b? Global Warming if they aren't pointing the finger at Man? Facts are you can't tax the sun and water vapor. In order to tax the energy companies, you have to blame CO2.

        Global warming: why is IPCC report so certain about the influence of humans?
        https://www.theguardian.com/environment/climate-consensus-97-per-cent/2013/sep/27/global-warming-ipcc-report-humans

        IPCC climate report: humans 'dominant cause' of warming
        https://www.bbc.com/news/science-environment-24292615

        Analysis: Why scientists think 100% of global warming is due to humans
        https://www.carbonbrief.org/analysis-why-scientists-think-100-of-global-warming-is-due-to-humans#:~:text=However%2C%20the%20science%20on%20the,(IPCC)%20fifth%20assessment%20report.

        Do I need to paste a link to An Inconvenient Truth and the Nobel Prize Given to Michael Mann? (That's a joke)

        • bdgwx says:

          All global circulation models have physics modules or parameterization schemes that deal with water vapor in many different respects. Most radiative transfer and radiative forcing models incorporate the water vapor feedback (Clausius-Clapeyron relationship) unless specifically noted.

        • barry says:

          “Show me a single climate model that has a focus on water vapor”

          The line you must have cut through the years not to have learned that water vapour is a signal component of GCMs has to have been incredibly narrow. Did you just hop from blog to blog?

          Ramanathan and Coakley, 1978, a seminal paper on radiative-convective modelling, explains how the trace elements in the atmosphere are modeled.

          https://www.atmosp.physics.utoronto.ca/people/guido/PHY2502/articles/rad-convec/Ramanthan_Coakley_1978.pdf

          It’s pretty dense stuff, but one of the early papers that laid the groundwork for atmospheric modeling. You’ll see water vapour, clouds, CO2 and other trace gases investigated, as well as lapse rate and vertical transport of energy through the moist and dry adibiat.

          Take a little time with the paper. It’s not the first of its kind, but it is one of the most comprehensive of the early papers. I can’t comment on the equations, way out of my league, but anyone who is patient can follow the concepts.

          Humidity, by the way, responds to temperature and pressure.

          • bdgwx says:

            That is a great publication. I’m going to have to read in depth when I get time, but I was able to do a rough read through. The number of factors being considered in these models from the 1970’s is overwhelming and way out of my league. And these models are considered privative by today’s standards.

        • barry says:

          I have a post in moderation. Dunno why. Let’s see if the short version posts:

          But you wanted a single example of a model that had WV as the primary focus. Ok, then. From the first page out of google scholar:

          The vertical resolution sensitivity of simulated equilibrium temperature and water‐vapour profiles

          “Variability of atmospheric water vapour is the most important climate feedback in present climate models. Thus, it is of crucial importance to understand the sensitivity of water vapour to model attributes, such as physical parametrizations and resolution. Here we attempt to determine the minimum vertical resolution necessary for accurate prediction of water vapour.”

          https://tinyurl.com/y3k883qw

          Here are some more:

          https://tinyurl.com/y427gnzu
          https://tinyurl.com/y3a34jdg [and clouds!]
          https://tinyurl.com/y4h2mcxb [and clouds!]
          https://tinyurl.com/y64zgwtr [and clouds!]

          Now, before you make some other comment, can you at least admit I have found you not one but several examples of climate modeling focussing on water vapour (and cloud) component?

        • barry says:

          Typical.

  85. Entropic man says:

    Water vapour does indeed correlate with temperature, because changing temperature causes changing water vapour.

    IIRC a 1C rise in air temperature increases absolute humidity by 7%.

    For reasons beyond my pay grade, relative humidity tends to remain fairly constant, so water content of the atmosphere increases 7% per C.

    Don’t get confused by which is cause and which is effect. Water content is a feedback, not a forcing.

    • Swenson says:

      EM,

      Arid tropical deserts are the hottest places on Earth. Not humid at all. Exception to the rule?

      The Antarctic desert contains the coldest places on Earth. Not humid at all.

      What were you saying about water vapour correlating with temperature?

    • CO2isLife says:

      ET, do you not understand the meaning of the NASA Graph I linked? Water Vapor is the Forcing Factor, the only forcing factor. Remove CO2 from the lower atmosphere and that graphic will remain unchanged. Where water vapor is, warmth will be. Remove water vapor and you either get very cold or very hot depending on the sun, but both hot and cold desert will have large temperature drops at night because the insulating effect of H2O isn’t present.

      Once again, if you have a temperature model with the Temperature as the dependent variable and water vapor as the independent variable, and use the data from this NASA Chart, you will get a higher R-Squared and explanatory power than any model you will ever get with CO2. In fact, if you want the true contribution of CO2, simply run a model using that Temperature Data and the Water Vapor. You will get an R-Squared. Then include CO2 and re-run the regression. YOu will get an “Adjusted” R-Squared for a multi-variable model. The difference between the two R-Squareds is the contribution of CO2, of the percent of temperature variation attributed to CO2. I’m surprized someone hasn’t already pointed that out. That is how a real scientist would explain the contribution of CO2 to Temperature. Has anyone done that experiment? Nope. Can you show me in the IPCC Report where someone ran that analysis? Nope. That is why this “science” is a fraud. They ignore the obvious ways a normal scientist would define something.

      http://images.remss.com/figures/climate/temperature_and_vapor_trop20_V4.png

      • bdgwx says:

        H2O is a condensing gas which is the primary reason why it does not participate in the long term forcing of the climate.

        Correlation != Causation. Real scientists know this quite well. And for water vapor specifically it has long been understood that there is strong coupling between temperature and water vapor mixing ratios via the Clausius-Clapeyon relationship. It has been known since the 1800’s that it is the temperature that dictates the water vapor concentration. Arrhenius understood this when he developed the world’s first climate model in 1896.

        • Clint R says:

          Arrhenius was the one that conjured up the Arrhideous nonsense equation that has no validity.

        • Swenson says:

          b,

          Forcing of the climate? This sounds as ridiculous as the straming of the blages!

          One is an example of intentional humour, the other is just inadvertently ridiculous.

          You do realise that climate is just weather averaged over a period, dont you? And not just the average of average temperatures?

          Weather doesnt need forcings (whatever they are). It is a grand example of chaotic fluid dynamics in action. Even the IPCC acknowledges that it is impossible to predict future climate states!

          So what aspect of weather do your forcings affect? And by how much?

          Dont know? Wont say?

          What a surprise!

  86. CO2isLife says:

    BTW, if someone knows a link to the Water Vapor Data in this Graphic in the graphic and posts a link, I’ll do the regression analysis.
    http://images.remss.com/figures/climate/temperature_and_vapor_trop20_V4.png

    The Model will be:

    ΔT = ΔWater Vapor + ΔW/M^2/Δppm CO2 + Error

    My bet is I’ll get about a 99 R-Squared and when I add in CO2, I’ll get an Adj R-Squared of 99. CO2 won’t be a factor.

    • CO2isLife says:

      BTW, that model I just defined, if I use the data for the Water Vapor Chart and the accompanying Temperature data I will be able to create a model that blows away anything the IPCC has created. I am 1,000% certain of that. How can someone that has never taken a Climate “Science” course build a better model for temperatures if the IPCC has “experts” doing their work? Is it normal for a person off the streets to be able to build a model better than the “experts?”

      BTW, that graphic and the model I detailed is a death sentence to defending AGW in a court of law. No CO2 centric model will ever come close to the model I’ll build if I can get that data.

    • bdgwx says:

      First…if you want to correlate water vapor changes with temperature changes why not just use what has already learned over the last 200 years?

      Second…how do you make predictions with this model? Specifically, what is causing water vapor to change in your model and how do you know which inputs to use for future time periods?

      • ren says:

        The amount of water vapor in the air depends on the temperature of the water surface and the strength of the wind.

  87. ren says:

    Consider what can reduce the loss of heat from the surface up the atmosphere? Only reducing the vertical temperature gradient. What in the troposphere reduces the temperature gradient? Only the increase in water vapor in the air. That is why the La Nina phenomenon and the surface temperature of the largest ocean on Earth have such a great influence on the global temperature.
    https://climatereanalyzer.org/wx_frames/gfs/ds/gfs_world-ced2_sstanom_1-day.png

    • Bindidon says:

      ren

      What an amazing theory!

      The major consequence of La Nina is rainfall, from Southeast Africa over India till Southern Australia: that means less water vapor in the air!

      J.-P. D.

      • ren says:

        The MALR (Moist Adiabatic Lapse Rate) is also called the wet or saturated adiabatic lapse rate. It is the temperature trajectory a parcel of saturated air takes. The dry adiabatic lapse rate is a near constant of 9.8 C/km, however, the wet adiabatic lapse rate is much less of a constant. The wet adiabatic lapse rate varies from about 4 C/km to nearly 9.8 C/km. The slope of the wet adiabats depend on the moisture content of the air.
        http://www.theweatherprediction.com/habyhints/161/

  88. CO2isLife says:

    NASA provides all the evidence you need to completely debunk the AGW Theory and IPCC “Experts.”

    If something is understood, it can me modeled. NASA and the IPCC haven’t even come close to modeling the global temperature.

    The NASA Model, even after its fraudulent “adjustments” still falls outside of its confidence bands. That would demonstrate a complete and utter failure in any other field of real science. This graphic comes straight from the RSS website.
    http://images.remss.com/figures/climate/RSS_Model_TS_compare_trop30v4.png

    Why this is a fraud, and NASA has to know it, is because on the very same website they publish this graphic.
    http://images.remss.com/figures/climate/temperature_and_vapor_trop20_V4.png

    Anyone with a 2nd Grade Education in statistics understands that that graphic has an R-Squared of likely over 90 when the 2 data sets of temperature and water vapor are regressed. If the people at NASA had just run that as their model, they would have a nearly perfect model, yet they insist on using CO2 and they produced a completely garbage model AND THEY PUBLISH IT FOR ALL TO SEE THEIR FAILURE!!! The is NASA, the people that put a man on the moon, are showing to all the world what complete failures they are.

    Anyone that wants to win a Nodel Prize in SCIENCE, not a peace prize, simply needs to take the NASA data for Water Vapor and Temperature identified in this graphic. Ad use that as your climate model. It will be far better than anything the IPCC or NASA has created.
    http://images.remss.com/figures/climate/temperature_and_vapor_trop20_V4.png

    Once you do that, you get an R-Squared for the Regression. Most likely above 90. The add a second variable, the ΔW/M^2 for ΔCO2. Then run a 2 factor model and get the Adj-R Squared.

    The difference between the R- Squared and the Adj R- Squared is the contribution of CO2. That is how a real scientist who understands modeling would approach this issue. Clearly the “experts” at the IPCC and NASA know nothing about modeling.
    https://www.nsstc.uah.edu/aosc/testimonials/ChristyJR_Written_170329.pdf

    Stop the Fraud, do the above-detailed research and publish it.
    Roy Spencers Prediction
    https://realclimatescience.com/2017/01/roy-spencers-prediction/

    • bdgwx says:

      I’m still interested in the details regarding your hypothesis of TLT warming and TLS cooling and what modulates water vapor in your model.

      • CO2isLife says:

        bdgwx, I see you ignore the model I just detailed, but I already explained that thinning air, falling temperature and precipitation alter the water vapor with altitude. I don’t think that is controversial.

        • bdgwx says:

          I’m doing the opposite of ignoring your modeling. I’m making a good faith attempt at hearing you out. That’s why I’m asking for details.

          Let’s focus on one thing at a time. Since this thread is about your temperature-wv model lets stick with topic here. But I do kindly ask that you go into more details regarding your TLT minus TLS hypothesis above if you don’t mind.

          What modulates water vapor in your? How do you know what inputs to plug into your equations for future time periods? In other words, how do you make predictions with this model?

    • barry says:

      Interesting, you could have shown the RSS model obs comparison for the globe, whicvh was the obvious choice but you chose the tropics comparison without mentioning that fact. Presumably you chose it because there was a greater discrepancy between the obs and the model.

      http://www.remss.com/research/climate/

      An honest commenter would have linked to the page source so people could check things for themselves. They then would have been able to read the comments there, which have a lot of content on the model obs comparison. It is far more neutral and illuminating than your energetic remarks. For example:

      “Why does this discrepancy exist and what does it mean? One possible explanation is an error in the fundamental physics used by the climate models. In addition to this possibility, there are at least three other plausible explanations for the warming rate differences. There are errors in the forcings used as input to the model simulations (these include forcings due to anthropogenic gases and aerosols, volcanic aerosols, solar input, and changes in ozone), errors in the satellite observations (partially addressed by the use of the uncertainty ensemble), and sequences of internal climate variability in the simulations that are difference from what occurred in the real world. We call to these four explanations “model physics errors”, “model input errors”, “observational errors”, and “different variability sequences”. They are not mutually exclusive. In fact, there is hard scientific evidence that all four of these factors contribute to the discrepancy, and that most of it can be explained without resorting to model physics errors. For a detailed discussion of all these reasons, see the post on the Skeptical Science blog by Ben Santer and Carl Mears, and the recent paper in Nature Geoscience by Santer et al.”

      Now, one doesn’t have to endorse this paragraph. But if you are going to use the work these people do to make a point, it is intellectually honest to include what they have to say about the same point, if they do. That’s what objective science does. In this case, there is also the benefit of being pointed to published work on the matter.

      By the way, the water vapour graph displays the work of applying WV retrieval from satellites and relying on the Clausius–Clapeyron relationship to scale it. The authors acknowledge that WV content is dependent on temperature, not the other way around.

      https://journals.ametsoc.org/view/journals/clim/29/10/jcli-d-15-0744.1.xml?tab_body=fulltext-display

      (Section d.)

    • Nate says:

      CO2 your comparison is unfair.

      You first compare TLT temperature to a computer climate model. It is unclear what this model is? Is it surface temperature? What CO2 growth model is used? The model is not generated from data.

      The second is comparing two data sets. One is TLT and the other is TPW. These are two quantities that are well known to be directly related to each other and ENSO.

      Why? Because, EL Nino warms the ocean and atmosphere and produces tropospheric water vapor.

      Of course these two are highly correlated!

      So the second one is not a model at all.

      Apples and oranges, and in fact FRAUD.

  89. Entropic man says:

    CO2islife, Swenson

    “Water Vapor is the Forcing Factor, the only forcing factor. ”

    “Weather doesnt need forcings (whatever they are).”

    Climatology 101

    A forcing is an external change which changes the amount of energy entering or leaving the climate system. For example, the Maunder Minimum reduced the strength of sunlight by 1W/m^2 for 50 years and cooled the climate by 0.3C.

    A feedback is an internal response to forcing.For example, increasing Arctic temperatures reduce sea ice extent and ice albedo. The result is additional energy absorbed by the sea surface and an additional increase in temperature.

    Some feedbacks amplify the effect of forcing, some reduce
    the effect.

    Solar insolation is a forcing. CO2 is a forcing. Low cloud cover is a reducing feedback. Sea ice extent is an amplifying feedback. Water vapour is an amplifying feedback.

    • Clint R says:

      E, I was wondering when you would sneak it in. You waited until the very end — ” CO2 is a forcing.”

      Nice try, but no banana. CO2 “cools”, it doesn’t “warm”. To warm the planet, you need something hotter, like Sun.

      • Entropic man says:

        Clint R

        CO2 cools, it doesnt warm. ”

        This is not really addressed to you unteachables, more to any lurkers reading this.

        CO2 does not warm or cool, it reduces the amount of energy escaping to space.

        A useful analogy is a tank of water with a tap at the top and a tap at the bottom.

        Open the upper tap and the tank starts to fill. When it is half full, open the lower tap until the water level steadies.

        Water is now flowing in from the upper tap and out through the lower tap at the same rate.The volume of water and the water level stay constant.

        A stable climate works in the same way. The upper tap represents the Sun and the incoming water represents incoming sunlight. The lower tap represents the atmosphere and the outgoing water represents radiation escaping to space. The volume of water in the tank is the amount of heat stored in the system and the water level, the temperature.

        Now close the lower tap slightly. Water now leaves the tank more slowly than it enters. As a result some of the incoming water accumulates in the tank. The volume of water increases and so does the water level.

        Increasing CO2 is analogous to slightly closing the lower tap. The extra CO2 reduces the amount of outgoing radiation. With energy leaving more slowly than it comes in, some of the incoming sunlight energy now accumulates as extra stored heat and the temperature increases.

        • Clint R says:

          “CO2 does not warm or cool, it reduces the amount of energy escaping to space.”

          “Energy escaping to space” is cooling, E.

          “The extra CO2 reduces the amount of outgoing radiation.”

          Wrong again, E. Extra CO2 means more emitters to space, meaning more outgoing radiation.

          • Bindidon says:

            Somewhere above, I read in a post:

            ” Extra CO2 means more emitters to space, meaning more outgoing radiation. ”

            *
            As usual, the same nonsense again and again and again and again and again…

            *
            THIS IS WRONG!

            More CO2 in the atmosphere (or H2O, CH4, N2O, CFC gases, … not only CO2 plays a role here)

            means that

            – more absorp-tion of IR happens in the atmosphere than if these gases were absent

            AND

            – only 50 % of the absorbed IR is reemitted up to space, the rest is reemitted back to lower atmospheric levels, from where again 50 % of these 50 % are reemitted up, and 50 % if the 50 % are reemitted down, and so on.

            Why do these strange Contrarians persist in ignoring that?

            *
            There are even strange Ignoramusses who pretend that NO2 and O2 absorb and reemit as much as do CO2 or even H2O! Incredible.

            The absorb-ptivity / reemissivity of N2 is 10^6 lower than that of CO2 / H2O, and that of O2 is 10^4 lower, and that under consideration of the respective atmospheric abundances.

            Simply look at SpectralCalc, and try to understand.

            No: SpectralCalc is NOT part of the great GHE conspiracy.
            Pity.

            J.-P. D.

          • Clint R says:

            Sorry JD, but you’re confused again.

            All CO2 molecules emit. So if X CO2 molecules emit P photons to space, 2X molecules would emit 2P molecules to space.

          • barry says:

            So 2P photons can go up, but not down?

            You idiots are amazing.

          • Clint R says:

            Trolll barry, where did I ever say photons could not be emitted down?

            You are getting to be as bad as bdgwx.

          • Nate says:

            “All CO2 molecules emit. So if X CO2 molecules emit P photons to space, 2X molecules would emit 2P molecules to space.”

            When there are more, the atmosphere becomes more opaque.

            The emissions to space from CO2 molecules can come then only from a higher altitude, where the atmosphere is no longer opaque.

          • Nate says:

            And oh, of course, at a higher altitude the temperature is lower, and then the emissions will be lower.

            The essence of the AGW effect.

  90. Broadlands says:

    We have been told that the “science is settled”. The world has accepted the dire model forecasts and has moved on to urgently finding a solution that would lower the Earth’s mean temperate to some poorly defined value that is somewhere between 14.0°C and the current value..14.82°C. Prof. Hansen has suggested that 1987’s climate is a nice place to revisit. He says that CO2 at 350 ppm is a safe value. To get there would require the technological capture and geological burial of 65 ppm of CO2. According to the CDIAC’s numbers that would mean the storage of 500 BILLION tons. Do the math on the amount of time that might take. Current CCS technology at best is only 40 MILLION tons a year.

    Arguing back and forth about the causes of a small rise in global temperatures over the last 300 years pales and becomes almost trivial. An insignificant topic for the faculty lounges.

    • Bindidon says:

      Broadlands

      I don’t appreciate this idea of geological CO2 storage.

      I would prefer the incredible amounts of money needed for that task to be invested in worldwide reforestation.

      J.-P. D.

    • The plants on our planet would prefer 1,000 ppm CO2. For optimum plant growth we need much more CO2 in the air. Not less. Optimum plant growth will support more life on our planet. Anyone who wants to limit CO2 is anti-life.

      If the increase in CO2 causes any global warming, that’s even more good news. The warming measured since 1979 (UAH) is mainly in the northern half of the Northern Hemisphere, mainly in the coldest six months of the year and mainly at night. Why would it be bad news for colder areas of our planet to have warmer winter nights?

      The answer is the past 300+ years of global warming have been 100% good news, and only a fool would claim that continued warming will be 100% bad news.

      The claim of a coming climate change crisis is political, not scientific. The people who make the claim want more political power (to fight their imaginary “coming crisis” that they invented in the 1960s). They never let a crisis go to waste. Even an imaginary climate crisis works for them, if enough people believe it.

  91. CO2isLife says:

    Water Vapor is the Forcing Factor, the only forcing factor.

    Games over Entropic Man. You can refer to as many studies, opinions, and models you want, but testing these nonsensical theories that you’ve been promoting has failed miserably. That is what this graphic from NASA proves beyond a reasonable doubt.

    NASA’s model proves your theory doesn’t hold up under scientific scrutiny. If you want to continue to defend these results, then you simply choose to live in a world a opinion, not science.

    http://images.remss.com/figures/climate/RSS_Model_TS_compare_trop30v4.png

    I’ve outlined a simple, a very very very simple model that will blow away the NASA and IPCC Model. Simply test my theory. NASA provides the data, they ignore that data, but they provide the date to make a real climate model.

    http://images.remss.com/figures/climate/temperature_and_vapor_trop20_V4.png

    Someone, please take this data over to the Econometrics Department and have them run the experiment/model that I detailed. It will have an R-Squared through the roof, and blow away anything NASA or the IPCC has created. That will prove that the experts simply weren’t looking for the answer because it is so obvious to anyone that isn’t baised.

    • barry says:

      The authors of that WV/temp graph rely on the Clausius-Clapeyron relationship to scale it. They are aware that WV content is a function of termperature, not the other way around.

      https://journals.ametsoc.org/view/journals/clim/29/10/jcli-d-15-0744.1.xml?tab_body=fulltext-display

      In fact, experts in the fields of fluid dynamics, chemistry, atmospheric physics and climate science know this relationship.

      Now, you seem to disagree, so all you have to do is work out what causes changes in humidity. Let us know when you have determined the mechanism. You will revolutionize science.

      • ren says:

        The water vapor content of the troposphere depends on the OCEAN SURFACE TEMPERATURE. What determines the surface temperature of the ocean?
        http://www.bom.gov.au/archive/oceanography/ocean_anals/IDYOC002/IDYOC002.202101.gif

        • ren says:

          The ocean’s surface temperature depends on the season, sunlight and sea currents, and even the amount of sea ice in the southern hemisphere.
          https://www.ospo.noaa.gov/data/atmosphere/radbud/swar19_prd.gif

          • CO2isLife says:

            I’m pretty sure CO2 and the very very weak 15µ LWIR will never provide the energy to warm the oceans. On the other hand, solar radiation is really easy to prove is the cause, and can be demonstrated in any college lab. What else would cause the oceans to warm? What else causes the change in temperatures due to the seasons? Simply stand outside on a very very very hot summer day and feel what happens when a cloud goes overhead. Now that is real warming radiation.

          • bdgwx says:

            CO2’s radiative force is not weak. Per Myhre 1998 and using the LBL, NBM, and BBM radiative transfer models CO2’s radiative force is approximated by 5.35 * ln(C/Ci). [https://tinyurl.com/y6bsdw82] You can obviously plug in whatever ppm values you want and see the ERF. 410 ppm is 2.0 W/m^2 relative to 280 ppm for example.

          • Clint R says:

            Wrong bdgwx. You’re still trying to use the invalid R-hideous equation.

            Why not clean up your previous messes before making more”

            Finally you used the SB law (which you think is bogus) to determine that 303K must be the right temperature now even though earlier you thought it should be 231.7K.”

            Where did I say the S/B Law was bogus?

            Where did I say 231.7K is the right temperature?

      • CO2isLife says:

        Barry, news flash, it take energy to vaporize Water. Heat is first required. So yes, there is multi-colinearity, where temperature and water vapor are functions of each other, but so is CO2. Warm water and it out gasses CO2. Simply look up Henry’s law or put a Coke Can on a burner.

        BTW, where is the Clausius-Clapeyron relationship for CO2?

        Compare the humid area to the dry areas. Both will have identical CO2, yet wildly different 24 hour high and low temperatures. Why, H20 determines the temperature of the air, not CO2. Once again, do the study. Isolate Desert Locations, Isolate Humid Locatoins, look at the frequency of new Highs and actual uptrends.

        Do the study and you will see CO2 is irrelevant.

        That study I outlined will take 10 minutes for an Economist. Go visit one. They will teach you how to build a real model.

        • bdgwx says:

          CO2isLife said: BTW, where is the Clausius-Clapeyron relationship for CO2?

          OMG…CO2 is a non-condensing gas!

          CO2isLife said: H20 determines the temperature of the air, not CO2.

          First…H2O is not the only thing that modulates daily highs and lows.

          Second…none of us think CO2 is a significant factor in the daily variability of temperature.

          • CO2isLife says:

            bdgwx, OK, CO2 isn’t a condensation gas, so what? How does that change anything? CO2 is 1/2500 of the atmosphere, H2O can be 4%. Increase or decrease CO2 by 100 and that fraction doesn’t change much. Can 1 out of every 2500 molecules really alter the temperature of the other 2499? CO2 may not condensate, but just look at the CO2 chart, it does ebb and flow on an annual basis as Winter turns to Summer. The effect is to “condense” CO2 in the form of Photosynthesis. That variability is what matters to a model.

            Once again, we are dealing with a model. Yes, H2O is not the only, but it is by far the most significant. That is what is important to a model.

            Daily, weekly or over 140 years. Look at a desert location. CO2 caused no warming. Once again, put the concepts I’ve detailed into a model and you will see it will have a very very vyer high R-Squared. Build a CO2 centric model and you get the garbage results like the experts at NASA proudly publish on their website. Are they deliberately trying to destroy their scientific credentials?

          • bdgwx says:

            It matters because atmospheric temperature does not constrain CO2 in the same way it does for H2O.

            Also, none of us think increasing CO2 results in homogenous warming such that all locations on Earth warm at the same rate or to even warm at all. In fact, we even expect some locations to cool. We also don’t think CO2 is a significant factor in the daily, monthly, and even yearly variation at single sites, regionally, or even globally. If there is something that does not makes sense ask questions.

          • Entropic man says:

            Omigod, what a question.

            The concentration of CO2 in the atmosphere is independent of temperature. Within normal climate limits it remains a gas and it’s concentration does not change over short timescales.

            The concentration of H2O changes with temperature. As air cools the amount of H2O it can carry decreases. When air contains more H2O than it can carry, the excess condenses into liquid. You see this when clouds form. Rising air cools. When it reaches the altitude at which the excess water condenses, droplets form a cloud.

            Because it condenses, H2O concentration depends on temperature.

            Outside my Northern Ireland window is a frosty evening. As the air temperature dropped close to 0C the H2O condensed as frost. All that is keeping my garden above 255K tonight is the CO2 greenhouse effect.

          • CO2isLife says:

            bdgwx Says:

            It matters because atmospheric temperature does not constrain CO2 in the same way it does for H2O.

            Also, none of us think increasing CO2 results in homogenous warming such that all locations on Earth warm at the same rate or to even warm at all. In fact, we even expect some locations to cool. We also don’t think CO2 is a significant factor in the daily, monthly, and even yearly variation at single sites, regionally, or even globally. If there is something that does not makes sense ask questions.

            CO2isLife Says: This is wrong in so many many ways:
            1) CO2 is 400 ppm, and a 1, 10, 100 Δppm changes W/M^2 very very very little.
            2) H20 can be 0.00 ppm to 4 Parts per 100. The change in W/M^2 relative to CO2 is astronomical to the factor of 100s, if not 1,000s.
            3) Simply compare a desert with 0.00 ppm H20 and 400 ppm CO2 to a rain forest with 4 parts per 100 H20 and 410 CO2. The ΔW/M^2 is enormous, yet no catastrophic warming. From those differentials you can figure out the ΔT for the difference in ΔW/M^2. Are there any read with a Rain Forest near a desert that we can test that theory?
            4) The atmosphere is not like a battery, radiation travels at the speed of light. Once your chart drops below a previous low, it resets as far as any contribution that could have been caused by CO2.
            5) The physics of the CO2 molecule are constant. If anything the effect would cause a parallel shift in the temperatures because the W/M^2 is evenly applied across the globe. Every spot on earth, even antarctics emits 15µ LWIR.
            6) Simply download and average out every station with a BI of 10 or less and is a desert. You will see there is no warming with the increase in CO2 over the long term. That is what the data will show you

            Lastly, if CO2 does cause warming, why can I find so many desert locations that show no warming? How is that possible?

          • bdgwx says:

            So you are challenging the fact that H2O is a condensing gas whereas CO2 is non-condensing?

          • Clint R says:

            bdgwx, how much it cost you to learn to troll?

          • Nate says:

            https://tinyurl.com/y4svg4hw

            State of Arizona. Lots of desert. Lots of warming.

            https://tinyurl.com/y4zrncfy

            State of New Mexico. Lots of desert. Lots of warming.

    • bdgwx says:

      CO2isLife said: Water Vapor is the Forcing Factor, the only forcing factor.

      So what is modulating water vapor?

      CO2isLife said: NASAs model proves your theory doesnt hold up under scientific scrutiny.

      That’s not NASA’s model. Do you even know what model is being represented in the yellow uncertainty envelope?

      CO2isLife said: Ive outlined a simple, a very very very simple model that will blow away the NASA and IPCC Model.

      It’s not the IPCC’s model either.

      CO2isLife said: It will have an R-Squared through the roof

      We already know that water vapor and temperature are highly correlated. Everybody knows this. That does not mean that water vapor is causing long term changes in temperature. Correlation != Causation

      • CO2isLife says:

        So what is modulating water vapor?

        As I pointed out, the Greening of the Earth, most solar radiation reaching the oceans, fewer clouds, etc etc.

        That’s not NASA’s model. Do you even know what model is being represented in the yellow uncertainty envelope?

        It is isn’t NASA’s model, why do they place it on their website?

        This details the fraud. Do you really want to defend NASA doing this?
        Climate Mafia At Work
        https://realclimatescience.com/2018/04/climate-mafia-at-work/

        We already know that water vapor and temperature are highly correlated. Everybody knows this. That does not mean that water vapor is causing long term changes in temperature. Correlation != Causation

        1) Prove it, where is your long-term data on water vapor? What I’ve provided with the Greening of the Earth, Fewer Clouds and warmer oceans seems to fit pretty well
        2) H20 is the most powerful GHG, correlation does prove causation in that case, just study the physics or walk into a steam Room. The causation has been known since Ancient Roman Times.
        3) If the correlation isn’t causation, you are implying that it is a coincidence. If that is the case, you don’t even have correlation with CO2. The NASA Model proves that, the Desert Stations Prove that, my model at least has correlation and the physics that support causation, CO2 doesn’t even have that,

        • bdgwx says:

          Great. So we’ve decomposed your one variable model T = M(W) into 3 variable model T = M(G, S, C).

          And what is causing greening (G), more solar radiation reaching the surface (S), and less clouds (C)?

          How do you know what inputs to use for G, S, and C for future time periods? How do you make predictions with this model?

          • CO2isLife says:

            And what is causing greening (G), more solar radiation reaching the surface (S), and less clouds (C)?

            Uhhh? Fire Suppression? Our forests are far more dense than healthy forests because of fire prevention. Just look at California.

          • bdgwx says:

            So fire prevention is the root cause of global warming?

          • CO2isLife says:

            So fire prevention is the root cause of global warming?

            Global warming is natural, so is cooling. Simply look at Al Gore’s Ice Core Data, and the Greenland Ice Core. Temperatures go up and then go down. You don’t have to have a “cause.”

            Has the cloud cover been decreasing? Yep.
            Would that warm the oceans? Yep.
            Would more trees increase water vapor? Yep.
            Is more solar radiation reaching earth? Yep

            You have an infinite number of variables that could cause the warming, and all you look at is CO2. Something that deserts prove doesn’t result in warming. When the stock market goes higher, there can be many factors that are driving it, just like the climate.

          • bdgwx says:

            So sometimes there is no root cause for global temperature changes?

          • Swenson says:

            b,

            If you say so.

            However, in my experience, thermometers react to changes in that wonderful thing we call heat.

            If you disagree, you might have to appeal to climatological redefinition.

            What do you think thermometers are designed to do?

  92. Bindidon says:

    I love claims a la

    ” The plants on our planet would prefer 1,000 ppm CO2. For optimum plant growth we need much more CO2 in the air. Not less. Optimum plant growth will support more life on our planet. Anyone who wants to limit CO2 is anti-life. ”

    which are pretended everywhere but were never proved.

    I think it would not be bad to first scientifically contradict a paper like this one:

    Leaf Trait Acclimation Amplifies Simulated Climate Warming in Response to Elevated Carbon Dioxide (2018)

    https://agupubs.onlinelibrary.wiley.com/doi/full/10.1029/2018GB005883

    Who manages to get the contradiction will then become credible.

    J.-P. D.

    • CO2isLife says:

      Bindidon: The plants on our planet would prefer 1,000 ppm CO2. For optimum plant growth we need much more CO2 in the air. Not less. Optimum plant growth will support more life on our planet. Anyone who wants to limit CO2 is anti-life.

      which are pretended everywhere but were never proved.

      Really? Go visit any greenhouse.
      https://youtu.be/xgLGCH9ErVE

      • bobdroege says:

        Nice video,

        I only watched the first first minute and a half and he made two points about CO2 and plants and greenhouses.

        One, the problem is not that high CO2 is better, the problem is that in a greenhouse the plants will use all the CO2 available causing the CO2 to drop, reducing growth.

        And if you were listening, he said sugar is plant food, not CO2.

        I’ll go watch the rest.

        • Clint R says:

          bob, you’re so desperate.

          He clearly indicated more CO2 was better. He even mentioned 1200 ppm, 3 times atmosphere.

          And the plant makes sugars and other hydrocarbons from CO2.

          • bobdroege says:

            That’s to keep it from dropping below 300 where it will retard growth, as the plants can suck it all out of the greenhouse.

            “And the plant makes sugars and other hydrocarbons from CO2.”

            That gets a no-shit sherlock!

        • CO2isLife says:

          What if higher CO2 concentrations are actually good for plant growth?
          https://youtu.be/jODIYw_5A40

    • Clint R says:

      Bindidon found another “paper” he can’t understand. From the abstract:

      (Bold is my emphasis.)

      “We show that changes in plant traits could have large‐scale climate impacts, including higher temperatures and relative decreases in plant photosynthesis which have not been previously accounted for. Our findings suggest an urgent need for observations of how plant traits will respond to future environmental conditions as well as a need for a better understanding of the underlying mechanisms so that they can be included in climate projections.”

      No science, just agenda. More of the “urgency” barry and bdgwx deny.

      And the authoress is a graduate student in biology!

      No understand of Earth’s energy system.

    • Swenson says:

      Binny,

      From USDA –

      * Elevating Carbon Dioxide in a Commercial Greenhouse Reduced Overall Fuel Carbon Consumption and Production Cost When Used in Combination with Cool Temperatures for Lettuce Production *

      Worth a read for some insight on how good the sealing against air infiltration is, useful models, growth response to increased CO2, and suchlike.

      Actual results. Reality. Facts.

      You might get something out of it anyway.

  93. I am thinking this decade could be the turning point in the global temperature trend and it could happen in a flash.

    • bdgwx says:

      How do you suppose that will happen with the EEI at +0.87 +/ 0.12 W/m^2?

      https://essd.copernicus.org/articles/12/2013/2020/essd-12-2013-2020.pdf

      • Clint R says:

        bdgwx, that “EEI” is as phony as you are. You’re just another troll that won’t clean up their own mess:

        “Finally you used the SB law (which you think is bogus) to determine that 303K must be the right temperature now even though earlier you thought it should be 231.7K.

        Where did I say the S/B Law was bogus?

        Where did I say 231.7K is the right temperature?

    • I predict the climate will get warmer, unless it gets colder.
      The first thing I learned in 1997, after I got interested in climate science … was to ignore climate predictions. I would be happier if global warming continues, but then I live in relatively cold Michigan, while people living in southern Florida, which feels like a steam room on many summer days, may not agree.

      • Gordon Robertson says:

        richard…”I would be happier if global warming continues, but then I live in relatively cold Michigan…”

        Maybe we can arrange for it to get warmer in winter and a bit cooler in summer.

  94. Bindidon says:

    Somewhere above, I read in a post, for the umpteenth time:

    Extra CO2 means more emitters to space, meaning more outgoing radiation.

    *
    As usual, the same nonsense again and again and again and again and again. Will that ever end?

    *
    THIS IS WRONG!

    More CO2 in the atmosphere (or H2O, CH4, N2O, CFC gases, not only CO2 plays a role here)

    means that

    more absorp-tion of IR happens in the atmosphere than if these gases were absent

    AND

    only 50 % of the absorbed IR is reemitted up to space, the rest is reemitted back to lower atmospheric levels, from where again 50 % of these 50 % are reemitted up, and 50 % if the 50 % are reemitted down, and so on.

    Why do these strange Contrarians persist in ignoring that?

    *
    There are even strange Ignoramusses who pretend that NO2 and O2 absorb and reemit as much as do CO2 or even H2O! Incredible.

    The absorb-ptivity / reemissivity of N2 is 10^6 lower than that of CO2 / H2O, and that of O2 is 10^4 lower, and that under consideration of the respective atmospheric abundances.

    Simply look at SpectralCalc, and try to understand.

    No: SpectralCalc is NOT part of the great GHE conspiracy.
    Pity.

    J.-P. D.

    • Clint R says:

      JD, if X molecules of CO2 emit P photons to space, then 2X molecules of CO2 emit 2P photons to space.

      It’s hard to pervert reality, huh?

    • bdgwx says:

      Exactly. All one has to do is open a web browser and go look at the various space based radiometer products that are widely disseminated to see that GHGs lower the amount of radiation escaping to space. For example, look at G-O-E-S-16 channel 10 over the desert southwest of the United States today. A shortwave is moving through the area with higher WV on the leading edge. This extra water vapor to the west is eclipsing the surface IR while to the east the radiometer is seeing a much a higher IR flux even though the surface temperature is about the same.

      • Clint R says:

        If X molecules of CO2 emit P photons to space, then 2X molecules of CO2 emit 2P photons to space.

        It’s hard to pervert reality, but bdgwx tries.

        • Entropic man says:

          “If X molecules of CO2 emit P photons to space, then 2X molecules of CO2 emit 2P photons to space. ”

          If X molecules of CO2 emit P photons to space it is because at the tropopause the X CO2 molecules have absorbed and reemitted 2P photons. P are emitted to space and another P downwards.

          If 2P photons are reaching the tropopause from below, having 2X instead of X CO2 molecules will make no difference, because the number of emitted photons depends on the number of photons rising to the tropopause, not on the number of CO2 molecules available to process them.

          • Clint R says:

            The effort the cult will go to to pervert reality is amazing. And amusing.

          • Swenson says:

            EM,

            Your simplistic assumption that CO2 can only absorb and emit photons of specific wavelengths is naive at best. Given sufficient optical depth, CO2 will absorb every photon passing through it. The only truly transparent medium is a vacuum. So CO2 can, and will, absorb photons of all energies.

            You are probably aware that the average velocity of molecules in a quantity of CO2 gas is proportional to temperature. Expose CO2 at 20 C to the photons emitted by an iron rod at 100 C surrounded by the gas. You will be able to measure a thermal gradient within the CO2 from 100 C at the interface with the rod, to 20 C at the extremity of the gas volume.

            All of this happens as photons interact with electrons. A CO2 molecule may interact with a high energy photon, some of the momentum going to increase the velocity of the molecule, and an electron emitting a photon of arbitrarily lesser energy.

            Check it out yourself, if you wish. Photons have no rest mass, but they do have momentum, which can be transferred, either wholly or partly, to the system comprising an atom or molecule. Hence, increase in average velocity when gas is heated by absorbing radiation.

            Not a full or complete explanation, I have paraphrased some terminology, but close enough for Government. If you beg to differ, please quote my words, and state your reasons.

          • Nate says:

            “Given sufficient optical depth, CO2 will absorb every photon passing through it. The only truly transparent medium is a vacuum. So CO2 can, and will, absorb photons of all energies.”

            Well lets see..

            Even at 1,000,000 ppm, ie atmospheric pressure, CO2 is still transparent to visible light photons.

      • barry says:

        Also emits 2P photons to the ground. What do you think happens when the ground receives 2p more photons from 2X CO2?

        • Clint R says:

          So 2P photons can go down, but not up?

          You idiots are amazing.

        • barry says:

          Apparently trolls don’t know the meaning of the word “also.”

          • Clint R says:

            Okay barry, I’ll use it in a sentence to help you understand.

            Other trolls are trying to pervert reality, so barry also joins in.

            Glad to help.

        • Gordon Robertson says:

          barry…”Also emits 2P photons to the ground. What do you think happens when the ground receives 2p more photons from 2X CO2?”

          Nothing. The atmosphere is either in thermal equilibrium with the surface or cooler. Heat cannot be transferred at thermal equilibrium and the 2nd law tells us heat cannot be transferred between a cooler gas and a hotter surface.

          • barry says:

            Energy is being transferred from the atmosphere to the surface at all times (and from surface to atmosphere). This does not break the 2nd Law.

            If the amount of energy the surface receives increases, it must increase its rate of energy output to match. There is only one way it can do this.

            It heats up.

            At all times in this, the flow of heat is from warmer surface to cooler atmosphere. The 2nd Law is preserved. Energy is conserved. No laws of physics are broken.

          • Clint R says:

            Several mistakes there, berry.

            “Energy is being transferred from the atmosphere to the surface at all times (and from surface to atmosphere).”

            1) You neglected to include that energy is also transferred to space from the atmosphere.

            2) Just because photons are emitted to the surface, that does not mean the photons will be absorbed and thermalized.

            3) Even if low energy photons are absorbed, they do not raise the temperature of a surface with average higher energy.

            “If the amount of energy the surface receives increases, it must increase its rate of energy output to match. There is only one way it can do this. It heats up.”

            4) You are confusing “receive” with “absorb and thermalize”. Just because a surface “receives” emitted photons it does not automatically increase in temperature. That’s why a second ice cube can’t increase the temperature above that of one ice cube.

          • barry says:

            No, photons are absorbed by the surface, whether solar or atmospheric in origin. The temperature of the surface has zero to do with whether a photon gets absorbed: only the molecular structure of the surface material and its albedo determine what radiative enrgy is absorbed.

            You believe that energy from cooler objects can’t be absorbed by warmer ones. This is your fundamental misunderstanding of the physics here. It is also where your denial of physics is most obvious.

          • Dr Roys Emergency Moderation Team says:

            “You believe that energy from cooler objects can’t be absorbed by warmer ones.”

            Well, that’s not what he said, is it? See 3).

    • Bindidon says:

      ClintR

      ” Its hard to pervert reality, huh? ”

      Yes, but you manage to do that.

      If 10 CO2 or H2O molecules intercept a photon, only 5 photons move up to space.

      If 20 CO2 or H2O molecules intercept a photon, only 10 photons move up to space.

      And so on, and so on.

      Moreover, you were explained that, due to the temperature gradient, reemission at higher altitudes below 50 km means to release much less energy to space than does the direct emisssion from the surface.

      But all that you deliberately ignore, like do Robertson, Swenson and a few others.

      Feel free to further Cultivate your denialism, ClintR… No problem for me: I know that I never will convince denialists.

      J.-P. D.

      • Clint R says:

        JD stumbles into reality (unknowingly).

        10 molecules — 5 photons to space.
        20 molecules — 10 photons to space.

        • Eben says:

          When Bindidope went to skool he was still taught the Sun was a giant lump of burning coal . It should be no surprise he doesn’t understand basic fizzix

          • Bindidon says:

            Eben

            If there is something you do understand even far less than I do, then it is: basic fizzix, yeah.

            All you can do is to publish polemic, dumb trash like ClintR…

            Does that matter? No.

            J.-P. D.

          • Clint R says:

            Bin thinks about me all the time.

      • Swenson says:

        Binny,

        You dont seem to understand that photons may not interact with matter they encounter.

        A couple or three minor examples.

        Visible light photons pass through transparent glass quite nicely.

        Germanium is transparent to infrared photons, but opaque to visible light photons. Why, do you think?

        Some radio wavelength photons are highly attenuated by the atmosphere, some are not, and some are refracted and reflected to various degrees – bouncing around the world!

        You might need to consider the temperature of the emitter and receiver as well. 300 W/m2 is not a measure of temperature. Emitted by ice, you will freeze. Emitted by a highly polished container of boiling water, you will boil.

        Tell me how frost forms on the ground. It seems to be emitting more energy than it is absorbing. Not enough CO2 in the atmosphere?

  95. Broadlands says:

    “Why do these strange Contrarians persist in ignoring that?’

    Why are the climate change alarmists trying to make a fractional rise in the global mean temperature anomaly (at two decimal place precision) such a big deal? They can’t do anything about it anyhow

    • Bindidon says:

      Broadlands

      Is Roy Spencer a climate change alarmist?
      Are you serious?

      J.-P. D.

      • Clint R says:

        Oh look, an attempted leading question from troll Bindidon.

        (This La Niña has really got them nervous.)

        • Swenson says:

          C,

          You have to hand it him. He keeps trying.

          Einstein believed insanity was doing the same thing over and over, and expecting a different outcome.

          Binny is short on fact. Has to try something, I suppose.

          Good luck to him!

  96. Rob Mitchell says:

    Hey Bindidon, perhaps you should read a quote from Dr. Roy Spencer from his global warming page.

    “Climate change — it happens, with or without our help.”

  97. CO2isLife says:

    Another simple way to debunk AGW.

    CO2 is evenly concentrated across the globe at 410 PPM.
    The W/M^2 concentration of CO2 is constant at any instance at any location.

    Removing all other Greenhouse gases, the W/m^2 of changing CO2 from 270 to 410 ppm CO2, is 2.83 W/M^2. Tropical Atmosphere Ground temp of 299.7K/80F/27C.

    Now, let’s go look at what happens when we place a desert next to a rain forest.

    Desert = the above 2.83 W/M^2, no water vapor or other GHG
    Rain Forest (Water Vapor Scale 2.0, water vapor 37.9mb) = 116.05 W/M^2

    There is a 40x difference in W/M^2 between a desert and rain forest. Do rainforests get 40x as hot as deserts? Nope. How can one location be exposed to 40x the W/M^2 and the temperatures be essentially the same? I bet you could find plenty of deserts near rainforest and you won’t find the rainforests being substantially warmer than the deserts, but they will be at night. Why? Because incoming solar radiation is what warms the earth and atmosphere above it, not the outgoing W/M^2. Prove me wrong. Show me rain forests substantially warmer than desert with similar lat and long. If 40x the W/M^2 can’t cause a significant temperature difference than CO2 is really meaningless in terms of ability to change temperature.

    • ren says:

      Water vapor reduces the vertical temperature gradient. This is of great importance at night as it slows down heat loss from the surface. This allows the sun to warm the surface faster the next day. In mid-latitudes, we see it in winter. High humidity is associated with greater cloudiness. Below the clouds, the water vapor content must be greater than in dry air.

    • CO2isLife says:

      bdgwx makes a big deal about the Clausius-Clapeyron relationship for CO2. The fact that CO2 isn’t a condensable gas can help identify the contribution of CO2. Just look at a rain forest at night, it will remain relatively close to its daytime temperatures. Look at a desert, temperatures fall dramatically. Why, only CO2 remains after the H2O has condensed out of the atmosphere. H20 absorbs across the IR spectrum, contributes far more W/M^2 that actually contributes to maintaining the temperature. CO2 won’t. Also, I bet that the decrease in temperature in a humid desert will be slow until the H2O condenses out, and then temperatures will plummet.

      Anyway, you can calculate out the differences in the W/M^2 between the deserts and rain forests, and the fall in temperatures, to identify the contribution of CO2 to the GHG effect. I’m sure it will be very low, and that is why desert stations show no warming over the past 140 years even with a large increase in CO2.

      All the evidence is there, people just seem to choose to ignore it.

      • Clint R says:

        What you are seeing CO2isLife, is the “Desperation of the Idiots”. They are willing to throw anything at you to stop your efforts. “Clausius-Clapeyron relationship” is just a distraction. When that doesn’t work, they will try something else. Then, the insults and mis-representations begin.

        What you are doing benefits people that want to learn. You will never convince people like bdgwx, barry, bindidion, Entropic, Norman, Nate, and the rest.

      • Nate says:

        “You will never convince…”

        True, not with the fake physics, flimsy claims, flawed logic, lack of evidence that you guys serve up.

        But even worse, when we rebut your false claims, you have no answers.

        • Swenson says:

          N,

          So you are claiming you have a testable GHE hypothesis, derived from a scientific description of the GHE, are you?

          Maybe you could cut and paste both here, if it is not too much trouble.

          • bobdroege says:

            We have gone through this before Swenson.

            Add CO2 to the atmosphere, monitor the Keeling curve and compare the results to the graph at the top of this page.

          • Nate says:

            “Maybe you could cut and paste both here”

            Someone asked someone else to show a link recently, and here was how you responded:

            “You might have heard of a wondrous thing called the internet. Use it.

            Of course, its not of much use for whining crybabies who demand to be spoon fed.

            Or slimy trolls too lazy to think for themselves.”

            I think in this instance, it is apt.

  98. angech says:

    Stage 2 the other results to come in.
    Every year one site gets a higher world temperature than the others.
    GISTEMP this year?
    Anyone else close?
    I hope they are e mailing .
    I hope someone cares.
    Being so close, a bit like the election an extra uptick or down tick here and there becomes vitally important.
    No admission of failure yet so there must be hope.
    Perhaps a special announcement mid January?

  99. angech says:

    Trying again. some messages get through, some do not.

    • Bindidon says:

      angech

      Don’t forget to always avoid writing ‘d’ immediately followed by ‘c’.

      The first example being the links to Roy Spencer’s anomaly files, because it contains ‘ncd-c’. He can post the link, but we can’t.

      In such cases, I put the links into
      https://tinyurl.com/

      and post the result instead.

      Absorp-tion without the hyphen leads to your comment getting refused as well.

      If you write a long comment and it gets refused, go back one step in the browser and move to the thread’s end. Your comment is there.

      J.-P. D.

      • angech says:

        Bindidon If you write a long comment and it gets refused, go back one step in the browser and move to the thread’s end. Your comment is there.
        Fantastic
        Thanks for the help.
        Still on the wrong side, me, but appreciated

        • Bindidon says:

          angech

          ” … wrong side, me… ”

          Which wrong side ???

          All of us we have a good feeling for our side looking good.

          J.-P. D.

  100. Gordon Robertson says:

    Mulling over the debate on water vapour. I was just out for a walk at night with temps hovering a few degrees above freezing and the air laden with WV to the point it is condensing heavily on car windows and bodies. I live on the west (wet) coast of Canada in a rain-forest environment in the Fraser River delta. It’s always damp here in winter.

    Anyway, I find that WV is not a warming factor in such a winter environment, in fact, it can make things uncomfortably cold. I have worked night shift in Edmonton, outside when the temps were approaching -25C. That’s darned cold but -35C is brutal in comparison. No one is allowed to work outside in those temperatures.

    I would take those -25C conditions anytime over conditions I experienced working night shift outside at the Vancouver Airport with temps near freezing and the air full of water vapour. I don’t know what it is but I simply cannot get warm in those conditions, no matter how many layers of clothing I am wearing.

    On the night in question, I was wearing several layers of clothes, a big winter jacket, and rain gear with gumboots to stave off a light wind. The wind was not significant as far as wind-chill was concerned, it was the dampness that got to me.

    Maybe my internal thermostat is a bit out of whack but damp air in the winter always gets to me. Oddly enough, rain doesn’t. I can go for a walk in the rain and be fine, it’s the finer WV that chills me. Then again, usually when it rains, the temperature rises above 5C and sometimes closer to 10C in winter.

    • joe says:

      Gordon,
      There is that ‘damp cold’ that many people experience, yes.
      But in the context of what’s being discussed here, i.e. global temperature, etc. water vapour actually has a warming effect.
      There is a difference between what we feel and what the actual temperature is.

  101. ren says:

    Latest Southern Oscillation Index values
    SOI values for 7 Jan, 2021
    Average SOI for last 30 days 19.23
    Average SOI for last 90 days 10.68
    Daily contribution to SOI calculation 25.58

  102. ren says:

    In Madrid, snow is falling during the day in temperature of 0 C.
    https://i.ibb.co/TvS2srL/Screenshot-1.png

  103. Darwin Wyatt says:

    Barry,

    Thank you for the interesting facts to consider. I think I recall an ocean hotspot mentioned here a few times. Conceivably, if they alternate in timing and intensity like Yellowstone’s geysers. couldn’t vast underwater caverns that fill and empty similarly, nudge the pacific cycle by warming the abyss making it easier for the sun to warm ocean surface temps enough to increase evaporation and increase clouds and albedo, triggering the enso cycle? I think you would agree enso not from aco2 since there was undoutedly an enso before aco2 could have ever been a factor?

    • barry says:

      ENSO cycles up and down over periods of several years, part of the interannual variability in temperature records of the globe and Southern regions.

      What do you think ENSO is doing instead of CO2?

  104. CO2isLife says:

    Another simple experiment to isolate the impact of CO2 on temperatures. Cornfields will have a lower CO2 ppm than the normal atmosphere. It would be very easy to measure the Temperatures 1 foot off the ground in an enclosed cornfield and compare that temperature to the ground 1 foot off the ground of bare topsoil. Both would be enclosed, both would be sheltered from incoming radiation, both would have identical atmospheric temperatures around and above the corn. The only difference is that the Corn produced a natural gradient in the CO2. The cornfield has less CO2 near the surface than the top soil would.

    Corn Breaths in and out CO2, during the day it can reduce the CO2 by 60 or more PPM and then it exhails at night and can add 60 of so ppm to the CO2. That is a natural gradient and it should alter the temperature is CO2 does cause warming. Anyone test that? I doubt it. Why would you? It would debunk AGW.
    https://digitalcommons.unl.edu/cgi/viewcontent.cgi?article=1255&context=usdaarsfacpub

    Current mean global atmospheric CO2 concentrations varied between 360 and 370 parts per million
    (ppm) (Kasting 1993; Berner 1997). Daily ambient concentrations of CO2 in the WCW during the growing
    season were found to be strongly diurnal with pre dawn
    values of over 500 ppm to midday values of around 300
    ppm or less.

    • CO2isLife says:

      Read that above quote. Diuran variation of 500 to 300 ppm, a 200 ppm swing in 24 hours. CO2 was 270 Pre-Industrial and 410 now, a difference of 140 ppm. A cornfield offers over 200 years of CO2 variation in a single day. Do you see wild swings in temperature in a cornfield? Do you see catastrophic warming in a cornfield? Does temperature gradually increase throughout the night as CO2 increases to 500 ppm? My bet is absolutely not. Does CO2 fall relative to the rest of the atmosphere when CO2 falls throughout the day? My bet absolutely not. Has anyone run these obvious experiments? Absolutely not. No one is baking or freezing in cornfields. The very fact that CO2 can easily survive the wild CO2 driven temperature changes pretty much proves CO2 won’t end life, it simply supports it. Once again, prove me wrong. Do the experiment.

    • barry says:

      It’s great that you’re catching up wit the science.

      Yes, local CO2 concentrations can swing volubly over daily periods (ENSO also has an impact over months, by affecting vegetation). It’
      s also well known that industrial areas and the wind side of volcanoes can exhibit daily and hourly changes in CO2 concentration. Global average CO2 has a biannual cycle, owing to NH vegetation life cycle.

      You are becoming more acquainted with short-term variability, but you are still a long way from understanding CO2 and climate, which, to beat a point to death, is a long-term phenomenon, as in multidecadal.

      Your argument boils down to this: CO2 isn’t responsible for weather change, so it can’t be responsible for climate change.

      Keep learning.

      • Swenson says:

        b,

        You obviously refuse to accept that climate is the average of weather.

        What is your definition of climate?

      • barry says:

        Climate is the average of weather over various periods.

        Seasons are a good example.

        CO2isLife would argue that because you can get hot and cold days in both Summer and Winter, that the seasons don’t really happen. How can Summer be real when cold days exist in Summer?

        His problem is mistaking climate for weather.

        Your problem is that you are a stupid troll.

  105. Bindidon says:

    I say it once more: this discussion about CO2, driven on this blog by people lacking any real, substantial knowledge about it, is BORING.

    These endless student-level trials to prove CO2’s harmlessness on the base of its surface behavior, are even more BORING.

    I therefore urge these pseudoscientists once again to look into the effects of CO2 above the tropopause.

    J.-P. D.

    • ren says:

      After production in the upper atmosphere, the carbon-14 atoms react rapidly to form mostly (about 93%) 14CO (carbon monoxide), which subsequently oxidizes at a slower rate to form 14CO2, radioactive carbon dioxide. The gas mixes rapidly and becomes evenly distributed throughout the atmosphere (the mixing timescale in the order of weeks). Carbon dioxide also dissolves in water and thus permeates the oceans, but at a slower rate. The atmospheric half-life for removal of 14CO2 has been estimated to be roughly 12 to 16 years in the northern hemisphere. The transfer between the ocean shallow layer and the large reservoir of bicarbonates in the ocean depths occurs at a limited rate. In 2009 the activity of 14C was 238 Bq per kg carbon of fresh terrestrial biomatter, close to the values before atmospheric nuclear testing (226 Bq/kg C; 1950).
      https://en.wikipedia.org/wiki/Carbon-14

      • ren says:

        The highest rate of carbon-14 production takes place at altitudes of 9 to 15 km (30,000 to 49,000 ft) and at high geomagnetic latitudes.
        https://cosmicrays.oulu.fi/webform/monitor.gif

      • Bindidon says:

        ren

        You are half a light year away from the problems.

        C’mon, Ireneusz! Be courageous, and start reading:

        W artykule autorzy pokazują prostym rozumowaniem, że pomimo nasycenia absorpcji promieniowania pod-czerwonego reemitowanego przez planetę przez cząsteczki gazów cieplarnianych (GHG), ten efekt cieplarniany nadal narasta (wzrost temperatura powierzchni Ziemi), gdy stężenie tych gazów cieplarnianych wzrasta (tak jest w przypadku CO2 w obecnych warunkach). Głównym mechanizmem działania jest ujemny pionowy gradient temperatur od dołu do góry atmosfery, którym rządzą tam adiabatyczna wymiana konwekcyjna (tj. Bez wymiany ciepła z otaczającym powietrzem, czas konwekcji jest znacznie krótszy niż czas przewodzenia ciepła).

        And go on with the rest (forget all references to IPCC, and concentrate on what really matters):

        https://www.centrale-energie.fr/spip/spip.php?article151

        J.-P. D.

    • CO2isLife says:

      Bindidion, it is boring to you because the arguments that are being made are easy ways for any individual seeking the truth to debunk the AGW theory. Last I looked, no trees grow in the tropopause, no glaciers exist in the tropopause, not people or animals live in the tropopause, and no coral reefs or fish exist in the tropopause.

      Given that at that altitude the GHG effect most likely does more to cool that warm the atmosphere, why are you so concerned with it? Remember CO2 used to be 7,000 to the tropopause most likely used to be even lower, and life thrived.

      BTW, just curious, how would a cooling tropopause cause warming at the surface? Remember the conservation of energy, and all photons eventually exist in the atmosphere.

      BTW, how long does it take a photon to reach outer space after being emitted from the earth? What is the lag time or delay?

      • Bindidon says:

        Hi CO2 baby

        ” Last I looked, no trees grow in the tropopause, no glaciers exist in the tropopause, not people or animals live in the tropopause, and no coral reefs or fish exist in the tropopause. ”

        Who did ever tell you that CO2’s effect happens at the level where trees, glaciers, animals, coral reefs are present?

        This is inimaginably dumb.

        You are still at the two zero levels of

        – Angström’s assistent Koch and his steel pipe filled with CO2;

        – R. G. Wood explaining himself in 1.5 sheet of paper what he all did wrong, ending with ‘In fact, I did not spend much time on examining the stuff’ or so;

        – the mental perpetuum mobile of misunderstanding backradiation (regardless whether coming from CO2 or… H2O).

        Great.
        *
        I know you’ll discredit all that a priori like do all Pseudoskeptics, but I tell you: try reading

        https://ui.adsabs.harvard.edu/abs/2016AGUFMED21A0767H/abstract

        and the French paper I gave ren a link to:

        https://www.centrale-energie.fr/spip/spip.php?article151

        using Google Translator.

        *
        Keep going strong. Bite your way through. I know you’ll get it!

        J.-P. D.

        • Clint R says:

          Bindidon whines that he is bored, but the reality is he’s frustrated. He doesn’t understand the science involved and just resorts to looking for links he can’t understand.

          Here, he stumbled onto some nonsense by non other than J. Halpern! Halpern is the idiot that brought us the “blue-green plates” nonsense, which as just a remake of the “steel greenhouse” nonsense. That’s where they end up with Earth’s surface temperature of 303K!!!

          They didn’t realize that would mean CO2 is cooling the planet by 15K, since actual surface is 288K.

          Poor Bindidon. He’s frustrated again.

          • bobdroege says:

            You poor deluded soul, Halpern replaces the earth with a plate, the Sun with a heat source, and another plate to model the green house effect.

            He didn’t come up with the earth at 303 K.

            You are desperate.

            And you don’t understand physics, thermodynamics or the greenhouse effect.

          • Clint R says:

            It’s the same nonsense as the “steel greenhouse”. Just another attempted perversion of physics.

          • Nate says:

            If you think that the ‘steel greenhouse’ is intended to be a real model of the Earth, you’re stupid, and intentionally so.

            So if you 303 K is ‘wrong’ for the Earth, thats true, but a strawman, because Earth is not a steel greenhouse.

          • Clint R says:

            Wrong again, Nate.

            The “steel greenhouse” was intended to model the bogus GHE. So was the “blue-green plates” nonsense.

            Both were based on the perversion of the S/B equation.

            So yeah, throw away all the nonsense. It’s a New Year. You don’t have to always be an idiot troll.

        • Gordon Robertson says:

          binny…” the mental perpetuum mobile of misunderstanding backradiation (regardless whether coming from CO2 or H2O).

          Great.
          *
          I know youll discredit all that a priori like do all Pseudoskeptics, but I tell you: try reading”

          ***

          From your link to Halpern…

          “We have measure [sic] rises in temperature both near the heater and at a distance from it as CO2is introduced, demonstrating the greenhouse effect. 1. R.W. Wood, London, Edinborough and Dublin Philosophical Magazine , 1909, 17, p319-320 also http://www.wmconnolley.org.uk/sci/wood_rw.1909.html

          ****

          OMG…words of wisdom from Eli Rabbett, aka Josh Halpern. You’d think he’d give it up after G&T, both experts in thermodynamics, revealed his abject ignorance on the subject. They were talking about bodies of different temperatures radiating and G&T pointed out the 2nd law allows only heat transfer from a hotter body to a cooler body. Halpern et al rebutted that would mean one radiator was not radiating.

          Doh!!! Eli can’t tell the difference between EM radiation and heat.

          In the quote above he includes reference to R.W. Wood and W. M Connolley, the latter a regular propagandist at realclimte. Connolley was fired from his editorial position at Wikipedia for his extreme climate alarmist bias when editing pieces about skeptics. In particular, he hated the late climate skeptic Fred Singer and took every opportunity to denigrate Singer.

          More reason to seriously suspect articles by Wikipedia.

          Both of them reveal their utter stupidity by likening a controlled experiment with CO2 in a lab to the action of CO2 in the atmosphere where it makes up an insignificant 0.04% of the atmosphere. Furthermore, they claim their experiment proves the greenhouse effect. We all know CO2 absorbs IR and warms but that does not explain or prove its action in the atmosphere. Tyndall proved CO2 absorbs IR circa 1850 with a far more sophisticated experiment.