
 Home/Blog
The Version 6.0 global average lower tropospheric temperature (LT) anomaly for February, 2022 was 0.00 deg. C, down a little from the January, 2022 value of +0.03 deg. C.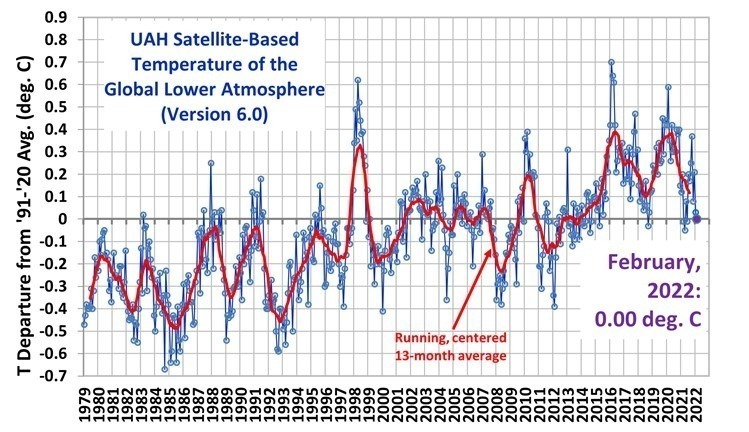
The linear warming trend since January, 1979 still stands at +0.13 C/decade (+0.12 C/decade over the global-averaged oceans, and +0.18 C/decade over global-averaged land).
Various regional LT departures from the 30-year (1991-2020) average for the last 14 months are:
YEAR MO GLOBE NHEM. SHEM. TROPIC USA48 ARCTIC AUST
2021 01  0.12  0.34 -0.09 -0.08  0.36  0.50 -0.52
2021 02  0.20  0.32  0.08 -0.14 -0.65  0.07 -0.27
2021 03 -0.01  0.13 -0.14 -0.29  0.59 -0.78 -0.79
2021 04 -0.05  0.05 -0.15 -0.28 -0.02  0.02  0.29
2021 05  0.08  0.14  0.03  0.06 -0.41 -0.04  0.02
2021 06 -0.01  0.31 -0.32 -0.14  1.44  0.63 -0.76
2021 07  0.20  0.33  0.07  0.13  0.58  0.43  0.80
2021 08  0.17  0.27  0.08  0.07  0.33  0.83 -0.02
2021 09  0.25  0.18  0.33  0.09  0.67  0.02  0.37
2021 10  0.37  0.46  0.27  0.33  0.84  0.63  0.06
2021 11  0.08  0.11  0.06  0.14  0.50 -0.42 -0.29
2021 12  0.21  0.27  0.15  0.03  1.63  0.01 -0.06
2022 01  0.03  0.06  0.00 -0.24 -0.13  0.68  0.09
2022 02  0.00  0.01 -0.02 -0.24 -0.05 -0.31 -0.50
The full UAH Global Temperature Report, along with the LT global gridpoint anomaly image for February, 2022 should be available within the next several days here.
The global and regional monthly anomalies for the various atmospheric layers we monitor should be available in the next few days at the following locations:
Lower Troposphere: http://vortex.nsstc.uah.edu/data/msu/v6.0/tlt/uahncdc_lt_6.0.txt
Mid-Troposphere: http://vortex.nsstc.uah.edu/data/msu/v6.0/tmt/uahncdc_mt_6.0.txt
Tropopause: http://vortex.nsstc.uah.edu/data/msu/v6.0/ttp/uahncdc_tp_6.0.txt
Lower Stratosphere: http://vortex.nsstc.uah.edu/data/msu/v6.0/tls/uahncdc_ls_6.0.txt


speak for you.
comprare patente di Guida
Amazing!!! Drywall Framing Near Me
Today, I went to the beachfront with my children. I found a sea shell and gave
it to my 4 year old daughter and said “You can hear the ocean if you put this to your ear.” She put the shell to her ear and screamed.
There was a hermit crab inside and it pinched her ear.
She never wants to go back! LoL I know this is completely off topic but I had to tell someone!
Well, the fact that the 1991 2020 base period is about 0.14C warmer than the 1981 2010 base period says something about the overall warming trend over the last 40 years. In fact it results from 2011-2020 being 0.41C warmer than 1981-1990
https://www.trawertyn-marmur.pl/kategoria-produktu/mozaiki-trawertynowe
At the same time, some company founders are additionally motivated to have interaction in CSR as a
end result of their convictions.
Good post. I learn something totally new and challenging on websites I stumbleupon everyday.
It will always be helpful to read through articles
from other writers and use a little something from their web sites.
Benefits are financed by employer payroll taxes – not by any deductions out of your wages.
I am really enjoying the theme/design of your weblog. Do you ever run into any browser compatibility problems?
A handful of my blog visitors have complained about my website not working correctly in Explorer but looks
great in Firefox. Do you have any recommendations to help fix this
problem?
Seventh step- Elaboration of your process and applying your Brazilian Permanent visa joining all necessary statements, paperwork and types.