Most of you are probably not aware that my wife of 48 years, Doreen (“Reenie”) J. Spencer passed away two weeks ago today, on June 7. Reenie had suffered for many years from autoimmune and fatty liver disease, and her condition worsened in the last several months. By the time she agreed to go to the hospital, it was too late to do anything except keep her comfortable.
We married the year I changed my major from computer science to atmospheric science and moved from Michigan State University to the University of Michigan. Reenie was always my most loyal supporter and fiercest defender, exhibiting the ‘sisu’ of her Finnish heritage.
Her spirit is now relieved of her earthly sufferings.
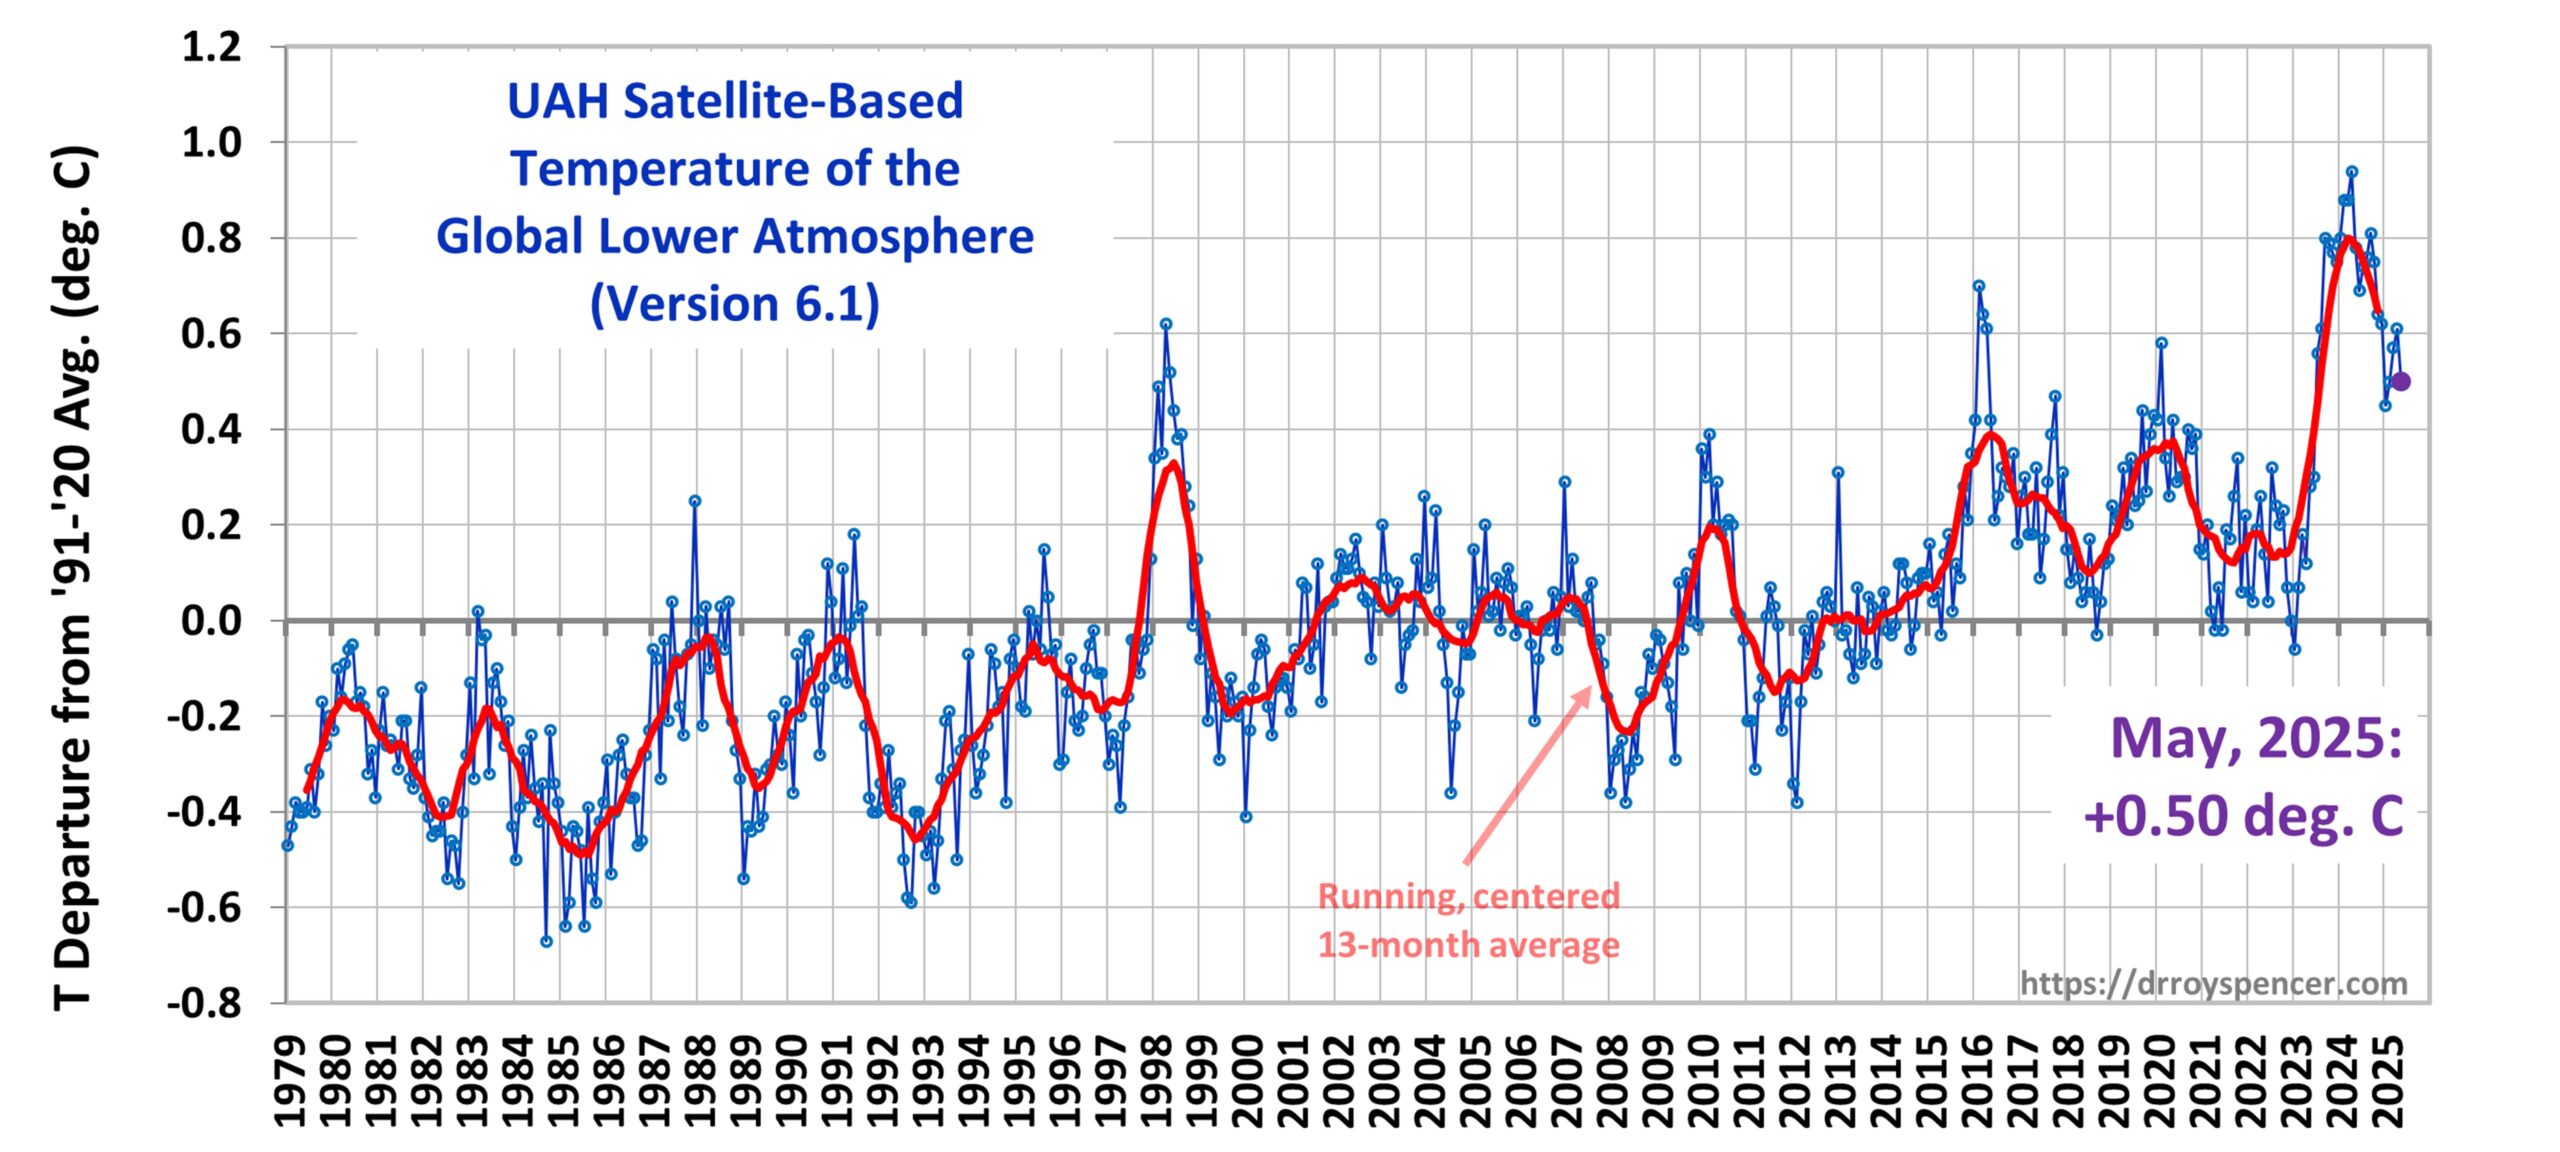
The Version 6.1 global average lower tropospheric temperature (LT) anomaly for May, 2025 was +0.50 deg. C departure from the 1991-2020 mean, down from the April, 2025 anomaly of +0.61 deg. C.
The Version 6.1 global area-averaged linear temperature trend (January 1979 through May 2025) remains at +0.15 deg/ C/decade (+0.22 C/decade over land, +0.13 C/decade over oceans).
The following table lists various regional Version 6.1 LT departures from the 30-year (1991-2020) average for the last 17 months (record highs are in red).
YEAR
MO
GLOBE
NHEM.
SHEM.
TROPIC
USA48
ARCTIC
AUST
2024
Jan
+0.80
+1.02
+0.58
+1.20
-0.19
+0.40
+1.12
2024
Feb
+0.88
+0.95
+0.81
+1.17
+1.31
+0.86
+1.16
2024
Mar
+0.88
+0.96
+0.80
+1.26
+0.22
+1.05
+1.34
2024
Apr
+0.94
+1.12
+0.76
+1.15
+0.86
+0.88
+0.54
2024
May
+0.78
+0.77
+0.78
+1.20
+0.05
+0.20
+0.53
2024
June
+0.69
+0.78
+0.60
+0.85
+1.37
+0.64
+0.91
2024
July
+0.74
+0.86
+0.61
+0.97
+0.44
+0.56
-0.07
2024
Aug
+0.76
+0.82
+0.69
+0.74
+0.40
+0.88
+1.75
2024
Sep
+0.81
+1.04
+0.58
+0.82
+1.31
+1.48
+0.98
2024
Oct
+0.75
+0.89
+0.60
+0.63
+1.90
+0.81
+1.09
2024
Nov
+0.64
+0.87
+0.41
+0.53
+1.12
+0.79
+1.00
2024
Dec
+0.62
+0.76
+0.48
+0.52
+1.42
+1.12
+1.54
2025
Jan
+0.45
+0.70
+0.21
+0.24
-1.06
+0.74
+0.48
2025
Feb
+0.50
+0.55
+0.45
+0.26
+1.04
+2.10
+0.87
2025
Mar
+0.57
+0.74
+0.41
+0.40
+1.24
+1.23
+1.20
2025
Apr
+0.61
+0.77
+0.46
+0.37
+0.82
+0.85
+1.21
2025
May
+0.50
+0.45
+0.55
+0.30
+0.15
+0.75
+0.99
The full UAH Global Temperature Report, along with the LT global gridpoint anomaly image for May, 2025, and a more detailed analysis by John Christy, should be available within the next several days here.
The monthly anomalies for various regions for the four deep layers we monitor from satellites will be available in the next several days at the following locations:

 Home/Blog