
 Home/Blog
…but the coolest summer nights have warmed by 5 deg. F.
John Christy and I continue to examine U.S. air temperature trends, especially those in summer, and John has recently been looking at “heat wave” statistics.
My interest is in determining how much the urban heat island (UHI) effect has impacted reported warming trends. Last year we published a paper using population density as a proxy for urbanization, and found that about 60% of U.S. urban and suburban warming trends in Tavg (the average of the daily maximum [Tmax] and minimum [Tmin] temperatures) since 1895 in the “raw” (non-adjusted) temperature data could be accounted for by urbanization.
But we also found that relationship largely disappeared by the 1970s, with little warming since then being accounted for by increases in population density.
Landsat Impervious Surface Data
We used population density in that study because the datasets are global and extend back to the 1800s (and even earlier). But the most direct physical relationship to UHI warming would be the coverage of the area around the thermometer by impervious surfaces (IS). Those data are now available at 30 meter resolution from Landsat for each year between 1985 and 2024 (40 years). IS might well reveal UHI effects in cases where population density is no longer increasing but wealth has increased (more air conditioning, Dollar Generals, etc.)
But I’m not going to show IS data today, that’s for another time. I’m only explaining how I got here.
D.C. Urban Warming Trends: The Difference is Like Day and Night
For now I’m examining metro areas (which is what the EPA Heat Wave papers also do), using airport ASOS measurements which is what the National Weather Service and FAA mostly rely upon. These systems are well-maintained since their primary purpose is to support air traffic safety.
I started with the center of America’s universe, Washington D.C. And I also decided that something better than a “heat wave” index was needed.
The heat wave (like pornography) is difficult to define, but you know it when you see it. How many days in a row constitute a heat wave? And how hot do those days have to get? Above the 85th percentile? 90th percentile? Those questions do not have definitive answers.
Also, by choosing a binary variable, there is no gray area available for days that are almost a heat wave (oh, sorry, there were only three days above 100 deg. F, so you didn’t meet the 4-day threshold). Such definitions lead to dodgy statistics, such as computed trends in heat waves,
So, I decided (as a meteorologist) that the hottest days in each month make more sense to keep track of for climate trends. I decided on the average of the 3 hottest daily maximum temperatures in each summer month (June, July, and August) as a potentially useful metric, which is approximately the hottest 10% of the days in the month. This metric always exists, every month, every year, and it always has 3 days. This is good for statistical analysis.
But then I thought, why stop there? What about the 3 coolest Tmax days each month?
Which then led to, “What about the warmest and coolest 3 days minimum temperature (Tmin) measurements?”
So, I started with Washington D.C., Reagan National Airport, which is used by your favorite congresspersons and presidents (as well as the public) to keep track of how hot it’s getting.
The results surprised me. Here are the temperature trends in those different categories. What is amazing is that the coolest summer nights in DC have warmed 10 times faster than the hottest summer days:
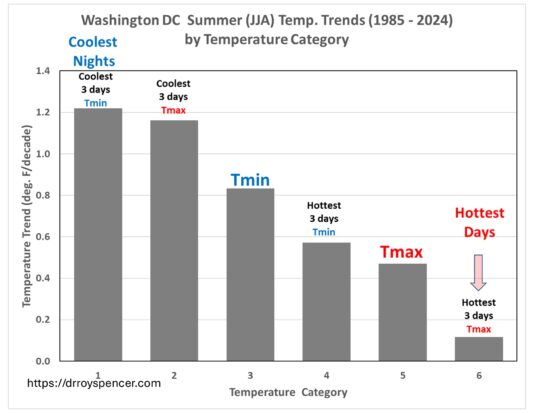
In fact, the trend in the hottest days’ temperatures is not even statistically significant, at only +0.12 deg. F per decade, which is just under a total of 0.5 deg. F warming in the last 40 years. No Boomer would notice that in their lifetime.
But look at those nighttime temperatures! The coolest nights have warmed by almost 5 deg. F in the last 40 years. This is clearly dominated by the UHI effect, since climate models tell us that days and nights should be warming at much closer to the same rate.
Now, Washington D.C. might be an outlier for urban areas. I’m just starting down this road, so we shall see. But I’ll bet most people would not have expected these results if they have been watching the local D.C. TV stations’ weather and news coverage.


Sounds productive!
“climate models tell us that days and nights should be warming at much closer to the same rate.”
The assertion that climate models predict days and nights warming at similar rates is incorrect; the actual scientific consensus, backed by climate models and observations, is that nighttime temperatures are warming significantly faster than daytime temperatures
Scientific consensus. Can’t argue with that.
Most of us are here talking (and doing research) about this subject because of the notion that warming, mostly caused by CO2 released by humanity is presenting an existential threat to the world. Without comment about the merits of that concern, but focusing on these observations only, this appears to be one more of the benefits provided to mankind from warming. If indeed, the warming skews to the night, it can be handled/endured/mitigated a lot more when we are asleep than during “the heat of the day.”
I would love to see a mirror of these observations for winter. The 30 year normals minimum temps at Reagan AP increased by 1.5F from the 1981-2010 to the 1991-2020 normals. Since deaths from cold spells dwarf deaths from heat waves (please don’t cite a few isolated studies to dispute this well known fact in epidemiology), winter night time warming is saving lives.
I’m gonna look at changes in normals at Dulles AP, which you would think might have less UHI warming.
“Most of us are here talking (and doing research) about this subject because of the notion that warming, mostly caused by CO2 released by humanity is presenting an existential threat to the world.”
No, not an existential threat. This is a fringe view. The risk posed to humanity is not quite as stark as that, according to the mainstream view.
It would be useful to see the uncertainty in each of the trends. An average of just three days a year at a single location is likely to have a lot of variability.
I’ve just tried this using the daily CET data, and get rather different results.
Coldest TMax = 0.47 +/- 0.28
Hottest TMax = 0.68 +/- 0.56
Coldest TMin = 0.31 +/- 0.30
Hottest TMin = 0.30 +/- 0.23
All figures are rates of change since 1985, in C / decade, with 2 sigma uncertainty intervals.
Bellman, are you changing the area of consideration?
That might be called “throwing crap against the wall, hoping to change reality”.
Roy’s focus was on “UHI”. You need to stick to DC data.
My main point was that a linear trend from highly variable data is not going to be very meaningful.
I used CET to see what this method looked like, simply becasue it’s a data source I have daily max and min values for. However, I think I misunderstood the method here. I was just using the 3 most extreme days from the summer, where as Dr Spencer is, I think, taking an average of the three most extreme days from each month and averaging them all – nine days for each year. Here are the CET values using that method.
Coldest TMax = 0.36 +/- 0.19
Hottest TMax = 0.64 +/- 0.47
Coldest TMin = 0.20 +/- 0.14
Hottest TMin = 0.36 +/- 0.15
Linear trends are only interesting on VERY long (non cyclic) data.
Need to stick to DC data? Nothing is easier.
The station chosen is
USW00093738 38.9408 -77.4636 88.4 VA WASHINGTON DC DULLES AP
because it has data from 1960 till 2025, whereas
USW00093725 38.9053 -77.0525 34.1 DC WASHINGTON
has only data from 1851 till 1965.
{ The two are merged however when generating data out of several stations in any area context encompassing them. }
*
1. Absolutes
https://drive.google.com/file/d/1O_fGIlzS1nG_n8wmACsa68Mz8OZDUVN5/view
2. Anomalies
https://drive.google.com/file/d/1oDMnbv-AsNFa_1gGGoR_95XhUwNUCicZ/view
Like for so many bigger cities, TMIN increases more than TMAX.
*
Btw: it’s amazing to see how often TMIN and TMAX show similar little wriggles over time.
However, the one or the other opinionated boy would clearly condemn them as ‘distortions’ and have the series burned at the stake of mental one-sidedness.
An interesting stat for the I-25 urban corridor of Colorado is that it used to be rare (at least in some decadal climate cycles?) to have many days over 95F (or even over 90F?), but we’ve had a lot of summers the last 20 years that just shatter that stat with lots of hot days and often in a row. I bring it up because I do think it is relevant to comfort (the rare and solo scorcher day is much easier to handle without AC than 10 hot days in a row) and seems this stat would be missed by the metric that looks at the 3 hottest days per month.
Stratospheric intrusion.
https://i.ibb.co/rfp5bN0P/gfs-o3mr-150-NA-f072.png
The study suffers from the limitations of a very narrow and volatile data subset as well as a lack of regional context. IMHO
This really isn’t a “study”. Just an interesting result from the main weather station serving ~6 million people. I will end up analyzing a few hundred stations in the U.S.
BTW, if I had gotten results right in line with the climate model projections, would you have had the same objection?
Yes, I would have had the same objection.
My concern is not about the outcome of the analysis, but about the methodology. A dataset defined by only three extreme days per year is statistically fragile, and without a regional context it is difficult to separate local noise from meaningful climate signals. This limitation would remain regardless of whether the results aligned with model projections or not.
I’m a Petroleum Engineer by education and professional experience. Methodology is of utmost importance to me.
Ark, it’s hard to recognize your appreciation for reality, or science, when you can’t address basic physics and wallow in TDS.
You might consider that….
“A dataset defined by only three extreme days per year is statistically fragile, and without a regional context it is difficult to separate local noise from meaningful climate signals.”
Quite true.
Arkady, your assessment suggests a sweeping dismissal hinging on the supposed limitations of the data and a lack of regional context. However, such criticism, presented without substantive evidence or constructive alternatives, does little to advance meaningful discourse. Rather than casting vague aspersions, I encourage a more rigorous engagement—specifically, what facets of the data subset do you find volatile, and which regional contexts are absent but crucial to interpretation?
Roy Spencer’s study, as presented, takes care to acknowledge inherent complexities and limitations. No analysis is immune to scrutiny, but the value lies in questioning specifics and enriching the conversation with well-grounded insights. Blanket statements and reliance on acronyms like “IMHO” can easily undermine the possibility for productive debate. If you possess data or methodological suggestions that could mitigate the constraints you perceive, such contributions would be far more beneficial than generalized disparagement.
In short, constructive criticism builds understanding, while vague condescension only stifles it. I invite you to elaborate with substance, so the discussion may move beyond hollow skepticism to genuine scientific dialogue.
sam shicks
Your tone sounds very similar to that of another commenter on this site who attempts to disguise his ad hominem attacks as “scientific dialog.”
But I digress.
My original comment was not intended as a peer-review of Dr. Spencer’s work, but simply as a brief expression of my opinion regarding its limitations.
That said, don’t you agree that analyzing only “the average of the 3 hottest daily maximum temperatures in each summer month (June, July, and August)“ can yield results that are highly sensitive to year-to-year variability and therefore not necessarily representative of longer-term trends?
Further, would you not agree that placing D.C.’s results in the context of regional patterns, e.g. the broader Mid-Atlantic, would help clarify whether the findings reflect larger climatic signals or are simply the product of local variability?
This study supports the notion that UHI effects have caused the warming to skew higher. Seems logical.
I assume that the official site for recording temperatures in Washington DC is National Airport which sticks out into the Potomac River. We all know that bodies of water or even irrigation can affect local temperature measurements. Would it make more sense to include sites not strongly affected by moisture or humidity?
I will be analyzing a few hundred ASOS stations, which have a variety of exposures.
Irrigation causes reduction of local temperature but contributes to increase of global temperatures because of its contribution to average global water vapor increase.
Dan,
Then why is the moist adiabatic lapse rate cooler than the dry adiabatic lapse rate, globally?
Assuming that by ‘cooler’ you mean lower, the temperature declines slower with altitude and is therefore is higher at any altitude.
No, what I mean is as you add moisture to the atmosphere the lapse rate becomes smaller. So, the atmosphere moves toward isothermal.
I mean mathematically what you’re saying is correct but ignoring the implication.
The facts are as follows: a full-scale La Niña is developing, the QBO in the lower stratosphere will be eastern, and the solar cycle is coming to an end. What will winter be like in the northern hemisphere?
Why are your comments always completely off-topic?
I apologize. I thought it was already fall in the US. I will try to improve.
Ireneusz, It seems you have misunderstood Dr. Spencer’s concern. Whenever Dr. Spencer starts a thread with a very specific topic (e.g., nighttime warming increase greater than daytime,) your replies most always are a general meteorological report on current conditions that have little to do with with the central topic of the thread; this is called “being off topic.”
If you enjoy making meteorological reports, you might consider starting your own channel (YouTube, Mix, Facebook, Rumble, Bluesky, X, etc.) whereby you might generate some income for you efforts.
Dr. Spencer, your previous work has shown the UHI effect to increase rapidly when going from almost zero population to low population. It continues to increase but rather plateaus as population density gets high. But surely DC population density was high in 1970 and onwards, right? How would one explain, then, this continued increase? Relatedly, one would expect measured Tmin increases to be nonlinear, correct?
It would be interesting to know how the frequency distribution is changing over time for DC.
If the shape remains the same you would see both an increasing mean and an increasing upper boundary.
Dr Spencer’s data suggests that the mean is increasing while the upper bound is not.
This suggests that something other than global warming is limiting the maximum temperature that Washington can achieve.
Sea breezes?
Why do you ignore the increase of the night-time low temperatures? They are easily explained by the increasing trend of about 1.5 %/decade of water vapor since before 1988.
I would LOVE to see similar results from Phoenix Sky Harbor airport. They did have a bona fide heat wave in 2024 that was much ballyhooed by the “sky is falling” crowd. The length of the stretch of very hot weather was impressive. Phoenix “only” set 7 daily high records out of the 92 days from June-August. To me, that is unusual but not particularly alarming. Phoenix is in a desert. If a human being is not prepared for the heat, they have not been paying attention.
Phoenix has had phenomenal growth over the last 40 years. It would also be interesting to look at a station that was undeveloped desert 40 years ago that is now enveloped in an area of development. Maybe a local, state, or Fed park?
Was that all lie in your opinion?
https://www.kjzz.org/kjzz-news/2024-10-03/phoenixs-unprecedented-october-heat-wave-drags-on-with-110-forecast-through-the-weekend
*
When looking at the GHCN daily data for
USW00023183 33.4278 -112.0039 337.4 AZ PHOENIX SKY HARBOR INTL AP
we see the following.
*
Absolutes
https://drive.google.com/file/d/1qUVQdzGOL7Hf1Qaf-8ZmB3ICaw-1dMF1/view
Highest absolute values:
2023 7 45.94 (C)
2024 7 44.63
2020 8 43.74
2020 7 43.25
2023 8 43.07
2005 7 43.05
2009 7 43.03
2024 6 43.01
2024 8 42.97
2011 8 42.75
*
Anomalies
https://drive.google.com/file/d/12Ko-Av5b-t8yYUA4oygSfTfI3TDVkMe9/view
*
In the anomalies, we see, when looking superficially, that in several years, the highest ones
were at least as high as in 2023/24:
1972 3 5.30 (C)
2024 10 5.11
2016 2 5.00
2024 12 4.95
1989 4 4.88
1980 12 4.85
2023 7 4.70
2025 2 4.50
2004 3 4.36
1991 2 4.34
But… as you can see as well, none in the top ten referred to July ot August – except… 2023.
Yet the number of days above 90* F has been increasing by decade in Washington, DC. by a large number.
The seven decades from 1882 – 1951 there were 1814 days total above 90* F.
The seven decades from 1952 – 2021 there were 2663 days total above 90* F.
A near 40% increase in those 140 years.
The last four years have seen 152 days above 90 so far. Extrapolating out the decade 2022 – 31 will see 380 days above 90*, more than doubling the 1882 – 1951 decade average of 181.4.
Or, in 5 decade increments starting with 1872, the number of days above 90* F have risen from 1282 to 1681 to 1836 at the end of 2021.
Stats from Extreme Weather Watch.
“This is clearly dominated by the UHI effect, since climate models tell us that days and nights should be warming at much closer to the same rate.”
1) The attribution to UHI seems like an unjustified leap.
2) It’s a little disorienting that climate models outputs are now adequate for attribution when the DOE report from a month ago argued that they weren’t.
I haven’t read the report in its entirety, but in my view, what you wrote wasn’t the only point that any honest climate skeptic would have to disagree with.
Some time ago, you commented on the ‘sea level’ section as an ’embarrassing mess’; given the almost completely inaccurate presentation, that was in my view – as someone who has spent years studying and processing all available data – a very polite way of putting it.
The Central England Temperature goes back to 1649. It is split into the four seasons. Summer temps have hardly changed at all (certainly no significance) while winter has warmed considerably. Genuine question:
How would global CO2 do that? I get that night-time temps have increased (not daytime) due to UIHE, but how would CO2 cause winter temps to be higher?
“The Central England Temperature goes back to 1649”
1659
“Summer temps have hardly changed at all (certainly no significance)”
That’s not really true. Summers have been warming at 0.015 +/- 0.008C / decade since 1659. That’s statistically significant, with a p-value = 0.0003.
Other seasons have been warming faster. Winter at 0.043 +/- 0.013C / decade.
But linear trends over such a long period don’t really tell you much. The warming since 1970 shows little difference between summers and winters, with spring being the fastest warming season.
Spring: 0.36 +/- 0.12C/decade
Summer: 0.25 +/- 0.14
Autumn: 0.28 +/- 0.13
Winter: 0.25 +/- 0.19
Roy Spencer writes here:
” The Hottest Summer Days in D.C. Have Not Gotten Hotter in Last 40 Years… …but the coolest summer nights have warmed by 5 deg. F. ”
*
Oh I thought most UHI would, according to his peer reviewed study, have been discovered during JJA’s TMAX at so many many places.
OK then. Wash DC is the exception confirming the rule, isn’t it?
*
Anyway, I never really could trust this study because years ago, Mr Spencer tried to significantly show UHI by comparing a big city like Las Vegas to a small distant city.
The first compariosn was in my mind not very useful because the small city was… Winnemucca, a tiny corner in the mountains so far áway from everything that even small, more judiciously selected cities 50 km+ from Vegas like Searchlight, Desert Rock etc appeared as huge UHI sources near Winnemucca.
All in all, Roy Spencer’s comparison (and those I myself made later on, using other big cities like Denver, Memphis, Milwaukee, Seattle, Oklahoma) showed what we all now since ‘evah’: namely, that most UHI appears within big cities mostly during winter nights.
Rien de nouveau à l’Ouest, dira-t-on chez les Frogs.
So, to put a moral overlay on the top of your comment about UHI in the winter, it looks like a rather important benefit of warming has been identified. Winter cold spells kill a lot more people than summer heat waves. No comparison between the two. Warmer winter nights (and days for that matter) equal fewer deaths. So, it appears warming may be saving lives.
I have been looking at 30 year normals. Simply comparing the current normal – 1991-2020 with 1981-2010 – Reagan National AP does show some impressive warming for max, min, and average temps, both for the entire year and the summer season. All are between +1.0 and +1.2F. I have looked at about 15 sites, mostly large airports, and most are +0.5F or lower. Dayton Ohio’s commercial AP and Wright-Pat AFB are +1.4F and +1.7F. Don’t have a clue why Dayton is a outlier, but understand that a lot of hot air emanates from the politicians and lobbyists in the DC area (couldn’t resist that one!).
The winter min temp at Reagan has increased by 1.5F!
When will this blog finally adapt worldwide conventions like Celsius-based temperatures?
Apart from the egomaniacal US, only Liberia and a few microscopic island states still make exclusive use of it.
It’s so boring for us outside US to eternally have to translate these completely outdated Fahrenheit values into modern, worldwide understood ones.
Go make your own blog, see how it turns out you Dimwitdon
Aaaah..
As always, the ankle-biting dachshund Eben has nothing to contribute to any discussion, so he can’t think of anything better than to inject his eternally stupid wooah wooah babble into the blog.
You and Willard are two of the best examples of Dr Spencer’s commitment to free speech. Both of you would be prime candidates for a permanent ban on most moderated comment blogs, on the basis of being annoying and irrelevant. This comment about the use of the Fahrenheit temperature scale is not a new low for you, it is a typical low level snobbish and rude comment. You prove once again that arrogance is a very poor substitute for intelligence or knowledge.
I ‘m sure with the federal takeover of DC governance this problem will be fixed…
I work at a nuclear power plant so I have access to our meteorological data. I noticed something similar in our 10-meter MET tower temperature data. The warming over the past 10 years occurred almost exclusivity during the three coldest months of the year with no noticeable warming during the remaining months of the year. This IMO can be attributed to an increase in absorbed solar.
Urbanization is a defining force of the modern era, transforming landscapes, economies, and societies at an unprecedented rate. As cities expand, the natural environment is fundamentally altered—often with profound and far-reaching consequences. Among the most significant yet underappreciated impacts of urbanization is its effect on cloud formation and coverage. Mounting evidence and logical analysis suggest that urbanization is responsible for nearly all cloud reduction in affected regions. This case is built upon an understanding of how urban development reshapes both the hydrological and atmospheric dynamics of a region, and why these changes lead inexorably to a decline in cloud presence.
How Urbanization Reshapes Hydrological and Atmospheric Processes
At the heart of the urban transformation lies a shift from permeable, water-absorbing landscapes—such as forests, grasslands, and wetlands—to hard, impervious surfaces like concrete, asphalt, and rooftops. This change triggers a cascade of hydrological and atmospheric consequences that together diminish the potential for cloud formation.
· Loss of Vegetation and Soil: Natural soils and vegetation act as vast sponges, absorbing rainfall and gradually releasing moisture through the process of evapotranspiration. Trees and plants draw up groundwater, releasing water vapor into the air, which is a critical precursor to cloud formation. When these features are stripped away, the land’s ability to contribute water vapor to the atmosphere is greatly diminished.
· Impervious Surfaces and Runoff: Urban landscapes are dominated by hard surfaces that do not absorb water. Instead, rainfall rapidly runs off into efficient drainage systems, storm sewers, and streams, whisking water away before it can be absorbed and returned to the atmosphere. This dramatically reduces the local moisture available for atmospheric processes.
· Altered Heat Dynamics: Cities are well-known for their ‘urban heat island’ effect. While the additional heat can sometimes enhance convection, the lack of moisture means that this thermal energy rarely translates into increased cloudiness. Instead, the dry, hot surfaces promote the dispersal of any atmospheric moisture that remains, making cloud formation less likely.
Sam Shicks
I appreciate your good résumé describing
” How Urbanization Reshapes Hydrological and Atmospheric Processes “.
*
Though being of course convinced of the existence of UHI through several comparisons of weather stations in single big cities with those in small locations in their near, I still have problems to detect it when processing averages of bigger amounts of stations.
*
An example.
Two years ago, Roy Spencer started a discussion about
” Climate Models Greatly Overestimate Corn Belt Warming “.
The discussion itself didn’t interest me much; I was more interested in having a closer look at how surface and lower troposphere temperatures behaved there during the last decades.
*
I thus isolated, in an area encompassing most of the Corn Belt, over 1000 GHCN daily stations in 13 US states and 18 pristine USCRN stations located in 8 of these 13.
Here are some results, based on the data from 885 GHCN daily stations having sufficient data for the period 1991-2020.
A comparison of the 885 stations to a Corn Belt extraction out of 30,000 US cities showed that most of the biggest cities are present with at least one station (e.g. Chicago, Minneapolis, Milwaukee, Grand Rapids etc etc).
At the other end, some GHCN daily stations are in locations so small that they even don’t appear in the US cities database (e.g. Mildred, MT).
49 stations are located within airports (duh! Tarmac, jet exhausts).
*
1. Comparing Tmin and Tmax obtained from the GHCN subset for the UAH period (i.e. since Dec 1978)
https://drive.google.com/file/d/1-hkXYYfHDezNya4MSfyCHFWhJSEGCSWk/view
*
2. Comparing GHCN daily Tmean and USCRN Tmean for the USCRN period (i.e. since 2002)
https://drive.google.com/file/d/1pLBzNkQgEsgaMyRvnKLJGty5VO28-eRI/view
*
3. Finally I wanted to compare the GHCN daily data with UAH’s LT data:
https://drive.google.com/file/d/19P9CjfPkdmcpgzgtw0Xlm_4Pkb2uqNXO/view
*
The comparison GHCN daily vs. USCRN was interesting, as I would have expected the GHCN average showing a much higher trend than that of USCRN’s, especially when comparing the Tmins instead of the Tmeans.
*
4. As so often, the UHI effect is diluted when you process the data of many stations, e.g. when comparing all USCRN stations in CONUS to all GHCN daily stations locaied in their ~ 150 km vicinity:
https://drive.google.com/file/d/1O4Ble-q0YBEXQwOwO8SYMm3psCYUs1Lx/view
*
What is your opinion about this?
Bindidion,
You produced a couple of graphics and think you have proved what exactly?
Has the dewpoint increased ?
The hoaxes are limitless. One gets debunked and they just manufacture another. The who issue is to get everyone chasing their tails and not focus on the big picture and main issues. Here is a video that focuses on debunking the main issues. https://app.screencast.com/xgTItkw2KwSuk
The Climate Sophists can always find new hoaxes to distract people. Their lies will always be the objective. They want people chasing their tails, not exposing the big picture. This video exposes what the hoaxsters want to keep hidden. https://app.screencast.com/xgTItkw2KwSuk
CO2isLife,
Love your screenname. It is a way of repeatedly stating an excellent fact that is mostly ignored in the media and in the general public, who haved long ago forgotten their middle school science.
But it got me thinking about the Big Lie. If you repeat anything loud enough, long enough, with a big enough megaphone (sound system), if it is shrouded in authority (“consensus” of the scientific “community”) it will be believed. Climate Change (rebranded from Global Warming, since “change” can encompass extreme weather events, which are scarier than just hotter temps) is but one example of this. Transsexualism – the notion that one can decide what sex one is – is probably the best example of this. Socialism as a legitimate system of government is another. My purpose/intent is not to start a discussion here that is off topic. But both these ideas run up against a wall of facts. Again, I will not respond to any defense or attack pro or con of either. Mt point is that ALL three misguided notions are quite in vogue among many who have been educated in American schools since about 1980 or who consume large amounts of mass media and engage in lots of social media, which tilts algorithms in favor of these idiotic ideas.
I am shocked to this day that Hitler was able to convince an overwhelming majority of Germans, Austrians, and others that Jews were so subhuman and harmful to society that they must be “neutralized.” Germany, starting with Luther and Melanthon (spelling?) led the world towards literacy, schooling, and higher education for the masses. Americans seeking a graduate education (not professional schools, like law) went to Germany. Some of the greatest advances in science and engineering came out of Germany before Hitler (with Jews playing an outsized role). The German people were amount the most educated, cultured people in the world by the early 1900s. Yet they fell for a Big Lie. Intelligence and intellectual achievement apparently does not insulate you from the power of the Big Lie.
Which brings me to your calling Climate Change a hoax. It is not a hoax. That implies an intent to deceive. While many promoters of CC have other motives (grants, raises, praise, advancement), at their core, I believe that most advocates of CC and its policies really believe they are “saving the world.” That makes this very regrettable episode in the history of science much scarier than any potential harm from CC. I have given talks on Climate Change to the general public and they have a huge mistrust of scientists due to their disbelief about the dangers of CC and the medical/drug/public health handling of the pandemic.
Joe Sixpack thinks he has it right and the Ivory Tower has it wrong. It will take some time to reearn his trust.
Thomas, you are exactly right. It follows the tactics of the Big Lie. Dinish DeSusa wrote a great book on that topic.
“If you repeat anything loud enough, long enough, with a big enough megaphone (sound system), if it is shrouded in authority (“consensus” of the scientific “community”) it will be believed.”
True, eg ‘the 2020 election was stolen’.
But actual scientific truths, like The Law of Conservation of Energy, or that the Polio vaccine saves many lives, are also based on scientific consensus and are repeated often.
There’s no such thing as a scientific truth. Scientific Laws can be expressed mathematically. They haven’t been falsified.
Thomas, that is an extremely well written comment and right on point. Everything you stated is precisely correct. It is not a hoax. Global warming potential is real. Increasing CO2 from fossil burning MUST have some kind of effect. The problem is people who want to exaggerate and blow everything out of proportion with hype and false claims. The other problem is people like Nate who want to make everything political.
No, that big thunderstorm was not evidence of climate change.
You also have a good point about the lack of science literacy in society. Vaccine technology is extremely complex. Most family practice doctors do not fully understand all of the complexities and interactions. I certainly do not, but I do know this: It is not a cure, and in many cases it is not a prevention of disease. In every case, a vaccine does nothing more than make the immune system work faster. Period. Sometimes it works so fast that it seems like a cure or prevention, but ultimately, any exposure to any harmful virus or bacteria requires a response from the immune system.
As a quick sanity check on this I used the NCEI online tools a linked below to get trends for the max, min, and average temperatures for Reagan Airport 1985 through 2024.
Max trend is 0.7 F/Decade
https://www.ncei.noaa.gov/access/monitoring/climate-at-a-glance/city/time-series/USW00013743/tmax/3/8/1985-2025?trend=true&trend_base=10&begtrendyear=1985&endtrendyear=2025&filter=true&filterType=loess
Min trend is 0.9 F/Decade
https://www.ncei.noaa.gov/access/monitoring/climate-at-a-glance/city/time-series/USW00013743/tmin/3/8/1985-2025?trend=true&trend_base=10&begtrendyear=1985&endtrendyear=2025&filter=true&filterType=loess
Avg trend is 0.8 F/Decade
If I’m interpreting the figure in the blog post correctly, Dr Spencer calculated a corresponding Max trend of about 0.47 F/Decade and a Min trend of 0.83 F/Decade. It’s not clear how one reconciles these two results.
I’m working on pulling down and analyzing the raw data, but the data I’ve been able to locate thus far only goes back to 1996, so I’m not clear where he’s finding his source data.
https://www.ncei.noaa.gov/data/automated-surface-observing-system-five-minute/access/
Mark B
For Reagan AP anomalies wrt 1981-2010 out of GHCN daily
USW00013743 38.8483 -77.0342 3.0 VA WASHINGTON REAGAN AP
I obtain for Jan 1985 – Dec 2024 the following trends, in C / decade:
Tmin: 0.52 +- 0.06
Tmax: 0.39 +- 0.07
GHCN daily data starts in Jan 1962.
Trends from Jan 1962 till Dec 2024:
Tmin: 0.39 +- 0.03
Tmax: 0.21 +- 0.04
Trends from Jan 2000 till Dec 2024:
Tmin: 0.78 +- 0.12
Tmax: 0.82 +- 0.15
Trends from Jan 2010 till Dec 2024:
Tmin: 0.51 +- 0.30
Tmax: 0.75 +- 0.34
This is very volatile.
A chart of the anomalies:
https://drive.google.com/file/d/1qI4ihMI2QBOja1I0OkMdpTwdKxdIpIk8/view
Every time Musk blasts one of his rockets into the Stratosphere, it leaves behind tons of water vapor, the product of combustion. This raises the equivalent emissions height which causes surface warming which is evident mostly at night but is mitigated in daytime because more of the greenhouse effect now takes place in the Stratosphere.
The Hunga Tonga eruption hurled 150 Mt into the stratosphere.
How many Musk rockets are needed to achieve the same effect?
Just asking :–)
Hunga Tonga eruption hurled 150 Mt of water vapor into the stratosphere but the temperature didn’t start to increase until a year later.
You’re right, Hunga-Tonga was the real influencer.
The LT and surface temperatures did not increase due to water vapor injection alone, as ‘predicted’ in various articles, because the cooling of the stratosphere caused by water vapor injection is largely offset by the catalytic effect of stratospheric water vapor on the formation of sulfur dioxide aerosols.
Moreover, HT aerosols analysis showed that they were smaller than those produced by Pinatubo, leading to a better backscattering of incoming sunlight, hence resulting in better cooling of the atmospheric layers below.
*
If the stratosphere had merely cooled, the lower stratosphere layer observed by UAH would also look very different since 2023.
This layer has experienced more pronounced cooling phases in the past, and, more importantly, it is difficult to explain why a small cooling of the stratosphere led to such a rise in the lower troposphere compared to the small cooling of the troposphere due to the enormous warming of the stratosphere caused by the eruptions of El Chichon and Pinatubo, respectively.
Double standards, one might say!
Asking for a friend –
Hunga Tonga eruption question – can someone give me a simple answer, if one is an available? My knee jerk thought was that, of course, this would cause cooling, due to the massive quantity of particles thrown into the atmosphere, raising the earth’s albedo, reflecting sunlight back into space. Back in the Stone Age (late 60s and early 70s) when I was intimately involved with this stuff, we were concerned about “the coming ice age”, caused by all the particulates that fossil fuel consumption was contributing to the atmosphere. Huge eruptions in the past have caused noticeable short term world wide increases. Why the talk of warming from water vapor and sulphuric dioxide.
Clarifying the question of my earlier post today (Sept 10) – eruptions causing increases in particles and albedo, leading to cooler temps.
“Hunga Tonga eruption question – can someone give me a simple answer, if one is an available?”
The simple answer is that aerosols (e.g. sulfur dioxide) have a cooling effect and stratospheric water vapor has a warming effect, so the net effect depends upon which dominates.
This is addressed, for instance, in Schoeberl 2023
https://agupubs.onlinelibrary.wiley.com/doi/full/10.1029/2023GL104634
The various studies I’ve seen estimate the net effect of Hunga Tonga on global temperature to have been small.
Here is the comparison of UAH 6.1 data for the lower stratosphere (LS) and the lower troposphere (LT):
https://drive.google.com/file/d/1jFVD4AOyXQXIAotsDflm6ISagb5SpOtb/view
Mark B
I really have to share your view (and ultimately that of Roy Spencer) regarding the rather weak impact of HTE on the global climate.
*
Nevertheless, I had the somewhat trivial idea that it would be fair enough to measure this stratospheric impact by calculating month by month the difference between anomalies in the lower stratosphere and the lower troposphere:
https://drive.google.com/file/d/1_SUeu31DmX_oYhZtyneNHEYDuaHRgzMl/view
*
It is now definitely clear that the effects of the HTE were rather weak compared to the surface eruptions of El Chichón (1982) and Pinatubo (1991); not only when considering the differences between peaks and drops, but even more so when considering the surfaces visible between the paths to and from them, which we can estimate by summing the anomalies between the respective starting and ending points.
*
This also definitely confirms how superficial the appreciation of HTE’s climate impact solely based on the amounts of statospheric water vapor finally is, clearly unlike endlessly shown by lots of posters at WUWT and on this blog, especially by climate ‘hoax’ specialists like Clint R and Richard M.
*
Interesting is by the way the difference between the stratospheric anomalies during the 1997/98 and 2015/16 El Niño periods.
I love the phrase “Boomers will not notice that”, that Roy Uses.
Being Gen X and living in Rural UK, I frequently have to point out that these hottest years aren’t any warmer than the ones in my youth, in fact being at school during the seventies I remember the really warm years and having stand pipes for the water, which despite increased consumption from an increased population we haven’t come close to in this dry year, although we have been asked to cut consumption.
I do know my local city has warmed, but I don’t visit unless I have to, I find the whole experience of city life awful. But my local city has gone from lots of open park areas to small tower blocks and loads of car parks.
these are trapping the heat from the day and releasing it at night during the summer months.
The most interesting bit is I can see a 4 degree rise when I drive into the city.
Dr. Spencer, Do you (or anyone you know of) factor in humidity in the analysis. Houston, TX (and to some extent Huntsville) has lower high temperatures than more arid places in Texas, while the low temperatures at night are not far from the highs during the day in Houston and dramatically different in arid regions.
Has the humidity in the DC area during the hot days in the summer increased over time?
Conitinuing the ‘we don’t need to know’ policies,
“The Environmental Protection Agency moved on Friday to stop requiring thousands of polluting facilities to report the amount of heat-trapping greenhouse gases that they release into the air.
The E.P.A. proposal would end requirements for thousands of coal-burning power plants, oil refineries, steel mills and other industrial facilities across the country. The government has been collecting this data since 2010 and it is a key tool to track carbon dioxide, methane and other gases that are driving climate change.”
Great news! Finally some common sense from GOV.
Some stupid MAGAmaniacs sure will love this comment written today by a reader of the French newspaper ‘Le Figaro’:
” There have been 47 school shootings since the beginning of the year.
Charlie Kirk’s position on the free movement of guns is very clear:
I think it’s worth it. I think it’s worth having a cost of, unfortunately, some gun deaths every single year so that we can have the Second Amendment to protect our other God-given rights. ”
*
Another source:
https://www.instagram.com/reel/DOb4QF4CcCG/
An irrefutable Addendum
The Gun’s Eulogy For Charlie Kirk
To the man who got exactly what he worked for and wanted:
https://tinyurl.com/No-1st-without-the-2nd
https://frederickjoseph.substack.com/p/the-guns-eulogy-for-charlie-kirk
You can always count on Binditard to bring the most stupid lowest class remarks
I have much more to comment on this filthy trash, but I will start with this:
https://www.wltx.com/article/news/local/fyi/read-andy-rooneys-60-minutes-essay-on-france/101-384287800
You can’t beat the French when it comes to food, fashion, wine or perfume, but they lost their license to have an opinion on world affairs years ago. They may even be selling stuff to Iraq and don’t want to hurt business. The French are simply not reliable partners in a world where the good people in it ought to be working together. Americans may come off as international jerks sometimes but we’re usually trying to do the right thing. The French lost WW II to the Germans in about 20 minutes. Along with the British, we got into the war and had about 150,000 guys killed getting their country back for them. We fought all across France, and the Germans finally surrendered in a French schoolhouse. You’d think that school building in Reims would be a great tourist attraction but it isn’t. The French seem embarrassed by it. They don’t want to call attention to the fact that we freed them from German occupation. I heard Steven Spielberg say the French wouldn’t even let him film the D-Day scenes in “Saving Private Ryan” on the Normandy beaches. They want people to forget the price we paid getting their country back for them. Americans have a right to protest going to war with Iraq. The French do not. They owe us the independence they flaunt in our face at the U.N. I went into Paris with American troops the day we liberated it, Aug. 25, 1944. It was one of the great days in the history of the world. French women showered American soldiers with kisses, at the very least. The next day, the pompous Charles de Gaulle marched down the mile long Champs Elysee to the Place de la Concorde as if he had liberated France himself. I was there, squeezed in among a hundred tanks we’d given the Free French Army that we brought in with us. Suddenly there were sniper shots from the top of a building. Thousands of Frenchmen who had come to see de Gaulle scrambled to get under something. I got under an Army truck myself. The tank gunners opened fire on the building where the shots had come from, firing mindlessly at nothing. It was a wild scene that lasted, maybe, 10 minutes. When we go to Paris every couple of years now, I rent a car. I drive around the Place de la Concorde and when some French driver blows his horn for me to get out of his way, I just smile and say to myself, “Go ahead, Pierre. Be my guest. I know something about this very place you’ll never know.” The French have not earned their right to oppose President Bush’s plans to attack Iraq. On the other hand, I have.
Shorter Rooney: “I know all about Babe Ruth and Lou Gehrig, but today’s baseball stars are all guys named Rodriguez to me.”
One of the issues that Charlie Kirk was concerned about was the disproportionate number of transgender mass shootings. Reality is sometimes stranger than fiction:
https://www.msn.com/en-us/crime/general/alleged-kirk-shooter-tyler-robinson-lived-with-transgender-partner/ar-AA1Muk6s
The late Charlie Kirk’s alleged shooter Tyler Robinson lived with a transgender-identifying partner, a source familiar confirmed to the Washington Examiner.
Robinson’s roommate is a biological male who identifies as a female, and is cooperating with the FBI on their investigation. The bureau had texts between the shooter and the person that helped them confirm that Robinson is the shooter.
https://nypost.com/2025/09/13/us-news/charlie-kirk-shooter-tyler-robinson-lived-with-transgender-partner/
“concerned about was the disproportionate number of transgender mass shootings.”
Fake news. Where is the evidence for that?
It is just, as usual, ginning up of hatred and fear for a whole group of people due to the actions of one individual.
Whether it is highlighting the murder of a pretty white woman by a deranged black guy, or by an illegal immigrant, the right-wing media has an audience primed and ready for any hasty generalization.
https://nypost.com/2025/09/13/us-news/charlie-kirk-latest-victim-of-shooting-committed-by-trans-people-and-advocates/
Our Ivy Leaguer is in for a big surprise when he’ll discover Groypers.
Because Nate is a disgusting liar, I need to point out that he dishonestly trimmed the quote as he always does to try to change the meaning. The quote is this:
“One of the issues that Charlie Kirk was concerned about…”
Everything after the three dots is what Charlie Kirk was concerned about, not what I think, what anybody else thinks, or most importantly, what is real.
It is what he thought. Get that straight Nate. Stop lying!
Our Ivy Leaguer is too old to get any of this:
https://www.newsweek.com/groyper-charlie-kirk-shooting-nick-fuentes-2129114
The vast majority of mass murders are commited by straight males.
Perhaps, therefore, we need to focus our ire on that group.
https://www.politifact.com/article/2025/sep/09/trans-people-mass-shootings-gun-violence/
Lets’s fact check your ‘disprportionate number of transgender mass shootings’
https://www.politifact.com/article/2025/sep/09/trans-people-mass-shootings-gun-violence/
I could write a lengthy essay on the strength and power of the US Constitution, but for the haters it would have no meaning. Jealousy in Europe of our success is legendary, so I will just move on. The fact remains that an assassination with a German hunting rifle has nothing at all to do with the Second Amendment. It is purely a First Amendment issue. Even some of the Europeans might agree with this.
The best quote I have seen, that has some question about its origin, although often repeated, is this: “I may disapprove of what you say, but I defend to the death your right to say it.”
“I may disapprove of what you say, but I defend to the death your right to say it.”
I agree. And Kirk seemed to embrace this notion.
But some in the government do not agree.
https://www.democracydocket.com/news-alerts/trump-charlie-kirk-killing-political-crackdown-political-opponents/
“The extreme rhetoric has raised fears that Trump and his allies will use Kirk’s killing as a pretext to attack their political opponents, suppress liberal political activity and suspend democratic rights.”
”
Menu
News
White House
Seizing on Kirk Killing, Trump and Allies Pledge a Crackdown on Political Opponents
By Jacob Knutson
September 11, 2025
Trump on stage with Charlie Kirk in Florida in 2023. (Photo: Joe Raedle/Getty Images)
President Donald Trump and leading figures on the far-right are calling for a crackdown on their political opponents in response to the killing of conservative activist Charlie Kirk.
Trump issued a broad call to go after “organizations that fund … and support” political violence, while a top MAGA leader called for the administration to “prosecute every single leftist organization.”
Kirk, 31, was fatally shot Wednesday while speaking at a college in Utah. The ghastly act of political violence has been widely condemned by elected officials across the political spectrum.
The calls for revenge against the political left came before authorities had a suspect in custody. FBI officials said Thursday morning they have identified, but have yet to apprehend, a subject but did recover a rifle that they believe was used in the shooting.
The extreme rhetoric has raised fears that Trump and his allies will use Kirk’s killing as a pretext to attack their political opponents, suppress liberal political activity and suspend democratic rights.
Among the calls, prominent voices on the MAGA right have demanded vengeance in the form suspending left-leaning political organizations, sending the military to Democratic cities and additional violence.
Trump, in a taped address from the Oval Office Wednesday night, blamed “the radical left” for Kirk’s murder and terrorism — a term he routinely uses to refer to his political rivals.
“For years those on the radical left have compared wonderful Americans like Charlie to Nazis and the world’s worst mass murderers and criminals,” Trump said. “This kind of rhetoric is directly responsible for the terrorism that we’re seeing in our country.”
The president went further, vowing to investigate undefined “organizations” as a reaction to Kirk’s murder.
“My administration will find each and every one of those who contributed to this atrocity and to other political violence, including the organizations that fund it and support it,” he said.
“Radical-left political violence has hurt too many innocent people and taken too many lives,” the president added.
Trump connected Kirk’s murder with other instances of political violence against high-profile conservatives, including the assassination attempt against him in Butler, Pennsylvania, during the 2024 election campaign.
Trump did not mention recent political violence against Democrats, including the June killing of Melissa Hortman, the former Democratic speaker of the Minnesota House of Representatives.
Trump’s commitment to investigate “organizations” echoed claims made by Christopher Rufo, a prominent conservative activist who has close ties to the Trump White House.
“The last time the radical Left orchestrated a wave of violence and terror, J. Edgar Hoover shut it all down within a few years,” Rufo said. “It is time, within the confines of the law, to infiltrate, disrupt, arrest, and incarcerate all of those who are responsible for this chaos.”
Elon Musk, a former Trump administration official and one of the richest people in the world, claimed on his social media platform that “the Left is the party of murder.”
In a separate post, Musk advocated for violence.
“If they won’t leave us in peace, then our choice is fight or die,” Musk said without specifying who “they” were.
“Laura Loomer, a far-right conspiracy theorist with significant though ill-defined power within the White House, said the Trump administration must “prosecute every single leftist organization” in response to Kirk’s killing.”
”
Menu
News
White House
Seizing on Kirk Killing, Trump and Allies Pledge a Crackdown on Political Opponents
By Jacob Knutson
September 11, 2025
Trump on stage with Charlie Kirk in Florida in 2023. (Photo: Joe Raedle/Getty Images)
President Donald Trump and leading figures on the far-right are calling for a crackdown on their political opponents in response to the killing of conservative activist Charlie Kirk.
Trump issued a broad call to go after “organizations that fund … and support” political violence, while a top MAGA leader called for the administration to “prosecute every single leftist organization.”
Kirk, 31, was fatally shot Wednesday while speaking at a college in Utah. The ghastly act of political violence has been widely condemned by elected officials across the political spectrum.
The calls for revenge against the political left came before authorities had a suspect in custody. FBI officials said Thursday morning they have identified, but have yet to apprehend, a subject but did recover a rifle that they believe was used in the shooting.
The extreme rhetoric has raised fears that Trump and his allies will use Kirk’s killing as a pretext to attack their political opponents, suppress liberal political activity and suspend democratic rights.
Among the calls, prominent voices on the MAGA right have demanded vengeance in the form suspending left-leaning political organizations, sending the military to Democratic cities and additional violence.
Trump, in a taped address from the Oval Office Wednesday night, blamed “the radical left” for Kirk’s murder and terrorism — a term he routinely uses to refer to his political rivals.
“For years those on the radical left have compared wonderful Americans like Charlie to Nazis and the world’s worst mass murderers and criminals,” Trump said. “This kind of rhetoric is directly responsible for the terrorism that we’re seeing in our country.”
The president went further, vowing to investigate undefined “organizations” as a reaction to Kirk’s murder.
“My administration will find each and every one of those who contributed to this atrocity and to other political violence, including the organizations that fund it and support it,” he said.
“Radical-left political violence has hurt too many innocent people and taken too many lives,” the president added.
Trump connected Kirk’s murder with other instances of political violence against high-profile conservatives, including the assassination attempt against him in Butler, Pennsylvania, during the 2024 election campaign.
Trump did not mention recent political violence against Democrats, including the June killing of Melissa Hortman, the former Democratic speaker of the Minnesota House of Representatives.
Trump’s commitment to investigate “organizations” echoed claims made by Christopher Rufo, a prominent conservative activist who has close ties to the Trump White House.
“The last time the radical Left orchestrated a wave of violence and terror, J. Edgar Hoover shut it all down within a few years,” Rufo said. “It is time, within the confines of the law, to infiltrate, disrupt, arrest, and incarcerate all of those who are responsible for this chaos.”
Elon Musk, a former Trump administration official and one of the richest people in the world, claimed on his social media platform that “the Left is the party of murder.”
In a separate post, Musk advocated for violence.
“If they won’t leave us in peace, then our choice is fight or die,” Musk said without specifying who “they” were.
Laura Loomer, a far-right conspiracy theorist with significant though ill-defined power within the White House, said the Trump administration must “prosecute every single leftist organization” in response to Kirk’s killing.
“We must shut these lunatic leftists down. Once and for all,” Loomer claimed. “The Left is a national security threat.”
And the far-right influencer Mike Cernovich called on Congress to probe “every billionaire funding left extremism.”
The rhetoric surrounding Kirk’s death comes as senior White House officials are increasingly associating their opponents with domestic terrorism.
“The Democrat Party is not a political party. It is a domestic extremist organization,” Stephen Miller, Trump’s homeland security advisor, said in a recent Fox News interview unrelated to Kirk’s death.
Kirk’s killing, Miller claimed in a social media post, was the result of an unspecified “ideology” that’s “at war with family and nature” and must be defeated.
“There is an ideology that has steadily been growing in this country which hates everything that is good, righteous and beautiful and celebrates everything that is warped, twisted and depraved,” Miller said.
“The fate of millions depends upon the defeat of this wicked ideology. The fate of our children, our society, our civilization hinges on it,” he added.
The problem with this situation is obvious, but there is no stopping it. As I write, the majority of people remain in their silos of information. The media and the politicians on all sides, radical and centrist, have not skipped a beat. Each side is now laying blame and heaping on additional insults that are intended to demonize the opposition. They all claim it is the other side to blame and they are doing nothing but good.
The problem exists here with much less potential for harm, but still evidence of the divisions in our culture with people making insults and accusations.
For the record, I have never defended Trump as some of you think. Go back and look. I have criticized the way he has been abused by various means, and I have described how that abuse would lead to his current behavior based on mistrust.
An additional tragedy is that a man who was apparently living a fantasy life of gaming and social media, is now sitting in solitary confinement on suicide watch facing the death penalty in Utah. The state still uses a firing squad if lethal injection fails. What an irony? He actually thought he was getting away with it.
The problem is simpler than that –
First, more than 90% of extremist killings are done by right-wing creeps:
https://www.liberation.fr/international/amerique/aux-etats-unis-lextreme-droite-est-impliquee-dans-93-des-meurtres-extremistes-20250913_EJY5W3BD6FCDPEBB3L2LL3NKC4/
Second, troglodytes want to use Charlie as their Reichtag fire, e.g.:
https://bsky.app/profile/grossefeministe.bsky.social/post/3lypuc7hfas2q
It’s still always fun to see Very Serious people backtrack now that they realize one of their freaks did it!
Lawsuit brought by The Environmental Defense Fund and the Union of Concerned Scientists against Energy Secretary and EPA Administrator for Climate Advisory Committee and report authored by Roy Spencer and others.
“But federal law does not permit agencies to create or rely on such secret,
unaccountable groups when engaged in policymaking. In the Federal Advisory Committee Act
(FACA), Congress mandated transparency in the establishment and operation of any federal
advisory committee, including by requiring that the group’s formation be promptly disclosed and
that its meetings, emails, and other records be open to the public. Here, Defendants did not
disclose the Climate Working Group’s existence until months after it began working, and not a
single meeting or record has been made public other than the group’s report. Defendants also
violated FACA’s prohibition on stacking an advisory committee with adherents of only one point
of view; the Climate Working Group’s members were all chosen for their skepticism of climate
science, and the group does not have a single member that agrees with the consensus of the
overwhelming majority of the scientific community on the effects of climate change.”
This seems to have led DOE to disband the advisory group.
I wonder if Roy has any comment about this?
It was never meant to be a pension plan.
Just catching up here, sorry to be late.
The HTE was discussed above. The correlation is seen by comparing the link supplied by Richard M —
https://acd-ext.gsfc.nasa.gov/Data_services/met/qbo/h2o_MLS_vLAT_qbo_75S-75N_10hPa.pdf
—with the UAH global graph.
The causation comes with an understanding of radiative physics. It’s interesting how some believe CO2 warms but so much water vapor in the stratosphere does not warm. No one said beliefs have to be consistent….
“some believe CO2 warms but so much water vapor in the stratosphere does not warm”
But both are assumed to be radiative components.
“The causation comes with an understanding of radiative physics”
which is completely vague.
Most of science is “vague” to you, child. Just like reality….
Vagueness is the best friend of obfuscators..
Murder, stalking, insults, and false accusations are close friends with censorship.
Nate
The best part of this is that ALL 100% deniers of the greenhouse effect (even in the weakest form advocated by Roy Spencer), human-caused warming, and even climate change have so far vigorously discredited, denigrated, and denied the results of ALL radiation physics textbooks and articles ever referenced on this blog.
I’m thinking in particular of Robertson and… Clint R – but also of all those who silently support them in the background.
*
It’s also interesting to note that all deniers repeatedly talk about “CO2 warming,” even when it’s not even mentioned.
This inevitably leads to the assumption that they all deny it because of their general, direct, or indirect use of fossil fuels.
*
We also have to use fossil fuels at home, as we rent a small house that is heated exclusively with gas because the previous owners were too stupid to take advantage of the very generous government subsidies for wind and solar energy that have been in place for over 20 years.
Bindi, you can’t link to even one place where I got the physics wrong. All you’ve got are insults and false accusations.
Murder, stalking, insults, and false accusations are close friends with censorship. And cultism.
This Video is a celebration of the climate scientists fighting for the truth. The Nation and Civilization as a whole owe them a great deal of gratitude.
https://app.screencast.com/jwCizhbKhiVVH
No one is prevented from presenting their alternate theories on Youtube or wherever.
Schools have enough on their plate already just to get kids up to speed on the basics. I see no good reason for them to give equal time to anyone with a ‘theory’ that contradicts textbook science.
If so, then Flat Earthers and every inventer of a ‘Free energy from water’ contraption will want equal time.
Students should be thought how to think, not what to think. To conflate Flat Earth with critics of catastrophic warming is not even close, especially when that viewpoint is now the prevailing policy at DOE, EPA, and Interior. The days of the schools being abused as state-sponsored propaganda factories is over. Thank God! Free speech is the fuel of a democracy. Turning Point is exploding in schools all over America (the number of chapters has doubled since Kirk’s assassination). Let’s discuss these matters in a civil way, not try to censor, impugn, fire, or even kill. Let the best ideas win!
Charlie was a champion of free speech and anyone who says otherwise will be fired.
“especially when that viewpoint is now the prevailing policy at DOE, EPA, and Interior.”
Policy aint science. Partcularly from this Energy Secretary who doesnt understand basic energy science. And violated the law in the process of developing that policy.
https://www.drroyspencer.com/2025/09/the-hottest-summer-days-in-d-c-have-not-gotten-hotter-in-last-40-years/#comment-1714822
“Students should be thought how to think, not what to think.”
Ideally yes.
“that viewpoint is now the prevailing policy at DOE, EPA, and Interior.”
So you want them to blindly accept what the government tells them to believe?
How bout on vaccines?
This is the most anti-science govt we have had in my memory.
“Charlie was a champion of free speech and anyone who says otherwise will be fired.” – says Willard
Charlie was a champion of free speech and of openly advocating for Jesus Christ. Both are protected in the First Amendment, celebrated by our Founders, and a keystone of a democracy and a civil society. Anyone who celebrated his murder/assassination/martyrdom should be fired and shunned in “America” (sorry, Gordon). We also should go back and do the same to anyone who celebrated the murder of the United Healthcare exec. We have some very sick people in this country and when we look back on Kirk’s murder, we will see that it was a true “Turning Point”. I would say, offenders should have the opportunity to get a second chance (not at the same job) if they publicly, sincerely repent of their truly awful sentiment.
Oh, yeah, we should reserve the description “nazi” and comparisons to Hitler to actual members of a Nazi party. Calling someone “Nazi” or like Hitler dehumanizes that person (or party) and sets them up as targets for all sorts of nasty things, right up to murder. I hope it becomes the new “N” word.
I wonder how the left likes their “cancel culture” now?
Thomas,
You’re too old to know anything about Charlie, except perhaps the rose-tainted glimpses you got from your right wing echo chamber. He’s nothing like Charb, Cabu, Honor’e, Tignous, or Wolinski, none of whom you never read either. Where can we read you flag waving when Melissa Hortman was assassinated, btw?
Meanwhile, Bondi is going after what she incorrectly calls “hate speech”, and Donald wants her to go after people he believes treated him “unfairly”.
As for your silly “but denier”, it’s nor worth my time:
https://climateball.net/but-denier/
“Free speech is the fuel of a democracy.”
Then you’re for it. Great.
“Anyone who celebrated his murder/assassination/martyrdom should be fired and shunned”
So not for it it offends you.
I see.
Good example of trying to sneak government sponsored misinformation into the classroom.
https://apnews.com/article/oklahoma-standards-election-misinformation-ryan-walters-bd2f5336aeada1b3b9f353c0b9e048a9
Back at the ranch:
On Aug. 1, the EPA outlined in the federal register its justification for eliminating the Endangerment Finding. The agency cited a litany of issues, from incomplete scientific evidence supporting the need for such rule-making and an undervaluation of the supposed benefits of carbon dioxide pollution to claims that federal support for the construction of electric vehicles poses an outsized burden on the consumer. Enforcing the Clean Air Act protections through the Endangerment Finding has totaled $1 trillion in regulations, the agency argues, though it’s unclear how the EPA arrived at that number.
https://prismreports.org/2025/09/15/epa-endangerment-finding-emissions/
Which other deregulations Roy and JC’s “examination” will justify?
Leftist dogma that radicalized GOV under Obama:
Trump is now dismantling that nonsense. It’s nice to have some common-sense back in the White House.
Puffman just wants to make Project 2025 great again:
https://www.govinfo.gov/content/pkg/FR-2025-08-01/pdf/2025-14572.pdf
That’s obviously not enough:
https://bsky.app/profile/sharonk.bsky.social/post/3lysuzsn2vs2e
That’ll bring jobs back!
It is clearly out of doubt that the Hunga Tonga HH eruption in January 2022 blasted about 150 Mt water (not: water vapor) into the stratosphere: it has been observed many times at many places.
There is broad consensus about stratospheric warming leading to tropospheric cooling and conversely that the former’s cooling leads to the latter’s warming.
But this does not at all mean that contrary to some scientifically unsupported superficial allegations, HTE’s effect alone hasd led to the warming phase observed in the lower troposphere or the surface.
*
1. Influence of water injection in to the stratosphere on the building of aerosols out of sulphur dioxide
The LT and surface temperatures did not increase due to water injection alone, as ‘predicted’ in various articles, because the cooling of the stratosphere caused by water injection is largely offset by the catalytic effect of stratospheric water on the formation of sulfur dioxide aerosols.
Moreover, HTE’s aerosol analysis showed that they were smaller than those produced by Pinatubo’s eruption, leading to a better backscattering of incoming solar radiation, hence resulting in a better cooling of the atmospheric layers below.
If the stratosphere had merely cooled, the lower stratosphere layer observed by UAH would also look very different since 2023.
*
Here is a look at a comparison of all four atmospheric layers watched at UAH for the period 1990-1995, 100% encompassing the Pinatubo eruption:
https://drive.google.com/file/d/1kKGeEUa27H3xCvrVHjSzJshm5SpfeACy/view
*
Here is, wrt scaling and period duration, the same comparison for the period 2020-2025, 100% encompassing the Hunga Tonga eruption:
https://drive.google.com/file/d/1WJrazk_mY8xeiSaTznnDOEkVrR2hYrLw/view
*
The comparison 1990-1995 to 2020-2025 clearly shows that since the Honga Tonga eruption, there has been no cooling anywhere in the lower stratosphere that (1) resulted from the cooling of higher layers and (2) corresponded to, and could therefore have caused, a simultaneous and uniform warming of all three underlying layers.
*
Moreover, it is difficult to explain why a small cooling of the stratosphere led to such a rise in the lower troposphere compared to the small cooling of the troposphere due to the enormous warming of the stratosphere caused by the eruptions of El Chichon and Pinatubo, respectively.
*
2. Calculating the monthly differences between UAH 6.1 LS and UAH6.1 LT to compare HTE’s influence on the lower troposphere versus that of El Chichón and Pinatubo
https://drive.google.com/thumbnail?id=1_SUeu31DmX_oYhZtyneNHEYDuaHRgzMl
*
This picture makes clear that the effects of the HTE were rather weak compared to the surface eruptions of El Chichón (1982) and Pinatubo (1991); not only when considering the differences between peaks and drops, but even more so when considering the surfaces enclosed by the month-to-month lines to and from them: surfaces which we can roughly estimate by summing the anomalies between the respective starting and ending points.
*
This also definitely confirms how superficial the appreciation of HTE’s climate impact solely based on the amounts of statospheric water vapor finally is, clearly unlike endlessly shown by lots of posters at WUWT and on this blog, especially by climate ‘hoax’ specialists like Clint R and Richard M.
*
But people like Clint R always deny others’ arguments without any technical let alone scientific contradiction, and therefore endlessly repeat their own, simple-minded ones.
Below
” 2. Calculating the monthly differences between UAH 6.1 LS and UAH6.1 LT to compare HTE’s influence on the lower troposphere versus that of El Chichón and Pinatubo ”
the thumbnail link
https://drive.google.com/thumbnail?id=1_SUeu31DmX_oYhZtyneNHEYDuaHRgzMl
actually should read
https://drive.google.com/file/d/1_SUeu31DmX_oYhZtyneNHEYDuaHRgzMl/view
You’re just clogging the blog with all your disjointed, rambling. If you were really interested in science, you would stop all the insults and false accusations, and make an effort to learn.
I won’t hold my breath….
ClintR
Observation proves you wrong.
Watch videos of athletes throwing the hammer. This is a classic example of “ball on a string”.
You can see that ball rotating as the thrower winds up for the throw and you can see that the ball continues to rotate after release.
Sorry Ent, but observations prove YOU wrong.
The ball is not rotating on its axis in the wind up. If it were, the tether (string) would wrap around it. After release, angular momentum is transferred to the ball through the mechanical attachment.
The fact that the ball is rotating on its axis after release is just one more debunk for lunar spinning, as you would clearly see both sides of it, viewed from a distance.
This is all over your head, so don’t expect to understand it. You believe passenger jets fly backward, among many other false beliefs.
And, you’re unable to learn….
It was a priori clear that Clint R wouldn’t provide a technically viable answer, as he lacks the necessary skills: these are limited to deliberately misrepresenting scientific results.
No wonder, then, that he can’t resist responding with his usual, inane babble, although this time I missed his favorite keywords like “child,” “cult,” etc.
*
But… Clint R is by no means the only one who constantly posts anti-science nonsense on this blog!
Wrong again bindi. I’ve provided plenty of technical knowledge. I make it so simple even children can understand it, like a “ball-on-a-string” to model “orbiting without spin”. I can explain it, but it’s your job to understand it.
Is it even possible for you to make a comment without insults and false accusations?
” Former New York prosecutor Maurene Comey sues over firing by Justice Department
The lawsuit, filed in federal court in Manhattan, alleges that the Justice Department offered no rationale for Maurene Comey’s firing and that it was a political move. ”
*
There will be many, many, many more news stories like this in the near future.
Of course, not in Murdoch’s press empire.
Liberal lunatics now crying rivers
https://youtu.be/FbzWzmyquuE
As usual: one more of the dachshund’s meaningless posts.
Childish polemics at the level of all these megadumb German ultra far right wing boyzs.
Weiter so, du Knallkopp.
I am not German nor ultra right wing.
As usual, Blindsley H00d aka ‘RLH’ is solely interested in telling us about himself.
The fact that
” Maurene Comey, a federal prosecutor who prosecuted the criminal cases against Jeffrey Epstein and Ghislaine Maxwell, is challenging her abrupt July dismissal in a lawsuit challenging Donald J. Trump’s claim to expansive presidential powers ”
doesn’t interest him in the slightest.
*
With the help of ‘David’ and ‘Mark B’, he could have in between managed to correct the mistakes in his median running mean computing software that he was until now unable to.
Did he… oh, really?
The upper limit to water-vapor-increase from warming is bounded by the Clausius-Clapeyron relation. Measured water vapor increase is about 40 % more than possible from just planet warming as indicated by UAH measurements. This FALSIFIES the assumption by many climate scientists that water vapor increase is just feedback from temperature increase caused by CO2 increase. Verification is at https://watervaporandwarming.blogspot.com
Climate has always changed and always will. The mistake is blaming Global Warming on burning fossil fuels. Human activity has CONTRIBUTED to Global Warming by the human CONTRIBUTION to increasing water vapor. According to NASA/RSS measurements, water vapor has been on an increasing trend of about 1.5 % per decade since before 1988.
SOLAR MINIMUM UPDATE
[T]he boom times Donald has promised U.S. fossil fuel producers have not materialized. In fact, the industry is headed in the opposite direction: In recent months, Chevron said it would cut as much as one-fifth of its workforce, ConocoPhillips announced plans to let go of up to a quarter of its workforce by the end of the year, and Halliburton began its own round of layoffs. Across the sector, companies have also been reining in spending, cutting capital expenditures, pausing or canceling major projects, and reducing rig counts.
https://grist.org/energy/oil-prices-trump-fossil-fuel-drilling/
Win, baby, win!
Uninformed people do not realize that one year of maintenance and upkeep represents a very significant cost compared to the market value or purchase price of a refinery. Without a corporate infrastructure with a crude oil purchasing and a shipping organization, it makes no sense for a private investor to own a refinery.
https://www.bloomberg.com/news/articles/2025-09-09/california-may-pay-valero-hundreds-of-millions-to-keep-sf-bay-area-refinery-open
https://dailycaller.com/2025/09/09/california-lawmakers-squeezed-refineries-out-now-scramble-to-pay-one-well-known-company-to-keep-theirs-running/
After years of enforcing stringent regulations that helped force major refineries to close, California Democrats are now reportedly considering paying Valero millions to keep a San Francisco-area fuel plant afloat.
With two major refineries already scheduled to shut down and strict regulations in place, concerns about California’s already high gas prices have become a top issue for lawmakers. According to a Bloomberg report Tuesday, sources familiar with the private deliberations said lawmakers have discussed whether to pay Valero between $80 million and $200 million in state funds to keep its Benicia refinery operating.
Our Ivy leaguer might also like:
“The US government is trying to strangle renewables to save fossil fuels. Donald wants other countries to do the same.”
https://drilled.media/news/anti-renewables
Donald likes to win more than to let open markets do their thing.
Speaking of other countries, solar overtook gas to become Hungary’s second largest electricity source:
https://ourworldindata.org/data-insights/solar-overtakes-gas-to-become-hungarys-second-largest-electricity-source
Leftists, no doubt.
Dr.Spencer, Who, if anyone, has gone through and compared humidity levels with the temperatures? In humid areas the highs don’t get much higher, but the lows are much higher than if the air was dryer. It takes much more total heat to raise the temperature of moist air. How much increased humidity is modeled in the climate models? I would guess that there would be more evaporation and so, more total water vapor in the air (of course, if it’s cooler it rains). Thus, higher nighttime temperatures. (typo-ed my name on the other post)
Net electricity production in Germoney in 2023:
https://i.postimg.cc/0jtV6y8B/Public-net-electricity-production-in-Germany-in-2023.png
In 2024:
https://i.postimg.cc/yx9fVh3n/Public-net-electricity-production-in-Germany-in-2024.png
*
More leftists, no doubt again.
*
It’s not so terribly long ago that the all-time lying Trump~ing boy shout on his US president candidate meeting:
” Every two weeks, the Germans connect a new coal-fired power plant to their grid! ”
More dumb than that you die, Frogs woud say.
But millions of MAGAmaniacs believed him because they believe everything he says.
Something for the orbital mechanics fans.
https://theconversation.com/the-moon-is-getting-slightly-farther-away-from-the-earth-each-year-a-physicist-explains-why-262106
Ent found something else he can’t understand. That’s not hard for him to do….
Ent’s the one that believes passengers jets fly backward, so it’s not hard for him to believe gravity can provide a torque.
Trump is again trying to take down his critics in the Press. He is again suing the New York Times, though he failed twice previously.
They clearly have no intention of backing down.
Two new stories are good examples.
“Trump Invokes Kirk’s Killing in Justifying Measures to Silence Opponents.
“In the wake of Charlie Kirk’s killing, President Trump and his allies have laid out a broad plan to target liberal groups, monitor speech, revoke visas and designate certain groups as domestic terrorists.”
and
Trump World’s Deals With the U.A.E.
“We dug deeper into lucrative transactions involving the Trump family’s cryptocurrency firm and the United Arab Emirates.
“The U.A.E got A.I. chips; Team Trump
got crypto riches”
Nyt.com
It is hard not to understand this latter artcle as a story of pure corruption. Anybody want to try to defend it?
Cleansing of insane liberals, it was long overdue
Eboy’s missing the authoritarians of his dad’s youth.
Then you’re ok with your government being corrupt, Eben?
What some people fail to understand, because they lacked the opportunity to learn, for example, from Germany’s almost 100-year past, is that those who call for a ‘purge of insane liberals‘ have often enough become themselves victims of what they have (too) loudly praised.
Dictators and their henchmen, strangely enough, dislike people who overly butter them up.
One after another
https://youtu.be/CM1wDZ6eEcc
We will get all of you
https://youtu.be/UU7NOkpR_h8
Apparently the dachshund is even by dimensions dumber and mentally more insane than I thought.
Ce blog obtient exactement ce qu'il mérite: la démonstration quotidienne de la bêtise nauséabonde de certains participants.
Liberal whackos putting themself on display for the whole world to see how utterly stoopid they are
https://youtu.be/zr7JTXJrn7I
BACK AT THE RANCH
Two things Kash didn’t know.
1) Who Dylan Roof is.
2) That Shein, in which he has a significant investment, is a Chinese company.
https://bsky.app/profile/emptywheel.bsky.social/post/3lz2dytmfds2l
Simple assessment demonstrates that burning fossil fuels is not a significant contributor to climate change.
Slope of the regression of the UAH6.1 temperature data from 1988 to Jan 2025 is 0.01648 C°/yr,
In the 37 years this amounts to 0.01648 * 37 = 0.61 C°.
For a WV increase of 0.067 1/1 per C° this results in a per unit WV increase from temperature increase of 0.61 * 0.067 = 0.04086 1/1
The average WV during the 37 years is 28.8 kg/m^2 so the WV increase from temperature increase is 0.04086 * 28.8 = 1.177 kg/m^2
The regression slope of the measured WV increase is 0.0447 kg/m^2 per year
In the 37 years this amounts to 0.0447 * 37 = 1.654 kg/m^2
The measured increase is then 1.654/1.177 = 1.405 or about 40 % more than from just temperature increase.
This FALSIFIES the assumption by many climate scientists that water vapor increase is just feedback from temperature increase caused by CO2 increase.
Here is an example of different media giving different versions of events and opinionated commentary. Which version you like says something about bias. The CNN version contains this raw speculation: “sparking speculation that the owners were trying to curry favor with the administration.” On their news programing, they often follow speculation with their famous “without evidence”, but they don’t do that to themselves. Interesting!
https://www.cnn.com/2025/09/17/media/jimmy-kimmel-charlie-kirk-trump-fcc-brendan-carr
[The stunning decision came just a few hours after the Trump administration official responsible for licensing ABC’s local stations publicly pressured the company to punish Kimmel.
At least two major owners of ABC-affiliated stations subsequently said they would preempt Kimmel’s show, sparking speculation that the owners were trying to curry favor with the administration. The local media conglomerates are each seeking mergers that would require administration approval.
As Kimmel prepared to tape Wednesday night’s episode in Hollywood, ABC decided to pull the plug, much to the astonishment of the entertainment industry.]
https://www.foxnews.com/media/disney-says-jimmy-kimmels-show-will-be-preempted-indefinitely-following-charlie-kirk-assassin-comments
Nexstar Media Group, which owns hundreds of television stations, announced earlier it would preempt Kimmel’s show on its ABC affiliates starting Wednesday night “for the foreseeable future” and would replace it with other programming over his comments about alleged Charlie Kirk assassin Tyler Robinson.
“Mr. Kimmel’s comments about the death of Mr. Kirk are offensive and insensitive at a critical time in our national political discourse, and we do not believe they reflect the spectrum of opinions, views or values of the local communities in which we are located,” Nexstar’s broadcasting chief, Andrew Alford, said in a press release.
“Continuing to give Mr. Kimmel a broadcast platform in the communities we serve is simply not in the public interest at the current time, and we have made the difficult decision to preempt his show in an effort to let cooler heads prevail as we move toward the resumption of respectful, constructive dialogue.”
Yep, Trump is on track following the authoritarian playbook of Orban and others.
Key step: Use govt power to silence media critics.
Tim, if you are a strong supporter of free speech, as you say, you cannot be applauding these moves.
There is a new sheriff in town, so stop dancing on anyone’s grave or you will hear those famous words: “You’re fired!”
If your words affect to the reputation of your employer, there may be unwanted consequences. But that has nothing to do with free speech.
“We can do this the easy way or the hard way,” Carr said. “These companies can find ways to change conduct and take actions on Kimmel, or there’s going to be additional work for the FCC ahead.”
What does FCC stand for, Max?
“But that has nothing to do with free speech.”
Wrong, when your employer and partners are bullied and threatened with govt action, because of criticism of the President, that is about the First Amendment.
The FCC is becoming the Federal Censorship Commission.
There are at least 3 ways to go here for the critics of my comment. You could say that you fully endorse and agree with Kimmel. You could say that you disagree in part or all of it, but it is okay for an entertainer do whatever they want and his employers and representative should just suck it up. Finally, you could say that employment and syndicated representation is also a form of free speech, but I like to see rude comments anyway.
I am open to any other option, but for my part, Jimmy is free to go fully independent any time he wants. I suggest HBO or Showtime where a much higher level of filth is allowed. Otherwise, he has to conform to the standards of common decency that the people paying his salary request. I did not see any comic content. Were people laughing. It seems like pure insult to me.
Yes, the FCC does have a role to enforce those very same standards of decency. It is not a complete free for all on the public airways. There is a very strong history of the FCC doing its job to regulate content.
What specifically did he say to not conform to your standards of common decency?
Remember that late night TV hosts, Carson, Letterman, Jon Stewart, have picked on Presidents and their policies for decades.
We now have the ABC and CBS shows cancelled, and NBC is threatened to be next.
Since Tim cannot tell me what set off his ‘indecency’ alarm, we can check the FCC guidelines:
“Indecent content portrays sexual or excretory organs or activities in a way that is patently offensive but does not meet the three-prong test for obscenity.”
Dont really see how that applies here.
After being called out, Nate continues to behave like a jerk and insult peoples intelligence. I have already stated that Kimmel belongs on cable where they have different standards. My quote involved the term “common decency” which is to intelligent people who are paying attention different than the quote Nate used for his purpose. This is just the typical crap from Nate.
My quote:
“he has to conform to the standards of common decency that the people paying his salary request.”
Try this:
https://en.wiktionary.org/wiki/common_decency
Noun
common decency (countable and uncountable, plural common decencies)
A basic level of politeness and courtesy that is expected of all people.
Synonym: common courtesy
That man didn’t have a shred of common decency.
https://www.fcc.gov/consumers/guides/obscene-indecent-and-profane-broadcasts
Deciding what’s obscene, indecent or profane
Each type of content has a distinct definition:
…Profane content includes “grossly offensive” language that is considered a public nuisance.
Factors in determining how FCC rules apply include the specific nature of the content, the time of day it was broadcast and the context in which the broadcast took place.
Broadcasting obscene content is prohibited by law at all times of the day. Indecent and profane content are prohibited on broadcast TV and radio between 6 a.m. and 10 p.m., when there is a reasonable risk that children may be in the audience.
What about cable, satellite TV and satellite radio?
Because obscenity is not protected by the First Amendment, it is prohibited on cable, satellite and broadcast TV and radio. However, the same rules for indecency and profanity do not apply to cable, satellite TV and satellite radio because they are subscription services.
“My quote involved the term “common decency'”
Sure, which is not regulated by the FCC, as your definitions show.
Look, if the public finds his speech offensive then let the market determine if he should continue…no reason for the govt to censor it.
As Laura Ingraham agreed.
As Ted Cruz concurs.
“After years of complaining about cancel culture, the current administration has taken it to a new and dangerous level by routinely threatening regulatory action against media companies unless they muzzle or fire reporters and commentators it doesn’t like,” former President Barack Obama said Thursday on X.
Yep.
Nate: Only free terrestrial channels are regulated, because they are for all Americans, not just for democrats. There are many satellite, cable and streaming channels for Kimmel to choose from. I hope they replace Kimmel with Conan O’Brien.
So you are ok with the government violating the 1st amendment, as long as its only for broadcast channels?
Why should I make rational and honest comments when Nate insist on behaving as a complete Jerk? Just like Jimmy, he knows he is being belligerent and causing trouble. Oh, wait, Nate likes Kimmel. Got it!.
Gee, if Im being a jerk, then just about every media organization is also. We are simply recognizing what is happening here…and Trump keeps confirming it…why cant you?
Nate Makes Our Ivy Leaguer do it.
In other news:
FED’S MIRAN: REMOVAL OF MIGRANTS WILL HAVE DISINFLATIONARY IMPACT
Next, he’ll ask why would Miran make rational and honest comments when Charlie’s dead.
And Nate is wrong again in referencing Johnny Carson. What would Johnny say? Well here it is from an era when common decency was respected:
https://www.foxnews.com/media/flashback-johnny-carson-warned-against-danger-late-night-shows-preaching-serious-issues
In the resurfaced clip from 1979, “60 Minutes” interviewer Mike Wallace voiced a critique made by some at the time that Carson would “never take a serious controversy,” which Carson had an immediate answer for.
“Now, tell me the last time that Jack Benny, Red Skelton, any comedian, used his show to do serious issues. That’s not what I’m there for. Can’t they see that?” Carson replied. “Why do they think that just because you have a ‘Tonight Show,’ that you must deal in serious issues?
“That’s a danger. It’s a real danger. Once you start that, you start to get that self-important feeling that what you say has great import. And you know, strangely enough, you could use that show as a forum. You could sway people. And I don’t think you should as an entertainer.”
Yep, Carson did make jokes about Presidents, but always just for laughs.
Whereas at the same time SNL was more critical in their political comedy.
Jon Stewart and Jon Oliver are popular and they mix comedy and political points.
But what we are talking about is not what appeals to people, but whether the govt should censor it.
Kimmel is back Tuesday night. I predict it will be the highest rated show in his life (does that include Oscar hosting???). There were reports of serious negotiations over the weekend. Did they make a deal, or did Disney cave in and let him be his normal obnoxious self? Anything less than disgusting rudeness means he has been put on a short leash.
Funny rudeness.
Free speech was so important to MAGA and Trump, until it became expendable.
“Did they make a deal, or did Disney cave in”
The caving in was last week, and it was to govt pressure.
You keep telling us how distasteful you find Kimmel.
But that makes the point that you brought up earlier, that the First Amendment protects speech politically distasteful to the govt, from censorship.
Trump and FCC continue to threaten consequences. That is what concerns many people (from both sides).
Here is the real question Nate. You need to consider this because it makes the perfect argument: How may fairies can dance on the head of a pin? Explain answer using calculations as necessary.
Meanwhile even the usuallu Trump supporting Senate majority leader is pushing back:
Thune condemned the “coercive use of government” in regulating TV programming.
“As a general matter, my view is that the government ought to stay out of the free speech market place unless there are clear violations that violate laws”
“when it comes to the FCC, when it comes to governing authorities and governmental power, it shouldnt be used in a coercive way when it comes to the First Amendment”
Why are you still unable to grasp thus issue?
SOLAR MINIMUM UPDATE
A judge in South Carolina was arrested because he was charged with child sexual abuse material, according to the United States Department of Justice.
James B. Gosnell, Jr., 68, is accused of possession of child sexual abuse material.
He was officially suspended by Chief Justice John Kittredge on Tuesday, according to a court filing.
Investigators with the Department of Homeland Security received a tip from the National Center for Missing and Exploited Children about several financial transactions with a distributor of child sexual abuse material from the United Kingdom. The payments came from a peer-to-peer online money transfer account associated with his phone number, address and email account in November 2024.
[…]
Gosnell is the judge who presided over the bond hearing for Charleston church shooting suspect Dylann Roof, who would later be convicted of the June 18, 2015, shooting deaths of nine parishioners of Mother Emanuel AME Church in downtown Charleston.
https://www.ky3.com/2025/09/16/judge-arrested-after-being-accused-possessing-child-sex-abuse-material-doj-says/
The best way for Donald to win against these leftists would be to shut down the NCMEC.
Dictator’s to do list no. 7
I notice that the fascist wants to designate the antifascists as a terrorist group.
https://www.bbc.co.uk/news/live/cvgje507pn2t
Antifa is an international terrorist organization (Germany, Italy, Russia, Netherlands, Portugal, Spain, Sweden, Switzerland, UK, USA etc.). Only far-leftists and Marxists disagree.
Only an far-leftist would say:
“Donald corrupt tyrant who should honestly be put in prison and/or given the death penalty for his crimes against America.”
Sorry, I misspoke. The original quote mentions Captain Joe, not Donald.
And it’s not by a far-leftist. It’s by Charlie Kirk.
Im old fashioned I guess.
In my day to be a terrorist you had to blow things up, hijack airplanes, take hostages, and at least try to kill people.
Apparently, MaxC is one more of these 100% inexperienced little US boys who never in their life had anything to do with terrorism, let alone with state terrorism.
How political terrorism looks like we first experienced in Germoney with the RAF, the ‘Rote Armee Fraktion’ in the 1970s. He certainly knows few about that.
And what he very certainly knoes even less about is ‘state terrorism’, for example:
https://en.wikipedia.org/wiki/Operation_Condor
Willard: Charlie Kirk frequently accused Joe Biden of committing treason, which is punishable by imprisonment or death, according to U.S. law. (U.S. Code § 2381 – Treason)
In his podcast July 24, 2023, Kirk criticized mainly Kamala Harris, but he also mentioned Joe Biden. Here is what Charlie Kirk actually said about Harris and Biden:
“I know what you’re thinking, we’ve got to get Joe Biden out of the way so we can run up against Kammy. Oh my goodness, is she beatable. It’s like Black Hillary on steroids. Is she Black? I guess she says she’s Caribbean or whatever. Doesn’t matter. She gives these speeches, and it just has this aura of totalitarianism. My team says she is Indian and Caribbean.
I’ll tell you what, she would be a lot easier to beat than Joe Biden. Joe Biden is a bumbling, dementia-filled Alzheimer’s, corrupt, tyrant who should honestly be put in prison and/or given the death penalty for his crimes against America.”
Bindidon: DemocRats’ smear campaign against Charlie Kirk continues. Killing him was not enough. Leaders of the Democratic Party spit words like Nazis and fascists, when they talk about republicans. State socialism and state communism are much deadlier ideologies than state terrorism. Communists have killed hundreds of millions people worldwide (Stalin, Mao, Khmers etc. etc.). And now democrats and Antifa terrorists try to start a new civil war in the USA. They managed to kill Charlie Kirk, but failed to kill Donald Trump. Who’s next victim?
[MAX] Antifa is an international terrorist organization. Only far-leftists and Marxists disagree.
[ALSO MAX] DemocRats’ smear campaign
It’s not a smear if it’s true. But then Max’s relationship with the truth has always been fragile. And to let Charles speak is more than enough:
“I can’t stand the word empathy, actually. I think empathy is a made-up, new age term that – it does a lot of damage.”
That’s how we recognize a true follower of teh Jesus, our first leftist and Marxist zombie.
“They managed to kill Charlie Kirk”
Last I heard they caught the guy who murdered Kirk.
An individual, not a ‘they’.
I overlooked last week this incredibly dumb sentence written by the political genius MaxC:
” Only far-leftists and Marxists disagree. ”
*
There’s no better proof of MaxC’s absolute ignorance of politics.
Quite simply because the gap between far-leftists aka left-wing radicals and Marxists is far, far wider than the microscopic gap between (1) conservatives on the one hand, and (2) the Trump~ing boy and all the MAGAmaniacs who love him to death on the other.
You experience this when you watch the REP majority in both the US House of Representatives and the US Senate willingly offer every day their pink butts to the Trump~ing boy like female baboons.
It’s way, way beyond imagining.
Anyone who wants to understand the Trump'ing boy's constant back-and-forth between boastful threats and complacent capitulations to Putin and the Russian Nomenklatura should consult the information on Trump compiled over decades by Régis Genté.
Régis Genté is a French journalist and writer specializing in the post-Soviet space and the Caucasus region. Based in Tbilisi for 22 years, Régis Genté is the correspondent for the former Soviet Union for RFI, France 24, and numerous other French media outlets, including the right-wing newspaper Le Figaro.
*
In his latest book
Our Man in Washington: Trump in the Hands of the Russians
Régis Genté addresses a question many observers have been asking for a decade: Is Donald Trump working for Russia, for Putin?
In the very first pages, the author emphasizes that Donald Trump is highly predictable from Moscow's perspective. Returning from his first trip to Moscow in 1987, he pleaded for the United States to "stop paying to defend countries that have the means to defend themselves," particularly NATO countries.
Thirty-seven years later, on February 10, 2024, the same Donald Trump, former and perhaps future President of the United States, dropped a geopolitical bombshell on these same NATO allies during a campaign rally in South Carolina:
" Are you deadbeats? (…) No, I won't protect you.
In fact, I will encourage [the Russians] to do whatever they want. "
Régis Genté clarifies that this means no reaction from Washington, whereas NATO specifically provides for solidarity between each member of the Alliance if one of them were to be attacked. This principle is the backbone of European security.
The author notes the cohorts of pro-Russian Russians and Americans who have been circling Trump for four decades: "red mafiosi" who buy luxury apartments in Trump Tower at high prices and launder their money in his casinos (freshly arrived from the USSR in the 1970s, in Brighton Beach, New York), polished ambassadors, spies operating in the United States under the cover of diplomats or bankers, oligarchs, etc.
As for Americans who also admire Russia or simply maintain business ties with Russian bigwigs, they are jostling around Trump's candidate for the 2016 presidential election.
*
The rest please translate by yourself using Google’s translator:
https://cosmopolis.ch/fr/notre-homme-a-washington-trump-dans-la-main-des-russes/
Only a few months ago, Donald told the press he won’t call Minnesota Gov. Tim Walz after the killings of Melissa Hortman and her husband:
https://www.youtube.com/watch?v=f-POfJnbHIs
A waste of time, he said.
Donald still took the time to describe Walz as “whacked out”.
Uggh,
As if the Justice Dept wasnt already politicized enough, Trump fired a US Attny for NOT finding anything to prosecute his political enemies for. And now directly calling on his Atty General to act quickly tp prosecute his enemies not because yhey committed any crime, but because:
“They impeached me twice, and indicted me (5 times!), OVER NOTHING. JUSTICE MUST BE SERVED, NOW!!!”
When are senators going to have the balls to use their legal authority to stop this blatant abuse of his powers?
” When are senators going to have the balls… ”
*
Nate, even if some of them had, would that help?
The problem actually, currently imho is not in the Senate: it’s in the House.
The Senate must approve his US Attorney appointments.
They need to haul in Pam Bondi to answer for her actions, and whether they match her promise of integrity and indepence during her approval hearings.
A propos ‘balls between the legs’…
*
Trump demands Bondi prosecute political foes in Truth Social posts
The messages came after he forced out a U.S. attorney in Virginia who declined to pursue charges against New York Attorney General Letitia James and former FBI director James Comey.
https://www.washingtonpost.com/national-security/2025/09/20/replacement-named-va-prosecutor-ousted-over-probes-trump-foes/?itid=hp-top-table-main_p001_f005
*
The hypercourageous Trump~ing boy (you know: the braggart who constantly kneels menacingly before Putin), his acolyte Vance, and all the demented MAGAmaniacs constantly demand ‘freedom of speech’.
But apparently, that only applies to them and their screaming, ultra-right admirers around the world, and not to everyone else.
Bindi, no one expects you to understand the consequences of “lawfare”.
You can’t even understand the simple ball-on-a-string.
Hey Puffman, riddle me this –
When did the conflict between Cambodia and Armenia start, so that Donald could end it?
How many gaffs did Biden make, child?
” … no one expects you to understand the consequences of “lawfare”. ”
*
Of course I understand them; you don’t understand that they are completely irrelevant with respect to what I wrote.
*
” You can’t even understand the simple ball-on-a-string. ”
Of course I understand it; you don’t understand that it is completely irrelevant with respect to the discussion about the lunar spin.
*
However, everyone except Clint R understands that no matter what the issue, Clint R spends more time pulling the wool over people’s eyes than providing credible evidence that he is right.
Riddle me this, Puffman – is killing a DOJ case involving Tom Horman for accepting $50,000 from undercover FBI agents a “gaffe”?
Sorry Bindi, but you do NOT understand the simple ball-on-a-string. You believe it is “irrelevant”. WRONG. It is completely relevant because it models “orbiting without spin”. You don’t know what “orbiting without spin” looks like.
You can’t even understand the simple ball-on-a-string. Like your sidekick Willard, you don’t know any of the relevant science. You just clog the blog with insults and false accusations.
With the resignation of the Federal Prosecutor after refusing to Trump-up charges to charge Trump’s political enemies, Trump now appointed a non-prosecutor willing to do so.
And the first one indicted on Trumped-up charges is James Comey.
We have now, officially become a Banana Republic.
Nate, you need to study your banana history. The US has long been a banana producing republic.
https://en.wikipedia.org/wiki/Banana_production_in_the_United_States
Yes, as we see demonstrated here, MAGA folk have lost their independent thinking capabilities.
SOLAR MINIMUM UPDATE
The combined use of land for agriculture and photovoltaic electricity production (agrivoltaics) could be a strategy to capture benefits for both crops and solar panels. Here, we investigated an 89-kW pilot system comprising vertically mounted and south-oriented tilted bifacial solar panels in Denmark (latitude 56.5⁰). Variables including microclimate and electricity production were measured for one year, together with the yield of wheat and grass-clover mixture grown between the rows of solar panels. Both vertical and tilted agrivoltaic systems result in a positive land equivalent ratio, that is, for the same output they use less land area than would be required if the crops and the solar panels were on different lands. The vertical solar panels acted as wind shelters and their daily profile for electricity generation matches electricity demand better. In addition, our social acceptance study highlights that vertical agrivoltaic systems were perceived more positively than conventional solar panels. Our results offer a strategy for the sustainable integration of solar electricity generation and agriculture in temperate climates.
https://www.sciencedirect.com/science/article/pii/S2772427125001664?via%3Dihub
You forgot another win
https://www.thegatewaypundit.com/2025/09/breaking-youtube-agrees-pay-president-trump-24-5/
Wow $24 M. Thats about 6 hours of Youtube revenue.
Take your idiotic remarks to somebody else’s thread