
 Home/Blog
The total warming of the hottest 3 days in each summer month averaged across 400 mostly-airport weather stations is only 1.2 deg. F over 40 years.
I recently posted about the weather observations from Reagan National Airport that showed the warmest days of summer have experienced no statistically significant warming in the last 40 years, despite this being the period of maximum radiative forcing from increasing atmospheric CO2.
Of course, you would never know this based upon media reports… in fact, most people are probably under the impression that our hottest days are rapidly getting hotter.
One commenter on my post (correctly) pointed out that what I presented was just one weather station. Well, now I have processed ~400 mostly-airport (WBAN) weather stations and over 2,000 cooperative observer (COOP) stations across the U.S.
Here’s a plot of those station locations.
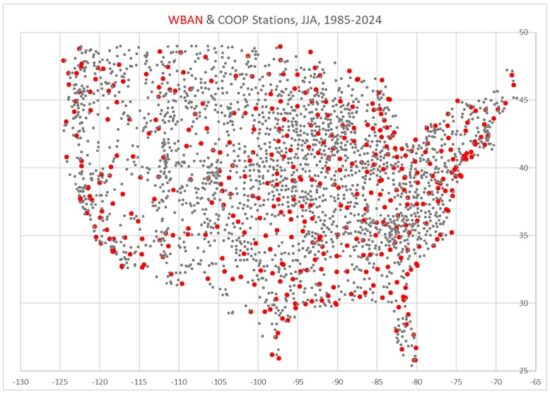
The period I’m addressing is the last 40 years (1985-2024) because we have Landsat-based Impervious Surface (IS) cover data at high spatial resolution (30 m) for those years, and I’m looking at how recent warming trends are impacted by the urban heat island (UHI) effect. IS is a percentage cover of Landsat pixels by roads, parking lots, buildings, and other human development impervious surfaces.
Daily High Temperature (Tmax) Results
I don’t like “heat waves” as a statistical quantity. It is “binary”, which means it has an arbitrarily chosen threshold of temperature and number of days of duration, and those can be manipulated to give very different results for heat wave trends.
Instead, I computed a statistic which has no threshold, is always the same number of days, and occurs every month: the average of the 3 warmest (and 3 coolest) days in each summer month (June, July, August) during 1985-2024.
I can then compute trends in those, just like is usually done for the average of all daily Tmax (or Tmin). I did this separately for the mostly-airport (WBAN) stations which are well maintained for aviation safety reasons, and for the COOP stations which have varying and mostly unknown levels of quality control, siting, etc.
Since people are used to looking at time series, we will start with the multi-station average summer temperatures for 3 of the 9 U.S. climate regions as defined by NOAA/NWS. From top to bottom, these are the Upper Midwest, the Northeast, and the Southeast; I have offset the warmest-3 and coolest-3 day results for legibility:
Note how much more slowly the warmest 3 days per month are warming compared to the coolest 3 days. As an example, for the Northeast U.S. climate region (PA/MD and northeastward), the hottest summer days have been warming at an average rate of 0.10 C/decade, which equates to 0.7 deg. F over 40 years. All 9 climate regions exhibited this feature, by varying amounts. Again, these results are all for daily maximum temperatures, Tmax.
Next, I took all of the stations in the U.S., and split them into 7 equal-size groups of increasing IS growth which I am using as a proxy for urbanization for the purposes of temperature impacts of the urban environment. These plots are different: The temperature trend is on the vertical axis, while the category of urbanization growth is on the horizontal axis. Again, these results are for Tmax; the results for WBAN stations are on the left, and for COOP stations are on the right:
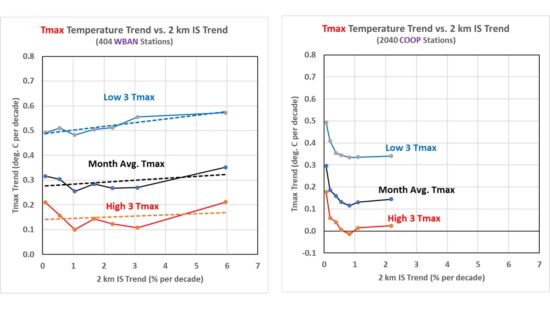
There is little dependence of the 40-year temperature trends on the rate of growth in urbanization (IS trend), maybe just slight upward slope with the most rapidly urbanizing stations experiencing a little higher warming trend. The generally higher trends at low values of IS growth (especially in the COOP data) are because most of those stations are in the western U.S., where warming trends have been greater. I wouldn’t put too much faith in the absolute values of the COOP trends because no time-of-observation (TOBS) adjustment has been made. But that should not affect the spread between warmest and coolest days.
What really stands out is the fact that the coolest summer days are warming much faster than the warmest summer days. The difference in warming trends is about 0.35 C/decade in the WBAN data, a little less in the COOP stations. This suggests a moderation of summer temperatures, with less variability.
Averaged over all 400 WBAN stations, the warming trend equates to only 1.2 deg. F of warming in 40 years. I would wager this weak upward trend in the warmest summer days is much less than what most people would expect, given media coverage of “heat waves”.
And if you are wondering how the trend in the average of all Tmax temperatures in the month compares to NOAA’s official homogenized, area-averaged dataset, they are about the same, to within 0.01 or 0.02 deg. C/decade
Daily Low Temperature (Tmin) Results
As seen in the next plot, the effects of increasing urbanization are much more pronounced in daily minimum (Tmin) than daily maximum (Tmax) temperatures, with the greatest warming trends occurring at stations with the fastest growth in impervious surfaces.
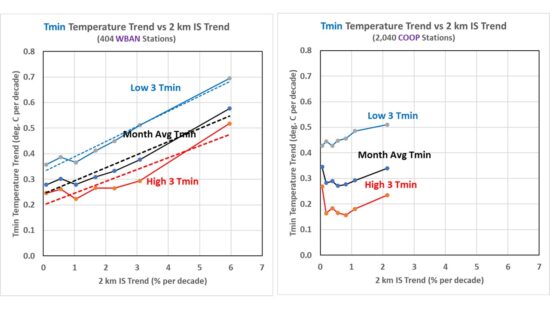
Note that these plots allow one to estimate what the station average warming trends would be in the absence of urbanization by just looking at where the regression lines intersect the vertical axis (IS trend = 0). Remember, the 7 IS trend groups have equal numbers of stations. If those values are used for the “climate signal” (as opposed to the increasing urbanization signal), the trends are not too different from those in Tmax
Conclusion
My main takeaway is that, contrary to what we have been told, there has been very little warming of the hottest summer days averaged across the U.S. in the last 40 years. The second takeaway is that nighttime (Tmin) temperatures are warming rapidly with urbanization, but when those statistics are extrapolated to no growth in urbanization, the average Tmin warming trend is greatly reduced, especially for rapidly growing locations.


I note that most of the global warming has been at the cold end of the range.
Winters are warming faster than Summers.
Nights are warming faster than days.
High latitudes are warming faster than the tropics.
Looking at frequency distributions the left tails are receding faster than the right tails are extending.
It is therefore not a surprise to find that the hottest days are warming less quickly than the global average temperature.
Global warming tends to start at the cold end.
Winters warm faster than Summers.
Nights warm faster than days.
High latitudes warm faster than the tropics.
Look at the frequency distributions and the left tails are receding faster than the right tails are extending.
Your own data shows this, with the coldest3 days showing steeper slopes than the warmest 3 days.
This is not evidence that global warming is not happening, it is evidence that the warming is asymetric.
UHI nothing more, it all boils down to a more benign more pleasant climate regime,how soon people conveniently forget the horrors of the past cool climate regime, todays 8 billion could simply not cope with such a climate .
UHI does not explain temp change in any significant amount. Virtually uninhabited Siberia continues to be one of the fastest warming portions of the planet.
“The total warming of the hottest 3 days in each summer month … is only 1.2 deg. F over 40 years.”
1.2 F = 0.67C. Over 4 decades that is a warming rate of 0.17C / decade. That’s still faster than the UAH global average for the USA for annual values of 0.15C / decade since 1985.
We should also keep in mind that the most rapid global warming (of a significant duration like at least several decades) that we’re aware of in Earth’s preindustrial past had a rate of around 0.1 degree per CENTURY so the current global warming is around TWENTY times faster.
Too much is being made of summer weather. Here in Vancouver, Canada. We are being told we are in drought conditions. Duh!!! For as long as I can remember our summers have always been virtual droughts. I recall entire summers without a drop of rain.
Part of the reasoning is that our reservoirs are getting lower than normal. Double duh!!! Our population has nearly tripled in a few decades and people are using water in ways they never did before. They are now power washing entire houses and that often requires the use of large volumes of water for up to 8 hours.
Many people have several showers a day and with a family of 5 to 10 people in a home, that is a lot of water. Also, they are using dish washers and tossing clothes in a washer every time they get a bit dirty.
Our neighbours to the south In California have on-going droughts yet they have 1,343,000 residential swimming pools. Trump is looking to Canada for water but he wont criticize the wasting of water. Arizona, another drought-stricken region, has 505,000 residential pools.
Vancouver is one of the wettest parts of our province but other parts more inland are perpetual drought regions. Just 150 miles northeast of Vancouver, the region is so dry it resembles a desert, completer with sagebrush, rattlesnakes and small cactii.
Forest fires are now being blamed on a climate change that no one can explain. They cannot tell us how an average warming of 1C over 170 years can cause climate change let alone explaining heat waves with temperatures up to 10C above the norm.
The problem is clear. We have not been around long enough to experience such variabilities in weather and we have no temperature records that go back far enough to offer good examples. We know little about the effects of oscillations like the AMO, PDO, and ENSO and how they affect weather over the long run.
Thank you very much for doing this important work. As a genuine skeptic, I am more concerned that people are looking at the data in this way, rather than whether the result goes one way or the other.
Please keep working.
Thank you, Tim. I hope to keep working as long as my brain and body are still functioning.
Good for you, Roy. Mental and physical activity are important. Linus Pauling, who had serious health problems earlier in his life, lived till 94 and he was mentally active till the end.
Keep going my friend, we need people like you and John Christy fighting the good fight. Good luck to you.
(i’m sure that there are some out there that think you should have retired decades ago then!)
Reminds me of the speech the late Princeton physicist, Freeman Dyson, gave at Boston University 15 years ago on the necessity of having heretics in science.
During the speech, he devoted a few minutes to global warming. He pointed out that the climate is actually moderating, not becoming more extreme. That’s because what he called the “cold places” – nighttime low temps, the arctic poles, and places with low humidity – are warming faster than the “hot places” – daytime high temps, tropics, and places with high humidity.
But the most interesting part of the speech was the one number he wanted the students to remember: 1/100th of an inch. He said that if new topsoil could be created in that amount on the half of Earth’s land based surface area not covered by icecaps, desert, or human built infrastructure like roads, buildings, etc. it would absorb ALL of the excess CO2 humans create combusting fossil fuels to make our lives better.
That whole speech – not just the few minutes he talks about global warming – was quite powerful. It had a big impact on me as a non-scientist.
https://www.youtube.com/watch?v=8xFLjUt2leM
Summer ice minimum has been passed putting the US into a 3-way tie for the 10th lowest summer ice year despite the recent orbit perturbation induced global temperature maximum.
NASA notes this on its website:
”This overall trend should be viewed with the caveat that there has been no significant downward trend in September minimum extents over the past two decades. Causes for this flattening trend are a matter of active debate in the Arctic science community. However, all years after 2006, from 2007 to 2025, have still had a lower minimum extent than all the previous years in the record from 1979 to 2006.”
The next big outer planet orbit perturbation pulse will occur in 2040 and it will be relative to our orbit in a way to cause less annual sunlight to hit the surface. So the decade surrounding this event should either represent about three decades of a some of the least warming not seen since 1945 to 1975 which was 3 decades of cooling.
Of course these are not the only natural variations out there. the 1945-1975 period was on top of a solar grand maximum which created a great deal less cooling than the cooling period previous 3 decade cooling period from ~1880-1910. I say approximately because while the major 60 year period of Jupiter and Saturn its actual effects are modified by positions of other planets with longer period orbits and solar activity.
Two hints on the Hunter boy’s absolute cluelessness…
1. Here are the 20 lowest monthly absolute sea ice extent values from Jan 1979 to Aug 2025, im Mkm^2:
2012 9 3.57
2020 9 4.00
2007 9 4.27
2024 9 4.35
2019 9 4.36
2023 9 4.38
2016 9 4.53
2011 9 4.56
2015 9 4.62
2008 9 4.69
2012 8 4.72
2018 9 4.79
2017 9 4.82
2010 9 4.87
2022 9 4.90
2021 9 4.95
2019 8 5.03
2020 8 5.07
2024 8 5.13
2013 9 5.21
*
If the Hunter boy was correct, the vast majority of an ascending sort of the monthy Arctic sea ice measurements would have happended between 2007 and 2012.
*
2. ” Of course these are not the only natural variations out there. the 1945-1975 period was on top of a solar grand maximum which created a great deal less cooling than the cooling period previous 3 decade cooling period from ~1880-1910. ”
Aside from the fact that everything Hunter boy posts on this blog makes him look pretty drunk, here’s a fair comparison of solar activity with temperatures since 1850:
https://drive.google.com/file/d/1YanVTQpbOvSxIBkP11-W212twIG_wzZY/view
And when you sort the yearly Arctic sea ice extent averages, you obtain this:
2020 10.164 (Mkm^2)
2016 10.176
2019 10.225
2018 10.378
2024 10.406
2017 10.415
2012 10.420
2023 10.490
2007 10.498
2011 10.506
Anyone having a working brain knows why Pseudoskeptics use linear trends whenever these fit their narrative.
Bindidon,
The annual sea ice extent minimum occurred on September 10, 2025 according to NSIDC.
And you are showing completed years and completed months averages in your list. So 2025 is not on either list. The minimum extent is computed from a 5 day average.
You should pay attention to the statistic I am actually talking about at least before resorting to your rude troglodyte self and a stream of insults. It makes you look quite ignorant.
Here is the NSIDC link: https://nsidc.org/sea-ice-today/analyses/2025-arctic-sea-ice-minimum-squeezes-ten-lowest-minimums
Note the “caveat” regarding a continuing trend in arctic ice loss
Bill
Like a lot of climate data the standard deviation of the September minimum extents is similar to the decadal range.
As a result the minimum period over which you would expect to see a statistically significant change in extent is about 20 years.
Failing to see a statistically significant trend after 20 years says more about the variability in the data than it does about the existence of otherwise of a long term warming trend.
Entropic man says:
”Failing to see a statistically significant trend after 20 years says more about the variability in the data than it does about the existence of otherwise of a long term warming trend.”
The same is true for seeing a significant trend EM. And when you consider that the IPCC AR3 built its fingerprint of man on an 18 year long warming trend and used that trend to predict future warming you just kicked the legs out from under it.
The bottom line is is the fact that CO2 absorbs a certain IR bandwidth up in the atmosphere, that heat is more likely to travel up than it is down. Convention in the science of energy efficient building practices which actually has been going on for about 2,000 years or more has for as long as the dissipation of heat has been treated mathematically is if it doesn’t travel up due to radiation it will travel up at the same rate due to convection.
If you take a beginning college course on the matter you will find they simply ignore one of the two significant variables of that heat transfer. . .and the results match experiment.
But on the other hand there are no ambiguities with gravity creating an acceleration of all objects. There is no other means of accelerating or decelerating a planet in its orbit to act as a counter to gravity.
Thus there is no excuse for not estimating approximately what the effect is by building a model. After all there does need to be an explanation for all the cyclical variability we see in ice core data on scales of 40 to 4000 years. All you guys want to do though is to limit the discussion to scales of 26,000 years and up so you can hawk CO2 without your budgets getting molested.
“The same is true for seeing a significant trend EM. And when you consider that the IPCC AR3 built its fingerprint of man on an 18 year long warming trend and used that trend to predict future warming you just kicked the legs out from under it. ”
The prediction of future warming in AR3 was published in 2001 and they had 18 years of of good data. Depending on the variability that may or may not have shown statistical significance.(Do you happen to have a suitable link?)
What is notable is that 25 years later we can look back at AR3 and observe that the significant warming they predicted has taken place.
The lesson is that the lack of statistical significance does not necessarily mean that there is no trend.
Entropic man says:
”The prediction of future warming in AR3 was published in 2001 and they had 18 years of of good data. Depending on the variability that may or may not have shown statistical significance.(Do you happen to have a suitable link?)”
Yes thats all correct. However statistical significance depends mostly upon whether you have a representative population and we have learned other things since then that are also concerning.
What is notable is that 25 years later we can look back at AR3 and observe that the significant warming they predicted has taken place.
The lesson is that the lack of statistical significance does not necessarily mean that there is no trend.
============================
I agree EM.
18 year trends were pretty much universally adopted as an adequate indication of a real climate trend sufficient to take authoritarian measures against a free people by our government. Why do you now want to minimize them as climate indicator?
Understand that my view on climate is that the oceans are the dominant force that mediates climate perturbations. Sunlight first warms the days with somewhere around 90% of that solar energy going into the ocean and that the nights warm primarily from that heat energy coming out of the oceans later, melting ice, forming warmer atmospheric nighttimes. This idea seems consistent with Roy’s findings in this post.
I believe the northern sea ice freezes from loss of heat upwards to space and melts primarily via warm waters melting the bottoms.
I also believe that the arctic amplification that surprised climate scientists came about because of not recognizing that process and they were believing that arctic amplification was a 26,000 year cycle that evenly divides up 15 degrees of northern polar temperature variation seen in the ice cores and therefore that would come to pass as about one hundredth of one degree per decade warming or cooling. (a tenth of one degree per century) and one degree per millennium) and it seems that most scientists who are experts in this stuff think that a 1,000 years ago was warmer than now. Big surprise!
That of course then led to the idea of a tipping point so that it became more urgent to take action. But that hasn’t been panning out now for 18 years. Yet you are just fine with that right?
Its important to understand natural variation. What do you think the cause is? And why? That seems a lot more productive than jumping into a conversation and claiming its just data aberrations.
If 18 years is natural, how about 40 years, 60, years, and 80 years? We still don’t know what caused the warming of the first half of the 20th century and we pretend we know everything about the warming of the past 45 years. Why is that so?
IIRC this is that list of factors such which cause variation in climate.
Solar variatione, volcanoes, orbital variations, aerosols, weathering, albedo, greenhouse gases and land use.
The first six are natural and individually are currently neutral or slightly cooling. cooling. If you do the measurements their collective effect is a negative temperature trend of 0.9C in 5000 years or -0.002C/decade.
https://railsback.org/FQS/FQS22katoFutureTemps03.jpg
Greenhouse gases and land use changes are artificial and account for the observed current warming of 0.2C/decade.
Incidentally the pre-WWW2 and the 1945 peak warming are well accounted for by 1) increasing CO2 and 2) the change in sea temperature measurement from buckets which underread to thermometers in engine rooms which overread.
Ent, you keep forgetting the warming from CO2 is a belief. And beliefs ain’t science.
We know (or should know) from First Principles of physics that CO2’s 15μ photons can NOT raise the temperature of a 288K surface.
Your cult believes ice can boil water, and passenger jets fly backward. Strange beliefs.
I try to avoid these back and forth contests, but this caught my eye from Entropic man:
“Incidentally the pre-WWW2 and the 1945 peak warming are well accounted for by 1) increasing CO2 and 2) the change in sea temperature measurement from buckets which underread to thermometers in engine rooms which overread.”
The fact is there is good surface temperature data and sea level data to show significant warming from about 1930 to about 1950. Then it took another 40 years or so, until the mid 1990s, before the current temperature and sea level rise started to increase again.
To be clear, there was a very significant period of time when CO2 was increasing rapidly from 1950 to 1990, but surface temp and sea level rise seemed to actually decline.
How does CO2 explain this effect?
Entropic man says:
”Solar variatione, volcanoes, orbital variations, aerosols, weathering, albedo, greenhouse gases and land use.
The first six are natural and individually are currently neutral or slightly cooling. cooling. If you do the measurements their collective effect is a negative temperature trend of 0.9C in 5000 years or -0.002C/decade.”
————————
All they used in orbital variations EM is 9000 year obliquity changes from precession.
Eccentricity changes are not linear per Hays et al, 1977 and this will have much larger non-feedback effect in the tropics and temperate zones as opposed to the polar zones. precession effects are felt linearly and primarily polar.
Thus Marcott is simply too incomplete to estimate how much climate change has occurred during the Holocene.
You also say. ”Incidentally the pre-WWW2 and the 1945 peak warming are well accounted for by 1) increasing CO2 and 2) the change in sea temperature measurement from buckets which underread to thermometers in engine rooms which overread.”
that is false as #2 was already factored into the temperature record I was using along with a few other adjustments.
And the bump remains. And CO2 has been steadily increasing so that it can’t account of a bump as Tim points out above.
The bump remaining was created at a rate of ~.17c/decade warming.
The modern bump would be larger and longer because of Uranus and Neptune being out of sync in the 1940’s and in sync in the 2020’s and time was needed for Jupiter to pass them with Saturn trailing.
Of course a model would need to be constructed to pin down these effects and one would need to factor in the other 7 items you listed. But of course these warming spikes create their own CO2 emissions from the ocean and they melt ice and create that effect too. So whatever thats worth is what it is and could be included in a coupled climate model as natural also.
Tim S
“To be clear, there was a very significant period of time when CO2 was increasing rapidly from 1950 to 1990, but surface temp and sea level rise seemed to actually decline.
How does CO2 explain this effect?”
Because it’s not just CO2. Climate sceptics wave around the straw man that the scientists blame all temperature changes on CO2. That is incorrect, I listed seven agents of change above.
In summary, the observed long term trend is due to CO2. The short term variation, the pauses and the peaks are due to other factors.
Take the post-war pause. The big industrial boom after WW2 massively increased urban pollution (e.g. pittsburg, Chicago and London.
To cure that they build power stations in the country, with high chimneys which transferred the problem to higher altitudes and further downwind (c.f. acid rain). The well mixed sulphur increased albedo and produced a cooling effect which cancelled out the warming effect of CO2.
By the 1970s they were decreasing sulphur emissions using scrubbers to cure the acid rain. This reduced sulphur emissions, decreased albedo and with no masking the CO2 warming trend became visible again.
It’s boring to have to answer to nonsense again, but if you don’t answer, the guy writing the nonsense will think he’s all right.
*
” The annual sea ice extent minimum occurred on September 10, 2025 according to NSIDC. ”
No problem for me to see this; I watch NSIDC’s Arctic and Antarctic sea ice data since about 10 years:
https://masie_web.apps.nsidc.org/pub/DATASETS/NOAA/G02135/
{ Currently unreachable. Luckily I could download data yesterday. }
*
1. Absolute values
https://drive.google.com/file/d/1J9kx750_CtARv4sKfXBddRnkZm3E2U4v/view
In their own data we can see, however, that the minimum (4.54 Mkm^2) was reached on Sep 8, not 10. OK for me.
2. Anomalies wrt the daily means in 1981-2010
https://drive.google.com/file/d/1QBlh325tHF-4NRlWsHf_6sgskO_ipyse/view
In (2) we see even better than in (1) that 2025 has crossed the 10 year (2015-2024) average and is about to cross the ‘cold’ years 2021 and 2022 as well.
*
The black 2025 daily values are far far above those for 2019 and 2020, themselves lower than the lowest daily values for 2012.
Boooah! Arctic sea ice has recovered 101%, you’ll see!
*
The problem for persons watching such data since 10 years and regularly posting charts showing that data: why the heck is this fixation on September?
Let’s look at a monthy split of the data recorded since 1979:
https://drive.google.com/file/d/1cL57UakZj8Hqw7QAv2c6XSqto6iHH5Sv/view
For an engineer, there is no reason to keep fixated on September data.
*
But when you split the monthly data into 12 singe month time series, you quickly understand why Pseudoskeptics very well do: while the September sea ice downward trend is the most negative one since 1979 with -0.8 Mkm^2 / decade, its trend since 2007 is suddenly the least negative of all 12 months, with -0.1 Mkm^2, he he he :–)
*
The worst thing with this September fixation is not only that the year with the least September average – 2012 – is also a year with a very high March average: the highest one was in 1979, and 2012 ranks at postion 25 of 47.
It is also that the year with the least March value of all 47 is, by ‘magic’… 2025.
*
Thus, with all due respect to scientists watching these September values for the Arctic sea ice extent, I prefer to look at yearly averages instead.
**
Back to the Hunter boy’s nonsense.
He really, really manages to write:
” And you are showing completed years and completed months averages in your list. So 2025 is not on either list. ”
For the completed years one could say OK; but… how is it possible not to understand that the absence of 2025 in the sorted list of completed months is simply due to the fact that July and August 2025 have such high values that they never could appear on the top 20 of the ascending sort of the list?
Any 10 year old child would understand.
*
And so it is since years with the Hunter boy…
By the way, he is one of the denial quatuor (Robertson, Clint R, the fake moderator DREMT and… the aforementioned genius), who all four dare to discredit and denigrate centuries of observation and computation of the lunar spin – of course without being able of scientifically contradicting 350 years of work achieved by hundreds of astronomers, mathematicians and physicists:
https://drive.google.com/file/d/13DRDH1OFOUHYM_6HKH19sbj28yckJMF7/view
*
The Hunter boy’s opinion about all this giant work: it’s just ‘an academic exercise’.
Yeah.
Since Bindi has displayed his massive confusion again, let’s get him even more confused:
https://postimg.cc/TKRjdKmC
Bindidon says:
1. Absolute values
In their own data we can see, however, that the minimum (4.54 Mkm^2) was reached on Sep 8, not 10. OK for me.
—————-
NSIDC said they determine minimum on a 5 day average. Sep 10 was the date of the middle of that period.
2. Anomalies wrt the daily means in 1981-2010
Boooah! Arctic sea ice has recovered 101%, you’ll see!
—————–
I’ll see what? the only thing I am predicting is that over the next 25 years there will be an increased cooling influence due to orbital variation. Up until the past few years it was a warming influence. I am not guessing anything on the future of sea ice at this point in time as feedbacks and variations in the comings and goings of sea ice is poorly understood. I only focused on the summer minimum because that was what Mark Serreze was focused on in 2007 when he started making dire predictions about its future.
Monthly splits? I haven’t heard anybody making dire predictions about monthly split ice extents. Seem to be a convenient way to change the topic from drowning polar bears.
3. Any 10 year old child would understand.
My understanding is that the annual minimum wasn’t on your list for 2025 because September wasn’t on your list as it hadn’t completed and deserved the same OK you gave to the fact that 2025 annual average wasn’t on the list.
Seems the only thing going on here is an attempt to deflect away from yet another failed doomsday that isn’t panning out now for a climate length period of time and is due all the criticism it deserves by scientifically accepted measure.
4. Lunar spin
And don’t go on about your lunar spin. If you still don’t understand the actual position of non-spinners by now there is no hope for you. You have been fully indoctrinated into a cult.
Bindidon says:
“Boooah! Arctic sea ice has recovered 101%, you’ll see!”
I’ll see what? Do you have a prediction for the next 18 years?
Before we discuss sea surface temperatures, it would be useful to download and display real data rather than guessing what it might look like.
I used Met Office’s 1 degree HadISST1 SST, which belongs together with the Japanese COBE-SST2 to the SST time series constructed with the least amount of interpolation (what of course does not at all mean that interpolated data would be bad, as is claimed by Pseudoskeptics).
https://drive.google.com/file/d/13X64P9WzSnQS27tkqbqhavVvpg840o_m/view
*
Local trends for identified areas of interest:
– 1870-1910: -0.01 ± 0.01
– 1910-1945: 0.10 ± 0.01
– 1945-1975: 0.01 ± 0.01
– 1975-2025: 0.11 ± 0.01
**
Asking
” How does CO2 explain this effect? ”
is sheer nonsense – simply because CO2 is one of many factors contributing to changes in long range climate patterns, and currently still a minor one.
Most typical example is the post WW II period 1945-1975, during which the net CO2 footprint certainly is by dimensions less significant than that of SO2, hence of absorbed solar radiation.
A more intelligent question would have been:
” How does CO2 contribute to this effect, and how does its contribution behave over the long term? ”
My answer: No se!
This is a perfect example of someone playing games and essentially admitting that the effect of CO2 has been greatly exaggerated. Further, it is rather cowardly to quote someone without reference and then distort the question.
Let’s start with the actual quote from me in full context:
“To be clear, there was a very significant period of time when CO2 was increasing rapidly from 1950 to 1990, but surface temp and sea level rise seemed to actually decline.
How does CO2 explain this effect?”
If you want to make your own quote with your own question and answer, you are free to do so, but if you want to quote me, don’t play games. The attempted insult with the “more intelligent question” is nothing more than dodging the real issue.
I will be explicitly clear and open without playing games. Beyond people making claims about unusual weather events proving that “climate change is real and already happening”, one of the big claims is that temperature increase, sea level rise, and increasing CO2 occur at the same rate. Over the last 40 years that claim looks very impressive — especially with graphs based on data averaging. The reality is that over the longer range, the comparison falls apart.
I do not claim to have the answer. My only claim about anything concerning atmospheric science, global warming, and climate change, is that the entire issue is extremely complex and not properly represented with simplistic comparisons or conclusions.
How long have we been in the Holocene? To take a look at an 18-year trend when the Holocene has been around for thousands of years is cherry picking non science. The current temperature isn’t any different than what it has been since the beginning of the Holocene. Even in the Holocene temperature trends go for 100’s of years. So, looking at an 18-year trend or a 50-year trend or even a 100-year trend and developing a hypothesis is bad science.
Stephen
That turns out not to be the case.
The current global average temperature is higher than anything we’ve seen during the Holocene.
http://railsback.org/FQS/FQS22katoFutureTemps03.jpg
For reference the Holocene Optimum peaked at 0.4C on the scale which corresponded to a true temperature of 14.7C. We’re now at 15.3C.
(Oh, and before you say that Marcott et al was wrong, remember that it has been replicated several times by groups like PAGES.)
Ent,
That’s hockey stick fantasy. It isn’t science. Also, GHE is falsified by the lapse rate and the continuity equation. From all the data we have for millions of years, CO2 follows temperature. Also, according to proxy data, we’re within the temperature variability we’ve seen in the Holocene and the last several interglacial periods. What we’re experiencing is unremarkable.
If https://oz4caster.wordpress.com/cfsr/ is anything to go by then this months UAH figure will show an increase.
scott…the point being missed is that we are still recovering from a mini-ice age, the Little Ice Age. From that perspective, any warming can e easily explained and there is nothing we can do about it vis-a-vis reducing CO2.
Klimate Klowns can’t seem to grasp the simplicity of this argument. The IPCC has deliberately minimized it by equating the LIA only to Europe, an asinine claim if I ever heard one. It got so cold during the LIA that glaciers globally expanded enormously. The Mer de Glace glacier in France expanded so much it wiped out long-establsihed villages and farms in its path. Oceans off Europe’s coasts frozee up to 2 miles offshore.
What are the chances that such cold over 400 years occurred only in Europe.
Common sense. I hope/pray it makes a comeback. Of course, one of the thrills of scientific discovery is finding something that runs counter to common sense or “settled” science (there is no such thing). Your example above is a great example of common sense. If one is to challenge your logic and evidence about the LIA, they must prove a powerful relationship that they have discovered that would explain such an unexpected phenomenon.
18th and 19th century scholars (very few in number in those agrarian societies) in parts of English-speaking countries followed Scottish Common Sense Realish (sometimes called the evengelical enlightenment). It dominated Scotland, Cambridge (in East Anglia, the home of the Puritans), and New England. It dominated early U.S. schools and colleges. It represented a marriage of faith and reason. Some great theologians, scientists, statesmen, and inventors were steeped in it. Scotland, a tiny, isolated county had a very outsized impact on the British Empire and the world.
Common Sense. I hope/pray we are seeing a comeback.
Common sense has it that increasing the LIA would increase climate sensitivity.
Yet here we are.
Interesting results. At first glance they appear to differ from those of the epa:
https://www.epa.gov/climate-indicators/climate-change-indicators-heat-waves
but the epa focus on minimum temperatures in defining heat wave conditions. These, as you have shown, do increase but I am not sure that these really describe “heat waves” as we commonly experience them.
If, as you demonstrate, the maximum summer temperatures are not increasing significantly, is it still possible to define “(daytime) hot spells” and diagnose trends in:
Frequency: the number of “hot spells” that occur every year
Duration: the length of each individual “hot spell”, in days
Season length: the number of days between the first “hot spell” of the year and the last
??
I suspect that these would be of great interest (or has this already been done elsewhere?).
https://www.federalreserve.gov/aboutthefed/educational-tools/chairmans-lecture-series-about.htm
Slightly off topic, sir. I hope Bernanke put a lot of work into his lectures. And I hope he was able to charge something. He has lots of ‘splaining” for the Fed’s insane policy. The middle class and poor have paid a big price. We all may still pay a big price for the various bubbles” they created with the monster they created with QE. We all need to pay extreme caution with the current stock market, propped up with fake money.
Trump tells it like it is: https://www.youtube.com/watch?v=xGm8VcPcbns
Trump! Idiot!
I notice no one has elected you as President …
I don’t live in the USA!
Trump Derangement Syndrome is spread wide and far.
Indeed does. Idiot still!
RLH,
You guys have your own problems. I’ll take Trump over anyone you guys have elected since about WC.
Trump will die soon. What will you do then?
We’ll all die soon. By the way Trump didn’t make MAGA. MAGA made Trump. Tommy Robinson has found the few Brits unwilling to forsake liberty in the name of security.
Ken
Trump Addiction Syndrome is even way more.
Trump is right about the climate scam.
Says a guy who actually lives in an absolute climate paradise called ‘Vancouver Island’, and has therefore never had to worry about the climate.
Just as at least a billion people around the world very well and increasingly have to do in a growing number of regions, starting with the Arctic – from Alaska till Eastern Siberia – the Philippines, Bangladesh etc etc, and ending with… the coasts of Florida and Louisiana in the USA.
ATTN: Roy and Everyone
RE: New Website on Temperature and Climate Data
I have just discovered a new website for accessing temperature and climate data for cities, states, countries, and other regions.
Please go to:
https://www.extremeweatherwatch.com/cities/huntsville/average-temperature-by-year.
There is displayed in a table of Tmax and Tmin data from 1894 to 2024. There are several options for sorting the data in each column. For example, by clicking on Tmax the data is displayed from low to high values or from high to low values. You can have data displayed by month. At the end of the page there is given the weather station or stations from which the data was obtained.
You can go to another city using the “select city” tab. Type the name in the box and if data is available, it will appear below the box. Then click on it to get the data. If no data is available for the a selection, then nothing is displayed. I was able to get temperature data for Death Valley and Yellowstone Nat. Park
If you leave off “average-temperature-by-year” from the URL, you will get climate data for the city which is displayed in a different format. You also can compare data to nearby cities. The data is displayed in graph.
The main website is https://www.extremeweatherwatch.com.
This provides an easy way to for the UHI effect at a city.
tim…”To be clear, there was a very significant period of time when CO2 was increasing rapidly from 1950 to 1990, but surface temp and sea level rise seemed to actually decline”.
***
Tim….a couple of points. Ent et al seem to think there is scientific proof to relate the trace gas CO2 to warming. There is zero evidence. It is propaganda from the IPCC based on papers submitted by alarmists.
With regard to your point, where there is little correlation between increasing CO2 and warming, we need look no further than the IPCC announcement in 2013 (AR5, I think) that a warming ‘hiatus’ (aka flat trend) had occurred over the 15 years between 1998 and 2012. NOAA went back and fudged the SST record to show an insignificant warming.
Post 2012, UAH shows the 15 year trend increasing to 18 years till 2016 when a super EN drove the global average upward. Although it remained high for 6 years, the trend flattened over those 5 years. Ergo, except for the spike in 2016, the flat trend increased to 24 years.
That does not bode well for the AGW theory. If 24 years out of 25 years have a flat trend, it does not sound good for CO2 warming. It suggests we need to look for other issues that cause such variations in weather, and Tsonis et al suggested it is due to phases of ENSO, the PDO, the AMO, the AO, etc. varying in and out of phase.
Gordon,
“there is little correlation between increasing CO2 and warming”.
Where have you been!
https://docs.google.com/presentation/d/1Nl_eRXwabzNrhdLXLvtt_9X2MnOe463Xe7QSbBH0IUo/edit?usp=sharing
Jimmy tells it like it is:
https://bsky.app/profile/jimmykimmel.com/post/3lzklwutmm22v
ROY: Where is my comment that I posted yesterday about the new website: http://www.extremeweatherwatch.com? Is it still under going your evaluation?
TDS trigger – Trump to UN: ‘Climate change is the greatest con job ever perpetrated on the world’
Despite his press secretary’s claim that “President Trump gets everything right.” this is just one of the many things he has got wrong.
Only the best and finest –
https://www.thedailybeast.com/ice-arrest-goes-viral-after-agent-drops-gun-then-points-it-at-onlookers/
For weeks now, I have been reading these articles by Roy Spencer, in which he compares the three hottest and three coldest days of the summer at in between countless weather stations, trying to understand what he is claiming as proof of the relevance of the UHI.
To me, it seems just as nonsensical as if, say, NOAA or anyone else were to construct monthly anomalies from three daily absolute values instead of requiring between 20 and 30 of them before they are accepted as valid.
What’s the goal of this game? No puedo entenderlo.
Add onto to the data that the U.S. alone produces 420 million tons of asphalt per year. Let that sink in. And much of it at airports which have all been expanded with runways lengthened.
Science is a process that relies on experimentation and statistical analysis of the data collected in those experiments. Most importantly however is Reproducibility of those Expermental Results and the resulting Statistical Analysis. Climate Science relies on only anti-science Peer Review, Concensus and Computer Models. If Climate Science was a real science they would define the Dependent Variable, in this case Temperature, and the Independent Variables, in this case CO2, and run experiments that isolate the impact of CO2 on Temperature. Basic Science 101. That would be extremely easy for any University Lab to Perform, either using Long-Pass IR Filters that isolate 15 Micron LWIR, or my simply concentrating the 15 LWIR emitted from Dry Ice onto a Bucket of Water or Sample of Gas. Those experiments aren’t done for a reason, because what will be found is that 15 Micron LWIR, the only wavelelgths related to CO2 that matter, simply won’t warm air or water. The quantum mechanics of the CO2 molecule don’t support CO2 being the cause of the warming. These Videos do a good job looking at the real science behind CO2, Temperature, and Climate Change. The causes are obvious.
https://app.screencast.com/JocbqECAHo84c
https://app.screencast.com/nXfZcUyGR4QlR
https://app.screencast.com/nXfZcUyGR4QlR
This Video shows 20 minutes of Weather Stations that show no warming. CO2 is even at all the stations on the earth, yet for some reason CO2 doesn’t cause warming at these locations. The reason should be obvious to any real scientist. The answer is that CO2 isn’t causing the warming, and that something other than CO2 is cauing the warming at the other locations.
https://app.screencast.com/YhtT15qlGLIsC
https://app.screencast.com/JocbqECAHo84c
Nor H2O (the other ‘greenhouse’ gas).
You are grossly oversimplifying. CO2 concentration is not the only factor affecting station temperature readings.
For the nth time, the long term global warming trend is caused by anthropogenic carbon dioxide emissions.
Short term and local variations are due to other factors.
For the Nth Time you have no evidence. For the Nth time this is science. In real science if you have a sample and expose it to something and another sample exposed to identical conditions and change one, you assume the additional factor caused the variation. That is why they call them controled experiments. By making Solar, H2O, and the UHI Effect Constant by selecting the proper locations, basically controlling for all the significant variables, you get a true reading of the impact of CO2 on temperaure. Your opposition to my logic appears to imply you don’t understand basic scientic method and experimentation. The locations selected were selected to control for all factors other than CO2. When you do that, you find no warming.
Anyway, prove me wrong. Concentrate the IR emitted by Dry Ice on to a bucket of water and measure the temperature change vs a control. That will prove CO2 is the cause of the warming. If you explain the warming of the oceans you explain the warming. Hint, 15 micron won’t warm water, especially the deep oceans.
Bindidon says:
”In (2) we see even better than in (1) that 2025 has crossed the 10 year (2015-2024) average and is about to cross the ‘cold’ years 2021 and 2022 as well.
The black 2025 daily values are far far above those for 2019 and 2020, themselves lower than the lowest daily values for 2012.
Boooah! Arctic sea ice has recovered 101%, you’ll see!
The problem for persons watching such data since 10 years and regularly posting charts showing that data: why the heck is this fixation on September?”
————————–
Perhaps it has something to do with the fact that for over a decade you climate nutjobs preached doom and gloom from disappearing summer ice.
Horrible effects across the gambit from polar bears starving to death to vastly accelerated global warming due to the oceans exposed from under the ice absorbing gobs more energy, to feedback effects raising sea level by a meter or more, to stalling the thermohaline system creating feedbacks that would put New York under a mountain of ice.
Hate to tell you Bindidon but all the months demonstrate a dramatic flattening of the decline in sea ice.
This trend has proceeded to the extent that its currently neutralizing the alleged disastrous effects of CO2.
Yet you still maintain there is no natural source of climate change capable of doing exactly what is occurring right in front of your eyeballs while you dogmatically cling like a passenger on the Titanic holding on to your daddy’s propaganda like it was a wooden deck chair.
Meanwhile you go nuts claiming I am off my rocker without spending 2 seconds to realize that the most stunning comment was posted by NSIDC regarding the trend of the entire record.
”This overall trend should be viewed with the caveat that there has been no significant downward trend in September minimum extents over the past two decades.”
That means zero effect on Arctic sea ice from continued CO2 emissions over a consensus definition climate period. Whoa!!
And nobody knows what that means yet Bindidon starts dropping cows.
Then lacking any rational response Bindidon dives into another canard: Bindidon says:
”By the way, he is one of the denial quatuor (Robertson, Clint R, the fake moderator DREMT and… the aforementioned genius), who all four dare to discredit and denigrate centuries of observation and computation of the lunar spin – of course without being able of scientifically contradicting 350 years of work achieved by hundreds of astronomers, mathematicians and physicists:”
So in desperation Bindidon reaches deep into his propensity for ad hominems. He fails to understand the basic underlying realities of angular momentum of orbiting bodies and assumes incorrectly that the 350 years of work by competent scientist nowhere go to the extent that he has gone.
The non-spinner position is that minimal angular momentum of a rotation is when the axis is deemed to be at the center of an object and that the angular momentum increases exponentially as the axis is deemed to exist further from the COM of the object.
that is a brilliant and very useful observation. It was taught to Bindidon but Bindidon took the additional step of claiming that the rotation on an external axis doesn’t exist but instead is a translation of the object combined with a rotation on the COM of the object.
LOL! But he fails to realize that this translation in the case of the moon and earth is an angular momentum!
And it is far greater than the angular momentum of the moon on an axis deemed at the COM.
To maintain this viewpoint Bindidon is willing to ignore the fact that the entire rotational motion of moon is guided by earth’s gravity, not from some mysterious unidentified object that sometime far in the past put a spin on the moon.
And not only does he believe this canard, which would be OK as not everybody is the sharpest tool in the toolbox; he proclaims it incessantly that anybody who doesn’t believe what he believes is a
denier of science. He sounds like he actually believes that anybody observing what most non-spinners have observed they are going to fall off the edge of the earth.
The din from all this nonsense is never ending as it it were the only argument he has for any of the topics engaged in here.
Human beings have an infinite capacity for self-delusion. Now, add to that the concept of consensus, which, in the absence of irrefutable evidence, is antithetical to science (truth-seeking). We are social beings and most of us crave the agreement of others. Just read the comments on this blog! God bless the iconoclasts and critics among us. And keep them safe. They become targets of hate and even violence sometimes.
In academia, you must add $$ to the equation. Publish or perish. Get grant $ for research. Attract grad students to help with the research with the $. Grant $ can be more easily acquired (still very competitive and difficult) if your research is pointing toward “saving the world” from destruction from a runaway climate warming from evil men burning fossil fuels (at the same time ignoring all the incredible benefits from the same energy and materials source). This makes the delusion especially seductive. “Gee, this is a win-win. My career and paycheck is soaring, I am respected by all my colleagues, and I am saving the world!” The more intellectual you are, the more susceptible you are to this fantasy. It can be close to an addiction. I have seen this same phenomenon in the investment world, where I have labored since 1980. Rationalization is very powerful and very dangerous.
God bless the courageous critics.
BACK AT THE RANCH
Sunday’s shooting marked at least the 324th mass shooting in the United States this year, according to the Gun Violence Archive.
https://www.independent.co.uk/news/world/americas/crime/michigan-mormon-church-shooting-lds-b2835388.html
Antifa, no doubt.
co2…”The answer is that CO2 isn’t causing the warming, and that something other than CO2 is cauing the warming at the other locations”.
***
We have not even begun to seriously look for alternate reasons for the warming. In fact, the IPCC has down-played a glaring reason, rewarming from the Little Ice Age. They have also over-looked the long term effects of ocean oscillations like ENSO, the PDO and the AMO. Each oscillation has a different period of oscillation, making them work in phase and out of phase. That results in cooling and warming periods with natural variability according to a study by Tsonis at al.
The IPCC has quietly set aside its own observation that no warming occurred between 1998 and 2012, a 15 year hiatus as they called it.
Serious science makes it blatantly obvious that a trace gas cannot significantly affect the warming in a mixed gas such as the atmosphere. The Ideal Gas Law and the heat diffusion equation make that clear. When a trace gas making up no more mass than 0.06% of the atmosphere contributes heat to the larger mix it is limited to 0.06% of the warming per 1C rise of the overall mix.
Any warming during the period from 1998 till 2024 came in spurts over short periods of a year or less and that cannot possibly be a signature for AGW. In fact, 24 of the 25 years show a flat trend.
If there was the slightest evidence that it could, we would surely have heard of it by now.
I am auditing Elements of Climatology at a respected university in the U.S. Class #1 covers the Ideal Gas Law and composition of our atmosphere. Class #1! BASIC SCIENCE. This really drives home to me my points made earlier today about our very flawed acquisition of knowledge. Self-delusion and then confirmation bias.
Look, some of these same people believe that each person can determine their sex. Astounding, yet it has become holy writ in many corners of the health care industry. And I am supposed to trust them for healthcare. BTW, I was “assigned” male at birth (duly noted in my health records) and have no plans to change (lol). I am thinking about becoming a furry bear. I always thought they were cute and fearsome.
SOLAR MINIMUM UPDATE
Large-scale global climatic oscillations (GCOs) play a vital role in modulating the hydrometeorological patterns across the Globe. Recently, Kerala, the southwest coastal State of India has been increasingly impacted by consecutive extreme weather events highlighting the State’s increased vulnerability to climate variability. This study presents a comprehensive evaluation of multiscale teleconnections between five key hydrometeorological variables: temperature, rainfall and drought (represented using Standardised precipitation index at 3-, 6-, and 12-month scales) and five major GCOs: El Niño Southern Oscillation (ENSO), Pacific Decadal Oscillation (PDO), Indian Ocean Dipole (IOD), North Atlantic Oscillation (NAO) and Atlantic Multidecadal Oscillation (AMO). The analysis covers a 41-year period (1980–2020) across three major urban cities of Kerala: Trivandrum, Kochi, and Kozhikode, with the help of bivariate and multivariate wavelet coherence analysis to capture the localised and time-varying associations between GCOs and hydrometeorological variables. The study proposes a percentage of significant coherence differencing (PSD) scheme to quantify the relative significance of each GCO in the multivariate framework, addressing the limitations of traditional additive methods. The ENSO consistently emerged as a dominant modulator for all the hydroclimatic patterns across all the cities. However, the addition of AMO and/or IOD with ENSO play variable but significant roles in modulating the rainfall and temperature patterns whereas addition of NAO and/or PDO is found to be influential for drought analysis. The PSD scheme offers a refined approach for understanding climate teleconnections and the study findings underscore the need for location-specific analyses to support climate resilience strategies in monsoon-dependent regions like Kerala.
https://doi.org/10.1007/s44288-025-00231-5
If only scientists ever looked the long term effects of ocean oscillations like ENSO, the PDO and the AMO.
“If only scientists ever looked the long term effects of ocean oscillations like ENSO, the PDO and the AMO.”
Agreed.
FFS, as if nobody, over the past 50 years (at least) had ever thought to do this!!
In any case I smell bs. :
An over complex analysis, too many unnecessary fancy plots, a very small data set from a relatively small area.
The literature is full of studies which, like this one, claim to find associations in the data but which display an awful ignorance of statistical significance.
Give me just 40 years of data, (say) 6 independent indices, and I will uncover associations even if the data are random !! The key here is “degrees of freedom”.
Conclusion: Should never have been published.
What the world needs is more Reviewer 2s.
Thank you for your input.
SOLAR MINIMUM UPDATE
For more than 30 years, climate researchers have been puzzling about how human-forced climate change affects the El Niño Southern Oscillation (ENSO), the warm phase of which we refer to as El Niño and the cold phase as La Niña. There are two aspects to this question:
Has climate change affected ENSO already? and
How will climate change affect ENSO in the future?
Arguably, we have made more progress on the second question than the first because greenhouse gas forcing in the future is expected to be stronger than it has been up to now; the stronger the forcing, the more obvious its impacts become. Whether climate change has already affected ENSO has been a harder nut to crack. A previous blog article by Tom DiLiberto summarized the conclusions from the latest IPCC report, which essentially found that there was no clear evidence yet for an impact of climate change on tropical Pacific sea surface temperature (SST) anomalies related to ENSO. However, in a recent study published in Nature Reviews Earth and Environment, Wenju Cai and colleagues revisit this question, reviewing past studies and performing new analyses to provide additional insights on this important question.
https://www.climate.gov/news-features/blogs/enso/has-climate-change-already-affected-enso
That’s from an archived page, because Donald is trying to make sure climate scientists toe his party line.
So the simplest response to Gordo’s query is two-fold. First, he’s wrong to suggest that scientists haven’t studied ENSO. Second, he has it backwards: more forcing creates more feedback, not the other way around.
Hopefully even reviewer twos will get the point this time.
“greenhouse gas forcing in the future is expected to be stronger than it has been up to now”
Talk about deciding before anything else is examined. Where is the science in that?
Step 2 – Sammich Request.
Sometimes, scientists utilize an important skill they developed as children. They develop the assumption that that the world around them follows some lawlike regularities.
Cranks, and contrarians in general, learned to let go of that assumption. Cycle nuts, for instance, still assume it, at least sometimes.
∆T=5.35ln(C/Co)3/3.8
Assume first. Decide second. Climate Science example.
Ready, Fire, Aim
Said Climate Science.
Deny, Request, Admonish, Bargain.
Contrarians are so drab.
Believers in Climate Science are SO predictable.
Agreed, Willard. You should know since you are one of them denying much of Milankovic’s science.
Bill
The odd thing about your support for Milankovich science is that it supports AGW, while you don’t.
The measured changes in orbital parameters would lead to slow and continuing cooling from the Holocene Optimum towards the next glacial period over the last 5000 years.
That’s what we see in the temperature data from 3000BC until 1880.
After 1880 we see a transition from slow natural cooling to rapid artificial AGW.
Entropic man says:
”The odd thing about your support for Milankovich science is that it supports AGW, while you don’t.”
I have no idea what you are talking about EM. For example:
1) most of this historical record you want to talk about we didn’t have satellites to minimize the error impacts of UHI. I realize that you don’t go against Roy on this so why me? Roy tends to believe warming from CO2 in about the range I would have no dispute but note that atmospheric sciences are not nearly advanced enough to determine climate sensitivity on anything but the observation record. . .which favors no theory.
2) Milankovic science is poorly advanced yet widely accepted, in part, even in very controversial areas like the eccentricity variable where it appears very little science exists beyond Milankovic favoring it as the most dominate cycle.
So a clear delineation between natural warming and anthropogenic warming hasn’t been pursued.
3) I have not denied that CO2 has greater likelihood of warming than cooling especially in view of the number of possible theories and and a wide dispute about how much is available to obtain out of each theory. If I average them together as seems to be very popular in climate science that would suggest that CO2 can create warming. I don’t go around arguing about stuff for which there is no science to delineate between possibilities. And I don’t favor one theory over another simply because the theory comes up with a bigger number.
4) what I haven’t seen is processes of warming caused by CO2 being experimentally established and we rely on theory without fully understanding atmospheric processes resulting in estimates of warming being all over the place, along with widespread refusal to even accept what we are observing as being correct with each decade producing more excuses.
5) the obliquity parameter that you bank on for causing cooling may have some science behind it but I haven’t looked at it. If you have a good source for that science(assuming you just didn’t believe a blog post) I would be appreciative of getting a reference to it and explicitly how this assumption was calculated as to how much effect it has. What we do know is it doesn’t come close to even estimating natural climate change over longterm windows.
EM says:
”The measured changes in orbital parameters would lead to slow and continuing cooling from the Holocene Optimum towards the next glacial period over the last 5000 years.”
That seems probably true due to the fact that the only thing considered makes up much less than half the amplitude all the modes of global temperature change Milankovic examined.
Which would be that the ”dominate” Milankovic mode is theoretically capable of over completely overriding the Milankovic modes estimated over the past 5000 years by a wide margin.
Further if you estimate the maximum effect from that via Hays etal 1977 over 5000 years and the past 150years
of the industrial revolution and since 1980 you come up with -.39C and -12 thousandths of a degree C, and -4 thousandths of a degreeC because it is considered to be a linear variable.
These figures are based on the least amount of global warming (+-4c) for the entire globe estimated over the glacial/interglacial cycle.
Compare that to orbit perturbations affecting earth’s speed and distance variations due to gravitational pull of objects thought to be inside or just outside the solar system capable of at least 2.2C degrees at any point in time because its more than likely a non-linear variable.
But to pin this last point down somebody needs to return the Milankovic original work to the Library of Congress and somebody needs to create a budget to further analyze his work. Apparently the text was available to Hays etal, 1977 because they include it in their references.
As a result of the suppression of Milankovic’s work no work has been done on just how non-linear the eccentricity parameter is.
But it is very clear that the axial parameters which you focus on are incapable of creating the patterns of arctic climate change seen in the Alley, 2004 work. And that is the bottom line.
https://co2coalition.org/facts/temperatures-have-changed-for-800000-years-it-wasnt-us/
Believers in Climate Science are SO predictable.
Breaking News:
Dr Michael Mann is making the rounds on the talk shows to sell his new book. One of his more profound statements seems to be that climate change is responsible for COVID-19. I guess that takes care of the lab leak theory. It might be useful to know his opinion of Gain-of-Function research. He did not present his candidate for the intermediate animal to make the jump from bat to human. Responsible scientists will admit that animal is required for the zoonotic route. Without physically locating that animal, the zoonotic route does not exist.
It’s frustrating.
Covid-19 RNA was detected in the Wuhan market after it was closed, but the animals carrying it were long gone. Circumstantial evidence from the market and possible infections in villages further up the supply chain suggests that the vector was pangolins.
Nonsense! You have been fooled by spinners. The animal does not exist. Nothing at all that has been tried or tested works at all. SARS-CoV-2 does not exist anywhere in the wild, and to date, no crossover animal has been identified. Do you think the Chinese have an incentive to find that crossover animal to prove the lab leak is wrong? Others have an even larger incentive to find that link.
ent…there has never been proof offered that RNA is a marker for a virus. In fact, a pioneer in retrovirus technology in the early 1970s warned against associating RNA with a virus since RNA is so common in the human genome.
The RNA association was offered as a theory by Luc Montagnier who is credited with discovering HIV. Montagnier admitted he never did see HIV on an electron microscope as required by a gold standard laid down by the Louis Pasteur Institute where he did his research. The irony is that a member of his team, Dr. Barre-Sinoussi, sat on the board at the LPI which laid down the gold standard. She was ominously silent when Montagnier announced the discovery of HIV, that had abandoned her gold standard.
In fact, Montagnier never claimed to have discovered HIV, only to have ‘inferred’ it indirectly based on RNA he guessed was proof of the virus. Later, he claimed HIV is harmless to a healthy immune system and declared the cause of AIDS as oxidative stress related to lifestyle.
The Wuhan study was directly based on Montagnier’s inference. The scientists announcing covid in Wuhan did not claim to have isolated a virus only to have discovered RNA fitting Montagnier’s inference for a virus.
The field of virology is as screwed up as climate science. The field is full of contradictions and half-proofs and anyone who tries to correct the pseudo-science is summarily denounced. I am sure Roy and John of UAH will understand that process.
What is worse is that the test developed to detect a virus like HIV or covid, the RNA-PCR test, does not test for a virus, but for an unspecified degree of DNA iterated in the PCR method for DNA amplification. RNA, thought to be from a virus, is converted to DNA then amplified with the PCR method. PCR is an iterative method where more DNA is amplified per iteration. The number of iterations counted is held up as an indicator of a virus like HIV or covid.
A fly in the ointment was a statement by Kary Mullis, who won a Nobel for inventing the PCR method. He claimed that PCR cannot be used diagnostically to identify a virus which cannot be seen on an electron microscope. His reasoning was succinct, PCR amplifies everything in a DNA sample and if a virus cannot be seen in one sample, amplifying it will not reveal the virus.
Besides, why is HIV or covid so scarce that it cannot be seen on an EM?
You will likely run off to the Net and come back with graphics of HIV and covid, all of them fraudulent. Several reasons why they are fraudulent…
1)an EM is always in black and white.
2)an authentic image has a scale embedded as a size marker.
3)the virus particles should all be the same size and shape.
4)Hardly anyone out there can tell the difference between an actual virus and a viral fragment or a dead cell.
Virologist, Stefan Lanka, has released severalexampless of fraudulent images claiming to be measles, polio, etc. He has the training to tell a real virus from a fraudulent representation.
Right now, Robert Kennedy is trying to establish that vaccines can be dangerous. I have no opinion on that since I don’t think the truth is known either way. For me, it’s just as dangerous to claim vaccines are dangerous based on current evidence. However, we need to re-examine what we know about viruses and vaccines and that should not be resisted by anyone who cares about science.
One thing that has swayed me is studies by Stefan Lanka re viruses. He has raided serious questions that are being summarily dismissed by establishmentarians. That nonsense must stop in all science.
Many viruses we declared isolated during times when health conditions in the world were of a very low standard. Prior to 1950, health standards in my native Scotland, in higher density population areas, were abysmal. It was not till post WWII that major upgrades in sanitation were implemented and guess what, polio and other ailments disappeared.
Polio actually peaked in 1910 and disappeared on its own. Between 1910 and the 1950s when the vaccine appeared, it peaked and went away on its own several times. There is no point hiding behind a vaccine explanation when sanitation conditions might explain the disappearance of many ailments like measles.
All I am saying is that we need to be more open-minded about science in general. Questions and skepticism should e welcomed, not shunned and/or suppressed.
Robertson is such a dumb liar…
” Polio actually peaked in 1910 and disappeared on its own. Between 1910 and the 1950s when the vaccine appeared, it peaked and went away on its own several times. ”
https://polioeradication.org/about-polio/history-of-polio/
*
At the end of last year, a young doctor’s internship at my general practice ended.
Her parents were just as incredibly stupid as Robertson and refused to vaccinate their daughter against polio.
The result is that she, an actually beautiful woman, has been forced to drag her right leg behind her from the age of seven until the end of her life.
*
People can also get poliomyelitis at an advanced age.
A harsh but just punishment would be for Robertson to be struck down by this terrible disease in the most brutal way.
*
I have often enough exposed Robertson’s blatant lies about Lanka and measles.
What factors might be preventing the hottest summer days from warming as much as the cooler ones over the past 40 years?
All airport ASOS Stations are built over a substrate – usually gravel. This gravel substrate heats up quicker and reflects thermal energy better than the surrounding grass. This is useful for aviation as pilots MUST calculate various performance parameters before takeoff. Airliners don’t takeoff from grass – they takeoff from hot asphalt or concrete. I would argue that the temperature data from airport ASOS stations is biased by at least 1C because of how they are sited.