
 Home/Blog
The Version 6.1 global average lower tropospheric temperature (LT) anomaly for November, 2025 was +0.43 deg. C departure from the 1991-2020 mean, down from the October, 2025 value of +0.53 deg. C.
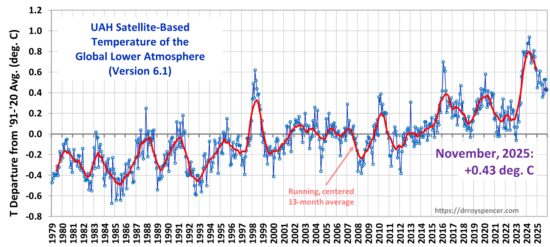
The Version 6.1 global area-averaged linear temperature trend (January 1979 through November 2025) remains at +0.16 deg/ C/decade (+0.22 C/decade over land, +0.13 C/decade over oceans).
The following table lists various regional Version 6.1 LT departures from the 30-year (1991-2020) average for the last 23 months (record highs are in red).
| YEAR | MO | GLOBE | NHEM. | SHEM. | TROPIC | USA48 | ARCTIC | AUST |
| 2024 | Jan | +0.80 | +1.02 | +0.58 | +1.20 | -0.19 | +0.40 | +1.12 |
| 2024 | Feb | +0.88 | +0.95 | +0.81 | +1.17 | +1.31 | +0.86 | +1.16 |
| 2024 | Mar | +0.88 | +0.96 | +0.80 | +1.26 | +0.22 | +1.05 | +1.34 |
| 2024 | Apr | +0.94 | +1.12 | +0.76 | +1.15 | +0.86 | +0.88 | +0.54 |
| 2024 | May | +0.78 | +0.77 | +0.78 | +1.20 | +0.05 | +0.20 | +0.53 |
| 2024 | June | +0.69 | +0.78 | +0.60 | +0.85 | +1.37 | +0.64 | +0.91 |
| 2024 | July | +0.74 | +0.86 | +0.61 | +0.97 | +0.44 | +0.56 | -0.07 |
| 2024 | Aug | +0.76 | +0.82 | +0.69 | +0.74 | +0.40 | +0.88 | +1.75 |
| 2024 | Sep | +0.81 | +1.04 | +0.58 | +0.82 | +1.31 | +1.48 | +0.98 |
| 2024 | Oct | +0.75 | +0.89 | +0.60 | +0.63 | +1.90 | +0.81 | +1.09 |
| 2024 | Nov | +0.64 | +0.87 | +0.41 | +0.53 | +1.12 | +0.79 | +1.00 |
| 2024 | Dec | +0.62 | +0.76 | +0.48 | +0.52 | +1.42 | +1.12 | +1.54 |
| 2025 | Jan | +0.45 | +0.70 | +0.21 | +0.24 | -1.06 | +0.74 | +0.48 |
| 2025 | Feb | +0.50 | +0.55 | +0.45 | +0.26 | +1.04 | +2.10 | +0.87 |
| 2025 | Mar | +0.57 | +0.74 | +0.41 | +0.40 | +1.24 | +1.23 | +1.20 |
| 2025 | Apr | +0.61 | +0.77 | +0.46 | +0.37 | +0.82 | +0.85 | +1.21 |
| 2025 | May | +0.50 | +0.45 | +0.55 | +0.30 | +0.15 | +0.75 | +0.99 |
| 2025 | June | +0.48 | +0.48 | +0.47 | +0.30 | +0.81 | +0.05 | +0.39 |
| 2025 | July | +0.36 | +0.49 | +0.23 | +0.45 | +0.32 | +0.40 | +0.53 |
| 2025 | Aug | +0.39 | +0.39 | +0.39 | +0.16 | -0.06 | +0.69 | +0.11 |
| 2025 | Sep | +0.53 | +0.56 | +0.49 | +0.35 | +0.38 | +0.77 | +0.32 |
| 2025 | Oct | +0.53 | +0.52 | +0.55 | +0.24 | +1.12 | +1.42 | +1.67 |
| 2025 | Nov | +0.43 | +0.59 | +0.27 | +0.24 | +1.32 | +0.78 | +0.37 |
The full UAH Global Temperature Report, along with the LT global gridpoint anomaly image for November, 2025, and a more detailed analysis by John Christy, should be available within the next several days here.
The monthly anomalies for various regions for the four deep layers we monitor from satellites will be available in the next several days at the following locations:


Latest NOAA prediction for ENSO (early November): currently in La Niña, 61% chance of moving to ENSO-neutral by Jan-March 2026. I never cease to be amazed by this (ENSO) phenomenon. The larger events (El and La) match up quite well with the “mountains” and “valleys” of the satellite record. It makes me wonder…are there other, less powerful, but still impactful phenomena (ocean-driven, solar) that are also driving global temps? I think we all need a lot more humility about these matters. I very much respect the training, abilities and experience of those who are devoted to the science (not the political science) of this. This (climate change) is clearly a “wicked problem”, which Judith Curry has described quite well.
The ups and downs of ENSO is not climate.
Note that ENSO has no impact over time periods of a decade or more. It is an oscillation imposed on the clear trend of AGW. The effect is amplified in the mid troposphere apparently, but surface temperatures that used to accompany a powerful el Nino are now colder than a strong la Nina.
Can you cite a study that shows that ENSO oscillations have been neutral with respect to global temperatures. There is definitely a periodicity to it, but the amplitudes are erratic. Has someone studied the energy added to the atmosphere during El Nino and found it is negated by the energy lost during La Niña? Part of my skepticism about AGW is how seemingly little we know about ocean processes and conditions compared to the atmosphere, given its critical role in the earth’s heat budget. The role of clouds is another concern I have. It is really hard for me to see the abrupt, significant changes in global temps brought about by ENSO and accept that it has no effect on GW. But if it has been studied I certainly will change my thinking.
“Can you cite a study”
Step 2 – Sammich Request
Let’s ask Thomas’ best buddy:
There is no greenhouse effect. It has never been observed, and it exists only in computer models of the climate. There is no ‘back radiation’. There are no definitive physics or evidence for CO2 causing warming. It cannot warm the oceans, and they contain 98% of the heat content of the Earth’s ‘surface’. The computer models all show CO2 causes a temp rise solely because they have written them that way. Planet surface temps are virtually all due to atmospheric pressure from density of gases (of the atmosphere – if the planet has one). The atmosphere actually cools the Earth via convection, not heats it. One day, climatologists who currently claim that there is a greenhouse effect will join the physicists saying that there isn’t one. We can all believe whatever science we want, but the truth will always out in the end. In the meantime, trillions of dollars will have been spent on something which doesn’t even exist, and not on poverty, which does.
The fact that cloudy nights are consistently warmer than clear nights is direct observational evidence of the greenhouse effect.
No, it isn’t. During solar strike (daylight), the Earth is heated by the Sun (120 deg C – same as the Moon) and atmospheric density (pressure). At night, it is atmospheric pressure alone. Cloud adds pressure density…and thus warmth.
Cloud = warmer. No cloud = cooler.
Buzz is clearly referring to the bogus “CO2 GHE”. Low clouds can definitely help to maintain surface temperatures, as can the atmosphere. But CO2 is unable to raise, or maintain, surface temperatures.
Buzz, clouds typically form in low pressure areas where air rises and cools. High pressure systems with subsidence clear the skies by suppressing vertical air movement.
Clint R, given that you presumably care about the credibility of this blog, we encourage you to provide evidence supporting your bold claim:
“But CO2 is unable to raise, or maintain, surface temperatures.”
Glad to help, dlhvrsz. I enjoy teaching physics.
Let’s start with an understanding of “temperature”. Use any reasonable source for a basic definition, such as:
https://en.wikipedia.org/wiki/Temperature
When you think you understand what temperature is, then describe it in your own words for a comment here. Once you demonstrate you understand temperature, we can move on to the next level.
Average kinetic energy of molecules in a substance.
Very good, dlhvrsz, short and right to the point. Well done!
Now, one of the big mistakes in “climate science” is believing that adding energy to a system always raises the system temperature. So, again in your own words, can you explain why adding ice cubes to a bowl of cold water (say 40 °F) does not raise the temperature of the water? Energy was added, but why didn’t the temperature increase?
The effect has been directly observed.
https://doi.org/10.1038/nature14240
CR:
“Low clouds can definitely help to maintain surface temperatures, as can the atmosphere. But CO2 is unable to raise, or maintain, surface temperatures.”
BUT how, using your “logic”, can low clouds heat the surface when they are colder than the surface?
Somewhat inconsistent aren’t we?
In this example, energy is transferred from warmer water to colder ice, cooling the water and melting the ice.
Don’t understand how this example relates to the CO2 warming mechanism.
@Buzz
“At night, it is atmospheric pressure alone”
_________________________________________
Pressure doesnt warm.
Pressure of the wheels of Your car is threfold atmospheric pressure; but temperature is exactly the same.
What Fritz said. A full scuba tank has 200 times the pressure of Earth at sea level, yet is the same temperature as the ambient air. I can tell you from experience I’ve never had a wet suit melt from a scuba tank. Pressurising changes temperature – equilibrium pressure has no effect.
Fritz and barry, the fact that the air in a scuba tank doesn’t remain hot indefinitely does not refute the theory that atmospheric pressure and insolation determines surface temperature, as the scuba tank scenario deals with heat transfer in a static, closed system, whereas the atmospheric pressure theory focuses on adiabatic processes in a dynamic atmosphere.
When a scuba tank is filled, the act of compression rapidly increases the temperature (adiabatic heating) due to the work done on the gas. Once the filling stops, the tank is no longer an isolated system in terms of heat. The heat quickly dissipates into the surrounding environment (water or air) via conduction and convection until it reaches thermal equilibrium. The final, stable temperature of the stored, high-pressure air matches the ambient temperature.
The atmospheric pressure theory argues that a planet’s surface temperature is primarily determined by total solar irradiance and atmospheric pressure, independent of greenhouse gas composition, by assuming an adiabatic, pressure-induced thermal enhancement (lapse rate).
dlhvrsz, you have evaded the question. You were specifically asked: “Can you explain why adding ice cubes to a bowl of cold water (say 40 °F) does not raise the temperature of the water?
Want a chance to redeem yourself? — The ice cubes add energy, yet the temperature does NOT go up. Why?
[If you don’t know, just admit it. There’s nothing wrong with learning. However, there IS something wrong with refusing to learn. That’s what cults do.]
“Want a chance to redeem yourself? — The ice cubes add energy, yet the temperature does NOT go up. Why?”
This has only been explained to you about 47 times.
Why do you keep pushing this horribly bad analogy?
Ice cubes add MASSS to the water along with their thermal energy.
Radiation adds energy via photons, which are essentially massless.
Are you truly unable to understand why these produce different results?
“primarily determined by total solar irradiance and atmospheric pressure, independent of greenhouse gas composition,”
Thoroughly debunked by many. Eg Roy Spencer:
https://www.drroyspencer.com/2011/12/why-atmospheric-pressure-cannot-explain-the-elevated-surface-temperature-of-the-earth/
The theory also relies on GHG to work!
I did answer your question. The water loses energy to the ice via molecular collisions, causing the water to cool as the ice melts.
That is conductive heat transfer, whereas CO2 warms the surface by absorbing and re emitting infrared radiation downward, which reduces the amount of heat Earth can lose to space.
If you think I am missing something, please explain what it is.
Mike Roberts, thanks for the link. Anyone skeptical of CO2’s impact on temperature should give it a read.
“Thoroughly debunked by many…”
Claimed to be debunked by many…and yet, after 14 years, it’s still going strong. As you know, many talking points are raised, and they all have been responded to.
My main point here was to note that Fritz and barry’s point does not debunk the theory. Even those that claim the theory is debunked do not use the line of argument that Fritz and barry have taken.
Of course, I will now be dragged into a 30-day back-and-forth, despite what I’ve said being correct…
Sorry dlhvrsz, but you’re evading the question again. And I know why.
You’ve realized that you’ve trapped yourself. Once you know what causes temperature, then you realize what it takes to raise temperature. And, once you realize what it takes to raise temperature, you become aware of the GHE hoax.
To raise temperature, the average kinetic energy must be raised. But ice can not raise the average kinetic energy of the bowl of 40 ° water. Even though energy has been added, the temperature does NOT rise.
So we don’t even need to talk about photons from CO2. You’ve already shown you don’t want to learn. And that makes you a cultist.
I am not sure how you overlooked the fact that we both agree the water temperature doesn’t rise in this scenario, but hopefully that becomes clear soon.
Your definition of “cultist” would include Dr. Roy Spencer, who accepts the CO2 greenhouse mechanism. We all approach these topics differently and peculiarly. I just hope we can show the blog owner the respect they deserve.
Clint R 11:20 am often tries hard to deceive some readers but fails here since Clint’s water is at 40F and the added ice cubes at 32F (or lower) so total thermodynamic internal energy is reduced, thus its avg. reduced, meaning temperature is reduced
When photons from CO2 are absorbed, total thermodynamic internal energy is increased, its avg. then increases, and temperature increases passing 2LOT.
Clint R often fails to understand this basic science.
dlhvrsz, your false accusations prove your cultism.
If you’re sincerely interested in respecting this blog, you would not be using cult tactics.
And, you would have a little more interest in reality….
“and yet, after 14 years, it’s still going strong.”
If so, only on the denialist blogosphere.
In actual science, a theory that is going strong would be getting replicated and experimentally tested by other scientists, who would cite this influential work in their publications.
That isnt happening.
“As you know, many talking points are raised, and they all have been responded to.”
Authors always have a response to criticism. That alone doesnt tell us anything.
“Of course, I will now be dragged into a 30-day back-and-forth,”
Pffft. Then why did you again bring it up?
I didn’t bring it up, Nate. Buzz did.
Try to understand that my only point was, Fritz and barry’s criticism is wrong. It’s wrong regardless of whether the atmospheric pressure theory is true or false.
Can you understand, Nate, that sometimes I just want to come on here and make one small, simple contribution on one single aspect of an issue? Do you get that I don’t necessarily want to have a month-long back-and-forth over whether the entire issue is “right” or “wrong”, every time I do so? Does it occur to you to ever just concede the simple point and leave it at that? Or must every interaction I have on here escalate and get out of hand and spiral into days and days on end of churning over every single argument that could possibly be made on the subject?
“Can you understand, Nate, that sometimes I just want to come on here and make one small, simple contribution on one single aspect of an issue?”
Oh, I’m sorry, I didnt know that your posts cannot be challenged.
“Do you get that I don’t necessarily want to have a month-long back-and-forth over whether the entire issue is “right” or “wrong”, every time I do so”
No. That is totally absurd.
No one is forcing you to engage in a month long discussion. Its very easy to avoid. Just stop posting!
Buzz expressed many standard GW myths which can be challenged, including that pressure causes global warming.
And no one forced you to make these arguments defending your pet theory that you brought up, in your second post:
” after 14 years, it’s still going strong. As you know, many talking points are raised, and they all have been responded to.”
Nate’s carefully avoiding responding to the only point I wanted to make. I assume that means he agrees: Fritz and barry’s criticism of the atmospheric pressure theory is false.
Good. Then there is no need for Nate to respond further.
Buzz has discovered one thing, and it’s the contrarian tango.
Step 1 – Pure Denial:
– There is no
– It has never
– it exists only
– There is no
Step 2 – Sammich Request:
– There are no definitive physics or evidence
Step 3 – Saying Stuff:
– The computer models
– Planet surface temps are virtually all due to
– The atmosphere actually cools
– trillions of dollars will
Step 4 – Cheap Bargaining:
– One day, climatologists will join
– We can all believe whatever science we want, but
“I assume that means he agrees”
Again, out of one side of your mouth, baiting, by making false assumptions that INVITE a response.
WHile out of the other side of your mouth insisting that you dont want to argue any further.
Is imaginary point scoring more important, or ending the argument?
Lets see what you decide..
Well, if you disagree, you’re wrong. Since you still refuse to actually clearly state your position I’ll continue to assume that you agree.
When you assume you can read minds, mine or Buzz’s, you just make an ass of urself.
Nate just refuses to make his position clear on the simple point. So, now the “argument” (actually no counter-argument to my 6:33 AM comment has been made, so there’s no real “argument” going on here at all) will be extended by yet another day.
Nate, Fritz and barry’s point is false. It does not debunk the atmospheric pressure theory. Do you agree, yes or no?
DREMT,
Buzz wrote:
“Planet surface temps are virtually all due to atmospheric pressure from density of gases (of the atmosphere”
Fritz and my rebuttal covers exactly that. Atmospheric pressure alone does not create heat. No more than a full scuba tank or an inflated tyre are any different to ambient air temperature.
If you want to extemporise on Buzz’s assertion, go right ahead, but that will no longer be what Buzz asserted.
No one is forcing you to comment. Quit the victim theatrics.
As explained, and not rebutted, your criticism fails, barry.
“No one is forcing you to comment. Quit the victim theatrics.“
I don’t have a problem commenting on what I chose to comment about. I strongly object to being baited into discussing anything else, however, because then the debate just goes on indefinitely. I just came onto this thread to make one simple point. Other people would be allowed to do that.
Puffman may need a reminder:
– Your beliefs ain’t
– You really have NOTHING
are examples of Step 1 – Pure Denial
– You have no definition
– You have no model
are examples of Step 2 – Sammich Request
– You don’t even understand
– beliefs and false accusations.
are examples of Step 3 – Saying Stuff
Nate’s refusal to answer my question speaks for itself.
Issue settled in my favour.
Barry speaks for himself. But I agree with him and Willard, because you didnt read Buzz’s mind. Yet are insisting you know what he intended anyway.
“Nate’s refusal to answer my question”
Still baiting?!
Looks like you really do want to foment an extended pointless argument.
Nate’s talking absolute nonsense again. Apparently I “read Buzz’s mind”!?
All this because he can’t just answer with “yes” or “no”. So I still have no idea where he stands on the only issue I actually wanted to discuss.
What’s the f*cking point? Seriously.
https://www.drroyspencer.com/2024/08/yes-the-greenhouse-effect-is-like-a-real-greenhouse-and-other-odds-and-ends/
Fritz and barry’s point does not debunk the atmospheric pressure theory. Yet, they won’t listen, won’t learn, and next time the theory is brought up, they’ll just say the exact same thing again.
Robert,
You might also like:
https://rabett.blogspot.com/2017/08/making-elephant-dance-as-performed-by.html
See? I’m not allowed to just make my point. People have to attempt to bait me into another full-on debate on whether the atmospheric pressure theory is “right” or “wrong”. But, whether it’s “right” or “wrong”, Fritz and barry’s point does not debunk it.
If people could just concede that point, I’d leave it alone. They never do, though. Nobody ever concedes anything, the subject is just changed onto the next point.
Willard will now just link to blog article after blog article from professional sophists who have devoted their lives to lying on blogs about the GHE, all giving their two cents on the issue, and he won’t ever link to any of the rebuttals or commentary from those who support the atmospheric pressure theory. He will do this by pretending to be responding to others on this thread, when in reality his only interest is to attempt to irritate me.
Graham D. Warner seems to have responded.
Either he repeated what he already said or he ripped off his shirt about how people are mean to him.
Better ignore him.
DREMT,
So your theory – which is distinct from Buzz’s – is:
“The atmospheric pressure theory argues that a planet’s surface temperature is primarily determined by total solar irradiance and atmospheric pressure, independent of greenhouse gas composition, by assuming an adiabatic, pressure-induced thermal enhancement (lapse rate).”
Stratospheric pressure, like the troposphere, declines with altitude. But unlike the troposphere, temperatures rise with height.
If pressure was a determining feature, temperatures should steadily decline with altitude to the edge of the uppermost atmosphere.
Your theory doesn’t hold.
barry:
1) It’s not “my theory”, nor is it distinct from Buzz’s. It’s the atmospheric pressure theory. It’s well-known. When somebody suggests that atmospheric pressure determines surface temperature, that’s the theory they’re referring to.
2) You’ve switched your argument. You’re doing exactly what I said would happen. I came on here to make one simple point – that the argument you and Fritz originally made does not debunk the atmospheric pressure theory. Without conceding that point, you’ve now moved onto another point (which also does not debunk the theory). This is how you guys operate. So, what will happen if I now debunk your new argument? You’ll just come up with something else. The back-and-forth will continue, until we’re here for the standard 30 days. The subject will be “is the atmospheric pressure theory correct?”, but that’s not what I came on here to discuss.
Will you concede that your original argument is debunked, barry?
I didn’t switch my argument. I replied precisely to what Buzz said. Now that I’ve replied to what you said, quoting you, you continue with the soap opera BS instead of just replying to the substance of the argument.
No, you didn’t debunk my take on Buzz. You aren’t a victim of recalcitrant commenters. We simply disagree on what he meant, and you are issuing ultimatums unless people agree with you on that. You’re not being dragged into a pointless argument; you’re instigating it. And it looks like that’s the hill you’re going to die on.
You can reply to the substance of my comment or you can continue to play poor me. It’s entirely your choice. No one is forcing you to do anything. You’re the only one trying to police this conversation. It is my choice to ignore your your demands. It may be your choice to use that as an excuse not to reply to my rebuttal.
Here it is again:
Stratospheric pressure, like the troposphere, declines with altitude. But unlike the troposphere, temperatures rise with height.
If pressure was a determining feature, temperatures should steadily decline with altitude to the edge of the uppermost atmosphere.
Your theory doesn’t hold.
https://oceanografia.ufes.br/sites/oceanografia.ufes.br/files/field/anexo/new-insights-on-the-physical-nature-of-the-atmospheric-greenhouse-effect-deduced-from-an-empirical-planetary-temperature-model.pdf
Go to the section beginning “Effect of pressure on temperature:” and read it. That refutes your new argument.
“This implies that the absolute temperature of a gas may not follow variations of pressure if the gas energy absorption changes in opposite direction to that of pressure. For instance, the temperature of Earth’s stratosphere increases with altitude above the tropopause despite a falling air pressure, because the absorption of UV radiation by ozone steeply increases with height, thus offsetting the effect of a dropping pressure.”
Correct to a degree.
This corroborates my point that pressure is not a determinant of the temperature gradient. The authors correctly point (here) out that radiative factors dominate.
Where they go wrong is, “thus offsetting the effect of a dropping pressure.” Temperature gradient is not an effect of pressure difference.
The temperature gradient of the troposphere is different from the stratosphere because most sunlight passes through the atmosphere and warms the surface (most UV is absorbed above the troposphere), so radiative absorption in the troposphere is almost entirely IR from the surface. The stratosphere is warmed from above because ozone intercepts UV. The troposphere is warmed from below because greenhouses gases intercept (strongly absorb) upwelling IR.
Convection in the troposphere is caused by the negative temperature gradient. While convection and the adiabatic process of contributes to the magnitude of the lapse rate, it is not responsible for it.
EG, the mesosphere has the same sign temperature gradient as the troposphere, but without much convection – this atmospheric layer is too thin, and the lapse rate too shallow to provide much buoyancy. Here the radiative action determines the lapse rate, not adiabatic processes. In this case ozone is most abundant at the bottom of the mesosphere and rapidly thins with altitude. This, and the cooling provided by CO2 determines the lapse rate, with little contribution from convection.
In the thermosphere the temperature gradient inverts again, rising sharply with altitude and once more, this is dominated by radiative effects, not pressure. Intense UV and X-ray is absorbed from the top of the thermosphere, with less filtering through as altitude decreases.
In all layers, radiative effects determine the sign of the temperature gradient. In the troposphere, the lapse rate is enhanced by convection and the adiabatic process. These processes could not occur without the negative temperature gradient set by greenhouse gases absorbing upwelling IR (plus a sufficiently dense medium providing the framework for buoyancy).
This is also incorrect.
“Any variation in the global infrared back radiation caused by a change in atmospheric composition would be compensated for by a corresponding shift in the intensity of the vertical convective heat transport.”
Vertical convective transport cannot intensify simply due to enhanced ‘backradiation’. Intensified convection is caused by a change (warmer) in surface and atmospheric temperature.
And we have abundant real life evidence for this. Convection is more intense in the tropics than the poles. The same applies for warm and cold regions (deserts/mountain ranges) around the Earth.
Surface temperature is correlated with convection intensity, not ‘backradiation’ increase.
Seems these authors want to wipe out greenhouse warming. This has led them to make some strange assertions… with a surprising (or not) lack of familiarity with standard meteorology.
“Thought Experiment #1 on The Pressure Effect
If it is atmospheric pressure which causes the relative warmth of the lower troposphere versus the upper troposphere, then why is the average temperature of the stratosphere virtually constant with height, despite the air pressure at the base of the stratosphere (200 millibars) being about 100x that at the top of the stratosphere (2 millibars)?
If you say it’s due to sunlight absorption by ozone warming the middle and upper stratosphere, you would be correct. But how does the stratosphere then lose all of that extra energy it gains by solar absorption? Well, that occurs through IR emission, primarily from carbon dioxide. The temperature of the ‘ozone layer’ increases until the IR loss (primarily by CO2) equals the rate of solar absorption by ozone. Again, it’s an energy budget issue, not an air pressure issue.
The point I’m making with the stratosphere example is that greenhouse gases are necessary to explain the temperature profile of the stratosphere, not what the “pressure enhancement” theory of climate would predict.
And if greenhouse gases influence the stratosphere, then they must also be operating in the troposphere.”
https://www.drroyspencer.com/2011/12/why-atmospheric-pressure-cannot-explain-the-elevated-surface-temperature-of-the-earth/
barry proves every single word I have said on this thread correct.
He now wants a full-scale debate on whether the atmospheric pressure theory is “right” or “wrong”.
That’s not what I came on this thread to do. I’ve already achieved what I came on this thread to do. Refute Fritz and barry’s original argument. That’s done, they just couldn’t admit that had occurred. So then, barry made a second argument. I refuted that too. So now, barry has made a third argument.
For crying out loud.
No, DREMT 9:13 am, you haven’t refuted Fritz or barry in this thread because a planet’s surface temperature is primarily determined by total sun irradiance, the atmosphere’s surface pressure, and its optical depth set by gas composition.
There is no need to just assume an adiabatic, pressure-induced thermal enhancement as you claimed 6:33 am since if there is nil planetary GHE due to gas composition, there is nil avg. natural lapse rate in the troposphere just like the earthen lower stratosphere.
Nope, I refuted what you said about the pressure/adiabatic process theory, and then refuted argument in the link that you provided to rebut what I said.
If you don’t want to have a conversation about this topic, then don’t provide material that extends it.
Incorrect, barry. It’s as I said. Thank you for the gift of this eternal victory.
Thank you for proving me right.
“That’s not what I came on this thread to do.”
But you keep doing it!
“Go to the section beginning “Effect of pressure on temperature:” and read it.”
You keep defending the ‘pressure theory’, which is not an actual theory at all, then whining when people rebut you.
Paathetic.
Nate piles on to help prove me right even more.
Thank you.
“help prove me right”.
Oh dont start speaking Clintspeak, the language of tro.lls.
Nothing said here proves you right.
Wrong, Nate. Anyone reading through the thread can see that I called you guys on your behaviour correctly from the start. I know exactly what your game is, I know exactly how you operate, and I predicted exactly what barry was going to do!
You simply cannot just concede the simple point, so you find some excuse to dodge conceding it, then switch to another argument. If I don’t play ball, you bait me until I do. Then, when I trash the second argument, you just come up with a third, and a fourth (I see barry raised some other point as well) and then pretty soon you’ve dragged me into your little game – the 30-day back-and-forth…
This is how the discussion should have gone. I write this comment:
https://www.drroyspencer.com/2025/12/uah-v6-1-global-temperature-update-for-november-2025-0-43-deg-c/#comment-1724783
and then Fritz and barry concede that their point was refuted. That’s what should have happened. Then, I wouldn’t have said another word. But, here we are. You guys simply don’t have the integrity to admit you were wrong. So, you get me making an example of you, instead.
Except their point wasn’t refuted in any physical way, just some DREMT imaginary physics. Nonetheless, DREMT will predictably keep trying without success.
Ball4 lies, as usual.
Here you go, Ball4, this is from Google AI:
“Why the Scuba Tank Analogy is Ineffective Against N&Z
The scuba tank example highlights the difference between adiabatic and diabatic processes:
Adiabatic Process: When a gas is rapidly compressed (like filling a scuba tank or air descending in the atmosphere), its temperature increases because work is done on the gas with little immediate heat exchange with the surroundings. Once the compression stops and the system is no longer isolated, the gas will eventually exchange heat with its environment and cool to ambient temperature.
Nikolov and Zeller’s Argument: N&Z’s critics, not N&Z themselves, often use this principle incorrectly. N&Z actually focus on the sustained atmospheric temperature gradient maintained by gravity and a continuous external energy source (the Sun), which is a continuous, quasi-equilibrium process, not a one-time compression event like filling a tank.
The Flaw in the Scuba Tank Objection: The scuba tank objection points out that the initial compression heating is temporary without a continuous energy input. However, N&Z’s model for planetary atmospheres assumes a continuous energy balance where the planet constantly receives solar energy. Their theory suggests that pressure and density gradients, as defined by the Ideal Gas Law and modified by gravity, are the primary drivers of the stable, sustained temperature profile in the lower atmosphere (troposphere), an effect they call the "Atmospheric Thermal Effect".”
Do you recall this:
“No one is forcing you to engage in a month long discussion. Its very easy to avoid. Just stop posting!”
Yet you keep posting, responding, defending NZ, then when people respond to that, you again haul out the childish bitching ‘thats not the point i wanted to make’ “people need to stop baiting me’.
Clearly you are proving that you have no control over your own posting.
Your incessant demands for people to ‘concede’, just shows that you extremely insecure!
Barry’s assessment was spot-on.
“No, you didn’t debunk my take on Buzz. You aren’t a victim of recalcitrant commenters. We simply disagree on what he meant, and you are issuing ultimatums unless people agree with you on that. You’re not being dragged into a pointless argument; you’re instigating it. And it looks like that’s the hill you’re going to die on.
You can reply to the substance of my comment or you can continue to play poor me. It’s entirely your choice. No one is forcing you to do anything. You’re the only one trying to police this conversation. It is my choice to ignore your your demands. It may be your choice to use that as an excuse not to reply to my rebuttal.”
Your absurd query to Google/AI leads nowhere and to utter confusion when I try it.
They think the ‘discredited NZ theory’ invokes the ‘scuba tank analogy’. And its only sourcces are denialist blogs
Nate, the point is that Google AI is extremely biased against the atmospheric pressure theory, but even that agrees that Fritz and barry’s point does not debunk it.
You guys simply cannot concede any point, ever, under any circumstances.
Seems to me the CO2 theory of climate change is just another bust like the Japanese Kugo death ray that was imagined out of Tesla’s Teleforce. The problem was it wasn’t a ray but instead a particle beam which leads into the problem of rays sometimes acting like particles and particles sometimes acting like rays which remains a mystery in the science of light.
IMO, its not wise to assume that one has arrived at an answer to that conundrum when all may be explained by water vapor’s unique ability to transfer energy, SB laws, and changes in mean annual insolation both from solar changes and celestial object position changes (e.g.barycentric motion).
In fact to this day Jupiter and Saturn are the only recognized explanation for the observed approximate 100,000 year interglacial periods, but it seems obvious that its more than just Jupiter and Saturn is begging for a modeling effort to narrow the gaps in our understanding of decadal, centennial, and millennial climate changes that belies the Al Gore theory which denies these changes that are obvious in the observation records.
“Seems to me”
Gill has at least that first part right.
ROFL
“Barry’s assessment was spot-on.”
…in your extremely, hopelessly biased opinion. Fritz and barry’s original argument is debunked. There aren’t multiple ways to interpret Buzz’s remarks. He was referring to the atmospheric pressure theory, so that’s that. barry then switched his argument to a different one, involving the stratosphere. I said I wasn’t interested, but he baited for a response. I said that if I debunked his second argument, without him conceding it he would then raise another argument. That’s exactly what happened.
It’s not insecurity. If you people won’t concede points then debate is impossible. I have little doubt that barry will raise both his stupid, failed arguments again the next time the atmospheric pressure theory is brought up.
“water vapor’s unique ability to transfer energy”
Some might argue it transfers energy so well it cools the Earth…
Wait – did Gill just throw more than half of our Sky Dragon cranks under the bus?
ROFL
“There aren’t multiple ways to interpret Buzz’s remarks. He was referring to the atmospheric pressure theory,”
This is your opinion about what somewhat else is thinking.
Others disagree. So it is not a fact.
You keep insisting other people need to ‘concede’ that your opinion is a fact.
Many people here have different opinions and few ever concede theirs is wrong.
Only YOU make a habit of demanding people concede to YOUR opinions, regardless of their factual basis.
Nate, perhaps you can explain what other atmospheric pressure theory there is, that Buzz could have been referring to? Or maybe just stop being so utterly desperate and pathetic.
Fritz: “(Atmospheric) Pressure doesnt warm.”
barry: “What Fritz said.”
DREMT: “what I came on this thread to do. Refute Fritz and barry’s original argument.”
Ball4: “Except their point wasn’t refuted in any physical way” by DREMT.
DREMT 3:31 am now erroneously tries to call in google AI: “N&Z actually focus on the sustained atmospheric temperature gradient”
Thus, as I wrote earlier, Fritz and barry’s atm. pressure doesn’t warm point is NOT refuted by DREMT or DREMT’s AI quote in any physical way.
But it’s reasonably obvious DREMT will keep trying to deceive readers with malarkey not help them with proven physics.
Proven liar and notorious climate troll Ball4, AKA The Twister, twists and distorts everything once again.
Many ignorant people ovrr the yearshave invoked gravity induced pressure alone causes warming and, also, the lapse rate.
It even goes back to the 1800s when Lord Kelvin explained the hotness of stars and planet cores arising from gravitational compression, which happens, but has stars and planets cooling off way too quickly.
…and, it’s not refuted by the scuba tank analogy. No theory that the Earth’s surface is warmer due to atmospheric pressure is refuted by that analogy. Thus, Buzz’s comments cannot be refuted by that analogy, regardless.
Here is a good presentation of a simple Pressure theory in first 5 minutes.
It is just P and the Ideal Gas Law.
It is not NZ
https://www.youtube.com/watch?v=V0jdPQ9aGbY
I’m aware of Robert Holmes, Nate.
I repeat, more loudly so that you will pay attention this time: No theory that the Earth’s surface is warmer due to atmospheric pressure is refuted by the scuba tank analogy. Thus, Buzz’s comments cannot be refuted by that analogy, regardless.
I notice that Graham replied.
That usually means he’s repeating an assertion, ad nauseam.
It may also contain bold.
As if repetition and bold stood for arguments.
Both can be ignored.
‘I’m aware of Robert Holmes, Nate.”
Then you were aware, afterall, that there is a pressure theory other than NZ.
“I repeat, more loudly so that you will pay attention this time: No theory that the Earth’s surface is warmer due to atmospheric pressure is refuted by the scuba tank analogy”
You can scream it as often as you want, and you would be wrong each time.
THIS pressure theory in the video is thoroughly debunked by the scuba tank analogy.
Because it relies on the ideal gas law, which only applies to an isolated gas that is compressed and is unable to lose heat to the environment.
The scuba tank is able to lose its heat of compression to the environment, and thus cools back to ambient T.
Incorrect, Nate. From Google AI, again:
“The fact that a scuba tank does not remain warm after being filled does not refute Robert Holmes because his theory applies to sustained atmospheric conditions on planetary bodies, not the transient temperature changes of a gas in a sealed, contained system. The scuba tank example is a misapplication of the theory’s context.
The Key Difference
The scuba tank example cannot refute Holmes’ theory because:
Time Scale: The heating of a scuba tank is a short-term, initial event, whereas Holmes’ theory is about long-term, steady-state thermal enhancement in a continuous atmospheric column on a planetary scale.
System Boundaries: A scuba tank is an isolated, finite volume of gas interacting with a external environment. A planetary atmosphere is an open system with continuous energy inputs (solar radiation) and outputs (outgoing longwave radiation), governed by persistent gravitational forces and convection over a massive scale.”
This is why nobody with any knowledge uses the scuba tank analogy to try to debunk the atmospheric pressure theory.
DREMT 11:12 am, your last sentence by itself is correct meteorology. Good job. Buzz somewhat incorrectly writes: “At night, it is atmospheric pressure alone. Cloud adds…”
…optical depth to the atm. so Buzz is only correct in meteorology to the extent increased avg. atm. surface pressure increases atm. optical depth which as a result means planetary near surface global atmosphere avg. temperature is also increased accordingly.
The Twister twists again, like he did last Summer…
Clearly you dont understand his theory, and thus need defer to Google/AI, which clearly doesnt either.
For example:
This,
“A planetary atmosphere is an open system with continuous energy inputs (solar radiation) and outputs”
is true, but HIS theory doesnt account for energy inputs or outputs at all!
It is purely an application of PV =rho*RT, where rho is density, on a gas that is isolated and unable ro gain or lose energy.
Thus he finds that when compressed, so that P is higher and volume is lower, the T and density of a gas goes up!
But they would not stay up in an open system, that could gain or lose energy, like a scuba tank!
You have to look a little deeper into these things, Nate:
http://jearthsci.com/article/10.11648/j.earth.20190806.15
“It is more confirmation that the main determinants of atmospheric temperatures in the regions of terrestrial planetary atmospheres which are >0.1 bar, is overwhelmingly the result of two factors; solar insolation and atmospheric pressure. There appears to be no measurable, or what may be better termed ‘anomalous’ warming input from a class of gases which have up until the present, been incorrectly labelled as ‘greenhouse’ gases.“
More correctly, as DREMT 3:34 pm points out in a clip, such atm. gases should be labeled IR active. Greenhouse gases more likely from cats with digestive issues.
Increased atm. surface pressure increases atm. optical depth so of course is a main determinant along with solar insolation of atmospheric temperatures in the regions of terrestrial planetary atmospheres which are >0.1 bar; DREMT really is starting to look a little deeper into these things. Keep up the good work.
You are welcome to look further into it. Please explain what you think this ‘theory’ is saying.
His video makes his ‘theory’ abundantly clear for me. It is the Ideal Gas Law, and that’s about all.
Which says that if you compress a gas isolated from the environment, it will get hotter.
That is not applicable to our atmosphere, and will not produce a persistently warm surface, as the scuba tank perfectly illustrates.
It has nothing about the solar heating or heat loss playing a role.
Overall, it seems Holmes is suggesting that auto-compression sets the surface temperature, convection is the process that maintains that initial compression temperature, and that process of maintaining the temperature is driven by the Sun. Thus, the scuba tank analogy again fails to refute his theory.
Genuinely, I am not aware of any atmospheric pressure theory that is refuted by the scuba tank analogy. I’m not even saying the atmospheric pressure theory is definitely “right”. I remain skeptical. I’m just pointing out that it’s not refuted by the scuba tank analogy.
But, I understand that once again you feel motivated to pursue this discussion indefinitely, maybe even longer than the usual 30-day period you insist on.
“But, I understand that once again you feel motivated to pursue this discussion indefinitely”
Look in the mirror to see who has been pursuing this losing argument indefinitely.
Your claim about the NZ theory “When somebody suggests that atmospheric pressure determines surface temperature, that’s the theory they’re referring to” was FALSE, now that you remember that there was at least one other ‘theory’.
To illustrate how stoopid the Holmes theory is, he plugs in the known pressures and densities for 3 planets/moons. And gets out the known temperatutures!
Wow, impressive!
Not at all. He has simply demonstrated that knowing two of three variables in the Ideal Gas Laws, he can know the third!
IOW the Ideal Gas Law works!
He does not try to explain how the gas gets to that condition, which of course requires the GHE.
“Your claim about the NZ theory “When somebody suggests that atmospheric pressure determines surface temperature, that’s the theory they’re referring to” was FALSE, now that you remember that there was at least one other ‘theory’.”
Wrong again, Nate. Holmes’ theory is really quite similar to N & Z’s (indeed, he references them in his work), and N & Z came before him, so…you’re clutching at straws, really.
My point was the scuba tank analogy does not refute the atmospheric pressure theory, and I think anyone reasonable would conclude that I’ve more than made that point. We’re just at the “Nate refuses to concede” stage.
Willard says:
” ”water vapor’s unique ability to transfer energy”
Some might argue it transfers energy so well it cools the Earth…
Wait – did Gill just throw more than half of our Sky Dragon cranks under the bus?
ROFL”
Sure if you want to believe that, be my guest.
Water vapor only cools the surface by heating the atmosphere so it doesn’t cool ”the earth”.
Once in the heat is in the atmosphere the only way that heat can be lost is to space by radiation.
Recall we have all agreed that how the GHE works is via warming the atmosphere. . .first by warming to more than the temperature of space and then subsequently having a source of heat to warm it more.
“Wrong again, Nate. Holmes’ theory is really quite similar to N & Z’s (indeed, he references them in his work), and N & Z came before him”.
Now you shamelessly try to rationalize your false claims about there being only one pressure theory.
This sort of tactic is what leads to endless pointless arguments.
NZ would be aghast at hearing that you think they are similar, and that their theory is simply the Ideal Gas Law.
“My point was the scuba tank analogy does not refute”
Again you confuse repeated assertion with a successful argument.
Sorry, you only get a participation trophy.
BTW, the more I read, the worse NZ gets.
Someone pointed out that the first exponential term in their equation accounts for 4 planets, but fails to predict the T of Venus. The Moon does not count because it is a constraint.
So they add a second exponentional term JUST for Venus. It has negligible contribution to the T of the other planets, as I confirmed.
That term has two new parameters which are determined by JUST ONE data point, Venus.
IOW, Venus is FUDGED. This is an exercise in over-fitting, a big no-no in stats.
In the video, @ 13:20, he states, “In Astronomy, we call this the Kelvin-Helmholtz contraction. Thats how stars form. When a large amount of gas compresses due to gravity in space, it goes up to mullions of degrees. It only goes to 33 degrees on Earth because there is only a tiny amount of gas involved”
This is a very clear statement that the heating he is talking about is what you get when a gas is compressed.
And he fails to mention that the temperature rise of stars in this model is transient. They eventually cool back down, just as the scuba tank does.
Sorry.
His theory paper is different, and as you note came much later after NZ.
If you say so, Nate. Whatever your ego needs to hear.
“we have all agreed that how the GHE works is via warming the atmosphere”
And now Gill is trying to suggest that the atmosphere is warming because it is warming.
ROFL!
Let’s see what kind of “we” we are talking about:
https://climatepuzzles.org/wp-content/uploads/2024/01/HolmesResponseIGL_r0.pdf
I noticed that Graham responded to Nate, but without even reading his contributions astute readers can bet that he hasn’t provided the proper provenance to Ian’s theory. He failed to do so with Ned’s recently. He failed so many times over the years.
Not that this matters anymore. Graham is better ignored.
Nate simply does not listen, so this is just for anyone reading.
“This is a very clear statement that the heating he is talking about is what you get when a gas is compressed. And he fails to mention that the temperature rise of stars in this model is transient. They eventually cool back down, just as the scuba tank does.”
I know. But, as I already stated:
“Overall, it seems Holmes is suggesting that auto-compression sets the surface temperature, convection is the process that maintains that initial compression temperature, and that process of maintaining the temperature is driven by the Sun. Thus, the scuba tank analogy again fails to refute his theory.”
He just chooses to ignore what he chooses to ignore. It really is a waste of time trying to reason with him.
By the way, this makes for entertaining reading:
https://www.researchgate.net/publication/377301410_Critical_analysis_of_Robert_Wentworth's_attempted_take_down_of_Holmes_on_the_Ideal_Gas_Law
“I know. But, as I already stated”
Then you proceed to completely ignore this direct evidence that contradicts your argument that there has been NO OTHER pressure theory.
Shameless.
This is why arguments with you never end.
Astute readers might have noticed the first DOI in the above quote.
Searching for it should lead to an article in which we can read:
Op. Cit.
Vintage 2017-11.
Graham D. Warner might still deny that theory, but at this point there’s little we can do about that.
OMG, what is Nate whining about now?
If Buzz was talking about N & Z, then the scuba tank analogy does not refute his comments. If Buzz was talking about Holmes, then the scuba tank analogy still does not refute his comments. So, this is all a fuss about nothing. I referred to two closely-related theories under one umbrella term “the atmospheric pressure theory”. So what?
Nate just has to have something to moan about.
I showed you a video by Holmes. When I point out his quote that makes clear that gis theory can br debunked by the scuba tank.
You say
“I know. But, as I already stated”
Do you know?
Because THEN you pretend that there is no such video explaining his easily debunked theory.
And instead point to a different later theory that references NZ.
Shameless.
Nate,
At this point of the exchange Graham usually tries to build himself a motte. Alas, Ned and Karl insists on the bailey:
https://tallbloke.wordpress.com/wp-content/uploads/2011/12/unified_theory_of_climate_poster_nikolov_zeller.pdf
That theory doesn’t cohere with the claims made by Puffman, Graham or Gill. It’s not like there has never been coherent forthcoming from our Sky dragon cranks.
“I showed you a video by Holmes. When I point out his quote that makes clear that gis theory can br debunked by the scuba tank.”
FFS. Holmes only has the one theory. It cannot be debunked by the scuba tank analogy. He mentions the gas compression in the video, but what you’re not getting is, that’s not the whole story. I’ve tried to tell you twice already, the compression sets the surface temperature and then “convection is the process that maintains that initial compression temperature, and that process of maintaining the temperature is driven by the Sun. Thus, the scuba tank analogy again fails to refute his theory”.
You just keep ignoring the rest of the theory, and continuously shouting “shameless” at everything I say, for no reason other than that you’re confused.
“FFS. Holmes only has the one theory”
Now you are reading Holmes mind as well as Buzz’s.
The video and the quote at the end of it makes it crystal clear what his ‘theory’ was at that time. And it can be debunked by the scuba tank.
This is a good example of the ‘gravity compression theory’ of the warm Earth that has been out there amongst deniers.
Buzz most certainly could have been thinking of this ‘theory’.
That Holmes had a different theory later is irrelevant.
I’m not reading anyone’s mind. Read his papers, instead of relying on a YouTube video! Jesus wept you are stubborn. He didn’t produce “a later theory”, that paper of his I linked to before was just an additional discovery he came across which provides more evidence for his theory. It all comes back to the same thing.
Whatever you may know about his thinking, it is not conveyed in the video.
Astute readers could of course go beyond Gill’s peddling and search for the second DOI:
https://sciencepublishinggroup.com/article/10.11648/j.earth.20180703.13
They certainly should not wait for Graham to show he has done any reading that would be useful to them.
They definitely should ignore his protestations.
I know of no atmospheric pressure theory that’s refuted by the scuba tank analogy.
That won’t stop you guys from bringing up the analogy for the rest of your lives, I’m sure.
DREMT 9:30 am, again, Nate gets the same answer as Eli does for the GPE. Anything else is immaterial; if any disagreement really was fundamental, Nate would get a different GPE answer than Eli which is not the case.
Ball4 can’t even comment in the correct place.
“This (climate change) is clearly a “wicked problem”, which Judith Curry has described quite well.”
Judy likes to sweet talk about wickedness until she realizes that she’s addressing people who know about wickedness:
Source: https://fooledbyrandomness.com/climateletter.pdf
Contrast that with fund managers who overcharges to underperform the SPY all his life while shifting the risks on their clients.
Barry,
Right on. It’s as if Ned did not realize the difference between transient and persistent processes.
That sky dragon cranks persistently argue for a transient process is kinda poetic, however.
Did I say “Ned”? I mean Buzz.
Sorry, Buzz.
Even Ned would probably pick up on this graph’s downward trend since 1995:
https://drive.google.com/file/d/1jFVD4AOyXQXIAotsDflm6ISagb5SpOtb/view
Maybe there’s a whole new level of awareness we’re all missing.
Fritz and barry’s criticism is wrong, Willard. Even if you think the atmospheric pressure theory is false, that’s not the way those that claim to have debunked it argue against it. But, if you want to continue to support a false debunking, it will only make people more convinced that the theory’s correct, so please…carry on.
Hi dlhvrsz,
What do you want want to point out in the chart you were referring to?
https://drive.google.com/file/d/1jFVD4AOyXQXIAotsDflm6ISagb5SpOtb/view?pli=1
The trend in the lower stratosphere (blue) since 1995. For context, refer to the comment from December 3, 2025, at 7:12 AM.
Graham D. Warner seems to have replied.
Better to ignore him.
OK, Willard.
dlhvrsz, the blue curve shows an initial drop up until 95, it then leveled off to remain unchanged until todays date.
I don’t understand what point you want to make, and what caused the initial drop?
Please take a look at my comment from December 4, 2025, at 8:01 PM? I’m curious if you know what might cause a comment to be blocked here.
Below are the annual averages for the UAH Global Lower Stratosphere:
1995: -0.03C
1996: -0.14C
1997: -0.03C
1998: -0.01C
1999: -0.03C
2000: -0.10C
2001: 0.06C
2002: 0.11C
2003: 0.04C
2004: -0.01C
2005: -0.12C
2006: -0.13C
2007: -0.14C
2008: -0.21C
2009: -0.13C
2010: 0C
2011: -0.17C
2012: -0.23C
2013: -0.03C
2014: -0.04C
2015: -0.02C
2016: -0.30C
2017: -0.19C
2018: -0.25C
2019: -0.24C
2020: -0.14C
2021: -0.21C
2022: -0.28C
2023: -0.23C
2024: -0.18C
2025 (unfinished): -0.29C
Here are the statistics:
Equation: Y = -0.008264*X + 16.49
P Value: < 0.0001
95% Confidence Interval (Slope): -0.01176 to -0.004773
https://www.graphpad.com/quickcalcs/linear2/
Anyone can see just from eyeballing the graph that stratospheric cooling has markedly decelerated over the entire time period.
But, I expect it was “projected” to do so by one model out of about a hundred and so it’s all counted as a success for the “theory”.
The slowdown simply reflects the steeper cooling rate seen from 1979-1994. Since 1995 significant cooling has continued, just at a reduced rate.
Why do you people like to basically repeat back what I’ve just said, as if you’re correcting me?
Your 2:27 PM comment seemed to suggest that the deceleration was inconsistent with greenhouse effect expectations. The slower post 1995 cooling does not conflict with those explanations. The trend remains negative. It is simply less steep than in the earlier period.
Nothing could ever be “inconsistent with GHE expectations”, considering it’s one of the vaguest “theories” ever proposed. No two people seem to describe it the same way.
It’s also not inconsistent with the idea that more GHGs leads to more cooling to space…it certainly doesn’t provide any evidence that tropospheric warming is due to GHGs. But, those who want to believe, will continue to do so.
That is incorrect. The GHE is a falsifiable and well supported theory, and Dr. Spencer agrees with it.
What I said is not incorrect.
I see that for some reason you are not interested in what happened prior -95?
Obviosly you have knowledge in statistics. For how many years do you estimate that your equation will be valid, more specifically that the slope coefficient will fall inside your 95% confidence level?
Why are you backtracking to leading questions, Karl, is it because Buzz has been completely debunked and you want to act as if nothing happened?
The pre-1995 period featured several major volcanic eruptions that injected sulfur dioxide directly into the stratosphere. The resulting aerosols absorbed solar radiation aloft while simultaneously reducing the amount of sunlight reaching the surface. Ozone concentrations were also changing during this time, which also influences stratospheric temperatures.
Both volcanic activity and ozone levels can vary in the future. I also am not deeply versed in the technical details of stratospheric climatology, so I don’t want to overstate how these factors might evolve.
For these reasons, and similar to how Dr. Spencer approaches it, I wouldn’t use these regression statistics to extrapolate stratospheric temperature anomalies far into the future. The regression is descriptive of the period analyzed.
Smooth response, dlhvrsz. Another professional sophist explodes out of nowhere onto the scene, just to make the blog even more biased in favour of Team GHE. You can join in with their chant: “E-vil! E-vil! E-vil!”
I reread my comment as if I were a third party read, and it seems fairly restrained and non partisan. I explicitly acknowledged non GHG influences and avoided extrapolating beyond what is justified. If you see something in it that you consider tribal or partisan, I’d be interested in hearing what specifically that is.
Also, by that standard, Roy Spencer would presumably count as a “sophist” as well, since he openly accepts the greenhouse effect. Advancing that implication on his own blog is an interesting judgment call, and one that doesn’t come across as respectful of the host.
“Please ban him, Dr Spencer!”
I am still unclear what specifically you consider partisan or tribal in my response.
Nothing, particularly. It’s some of the other responses amongst the comments this month that give you away. One example:
https://www.drroyspencer.com/2025/12/uah-v6-1-global-temperature-update-for-november-2025-0-43-deg-c/#comment-1724823
Riffing along with Willard is never a good look.
I’ve seen your type many times before, come and go at this blog. You’ll play the part of the reasonable “seeker of truth”, but really you’re just here to defend the orthodoxy. Maybe you’ll prove me wrong, but I somehow doubt it.
barry’s already the master of “faux-reasonableness”. We don’t need another barry.
And, Team GHE won’t be getting the last word on this thread. Sorry to disappoint you.
The comment you linked was a response to a clear misinterpretation of stratospheric temperature trends and, based on that misinterpretation, an explicit rejection not only of greenhouse driven global warming but of the greenhouse effect itself.
Calling out arguments like that is not tribalism. Anyone concerned with credibility has a reason to push back against claims that reject well stablished physical principles on the basis of flawed readings of the data. Skeptics especially should be cautious about tolerating that, since it ultimately undermines their own case.
If that kind of corrective engagement is being read as “tribal,” then I think that says more about the framing being applied.
No, dlhvrsz. You were responding to Willard, who was defending barry’s point about the atmospheric pressure theory, a point I had just refuted at that time. You riffed on that comment with the initial words “even Ned”, subtly throwing shade at Ned Nikolov, and then changed the subject back to what you wanted to talk about, Buzz’s point on stratospheric cooling. Then, you finished with some snarky remark. If you were truly here to “seek truth”, you would have corrected Willard instead of riffing on his comment and changing the subject.
“The comment you linked was a response to a clear misinterpretation of stratospheric temperature trends”
Exactly.
Let me guess, dlhvrsz – Graham D. Warner has been doing everything in his power not to concede this point.
No need to tell me what he said. I’m ignoring him. Just like he did with Nate for many years.
You might think he stopped responding to him. That would be wrong.
Graham can’t stop responding.
“The comment you linked was a response to a clear misinterpretation of stratospheric temperature trends…”
…which is a discussion from another thread. Why it was brought up in this thread is still not clear.
You would be correct.
And unlike what DREMT suggested in his 2:38 AM comment, I had no intention of changing the subject to distract from th atmospheric pressure discussion. I’ll extend him the benefit of the doubt and note that in highly contentious forums, tribalism can sometimes replace careful reading with imagined motives, often at the expense of logic and social self awareness.
You had no intention of changing the subject, so you decided to change the subject. Right.
The other factor in the UAH record is a string of stratovolcano eruptions. The effects of these eruptions are increased reflection of incoming sunlight, stratospheric warming, reduced stratospheric ozone levels, increases in cloud condensation nuclei and cloud cover, surface and lower tropospheric cooling, acid rain, and reductions in CO2 growth rates. This plus ENSO explains the variation in the UAH record. UAH follows ENSO with a lag of several months, CO2 growth rates follow UAH with a lag of several months.
CO2 increases are an output variable, not and input variable.
Third warmest November in the UAH data set.
Warmest Novembers are:
1 2023 0.77
2 2024 0.64
3 2025 0.43
4= 2019 0.39
4= 2020 0.39
6 2016 0.35
7 2017 0.22
8 2015 0.21
9 2009 0.14
10= 1990 0.12
11= 2018 0.12
though 2018 ties
So far every month in 2025 has been 2nd, 3rd, or 4th warmest.
Almost certain that 2025 will be the second warmest year on record, well below 2024, but just above 2023.
My simple projection for 2025 is now 0.48 +/- 0.03.
The Polar Vortex has been disorganized for over a week now. Consequently, I was expecting UAH Global to be as warm as October, if not warmer. Maybe the La Niña is having a larger effect than believed.
By: Andy Chmilenko (Lanowen)
from Comments on: UAH v6.1 Global Temperature Update for September, 2025: +0.53 deg. C by Andy Chmilenko (Lanowen) Sun Nov 30 2025 17:43:20 (1 day).
In reply to Gordon Robertson.
We did measure the IR intensity, this is the equipment manifest and experiment guide.
https://stuff.lanowen.com/Physics/Labs/Phys%20260L/Lab4/Introduction%20to%20Thermal%20Radiation%20-%20Inverse%20Square%20Law%20-%20Stefan-Boltzmann%20Law%20(low%20and%20high%20temperature).pdf
I don’t know why you are arguing about this stuff and citing my labs, I haven’t read all your comments here but I have a feeling like you are a difficult person.
Go do the experiments and get a life honestly.
Is this the beginning of a new Monckton Pause?
Interesting how the pauses always begin immediately after a record peak. I’m sure there’s nothing intentional about that.
More likely peak and beginning of the end of modern warm period.
It’s worth noting that previous forecasts of imminent cooling have failed to materialize.
https://jennifermarohasy.com/2008/10/news-reports-for-october-indicate-global-cooling/
Based on your wish?
It certainly looks that way.
I predict that someone in the skeptiverse will always ask this question less than a year after the latest record-breaking warm year.
Dr. Spencer pls take a look at the regression issue I mailed you about. As with this older article when looking the dOLR/dTs relation you always used an OLS regression.
https://www.drroyspencer.com/2015/07/
In this instance it is wrong, as there are errors in both variables and the distrubtion is strongly vertical, in numerical terms. With dOLR/dTs relations one has to use a TLS (total least squares) regresson. It is not hard, you can have AI do it for you. The difference is pivotal..
OLS .. 2.85
TLS .. ~5.2
The seemingly positive feedback turns deeply negative, based on the correct regression! And it is not just an isolated instance, rather there is so much more to it..
https://greenhousedefect.com/fileadmin/user_upload/A_Falsification_of_Positive_Water_Vapor_Feedback.pdf
Current lower-tropospheric temperature “kick” (2023–2025)
Waveform shape: Strongly asymmetric with an abrupt rise and gradual fall
Very steep leading edge (rapid onset) from roughly March 2023 to the absolute peak in February–March 2024 (+0.85 to +0.95 °C in UAH TLT).
Prolonged, gentle trailing side (slow decay) that is still ongoing in late 2025, with anomalies remaining elevated (~+0.4 to +0.5 °C) well above the pre-2023 baseline.
Geophysical situation analogous to the seismic case:
Sharp top contact → the sudden, powerful 2023–2024 Super El Niño acted like a near-instantaneous injection of heat and water vapor into the lower troposphere (analogous to a sharp low-impedance interface).
Gradational base → instead of the temperature anomaly collapsing quickly once the El Niño ended (as happened in 1998 and 2016), the “base reflection” is weak and drawn out. My interpretation- This is consistent with slow, gradual removal of excess water vapor from the atmosphere rather than an abrupt return to La Niña cooling.
Comparison with previous major El Niño peaks (thin symmetrical or near-symmetrical kicks):
1997–1998 and 2015–2016 events produced relatively symmetric spikes: fast rise during the El Niño, then almost equally fast fall once the tropical Pacific flipped to strong La Niña conditions within ~6–9 months of the peak.
Those earlier events behaved like classic “thin-bed tuning” responses — strong top and base reflections of nearly equal magnitude but opposite sign, yielding a roughly symmetric composite peak. In global temperature the lower troposphere reacts to the more powerful higher frequency ENSO forcing. The atmosphere is slower system and the abrupt ElNino signal is below a tuning frequency in time.
2023–2025 asymmetry diagnostic interpretation (using your water-vapor hypothesis):
The abrupt rise reflects the strong, sharp “top” reflection from the El Niño heat/water-vapor pulse.
The very slow decay on the trailing side reflects a weak, gradational “base” because excess water vapor injected high into the troposphere (especially by the January 2022 Hunga Tonga eruption and reinforced by the Super El Niño) is being removed only gradually by radiative cooling and precipitation processes.
In seismic terms: the “base of the low-impedance layer” (the clearing of water vapor greenhouse forcing) is not a sharp interface but a thick, gradational transition → hence the long, gentle return to baseline.
Does anyone have a recent graph of the lower stratosphere? I can only find one to 2023 (which shows a rise in temp!). Thanks in advance.
Buzz
Frankly, your tendency to deny everything
https://www.drroyspencer.com/2025/12/uah-v6-1-global-temperature-update-for-november-2025-0-43-deg-c/#comment-1724732
without being able to provide technical let alone scientific evidence for your denials doesn’t exactly motivate me to answer such a question.
*
And it’s hardly surprising that those who, like you, discredit and denigrate science aren’t even capable of creating out of
https://www.nsstc.uah.edu/data/msu/v6.1/tlt/uahncdc_lt_6.1.txt
and
https://www.nsstc.uah.edu/data/msu/v6.1/tls/uahncdc_ls_6.1.txt
a simple, trivial diagram like this one:
https://drive.google.com/file/d/1jFVD4AOyXQXIAotsDflm6ISagb5SpOtb/view
Data till October 2025.
*
Your credibility, Sah, is at… Buzz level.
…. and how, for heaven’s sake, did Buzz misinterpret the data?
The trend is obviously downwards over the long term.
studentb:
The cooling of the lower stratosphere prior to 1995 is thought to have been as a direct result of ozone. Since 1995, there has been no continuance in cooling (very small, and not at all significant). This is despite a warming of the troposphere. This is odd, as any warmth ‘trapped’ (not) by GHGs should reduce the temp of the stratosphere. A cooling stratosphere is essential to the idea of how GHGs work. Since 2016, there has been a very slight warming of the lower stratosphere (which is what I referred to).
I hope you now better understand.
I don’t know why you think I deny ‘everything’. I presume you are referring to the GHE explanation of warming and cooling. Yes, I deny that. Far from discrediting and denigrating science, I would consider myself far and away more ‘scientific’ of thought than you are, as I am sceptical, but remain open to the ‘best’ explanation of any aspect of science. You, evidently, have fallen for the GHE explanation – that is your choice. As I said in that post, we can all believe any science we like…as long as it is science. The atmospheric forcing hypothesis explains planetary warming better than the GHE one (in my opinion – try and remember). You think otherwise, and that’s fine.
Try and be nicer when replying to people who don’t share your view of everything. Also, try and grasp that there are those of us whose abilities in computer technology are limited, since we have lives which are more societal-based (or we just can’t comprehend modern life!). There is no need nor requirement for being abusive, and you would feel a better person if you treated others with more respect (even if you don’t have respect for their views). Thank you for the drive.google graph – it states that which I implied (a very slight warming over the past nine years which is at odds with tropo warming).
The stratosphere has continued its cooling trend..
https://www.pnas.org/doi/10.1073/pnas.2300758120
Nate:
Not since 1995, no. And that’s because the cooling prior to 1995 wasn’t as a result of the tropo warming, it was as a result of ozone.
Since 2016 there has been a tiny rise.
The GHG hypothesis is wrong, and that’s why the stratosphere hasn’t cooled in 30 years.
“Nate:
Not since 1995, no.”
False. Did you look at the linked paper?
Perhaps you are looking at UAH Lower Stratosphere data which is a mixture with Troposphere and its warming.
The link clearly shows that pure stratosphere, ie mid and upper statosphere levels, are still cooling.
Nate, did you look at what I said at
https://www.drroyspencer.com/2025/12/uah-v6-1-global-temperature-update-for-november-2025-0-43-deg-c/#comment-1724722
I said:
“Does anyone have a recent graph of the lower stratosphere? I can only find one to 2023 (which shows a rise in temp!). Thanks in advance.”
LOWER STRATOSPHERE.
“The [GHE] theory suggests that the lower stratosphere cools due to the increase of greenhouse gases in the troposphere.”
The lower stratosphere was/is supposed to cool. It has not. In the past 10 years, it actually mirrors the lower troposphere very well, rather than being inverted.
Did you note what I said?
“UAH Lower Stratosphere data which is a mixture with Troposphere and its warming”
To avoid this problem, everyone looks at the upper layers of the stratosphere, and verify that it has been cooling.
Why is that a problem?
The expectation from basic climate theory is that, as the atmosphere warms, its capacity to hold water vapor increases (Clausius-Clapeyron relation). However, if negative longwave cloud-top emission feedback is strong, it can mitigate this effect in the following way:
• Energy Balance Adjustment: The increased longwave emission from warmer cloud tops radiates more energy to space, providing an alternative pathway for the upper troposphere to lose heat. This reduces the radiative need for more water vapor, which is itself a greenhouse gas.
• Suppression of Humidity Increase: Since the energy loss through cloud-top emission increases, the upper troposphere does not require a proportional increase in humidity to maintain radiative balance. Thus, UTH remains stable or shows little increase, even as temperatures rise.
• Cloud Microphysical Response: Changes in cloud properties (such as cloud amount, thickness, and altitude) in response to warming may further enhance this feedback, reinforcing the stability of UTH.
Implications for Observed Data
NCEP data showing little to no increase in upper tropospheric humidity, despite warming, can be interpreted as a sign that negative longwave cloud-top emission feedback is active. In other words, clouds are adapting their radiative properties in such a way that the upper troposphere’s energy budget is balanced without requiring significant increases in water vapor.
This mechanism highlights the importance of accurately representing cloud processes in climate models, as feedbacks involving clouds can significantly modulate the climate system’s sensitivity to greenhouse gas forcing.
Conclusion
Negative longwave cloud-top emission feedback provides a physically plausible explanation for why upper tropospheric humidity has not increased according to NCEP data, despite CO2-induced warming in the upper troposphere. By enhancing infrared emission to space, clouds can offset some of the warming and reduce the need for additional humidity, helping to stabilize UTH in a warming climate.
Reminiscent of Lindzen’s IRIS effect. Even with the global temp rise we’ve had, it’s still faster over a similar period (45 or 100 yrs) than any previous.
dlhvrsz says: re temperature…
“Average kinetic energy of molecules in a substance”.
***
Not so, you are describing heat, and temperature is a human invention to measure the relative level of the KE which is heat. We know that because temperature as a measure was based on two set points: the freezing point of water and the boiling point of water.
That’s why thermometers are named as such. Thermo- means heat and the meter tells us the device is measuring heat. Thermodynamics is a study of heat,
Later, some ijits tried to redefine temperature as an imaginary statistical quantity related to equally imaginary particles in an alleged gas, hence the reference to temperature as a measure of the internal energy of a gas. Heat had already been defined as that KE since heat is energy in motion and energy in motion is KE for any energy in motion.
In the same manner, the ijits redefined the 2nd law and entropy, obfuscating both in a way that has confused many since. They can be excused in part because all this nonsense took place years before the electron was discovered in 1898. The discovery of the electron changed all that theory, culminating in the discovery of the relationship between electrons and electromagnetic energy by Bohr in 1913. Since the electron is now defined as changing its kinetic energy, which is heat by definition, electrons are responsible for emitting and absorbing EM, and creating and dissipating heat in a substance, through their inherent change in KE.
Heat is one form of energy and the KE in question is describing energy that is in motion. What is in motion? In this case, it is the atoms/molecules in the substance which vibrate in the case of solids and liquids and actually move around in the case of a gas.
Heat is defined as the form of energy causing the motion of atoms and molecules. In simple terms, heat is defined as the motion of particles and that motion is kinetic energy. Since molecules are nothing more than aggregations of atoms, it is the electrons in both that are responsible for changes in the internal KE of atoms, which is due to changes in electron orbitals in atoms.
If you place a thermometer in contact with a solid, liquid, or gas, kinetic energy, aka heat in this case, is transferred to the thermometer bulb, causing something to change, like the volume of mercury in a vial or the action of electrons in an electronic thermometer. Therefore, temperature is a measure of how heat affects the volume of mercury or the electrons in the probe of an electronic temperature device.
It seems that the running, centered 13-month average has not been updated in many months. The current position should be 0.51.
studentb…”BUT how, using your “logic”, can low clouds heat the surface when they are colder than the surface?”
***
They can’t heat the surface, all they can do is affect the rate at which surface heat is dissipated. Newton’s Law of Cooling explains that. It claims heat dissipation at a surface is relative to the temperature differential between that surface and an adjacent body.
I don’t know the exact mechanism involved in cloud cover’s ability to maintian temperature (slow rate of cooling) but I am deducing it has nothing to do with a heat transfer cold to hot that contravenes the 2nd law. If you ask Google, their AI machine simply regurgitates pseudo-science about clouds trapping heat via trapping radiation.
Normally, it is air immediately touching the surface that affects the rate of heat dissipation. That’s because there are 10^28 molecules of air in contact with each square meter of the surface and the amount of heat that air can scavenge from the surface is 260 times the amount that can be dissipated via radiation alone. However, if the surface is at the same temperature as the air, there should be no heat transfer other than a slight to and fro movement at the surface.
What saves the day is the phenomenon that heated air rises. As it rises, the air is replaced by cooler air from aloft that is colder than the surface. Otherwise, as Lindzen said about no convection, the surface air at the Equator could rise to 70C+ without it.
Denser, cooler air in clouds, which are modeled like small lakes, due to their water content which is often small droplets of water rather than pure water vapour. Seems to me that clouds are precipitated water vapour produced when rising warmer air condenses into fine droplets of water. That should serve as a barrier to rising heated air from the surface, essentially slowing it down.
As we know, when you slow the convection of air from a room, the room remains warmer longer. Open doors and windows and the room cools faster. A fan can speed it up. Furnaces have blowers to increases convection when delivering heated air to a room. That speeds up air convection and forces more air per unit time into the room.
I can see those clouds acting to slow the rate at which heated surface air rises via convection, trapping the heated air below them, much like glass in a real greenhouse. As it stands, the theorized GHE is based on radiation, not convection. That’s mainly why it is wrong. Radiation occurs as heat is dissipated at a surface and contains no heat. Trapping any amount of IR makes no difference to surface heat. Convection actually carries heat with it.
“Lord, I was born a ramblin’ man
Tryin’ to make a livin’ and doin’ the best I can
And when it’s time for leavin’, I hope you’ll understand
That I was born a ramblin’ man”
Hi Gordon, I have a question that has been bothering me. If a hotter body cannot absorb photons from a colder source, how does then a thermal imaging device sensor work? Wouldn’t it have to absorb something in order for the sensor to detect something?
David…”Hi Gordon, I have a question that has been bothering me. If a hotter body cannot absorb photons from a colder source, how does then a thermal imaging device sensor work? Wouldn’t it have to absorb something in order for the sensor to detect something?”
***
David sorry I missed your original post and had to suffer through a response to you from Clint.
The word thermal imaging is a misnomer. It suggests that heat is being imaged whereas it is the frequency related to infrared energy that is being imaged and passed off as heat.
A bit of history reveals that in the 19th century, scientists believed that heat could flow through air as ‘heat rays’. No one knew at the time how atoms were constructed and the electron had yet to be discovered. In 1913, Neils Bohr discovered the real method as to how heat was apparently transferred. I say apparently, because Bohr pointed out clearly that IR created at a surface does so at the expense of heat. Therefore, no heat is transferred AS HEAT.
That is, electrons excited from the ground state by heat, radiation, or electricity…sometimes pressure…acquire kinetic energy and jump to higher energy orbitals. En masse, that is the sum of all those instantaneous rises in KE, from electrons in all atoms, show up as heat in the mass.
Apparently, the excited electrons then drop back to lower levels and as they do they must give up the KE they acquired. They do so by converting the KE to electromagnetic energy, which has a frequency. Therefore, heat, which has no frequency, becomes EM with a very discrete frequency.
The point to get is that the heat converted to EM is gone…vanished…leaving no heat for an infrared device to measure.
Since that KE is heat, it means heat is dissipated for each quantum of EM created. Therefore, it is not possible for any surface to radiate heat, only infrared energy.
That’s what the imagers detect, the frequency of IR emitted. But, how can the imager tell the temperature from a frequency? Well, it has to be told what frequency represent what temperature, and that information is stored in its memory. The information comes from a laboratory where heat sources are measured as to the frequency of IR they emit.
Some wag will stop by and claim that a thermocouple measures heat and sure enough, it does. However, an imager is not a thermocouple, even though some insist on representing the detection devices in the imagers as thermocouples. A thermocouple is a device that converts actual heat to an electrical voltage. They use them on high temperature devices where the thermocouple can measure heat directly, however, the thermocouple has to be very close or in direct contact.
So, there’s a conundrum here. Since electrons in the atoms of a surface can convert heat to IR, and at a colder surface, that IR can be absorbed and converted back to heat, some wonder why that new heat cannot be related to the old heat at the hotter surface when it was dissipated.
I suppose it can to some degree but certainly not at a significant distance where the IR has been subjected to the inverse square law, and other losses. In other words. If someone is running through a forest where the ambient temperature is -20C, and he/she is detected with a thermal imager, how can heat possibly survive in such an atmosphere let alone be measured?
Although the body temperature at 37C is some 57 C hotter than the ambient temperature, there is no way the imager can see that heat. However, even at -20C, the 37C source is still radiating frequencies of EM in infrared band and the detector can see those frequencies.
If you had an imager based on a thermopyle, which converts heat to voltage, you’d need to be within inches of the source to get an accurate reading.
Although I regarded Tyndall’s experiment in which he proved that IR can be absorbed by various gases, as an well-conceived experiment, he used a primitive thermocoupleto measured the IR. I simply don’t see how such a thermocouple could measure IR at the distance used in his experiment.
It may have detected something but the relationship between the heat of the source and what the thermocouple saw, was hardly one to one, or anywhere close. That why the importance of Tyndall’s work is related only to the fact that certain gases can absorb IR and not remotely connected to the warming effect of CO2 in the atmosphere. Ironically, that’s exactly how modern alarmists have interpreted his work and they have gone so far as to give a warming factor to CO2 which is based on sheer pseudo-science.
Tyndall, in his day, would have regarded IR as undefined heat rays and would not have known about the IR we know today. He certainly had no semiconductors like those used today as the basis of thermal imagers. They are so sensitive that IR FREQUENCY from a distance can affect the electrons in the devices to produce a measurable voltage. However, as I understand it, the incoming IR is magnified using lenses and such.
Of course, that voltage is useless unless you can relate it to a certain temperature.
Although I regarded Tyndall’s experiment in which he proved that IR can be absorbed by various gases, as an well-conceived experiment, he used a primitive thermocoupleto measured the IR. I simply don’t see how such a thermocouple could measure IR at the distance used in his experiment.”
He used a precision thermopile.
“The thermopile is the name given to a temperature-measuring device that consists of several thermocouples connected together in series, such that all the reference junctions are at the same cold temperature and all the hot junctions are exposed to the temperature being measured,”
fritz k…”Pressure doesnt warm.
Pressure of the wheels of Your car is threfold atmospheric pressure; but temperature is exactly the same”.
Your statement is in reply to Buzz, who said…
“There is no greenhouse effect. It has never been observed, and it exists only in computer models of the climate. There is no ‘back radiation’”.
***
I agree with Buzz on the GHE which is based on poor science. However, back radiation does exist, it has to. CO2 and WV vapour molecules must radiate isotropically and part of the radiation must reach the surface. However, since it comes from a colder source than the surface it cannot be absorbed by the surface.
The problem with the relationship of temperature and pressure in a car tire is the ability of the tire surface and rims to conduct heat. When the tire is first filled, the temperature of the air in the tire should be higher in proportion to the temperature. With time, the heat causing the higher temperature escapes through the tire surfaces and the rims.
If you feel the base of a steel hand pump while inflating a car tire, it become quite warm to the touch. Compressed air produces significantly higher temperatures initially.
I agree that a pressure change in the atmosphere is likely not enough to produce a noticeable temperature change since the pressure is too low to affect that a lot. However, we must consider the relationship of pressure to temperature via the Ideal Gas Law.
PV = nRT
n and R are pretty well constant and in a thin later of air near the surface we can consider volume to be a constant.
ie…. P = (nR/V).T
where (nR/V) can be considered a constant = k
P = k.T (with constant V)
That says essentially that P is directly proportional to T. If the air pressure in a car tire remains constant due to a good seal, the temperature can change as heat is dissipated through the surfaces and rims.
“However, since it [infrared radiation] comes from a colder source than the surface it cannot be absorbed by the surface.”
Of course it can. Non-reflective surface can absorb a vast spectrum of IR. Source temperature is immaterial. An object at any number of temperatures can emit photons at a broad spectrum of radiation, and these ranges greatly overlap, the temperature defining the peak intensity of the curve, not restricting emissions to only one or a handful of spectra.
Kirchhof’s law tells us that an object’s emissivity and absorptivity are equal. So if the Earth’s surface emits in any of the same spectra emitted by the atmosphere, it will also absorb at that spectra.
To get around this you must either deny Kirchhof’s law, or argue that the Earth’s surface never emits in the same wavelengths as the atmosphere emits, or make up other physical exceptions that don’t exist.
I agree with Barry as far as it goes. The surface can absorb IR energy radiated from gases. However, this is where details come into play. Due to the specific situation currently in place on Earth, CO2 IR radiated at the surface is absorbed but cannot warm the surface. If anything, it may cool it slightly.
The cooling is caused when a CO2 emitted IR photon leads to evaporation of a water molecule sitting on the surface. Since water covers a large portion of the surface, this is not insignificant.
The reason you don’t get any persistent warming of the surface from CO2 downward IR emissions is related to conduction, saturation, frequency of CO2 IR, kinetic energy physics and overall CO2 handling of IR radiation coming from the surface. Yes, it is complex.
Essentially what happens is the energy absorbed by the surface gets conducted back into the atmosphere. The energy transfer is essentially negated.
The surface absorbs downward IR from CO2 and H2O. This increases the surface’s total energy input. The surface loses energy through radiation, convection, and evaporation. In equilibrium, the surface must warm until its upward losses match the combined solar + atmospheric input. Evaporation redistributes energy but cannot negate the radiative forcing.
Notice the first thing you will get from alarmists like Barry is denial. Not even interested in the complex physics involved, just pure denial.
Well, maybe I was a little too tough on Barry. He did offer an explanation … “The surface loses energy through radiation, convection, and evaporation. In equilibrium, the surface must warm until its upward losses match the combined solar + atmospheric input.”
However, he ignored my warning about the complexity which comes into play at this point. First, I’ll assume Barry really meant conduction instead of convection. Next, let’s look at more detail.
As I noted earlier, saturation comes into play. What it leads to is most of the radiation involved in this discussion is emitted/absorbed within the first 10 meters of the surface. The radiation emitted by CO2 higher in the atmosphere gets absorbed before it reaches the surface.
In addition, surface energy absorbed by CO2 is immediately moved via kinetic collisions to other atmospheric molecules the vast majority of the time. This also means energy emitted downward by CO2 comes from a collision with another atmospheric molecule.
The combination of these factors tells is the energy radiated to the surface by CO2 comes from the lower 10 meters and ends up cooling that portion of the atmosphere. Let’s call that cooling X for a doubling of CO2.
The surface has absorbed this energy making the difference in energy between the surface and the lower atmosphere 2X.
This is where conduction comes into play. Conduction is always moving energy back and forth between the surface and the lower atmosphere driven by the 2nd Law. Conduction sees this 2X difference in energy levels and attempts to correct it by moving half of the difference (X) from the surface to the lower atmosphere.
Notice that the increase in CO2 moved X amount of energy in the other direction by downward radiation. X – X = 0.
I ignored evaporation just to focus on the warming effect coming from increases in CO2. If no evaporation occurs, then no warming would occur. Once you do get some evaporation, you get cooling as energy gets removed from the surface and is eventually transported high in the atmosphere by convection. I also ignored the increase in surface energy absorbed by 2X CO2.
There’s more to the story, but this shows the physics involved which prevents CO2 above saturation levels from warming the surface.
“Not even interested in the complex physics involved”
Invoking complexity isn’t a thesis.
Individual IR photons do not cause evaporation by knocking off water molecules. This is a bulk process of heating of a volume of water by conduction, molecular collision and IR heating. In the real world, the warmer the water volume (whichever way it is heated) the more likely is evaporation. Evaporation doesn’t negate surface heating, it partly relies on it.
The saturation argument does not withstand scrutiny. It’s been done to death, but my all means get specific if you want to talk about it.
You are pointing to the facts of various heat transfer, and then asserting that they ‘compensate’ for IR warming of the surface. There’s no logic here, just assertion.
I’ll take a moment to acknowledge that at least you don’t deny that IR from the atmos is absorbed by the surface. Some people here do deny it, sand i’m glad we don’t have to trouble ourselves with that disagreement.
Just a quick note that barry and Richard’s last comments cross-posted. Technically, then, we’re waiting for a response from barry to Richard’s comment.
Poor DREMT just can’t help being dragged into conversations and policing them.
Oh, I’ve ventured into this one willingly, I was enjoying it. Not “policing” it, just giving you a little prompt to respond to Richard. I always enjoy reading about theories that debunk the GHE, as there’s so, so many of them, and only one needs to be correct. Of course, each time the GHE is debunked they just tweak the theory again, but it’s fun to watch and I’d like to learn more about Richard’s ideas.
Barry’s comment did nothing to change the physics which I described.
Saturation is a good example. Higher CO2 concentrations shorten the path length of CO2 emitted photons. As I stated, this means energy which reaches the surface comes from low in the atmosphere. This area, often referred to as the turbulent boundary layer, quickly exchanges energy with the surface via conduction. This short circuits any potential warming effect.
The net effect which I described previously is an increase in evaporation at the surface with no warming. The extra evaporation increases buoyancy which enhances convective currents. This is especially true in the Tropics.
The enhanced convective currents drives moisture higher into the upper troposphere. Since it is colder at these altitudes, more water vapor is condensed leaving a lower residual humidity at these high altitudes. This is precisely the region of the atmosphere where water vapor concentrations are not saturated for IR. This means more energy, including the extra energy being transported from the surface, is able to radiate quickly to space.
The increases in water vapor at the surface drive decreases at high altitudes. This is not what GCMs have been programmed to do and is why GCMs show a Tropical hot spot that has never been detected in the atmosphere.
This physics is why Miskolczi 2010 showed a constant overall greenhouse effect in NOAA radiosonde data (1948-2008). As CO2 increases and absorbs slightly more energy at the edges of its main band, water vapor decreases at high altitudes allowing more energy to escape to space.
This reality also shows up in NASA CERES mission data. The data, analyzed by Willis E at WUWT,
https://wattsupwiththat.com/2025/01/22/greenhouse-efficiency-2/
also shows no increase in the overall greenhouse effect.
There you have it. Detailed physics agrees with the scientific data collected over many decades.
https://www.realclimate.org/docs/Rebuttal_Miskolczi_20100927.pdf
” Miskolczi, shows that his law implies that the Earth’s atmosphere should have a constant infrared optical thickness. Therefore,
when carbon dioxide concentrations increase, other greenhouse gases should decrease to
compensate. He then performs additional radiative calculations to suggest that observations
since 1950 show that this is happening.
We firstly indentify problems with Miskolczi’s theory and calculations and then show that in
fact observations do not support his theory. It should be emphasized that we do not criticize
radiative transfer models since they are based on fundamental well understood physics and
have been applied in many fields of science, e.g. astronomy. Similar calculations have been
routinely performed in atmospheric physics and climate studies using radiative models of
similar complexity and these agree very well with observations.”
Nate, there’s a reason you’re quoting a blog and not a peer reviewed paper. The entire article is full of misconceptions and non-issues.
The first and very glaring problem is it doesn’t refute the radiosonde data or the opacity calculations. That’s all I’m referencing.
Is that the best you can do?
Richard,
“Saturation is a good example. Higher CO2 concentrations shorten the path length of CO2 emitted photons.”
It means that saturation happens lower in the atmosphere. However, your view has completely neglected the fact that the low layer which is saturated emits IR both up and down. It is in higher layers that the IR intercepted by GHGs eventually escapes to space, and that effective emission layer rises with more CO2. Because of the lapse rate this emitting layer is cooler, so it doesn’t emit enough IR to balance incoming. Its temp has to rise to emit enough to balance, and that occurs when the layers below, and the surface warm. Which they do, because the IR escape to space is taking longer/further impeded by increased concentrations of CO2 throughout the layers of atmosphere.
And because of the lapse rate, the surface must warm because the new emitting layer is higher up, yet emitting at the same temperature as it did at a lower altitude, to balance with incoming solar radiation.
“As I stated, this means energy which reaches the surface comes from low in the atmosphere. This area, often referred to as the turbulent boundary layer, quickly exchanges energy with the surface via conduction. This short circuits any potential warming effect.”
Completely omitting the radiative action above the saturated layer might allow one to conclude that the interaction between the surface and saturated layer can’t be affected any further by increased CO2, but then one would be ignorant of the fact that pressure broadening increases the spectra at which CO2 (and other GHGs) can absorb. And pressure broadening happens most nearest the surface.
So in more ways than one the saturation argument against the enhanced GHE doesn’t withstand scrutiny.
“then show that in
fact observations do not support his theory.”
So?
It is blog where climate scientists write rebuttals to crappy denialist papers. The responses point out already published papers and do not merit a new publication.
In response to my mentioning the science which prevents surface warming, Barry brings up the pseudoscience where CO2 increases raise the emission height. Sorry to trash yet another piece of climate misinformation, the emission height of CO2 (and all well mixed GHGs) remains constant independent of their concentrations.
Your scientists made a bad assumption when they computed emission height. They got the energy involved wrong. They only considered an increase in absorbency without also increasing emissivity. When both are correctly determined, the energy flux to space is unchanged.
Essentially, you end up with more energy flowing upward at a slower rate. The two changes are both log changes which cancel out. Mother Nature is once again smarter than your average climate scientist.
Sorry Nate, science isn’t done in blogs which your example demonstrates very clearly. The blog pushed bad science and didn’t even understand some of the paper’s claims. Not surprising when climate scientists attempted to comment on atmospheric physics. They got it completely wrong.
Get back to me when you have a valid peer reviewed paper. Oh wait, none exists and for a very good reason. Miskolczi was right.
“The net effect which I described previously is an increase in evaporation at the surface with no warming. The extra evaporation increases buoyancy which enhances convective currents. This is especially true in the Tropics.”
No warming? That makes no sense. Any increase in downwelling IR comes from the warming of the lowest layers of the atmosphere.
You cannot have an increase in evaporation due to IR, without first having an increase in warming.
And increased warmth of the troposphere will increase water vapor content throughout. Increasing WV increases atmospheric opacity.
The increasing opacity of the atmosphere has been directly observed.
“Your scientists made a bad assumption when they computed emission height. They got the energy involved wrong. They only considered an increase in absorbency without also increasing emissivity. When both are correctly determined, the energy flux to space is unchanged.”
No assumptions, just straightforward physics. No, they all didnt get that wrong.
Heres a good paper that goes through it.
https://journals.ametsoc.org/view/journals/clim/33/9/jcli-d-19-0193.1.xml
Tell us what they did wrong.
“when climate scientists attempted to comment on atmospheric physics. They got it completely wrong.”
The authors of the rebuttal, Piers Forster and Rob van Dorland , have extensive publication in calculations of radiative forcing.
So this is a weak ad-hominem attack.
Nate ask me to “Tell us what they did wrong.” Kind of humorous since I already told him and he ignored it.
I said: “They got the energy involved wrong. They only considered an increase in absorbency without also increasing emissivity.”
They do this in your paper by using the temperature of the surface to determine the radiance. That doesn’t change, but when you have more CO2 the emissivity of the atmosphere increases its radiative properties.
“Fs=ƬsBs is the radiance that is emitted by the surface and that reaches the tropopause”
Your welcome.
Nate then adds … “The authors of the rebuttal, Piers Forster and Rob van Dorland , have extensive publication in calculations of radiative forcing.”
Climate science gets the assumptions wrong. They can’t get the right answers when they don’t understand what is really happening. The radiosonde data used in Miskolczi 2010 provides the real answer and all they could do was claim the data is wrong. Talk about weak.
“They got the energy involved wrong. They only considered an increase in absorbency without also increasing emissivity.”
Yes, I understand that you are suggesting that everyone in the last 120 years, since Arthenius, has been getting the basic optics of the atmosphere wrong.
But YOU are getting it right.
Rrrriiiight..
If you look at the paper I cited, at their eqn 1, they implicitly are including the emissivity of the atmosphere.
“the broadband absorptivity of the atmosphere in the longwave domain is equal to (1-Tr) and is equal to the broadband emissivity of the atmosphere”
So I think you are incorrect.
As expected, Nate claims: “So I think you are incorrect.” Maybe a little more detail will help.
When the surface radiates IR upward in CO2 spectral bands it gets absorbed and passed on to other atmospheric molecules 99.997% of the time. This occurs within ~ 10 meters of the surface. This is what is referred to as saturation.
This is the end of the calculation. All the energy got absorbed which did lead to warming. Adding more CO2 can not create more warming since it is already near 100%. (I’m ignoring pressure broadening for now because it’s not relevant to the emission height question)
What happens with CO2 as you move up through the atmosphere has nothing to do with surface energy. Now you are now dealing with atmospheric energy which could have entered the atmosphere through multiple sources and is much larger.
In fact, the first atmospheric emission upward is also saturated just a few meters further upward. You need to start over again … and again … and again … The entire methodology used is laughably wrong.
There is one thing you can do. Instead of starting with some base amount of energy as required in Schwarzschild equations, simply look at the effect of CO2 as it processes energy. It does produce an upward energy flux.
This is what I mentioned previously. CO2 molecules will absorb and emit energy. The upward flux due to this process will change as CO2 concentration increases. You will shorten the path length due to the increase in absorbency which slows the flux. But, you will also increase the amount of energy in the flux.
Kirchhoff’s Law of radiation allows us to make sense of it. We know both rates are driven by equal absorb/emissivity. The two changes cancel out.
I realize it is hard to fathom that climate science has this very significant part of the science wrong. This is where you need to trust the data. My view is supported by NOAA radiosonde data, NASA CERES mission data and more. It’s also completely obvious once you open your mind.
“As expected, Nate claims: “So I think you are incorrect.†Maybe a little more detail will help.”
Let me clarify. I know you are incorrect, because the paper I showed you DOES include emissivity. In eqn 1, and 2, etc.
I noticed, you didn’t look at the paper to check if that is the case.
“When the surface radiates IR upward in CO2 spectral bands it gets absorbed and passed on to other atmospheric molecules 99.997% of the time. This occurs within ~ 10 meters of the surface. This is what is referred to as saturation.”
Yes, but high in the troposphere that is no longer the case, and that matters.
“This is the end of the calculation. All the energy got absorbed which did lead to warming. Adding more CO2 can not create more warming since it is already near 100%. (I’m ignoring pressure broadening for now because it’s not relevant to the emission height question)
What happens with CO2 as you move up through the atmosphere has nothing to do with surface energy. Now you are now dealing with atmospheric energy which could have entered the atmosphere through multiple sources and is much larger.”
No it does ultimately matter, because what happens at the TOA determines whether the Earth is in energy balance.
“In fact, the first atmospheric emission upward is also saturated just a few meters further upward. You need to start over again … and again … and again … The entire methodology used is laughably wrong.”
How so?
“There is one thing you can do. Instead of starting with some base amount of energy as required in Schwarzschild equations, simply look at the effect of CO2 as it processes energy. It does produce an upward energy flux.”
I agree. The layered atmosphere model, eg Manabe and Weatherald, accounts for this.
“This is what I mentioned previously. CO2 molecules will absorb and emit energy. The upward flux due to this process will change as CO2 concentration increases. You will shorten the path length due to the increase in absorbency which slows the flux. But, you will also increase the amount of energy in the flux.
Kirchhoff’s Law of radiation allows us to make sense of it. We know both rates are driven by equal absorb/emissivity. The two changes cancel out.”
No. Emission is strongly temperature dependent. Abs.orption not much at all.
“I realize it is hard to fathom that climate science has this very significant part of the science wrong. This is where you need to trust the data. My view is supported by NOAA radiosonde data, NASA CERES mission data and more. It’s also completely obvious once you open your mind.”
Optical emission and abs.orption are well understood physics, not just used in climate science. YOU should find it hard to fathom that so many physicists have gotten that wrong in the last 120 y, because that is highly implausible.
In addition climate models use the same radiative heat transfer physics as numerical weathet models.
You should find it hard to fathom then why weather models work as well as they do, if they are getting the basic physics wrong.
Nate claims: “the paper I showed you DOES include emissivity. In eqn 1, and 2, etc.”
It does when considering the entire atmosphere, but that’s not what I was referring to. I was referring to CO2. Their “broadband” work is wrong for different reasons.
From what I can tell you either don’t understand the paper at all, or didn’t read it. Which is it?
Now to the specific case of CO2. The error occurs in equation 6.
“Fs=ƬsBs is the radiance that is emitted by the surface and that reaches the tropopause”
As you can see they are using the temperature of the surface to define the energy flow instead of the atmosphere. As a result they won’t see the increase in emissivity of the atmosphere as CO2 increases. This is EXACTLY the error I told you was being made by climate science.
What this does is essentially ignore saturation which they then claim doesn’t prevent a warming effect.
If you read it, the first eqn considers a single layer model. Modern models, as they go on to discuss, use multi-layer models.
The highest layers abso.orptivity and emissivity change the most with increasing CO2. And they analyze line by line, ie, at each wavelength.
I see no evidence they are leaving out emissivity. Where did you get this notion?
Eqn 6.
In the text after they note:
“and Fa is the vertical integral of the radiance that is emitted by the troposphere and that reaches the tropopause”
which is a term in eq 6.
Also, this is again for a single layer model.
Saturation just refers to optical depth and the mean path length of IR before almost of all of it is absorbed. Approx 10 metres from the surface. This is where the probability that GHG-friendly photon will be absorbed is as close to 100% as makes no difference. Increasing CO2 does not reduce transmission at this layer.
This layer is heated by the energy absorbed and re-radiated and through collision, and itself radiates in all directions, up and down.
Infrared radiation can only escape to space from altitudes where the probability of absorption is low. As COs concentration increases, the probability that an infrared photon emitted at a given altitude will be re-absorbed before reaching space increases. Therefore, the altitude from which infrared photons can escape without further interaction shifts upward, to regions where the air is less dense.
As CO2 is well mixed, increasing atmospheric concentrations increases its abundance at every level of the atmosphere, which means that the effective emission layer that once was thin enough in CO2 to balance with insolation now must be higher.
In the simplest terms, the fog of CO2 gets thicker throughout the vertical column as CO2 increases, making infrared photons emitted from lower altitudes increasingly unlikely to escape directly to space, so the effective emission of energy shifts upward to higher, less dense layers.
And because radiation escaping from this higher altitude originates from colder air, set by the lapse rate, the outgoing infrared initially decreases. To restore balance with absorbed solar radiation, the atmospheric column — starting at the surface — must warm.
Do we have observational evidence of the TOA rising? Yes we’ve long had observational evidence of the tropopause rising, which is an excellent proxy/fingerprint.
https://rmets.onlinelibrary.wiley.com/doi/abs/10.1002/qj.910
https://agupubs.onlinelibrary.wiley.com/doi/abs/10.1029/2000JD900837
https://agupubs.onlinelibrary.wiley.com/doi/pdfdirect/10.1029/1999RG000065 [p. 96]
https://agupubs.onlinelibrary.wiley.com/doi/full/10.1029/2008GL034012
Less conclusive but suggestive evidence is the darkening of spectral lines associated with CO2 measured from aloft (and brightening in those same lines from below). While this doesn’t pinpoint the level of the TOA to great accuracy, it marries with the evidence of the rising tropopause.
https://www.drroyspencer.com/2025/12/uah-v6-1-global-temperature-update-for-november-2025-0-43-deg-c/#comment-1725929
e.schaffer…”The seemingly positive feedback turns deeply negative, based on the correct regression!”
***
I have argued that positive feedbacks that increase heat cannot exist in the atmosphere. The reason is simple: a positive feedback requires an amplifier and there is no amplifier in the atmosphere.
The idea of positive feedback is based on the formula…
G = A/(1 + BA)
where G = overall amplification (gain)
A = amplifier gain
B = fraction of output of A fed back in phase to the input of the amplifier. If B is out of phase, negative feedback is produced, meaning G < 1.
That's the math but the reality is you cannot get something for nothing. Another reality is that positive feedback in servo systems can refer to the sign of a voltage fed back to a controller and there is no gain in that system. The only way to get gain is to include an amplifier that amplifies an input signal.
Here's how it works. If you input a small positive-going signal to an amplifier (transistor, say), it produces an amplified version of the signal at the output, albeit with an inverted signal. I am being way too technical for this discussion but I am trying to demonstrate the complexities of a positive-feedback system and why it cannot exist in the atmosphere.
The signal becomes inverted because the power supply produces the current and the output signal is taken across a series collector resistor. If the signal is positive-going in a class A amplifier with an NPN transistor, the collector current increases through the load resistor and the voltage drop increases across it. At the same time, the voltage across the transistor decreases.
Ergo, as the input signal increases, the voltage across the transistor decreases. If we now take a small fraction of the output voltage and feed it back to the input stage, if the sign is in the same direction as the input signal, it adds to the signal and when amplified, produces a larger output signal. Since the amplifying action is compounded each cycle, the output voltage can runaway till the maximum current of the power supply is reached.
That is positive feedback of an amplifying nature and obviously cannot work without an amplifier. Using such a term in the atmosphere to describe a runaway effect with heat is obviously wrong. For one, what would constitute a heat amplifier? It has been suggested that heat fed back from the atmosphere is added to incoming solar to produce such an effect. But how can heat be fed back from a colder part of the atmosphere to a warmer surface without contradicting the 2nd law of thermodynamics?
Otherwise, where is the amplifier required to amplify the heat?
What is being described in essence is a feedback system similar to the feedback system used in servo systems which is about a positive and negative sign without amplification. In servo systems, one is not interested in amplification, only in signs.
For example, if I want to control the RPM of a motor, I can attach a tachometer to the motor shaft. I then send the output signal of the tach to a motor controller with the voltage of the tach representing a direct current voltage. A zero would represent the correct RPM, positive an RPM that is too high, and negative a speed that is too low.
A controller controls the armature current through the motor. Increasing the current makes the motor go faster while decreasing it causes the motor RPM to drop. In the case where the tach voltage is positive wrt zero, we call that a positive feedback, and if below, we call it a negative feedback. It's all relative.
We must be careful not to confuse that type of positive feedback with an amplifying feedback. When we talk about a simple feedback where ice serves to reflect sunlight, we are talking about a non-amplifying feedback which is of necessity always negative.
All feedbacks in the atmosphere must be negative. As Roy once pointed out, a positive feedback in the atmosphere is a negative feedback that is relatively more positive than a more negative feedback. Both feedbacks, however, are negative with no gain.
Norman makes the same mistake with relative positive and negative in reference to dipoles in molecules. If you have a dipole with a negative voltage on end A and a more negative voltage on end B, end A is relatively positive wrt to B, however, both ends are negative. That's because dipoles in molecules are created by electrons which have only negative charges.
In a circuit, current flow is a flow of negative charges, from negative to positive. If a resistor is in the circuit, the current will produce a voltage drop across the resistor with the polarity negative on the negative supply side and positive on the other end. The positive polarity indicates only that the positive end is more positive wrt to the negative end. There are no positive charges anywhere to be measured.
This is an important distinction re voltages that must be considered in circuit analysis.
First, the atmosphere is not an electric system.
“All feedbacks in the atmosphere must be negative”
Why would they? There are positive feedbacks. It is just the sum that is negative.
And most of all, I am saying this because I want to believe it. Rather it is because I discovered very concrete evidence that went unnoticed so far. I suggest to focus on this evidence, not speculate.
That’s my point, amplifying positive feedback of a practical nature can only occur in an electronic system. BTW…I was not taking a shot at you, I was simply trying to clarify the meaning of pf and what is required to allow it.
The reason is apparent, pf requires an electronic amplifier to operate. In electronics, we use an oscillator to generate various waveforms. Positive feedback is the basis of an oscillator, however, the oscillation amplitude is controlled to produce a signal of constant amplitude. Without such controls, the signal would run away and be limited only by the ability of the power supply to produce such a signal.
Such amplification is not possible without a means of amplification, and the atmospheric model of pf has no such amplifier.
Let’s examine other forms of amplifying pf. We have all heard the squeal in public address system, which is due to a positive feedback between the speaker in the system and the microphone. Simply put, sound energy from the speaker is input to the microphone and re-amplified. During each iteration of amplification, the output level increases, hence the signal fed back to the microphone gets larger each iteration.
Eventually the signal runs away producing the piercing squeal. The frequency of the squeal is dependent on the room parameter and in a specific range of frequencies. If the amplifier power is turned off, the feedback squeal ends instantly.
An unamplified acoustic guitar cannot produce the squeal because there is no amplification.
There are a few examples where a natural resonance can produce catastrophic effects, the Tacoma Narrow Bridge being an example. The cables supporting the suspension bridge lacked dampening and in a strong wind began to vibrate. It so happened that the bridge structure was tuned to the vibration and began to oscillate with a sine wave effect. Somehow the natural resonance in the bridge structure caused an amplification in the bridge destroying it.
I should point out that although the oscillations produced in the bride deck caused it to collapse, the amplitude of oscillation was not great wrt the bridge length. It was enough, however, to cause the bridge deck to break and collapse. I presume the additive effect of all the suspension cable acting in phase was enough to cause the vibration in the deck.
Natural resonance is a natural form of positive feedback. A guitar string vibrating above a resonant chamber interacts with the echoes from the chamber to produce sustain in the string. That is, the string will vibrate longer while interacting with the resonant chamber. However, this resonance is damped and will die out naturally. It is never amplified.
It should be obvious that no such resonance exists in the atmosphere, nor does an amplifier.
I repeat, it in not possible for amplifying positive feedback to occur without an amplifier.
There is no other demonstrable examples of amplifying positive feedback on the planet. Yet, James Hansen, then head of NASA GISS implied a tipping point, a reference to amplified positive feedback whereby the climate supposedly can run catastrophically out of control.
Sheer nonsense. Hansen got the idea from Carl Sagan who preached that the atmosphere of Venus was produced by a positive feedback due to the same nonsense implied for our current hysteria about catastrophic climate change. It has since been discovered that the surface temperature of Venus is some 450C and that is far too hot to have been caused by a feedback system.
Such a theory would contradict the 2nd law, according to astronomer Andrew Ingersoll. He claimed that a few years ago yet he continues to preach the GHE and AGW theories. I wonder if someone got to him and order him to get in line or lose his funding.
If I could interject into the many arguments over basic physics – the elephant in the room is the proper public policy over climate change/warming. I suggest a thought experiment: man-caused (carbon) warming is a real crisis that needs to be dealt with (I disagree, but many on this blog agree). What then is the appropriate response? Mitigation or Adaptation? Mitigation is going poorly for Europe, which has been quite energetic in its approach:
https://www.wsj.com/business/energy-oil/europes-green-energy-rush-slashed-emissionsand-crippled-the-economy-e65a1a07?st=CZrm5p&reflink=article_copyURL_share
(If you are blocked by a paywall, I highly recommend you buy today’s edition of the Wall Street Journal to read this in-depth analysis. BTW, I am a WSJ subscriber and it is definitely all in on the global warming crisis.)
Essentially, Europeans have shot themselves in the foot for nothing. Their efforts have been more than negated by China, India, and others. The numbers are easy to find at IEA.org. Governments are literally falling over this massive blunder, as their economies struggle mightily with the high costs of electricity.
In the spirit of this thought experiment, I favor Bjorn Lomberg’s position – Adaptation. Given the current coal-based energy policies of China, India, and most of the developing world, It is the only reasonable one. I, for one, do not want to go back to the human misery of a pre-industrial world.
Again, I don’t think we should do anything about warming and the supposed “side effects”, but if we are to do anything, I choose adaptation,
Adaptation has physical limits. In parts of Alaska, for example, much of the land is structurally held together by permafrost rather than deep rooted vegetation.
As the Arctic warms rapidly, that frozen ground thaws and destabilizes, causing soil collapse and erosion as rivers and lakes literally consume the land. No amount of adaptation policy can prevent this once the permafrost reaches a certain thaw threshold.
https://hakaimagazine.com/features/evicted-climate-change/
This isn’t to deny that we should look rationally at costs and benefits. Only that we should acknowledge that some impacts cannot be adapted away once certain environmental conditions are breached.
As true skeptics, we have to look at the full range of effects, both positive and negative, and not just the convenient ones.
“Essentially, Europeans have shot themselves in the foot for nothing. Their efforts have been more than negated by China, India, and others.”
China has needed massive amounts of energy to industrialize just as we in the west did previously.
The snapshot shows them burning a lot of coal.
But the movie, ie the trend, tells a different story.
China, by far, is adding the most renewable energy generation in the world.
https://en.wikipedia.org/wiki/List_of_countries_by_renewable_electricity_production
Remember, they dont need to do that to please any Green voters.
They do it because a) it is a cost effective way to add more energy generation which they need, b) it is advancing their manufacturing dominance in solar and batteries, and c) the air quality in their cities has been terrible because of coal and gasoline burning.
One more of those countless people who write:
“Given the current coal-based energy policies of China and India…”
all overlooking the fact that China and India are not inherently coal-based energy countries.
They are, primarily because Europe (especially Germany) and the USA relocated big amounts of their manufacturing industries there decades ago to further increase their already exorbitant profits by eliminating labor costs, thereby causing massive unemployment at home.
China and India are being vilified—especially by a growing number of incompetent Americans—as the world's largest coal consumers and thus CO₂ emitters.
*
However, if we look at who imports the products manufactured in China and India, the following pictures emerge:
CO2 export/import map
https://drive.google.com/file/d/1QIoquMSp0eQKH2H95p4ECx2czxRkYW52/view
CO2 export/import by countries
https://drive.google.com/file/d/1LbnaBnsalOnJSG_XILmk4DsHlqKDv7RB/view
Source: Carbon Brief (and lots of others having shown nearly the same for years)
Wow! Amazing mental gymnastics. Truly amazing. China and India are currently burning massive amounts of coal, completely negating Europe’s fruitless efforts at co2 reduction and then some, yet somehow it is the fault of greedy capitalists? And, it’s only a snapshot, it will change in the future?
At least you folks are consistent. You always want to talk about the future – models that project much higher temorperatures, sea levels, and other supposed negativesclimate impacts from warming – and future reductions in CO2 from China and India (I assume that is what you are implying with the mention of increased renewables (which are TINY compared to fossil fuels.
Current data and prior trends don’t support your thesis (crisis from warming), so you revert to wishful thinking. China cares nothing about climate change, they are only using the controversy to advance geopolitical goals.
“China and India are currently burning massive amounts of coal”
Yes.
“completely negating Europe’s fruitless efforts at co2 reduction”
No. The first is a snapshot. The second is a TREND.
China’s coal burning has ~ plateaued since ~ 2012.
While over the same period its renewable energy production increased 1200 percent.
It was fully expected that peaking of emissions would occur later in the developing world than in developed world.
Here are the numbers – last 10 years.
Global Energy Consumption (Ectojoules/year)
Year Coal Renewables
2014 161.7 17.5
2024 165.1 56.9
chng 3.4 39.4
From here:
https://www.energyinst.org/statistical-review/energy-charting-tool/energy-charting-tool
As you have rested the “proper public policy” on retail energy prices and nothing else, you have not really done a proper analysis, which would include wholesale prices (which have generally gone down), and a longer term cost-benefit analysis of mitigation/non mitigation over the longer term – which is a salient issue that shouldn’t be ignored.
And the long-term analysis is the whole point. Near-term costs for transitioning have long been acknowledged. But it seems you only want to examine that metric, when the argument for mitigation policies has always been a long-term strategy.
Nate, I wish I had the time back that I just spent tracking down your wildly inaccurate post about China’s use of coal and renewables – both current and trend. You are either intentionally lying to promote a cause or you are so fanatically committed to that cause (AGW) that you search for any and all data points that support your argument.
I invite anyone reading this to go to IEA.org and spend five minutes looking at the numbers there. Your link was to a tracking tool, not the results of any search that you did, including search terms that you used.
Last time I’ll waste any time reading your posts.
Thomas.
You said you cared about the nimbers, data, facts
Those are the actual numbers for Coal and Renewable energy world consumption. They show that in the last decade, renewables energy consumption grew much faster than coal energy consumption.
I understand that this was not your belief.
I gave you the link to check the numbers. It is from a reliable source.
Why would I do that if the numbers are fake?
You simply reject the numbers because you cant be bothered to check them?
That is quite is quite a weak argument!
Then you have a melt down and run away?
All around, not a good look for your team.
FyI global Coal consumption Chart.
https://www.iea.org/data-and-statistics/charts/global-coal-consumption-2000-2025
For those interested in the FACTS on China and its energy usage: (sources – IEA, EIA, and a few other reputable sources that came from my ChatGPT query)
Coal 2023 – 106 EJ, 2013 – 85 EJ – a 25% increase
Oil 2023 – 34 EJ, 2013 – 22 EJ – a 54% increase (Driil, baby, drill?)
Gas 2023 – 15 EJ, 6 EJ – a 150% increase, but still less than 10% of total energy production
Nuclear 2023 – 5 EJ, 2013 – 2 EJ
Hydro 2023 – 11 EJ, 2013 – 8 EJ
Renewables 2023 – < 1 EJ, 2013 – < 1 EJ (apparently the wind wasn’t blowing enough, the sun wasn’t shining enough and striking the solar cells enough, the grid couldn’t take the energy spikes produced, the batteries couldn’t hold the electricity generated long enough. Well, at least they don’t mar the esthetics of nature or kill birds.)
Total 2023 171 EJ, 124 EJ – a 38% increase. China is all in on beating the U.S. in the crazy AI race. Massive amounts are being spent in the U.S. and China (perhaps a few other nations) on AI. A lot of the money is going into energy development for the massive amounts of electricity needed to run the huge server farms and cool them down. Nat gas and nuclear seem to be the most popular choices. They need to run 23x7x365.
Meanwhile, Europe marches further down a path to irrelevance and eventual absorption into other cultures. Misguided energy policy is but one aspect of their decline. Sort of a regional suicide. Very sad, given the mostly positive history of modern Europe. Hopefully, the UK will come to its senses. I sure hope Canada chooses a path closer (not identical to, just closer) to the US. We have a long way to go to undue the damage done to our country by progressives over the last 50-60 yrs.
SOLAR MINIMUM UPDATE
New GRACE data available on the Polar Portal. From April 2002 to July 2025, the Greenland Ice Sheet has lost roughly 5200 gigatonnes (=km³). This has contributed 1.5 cm to global sea level rise and would be enough to cover Denmark with 121 m of water.
https://bsky.app/profile/martinstendel.bsky.social/post/3m73mhrrlg22m
Willard: And it would cover Monaco with 2.498.650 meters of water. WOW!
Your sardonicism is too thick to hide your incredulity, Max:
According to the report published by the Danish Broadcasting Corporation, three Americans, including two who were said to have previously worked for Dozing Donald, have traveled back and forth to Greenland gathering information and cultivating contacts as part of the “covert influence operations.”
https://www.nytimes.com/2025/08/27/world/europe/trump-denmark-greenland-us-embassy.html
Perhaps you prefer:
“I went to Greenland to try to buy it,” Dryden Brown posted on X a week after Donald Trump won reelection in November. “Here’s what happened.”
That sounds like the setup to a joke, but Brown is entirely serious. He is part of a cadre of iconoclastic, very-online men looking to found the city of the future, with funding tied to crypto organizations, venture capital and libertarian billionaires.
[…]
The most prominent investor linked to Praxis is Peter Thiel. A member of the “PayPal Mafia” and erstwhile frenemy of Elon Musk, Thiel was one of the first Silicon Valley elite to support Dozing Donald when he became a presidential candidate in 2016. He is also an outspoken supporter of “seasteading,” an effort to build floating city-states in international waters, and has gabbed with Joe Rogan about moving out of California to pay less taxes. So it’s no surprise that he backs Pronomos Capital, a venture which has become a hub for funding experimental cities, including Praxis.
https://www.insidehook.com/internet/peter-thiel-praxis-next-great-city-greenland
Elevation-Dependent Climate Change (EDCC): Quantifying Accelerated High-Altitude Change and Its Implications for Mountain Landscapes Once Taken for Granted.
A new study provides comprehensive evidence that climate change impacts in mountain regions, conceptually analogous to Arctic Amplification, are not uniform with elevation.
On a global scale (1980-2020), higher elevations have warmed faster than lowlands.
Concurrently, mountain regions have experienced pronounced net snow and ice decline over the same period.
Improved spatial and temporal coverage of mountain climate observations and higher-resolution modelling are needed to better understand and anticipate the ecological and hydrological consequences of EDCC.
https://www.nature.com/articles/s43017-025-00740-4
The opening sentence in the paper dismisses it as a propaganda.
“Mountain regions show rapid environmental changes under anthropogenic warming”.
They have already concluded that anthropogenic warming is significant and they are not looking for other possible causes of the warming. An apparent cause of such warming is a re-warming from the Little Ice Age. The latter explains the warming far better than a trace gas.
I wonder how many of the authors have been up a significant mountain to test their hypothesis? Have they tried to climb Everest, K2 or one of the 26000 foot and above mountains to verify their claims?
The paper cites 200
(YES! 200) references in support of their claims.
That’s good enough for any sensible person.
@studentb, and the climate models are built by billions(!) of rows of code. That surely has to mean that they are correct?
You’re just a few orders of magnitude off, Champ:
“Global climate models are computer programs that consist of several hundred thousand lines of code.”
https://www.climatehubs.usda.gov/hubs/northwest/topic/basics-global-climate-models
Gordon Robertson says: https://web.archive.org/web/20210315003137/http://www.drroyspencer.com/2021/03/uah-global-temperature-update-for-february-2021-0-20-deg-c/#comment-632695
“When the Earth is between the Moon and the Sun, the near side is lit. That’s mainly when we see the different phases of the Moon, with the Earth’s shadow causing the crescent shapes.”
Willard, yes I overdid it, but thank you for proving my point.
I followed you link and the first key point is that made is the climate models are “computer programs that consist of several hundred thousand lines of code.”
Does that tell you anything about how well they perform?
Karl,
You made no real point, but tried to conceal your ignorance behind veiled accusations:
https://www.easterbrook.ca/steve/2010/11/do-climate-models-need-independent-verification-and-validation/
Unlike your and Nedl’s curve fitting, GCMs are definitely not vibe coded.
David at 8:30 AM
What is the point you’re trying to make?
What does the number of lines of code tell you about “how well” a model performs?
David was mocking studentb’s ridiculous argument that because a study has hundreds of references, it must be right! I thought his point was pretty clear. Repeating his point back to him as though you are correcting him seems to be the latest tactic from Team Dishonesty.
Arkady,
Karl was trying to suggest that GCMs are so big they must be erroneous. There are three problems with that reply.
First, GCMs have nothing to do with the paper you cited.
Second, GCMs are rather well tested. Better than the actual code that makes us comment right now.
Third, the relationship between papers has little to do with the relationship between lines of code.
It’s just the usual “But Modulz” jab, but with a “But Consensus” twist.
Hope this helps.
Willard at 9:19.
Yes, that helps somewhat.
Climate simulators consist of pre-processing, core Earth system model, and post-processing components. Equating their performance with the number of lines of code is the wrong metric.
“Karl was trying to suggest that GCMs are so big they must be erroneous…”
No, that appears to be a straw man.
dlh…”As the Arctic warms rapidly, that frozen ground thaws and destabilizes, causing soil collapse and erosion as rivers and lakes literally consume the land. No amount of adaptation policy can prevent this once the permafrost reaches a certain thaw threshold”.
***
I am tired of this argument of the Arctic warming. As long as the Earth maintains its current orbit and axial tilt, the Arctic will never warm significantly ***ON AVERAGE***. There is little or no solar radiation reaching the area for most of the year and no amount of CO2 will warm it.
If it’s -50C, or even -30C, which it is much of the year, and CO2 absorbs IR from such a low temperature surface, what is it going to do?
The utter propaganda about Arctic and Antarctic warming comes from very brief summer months. The Arctic on average seldom gets above 0C, and the Antarctic is even lower. Furthermore, there is not the slightest shred of scientific evidence that the variability is not natural over decades.
Recovery from the Little Ice Age explains it all.
Here is the current situation in the Arctic, from UAH…
https://www.nsstc.uah.edu/climate/
Note first the overall planet where essentially little or no warming has occurred. There is no known reason why there should be warming in parts of the Arctic and cooling in other areas.
We can see the variability in the Arctic during the month of November, where the anomalies range from -2.5C to +2.5C. Those contours indicating the average temps over an area are always moving. Remember, the anomalies are based on a 30 year average baseline.
We can go back a year and see that.
https://www.nsstc.uah.edu/climate/2024/November/202411_Map.png
Here it is 10 years ago…
https://www.nsstc.uah.edu/climate/2015/november2015/NOVEMBER_2015_LT_6.png
and 20 years ago…
https://www.nsstc.uah.edu/climate/Maps_1991_2020_base/NOVEMBER_2005_LT_6.png
Come back next month and it will change again.
Claiming the Arctic is warming is a serious overstatement and essentially a lie.
You are missing the actual mechanism behind Arctic warming –
The Arctic absorbs its energy in summer, when 24 hr sunlight melts sea ice and exposes dark open ocean. Open water absorbs far more solar energy than ice. When autumn and winter arrive, the air cools rapidly but the ocean stays much warmer. With more open water and a strong thermal gradient, the ocean efficiently transfers energy into the cold, dry Arctic atmosphere. This is why autumn and winter show the strongest warming trends.
(And CO2 is presumed to act as the initial trigger that sets this entire process in motion).
This feedback mechanism is supported by the observed vertical temperature structure. Arctic warming is strongest at the surface and decreases rapidly with height, which is exactly what you expect when the heat source is at the surface (reduced sea ice).
https://www.researchgate.net/publication/43352154_The_Central_Role_of_Diminishing_Sea_Ice_in_Recent_Arctic_Temperature_Amplification
Also, dont forget that heat is transported to the Arctic from the Tropics all year round.
For example via strong ocean currents in the Atlantic.
You people are arguing again about something that is easy to explain, but more difficult to fully understand, so you are arguing about your failure to accept the nuance involved in the analysis of the complete atmosphere. Here are two previous replies I wrote with some minor additions:
This is so funny. DREMT and Clint R have been defeated not by Nate, but by a simple Google search. He has the correct answer and then fumbles the football on the one-yard line.
This is from Nate:
“Oops correction:
Hopefully that puts to bed the myth that radiant energy flowing from a cold atmosphere to a warm Earth is a 2LOT violation.”
Nate has now completely mangled the quote from the Google search:
“while a cold object radiates to a hot one, the hot one radiates more, and the net flow of energy is from the hotter object to the colder one, satisfying the second law.”
The important concept here is “net flow”. This is what makes radiant heat transfer different than conduction. Keep in mind that convection in the strict sense also involves conduction in most if not all small scale systems.
In liquids and solids, heat conduction involves physical contact. In the gas phase, heat is transferred by collisions as described by the Kinetic Theory of Gases, but also by thermal radiation since the molecules are not in continuous contact.
The mechanism of radiant heat transfer involves radiant energy. The important concept is that the amount of radiant energy emitted by an object does not depend on its radiant environment, but the amount of “heat” transferred does depend on its environment. The “net” flow of “heat” if any, is always from hot to cold even if the two objects have different spectra.
This is part of what makes the greenhouse effect so very complex. Since CO2 and water vapor molecules have different spectra, they interact with other like-molecules having the same spectrum more strongly than other objects or molecules with different spectra.
And here is the follow up:
Why do people want to complicate this? In all of its complexity, it is rather simple to understand the basic mechanism of the greenhouse effect. Use of the term flow is not instructive. It is right there in my comment. The greenhouse gases create an “environment” of radiant energy that affects the release of energy to outer space.
Every atom and molecule on earth and in the atmosphere is warmer than the background radiation of outer space. They are all releasing energy while also interacting with each other. Flow has got nothing to do with it. The radiant energy release is omnidirectional. My “search assist” says it takes light 10 microseconds to travel from the surface (sea level) to the stratosphere. It does not seem like the “flow” of energy is being “slowed” or trapped for that matter.
It is also the interaction at all levels that leads me to be skeptical of the saturation claims about CO2. From the perspective of outer space it may “look” like saturation, but that is not what is happening within the atmosphere. The gases that interact with each other are saturated on the local level. The surface of the earth and most of the troposphere needs to be at a higher temperature than if there was no greenhouse effect, because they exist in an environment of increased radiant energy that produces feedback. The effect is strongest at the surface and diminishes with increasing altitude because higher altitude gases have more “protection” from the surface and less interference to outer space.
Rant is over. Good bye for now.
Tim S, I understand all the different (and sometimes conflicting) accounts of what the GHE supposedly is. That’s how I know they’re all wrong.
No GHE.
DREMT
It really does not matter if you think (believe in your own mind) that there is not a GHE. There actually is based upon real science and observation. Your denying this does not change what is. Just like Moon rotation. You do not understand that the Moon must rotate once on its axis per rotation to keep the same side facing the Earth. Your belief does not change the reality that it does.
Science proof of GHE is that the Surface radiates (based upon observed measured values) considerably more radiant energy than is leaving TOA.
Here is some more evidence but not sure it will sink in. I am not sure you have the mind to follow the evidence.
https://gml.noaa.gov/webdata/tmp/surfrad_693177847449d.png
These are measured values. You do not have to accept them but your beliefs will not change what reality demonstrates.
“Science proof of GHE is that the Surface radiates (based upon observed measured values) considerably more radiant energy than is leaving TOA.“
Of course! There’s a reason for that. It’s called: the lapse rate.
Norman, here you go again….
Your beliefs ain’t science. You have no viable definition/description that CO2 can warm Earth. You have no viable model of “orbiting without spin”. You don’t even understand the Surfrad data.
You really have NOTHING, beyond your beliefs and false accusations.
Fake mod
What does a radiation intensitiy difference have to do with the lapse rate?
Please avoid guessing a la MOTL/MOTR, and post a scientific article instead.
DREMT
The lapse rate would not explain the DWIR that is observed. You could be like the poster going by Climt R and make up your own physics and call it reality by making a total unsupported claim that the measured DWIR will not be absorbed by the surface. Hopefully you have more actual science background than that!! He pretends to know science but never supports any of his made up beliefs!
“What does a radiation intensitiy difference have to do with the lapse rate?”
Norman suggested that the fact that the surface emits more than the TOA was “science proof” (Norman’s term) of the GHE. However, all it proves is that the TOA is cooler than the surface. As the surface is warmer, it emits more! The reason the TOA is cooler than the surface is the lapse rate. Not difficult to follow, Bindidon.
Norman, you obviously need a reminder —
Glad to help.
Fake mod
” However, all it proves is that the TOA is cooler than the surface. As the surface is warmer, it emits more! The reason the TOA is cooler than the surface is the lapse rate. ”
This exactly your MOTL/MOTR niveau.
One must be totally ignorant or stupid to think that the difference in terrestrial energy measured AT the surface and that measured AT the TOA could have to do with their respective temperature.
*
” Not difficult to follow, Bindidon. ”
What is not difficult to follow is the level of your ignorance, fake mod.
Like you never will visit an observatory and hear the people there talking about how Moon’s spin can be mathematically computed, you also never will visit a lab where you wuld learn how IR is measured and what the measures really mean.
*
Thanks, lapse rate genius! You talk here like Robertson talking about GPS. Same knowledge level.
DREMT
Without GHG preventing radiant energy emitted by the surface from reaching space directly, the lapse rate would make no difference. The radiant energy would go from surface to space. The DWIR reduces the net flow of IR to space by adding partial radiated energy back to surface keeping it warmer at night and allowing the available solar energy to incrase surface temperature. Read some actual physics books on how radiant heat exchange works. Then you will understand the process. Reading blog posts on GHE just seem to confuse you on the issue.
“One must be totally ignorant or stupid to think that the difference in terrestrial energy measured AT the surface and that measured AT the TOA could have to do with their respective temperature.”
The atmosphere at the surface emits more IR than the atmosphere at the TOA because it’s warmer. The TOA is cooler because of the lapse rate, e.g. due to adiabatic cooling. No GHE involved.
Norman, you made a very silly statement:
“Science proof of GHE is that the Surface radiates (based upon observed measured values) considerably more radiant energy than is leaving TOA.”
I demolished that statement. You’ve then gone on to change the subject onto DWIR and what would happen in an atmosphere without GHGs. But, I’m not interested in following your diversions. Your original statement is debunked. End of story.
tim s …
“Nate has now completely mangled the quote from the Google search:
“while a cold object radiates to a hot one, the hot one radiates more, and the net flow of energy is from the hotter object to the colder one, satisfying the second law.”
The important concept here is “net flow”. This is what makes radiant heat transfer different than conduction. Keep in mind that convection in the strict sense also involves conduction in most if not all small scale systems”.
***
Tim…puleeeze, read Bohr’s discovery of 1913 re electrons and EM. It’s the basis of current quantum theory. It’s not difficult to understand, it’s the newer sci-fi quantum theory that is difficult to grasp because it is pseudo-science and makes no sense. It applies directly to heat transfer via radiation, provided you understand that heat is related to the KE of electrons in atom. Heat in a solid is the sum of individual electron KE’s in a mass.
I wish you guys would get off referring to heat as a generic energy and confusing it with radiant energy. That’s how this inanity of a net energy flow came about. People are simply confusing heat with electromagnetic energy.
When Clausius stated the 2nd law in words, he made no reference to a net flow of heat. His words on that have been misinterpreted. When he was trying to describe what he meant by compensation, which he called at first, “by it’s own means”, he referenced a two way flow but not at the same time. he was talking about a theoretical situation where heat flowing from cold to hot would need some kind of simultaneous flow in the opposite direct to balance it, which he called compensation.
Consider an air conditioner. It has heat flowing cold to hot, then hot to cold, simultaneously. They get away with that by playing with the Ideal gas Law…compressing a gas, that is, changing its state from a low pressure, low temperature gas to a high pressure, high temperature liquid and back. While in the High P, T state, they vent the heat to a higher temperature sink. Then they aerate the high P, low T liquid back to a low P, low T gas.
You will not find such a situation in the atmosphere.
The reason you and others are confused about this has to do with a misunderstanding of Bohr’s quantum theory of 1913. You simply don’t understand what he said re electrons and electromagnetic energy. If you did grasp his meaning, you would immediately see why heat cannot be transferred simultaneously between bodies of different temperature.
Put simply, electrons cannot do it. If they are in a high energy state as in a hotter body, they will not respond to the lower energy EM of a colder body.
Please be clear, it is electrons in atoms that are solely concerned with absorbing and emitting EM from a mass. There is nothing else involved. Ergo, you must bite the bullet and try to understand that. It is covered in basic electronics and basic chemistry theory.
Both electric current and heat transfer involved electrons, and their negative charges, to transfer energy. Neither can happen without electrons and their charges, which not only transfer charge, they also emit and absorb EM. If you stay at the molecular level you will never understand this.
Forget molecules, take the plunge and get into atom theory re electrons, protons, and neutron. The answers lie at that level.
Energy is not intentionally transferred via radiation between bodies of different temperatures. Both bodies are radiating isotropically, and part of the EM radiated by each body can be intercepted by the other body respectively. EM from the hotter body can be absorbed by a cooler body and converted to heat but that is not true from a cooler body to a hotter body.
Solar heat is converted to EM and transferred through space to the Earth. The Earth is cooler and absorbs the EM, converting it to heat. Claiming the opposite is true, that Earth radiates to the Sun, increasing its temperature is just plain silly, as Craig Bohren would put it.
Even though Clausius alluded to a two way transfer, and suffered from a lack of how heat was related to EM, as did all scientists in his day, he stated emphatically that with a radiant energy transfer, it must obey the 2nd law. There is no ‘net’ in the 2nd law, only a one way transfer, hot to cold. Even his mathematical representation of the 2nd law, entropy, is a one way transfer, hot to cold.
Heat is not even transferred ***as heat*** between bodies via radiation. It is dissipated at the radiating body, being converted to EM (see Bohr, or basic quantum theory). If the EM is absorbed at the other body it can be created anew as new heat. If you understood Bohr’s principle you would see that electrons cannot absorb EM arbitrarily, they can only absorb it at frequencies which coincide with the electron’s angular frequency and within strict bounds.
The hotter the mass containing the atoms with their electrons, the higher the KE of the electrons and their angular frequency. Electrons in the atoms of a cooler mass have lower KEs and lower angular frequencies. Those frequencies cannot excite an electron in the atom of a hotter mass.
EM from a cooler body simply lacks the frequency and intensity to affect electrons in a hotter body residing at a higher energy level as is the case in a hotter body.
————–
“The mechanism of radiant heat transfer involves radiant energy. The important concept is that the amount of radiant energy emitted by an object does not depend on its radiant environment, but the amount of “heat” transferred does depend on its environment. The “net” flow of “heat” if any, is always from hot to cold even if the two objects have different spectra”.
***
Wrong!!! You are confusing heat with radiant energy. This is not about a net flow since there is no heat flowing. The only energy flowing is radiant energy and it will not be absorbed by electrons in a mass unless it meets strict frequency criteria. Radiant energy from a cooler body is ignored by electrons in a hotter body.
———-
“This is part of what makes the greenhouse effect so very complex. Since CO2 and water vapor molecules have different spectra, they interact with other like-molecules having the same spectrum more strongly than other objects or molecules with different spectra”.
***
It’s not about molecules since molecules have no spectra. Spectra is about electron absorption and emission only hence it is about the emission/absorption of individual atoms in a molecule.
Ergo, it is solely electrons in atoms that can absorb and radiate EM. There is nothing else in an atom or molecule that can do this.
“Radiant energy from a cooler body is ignored by electrons in a hotter body.”
Here we see again the persistent, absolute stupidity of GR, CR dremt et al. Despite umpteen requests to explain how radiant energy from a cool body is different from radiant energy from a warm body, the closest they come is to incorrectly quote the Wien displacement law (WDL).
Let’s try again:
“Wien’s displacement law states that the peak wavelength of emitted radiation from a blackbody is inversely proportional to its absolute temperature.”
i.e. it is only the PEAK wavelength of ALL the emitted radiation that is temperature dependent. It simply refers to a graph of the distribution of intensity versus wavelength.
The actual photons being emitted know nothing about the temperature of their source.
Put another way, all photons of equal wavelength are all equal in the eyes of receptors. Just like the pearly gates, when we all queue up to get into heaven, Saint Peter will not be asking who your parents were since it is irrelevant.
“Here we see again the persistent, absolute stupidity of GR, CR dremt et al.“
I couldn’t care less about photons. Why am I being dragged into yet another debate which has nothing to do with me? Can’t you people just keep my name out of your mouths? “Back-radiation” impacting the surface cannot cause the surface to become warmer, or “warmer than it would otherwise be”, or however you want to phrase it. That radiation ultimately came from the surface in the first place. And, before that, from the Sun. You can’t just recycle energy through absorp.tion/emission and expect it to somehow amplify itself and lead to warming!
“Back-conduction” from a cooler object doesn’t lead to warming of a warmer heated object, now does it? No. Conductive insulation functions via thermal resistance, a physical property of the material. Not via “back-conduction”. Similarly, radiative insulation functions via reflectivity, a physical property of the material. Not via “back-radiation”.
I don’t care what happens at the quantum level to enable this all to work. Whatever it is, it must happen, otherwise thermodynamic laws would be violated. Why the fixation on photons, I have no idea. Other than I guess it’s a great way for you guys to endlessly obfuscate. Absorbed? Reflected? Don’t know. Don’t care! Whatever happens, it does not lead to warming.
DREMT
You are not thinking logically. GHE would not warm the Earth without the Solar input. The surface will be warmer with GHG present because they reduce the surface energy loss (by returning a portion of the surface emitted energy) and NOTE PLEASE, the surface is being warmed by new solar input at all times. Some part of the Earth surface are always having new energy added to them. The GHE reduces the rate of surface energy loss, with same solar input you get a warmer surface. Not real hard to figure out. You can make up Clint R fake physics where you claim (with no evidence at all) that a warmer surface can not absorb energy from a colder one. This is not physics. It is made up opinions on blogs like the crackpot Joseph Postma. No basis for it, none.
“Not real hard to figure out.”
Correct, Norman – the version of the GHE you keep pushing is not hard to understand, which is why I understand it with considerable ease. And, that’s how I know it’s wrong, for the reasons I just explained, and you ignored.
Gordon 7:49 am erroneously claims: “it is solely electrons in atoms that can absorb and radiate EM. There is nothing else in an atom or molecule that can do this.”
No. The angular momentum in a photon is too large for the tiny electron to absorb. It takes the whole atom or molecule to absorb a photon’s linear and angular momentum from which the quantum steps originate. Here, Gordon lets readers know he just isn’t aware of the Compton effect which causes many of Gordon’s mistaken comments in this field.
Of course DREMT 6:55 pm is also many times mistaken about our radiative atm. physics in admitting not caring and/or understanding “what happens at the quantum level to enable this all to work.”
Ball4 feels obliged to respond, for some reason.
“Absorbed? Reflected? Don’t know. Don’t care! Whatever happens, it does not lead to warming.”
Ooops!
DREMT spilled the beans on his determination to ignore contradictory facts.
It is purely about belief.
As you know, my overall comment has been made many times before. So no, no “beans” have been spilled. It’s nothing new, so you pretending something has “slipped out” is just more despicable dishonesty.
Ur ignorant and proud of it.
Got it.
No, Nate, all you’ve “got” is one of the biggest grudges I’ve ever encountered online.
For what?
If you say so, Nate.
Tim S, why do you feel the need to falsely accuse DREMT and I? Are you driven by jealousy?
If you had any real evidence of me getting the physics wrong, you would surely provide it. But, you can’t. All you can do is sling mud.
Oh pulleez. You cant even figure why adding energy by adding mass produces a different result than adding energy via massless radiation.
Nate, your false accusations not only prove your childishness, but also prove me right.
Pulleez continue.
Not false.
You had your chance to explain why adding ice cobes with mass ought to produce the same result, cooling, as adding just photons.
https://www.drroyspencer.com/2025/12/uah-v6-1-global-temperature-update-for-november-2025-0-43-deg-c/#comment-1724793
We can conclude that you dont understand the basic physics reason why these different scenarios produce different results.
That is that.
Nate, thanks for providing yet another example of your ignorance.
No responsible adult could even understand your complaint because you don’t understand enough to know what you’re complaining about!
But, keep proving me right. I can take it….
“Nate, thanks for providing yet another example of your ignorance.”
No explanation what ignorance I have.
“you don’t understand enough to know what you’re complaining about!”
No explanation of what I dont understand that you do.
“keep proving me right”
No explanation for what is proven right.
So your post contains nothing but vacuous insults.
Obviously you are deathly afraid that your fake physics will be exposex if you dare to explain your reasoning.
Nate, thanks for providing more examples of your ignorance and immaturity.
You can’t link to any “fake physics” I have provided. So, as I’ve indicated, you thrive on false accusations.
Keep proving me right. You make me look so good.
Nate
You have Clint R figured out! He does not know real science but he thinks that calling scientists cultish he can get some sort of following on this blog. So far only DREMT seems to fall for his endless unsupported blah blah.
One thing you can be certain of on this blog is that Clint R will never support any of his endless made up physics with evidence. He falsely claims that radiant energy from a cold source cannot be absorbed by the surface of a hotter one. Makes it up and it goes against experimental evidence and contrary to all established physics. You can find these ideas on some blogs but no real scientist would support them. Keep asking him for evidence. You will get nothing from him. Just insults and diversions.
Norman, there you go again.
You can’t show where I ever said “radiant energy from a cold source cannot be absorbed by the surface of a hotter one”. You just make one false accusation after another.
Instead of stalking me, like some immature urchin, why not grow up and face some reality:
https://www.drroyspencer.com/2025/12/uah-v6-1-global-temperature-update-for-november-2025-0-43-deg-c/#comment-1724894
Clint R
I have already done your “rabbit hole” game of pointing out what you had said and it changes nothing. You may have not said those exact words but you have stated the general concept that energy from a cold source will have no effect on a hotter one. If that is not what you think happens that would be good. Then you would have some real understanding of science. So would it now be correct that you would state that the energy from a colder surface will be absorbed by the hotter one?
Nice to see you back away from your false accusation, Norman. But, you’re not finished. It’s just a start.
No, you haven’t provided the evidence where I got any physics wrong. You just misrepresent my words, trying to make it appear I got something wrong. You need to clean up your act.
If you can’t quote my exact words, don’t make up crap.
Clint R
I will ask again as you seem to divert and not answer. Here is the question, it is a yes or no from you. Does the radiant energy from a cold surface get absorbed by the surface of a hotter surface?
Norman, can you even make a comment without misrepresenting me?
Like several of the others here, you’ve got some serious mental issues.
Seek help.
Norman, I think you are asking the wrong question. I am not aware of a specific mechanism for the observed effect. The T^4 relationship is enough to describe the effect. The question for surfaces is much easier than for gases. It is the difference of the two T^4 surfaces that is important, and it is not T^4 of the difference. So whether it is absorbed or there is a wave cancelling effect does not matter. The only thing that matters is the difference of the two T^4 temperatures even if the surfaces have different spectra.
Clint R
I guess you can’t help but divert when you can’t answer the question. It is in your personality to do this when you can’t answer a question. Should I ask again? You will not answer it will you?
Does the radiant energy emitted by a cold surface get absorbed by a hotter surface? Again Yes or No. Your diversions are not needed, next post just a Yes or No is all requested.
Norman, you have more interest in your childish antics than you do in learning science.
That’s probably why you can’t learn science, huh?
Really, Tim, you’re following the lead of the movie industry? All you can produce are remakes and sequels?
Is it really necessary to repeat your pedantic complaints about semantics?
Everyone is so busy lining up in their partisan silos that nobody caught this horrible error, but it is important to correct it. The following sentence:
“The gases that interact with each other are saturated on the local level.”
Should be this:
The gases that interact with each other are NOT saturated on the local level.
That is really at the core of understanding the greenhouse effect, and is why the saturation theory is wrong in my view. Each gas molecule interacts within their local neighborhood by the Kinetic Theory of Gases to either increase or decrease temperature depending on whether the local radiant environment (background radiation) is either warming or cooling the molecule.
Let me defeat the silly argument before it starts. When the net radiant effect causes energy to either arrive or leave a gas molecule, heat transfer has occurred by definition. Those who passed the final exam in college understand this. Others may have a problem with that. Real life experience working with radiant energy reinforces that fact.
The other effect is that the average kinetic energy of a gas sample and its temperature are directly related. A change in kinetic energy up or down is also a change in temperature in the same direction.
“…and is why the saturation theory is wrong in my view…”
Tim S was so busy up in his ivory tower that he forgot to notice nobody but him was talking about “the saturation theory”.
On this day, one hundred and thirty years ago, John Tyndall died at the age of 73.
The amount of CO2 in the air then was 294 ppm.
And the rest is history.
If Tyndall and Fourier were alive today, it would be easy to explain to them where they messed up. They were real scientists, and real scientists are able to learn, unlike cultists….
The purest description of the scientific method.
They call it the scientific method because it is a rigid method that follows well established principles. It is the basis of empirical science, otherwise known as hard science. The main principles are stating an objective, describing the method and material, making observations and stating a conclusion. Then the conclusion can be tested by peers.
Of course, nowadays we have corrupt peer review through which pseudo-scientists block empirical experiments before they reach peers. They call it peer review but that is a misnomer. It is simply a screen to prevent skeptics from posting the findings of experiments.
Of course, the GHE and AGW cannot meet the requirements of the stringent methodology of the scientific method and they have resorted to consensus. The new scientific method is this: the more people who agree with the pseudo-science the more it is established as fact.
That’s why Ark likes this new description of the scientific method, as a habit of mind. That translates to a paradigm, where the same dorks who do science by consensus can enforce their pseudo-science. The new science gangs up on skeptics, discrediting them and having them fired from their jobs.
The irony is that Ark uses Roy’s blog to push his pseudo-science and Roy tolerates him, as a good scientist who follows the scientific method would. Both Roy and John of UAH are being persecuted by the pseudo-scientist being promoted by Ark. Over at realscience, which is climate alarm central, no one is tolerated who speaks against their pseudo-science.
Two days ago I posted a link to a graph comparing UAH’s lower troposphere (LT) and stratosphere (LS).
I thought it would be interesting to show what’s above LS (located at 100 hPa i.e. at ~ 16 km altitude).
The Ratpac radiosondes’ minimal pressure level is 30 hPa, i.e. ~ 22 km.
Here is a chart comparing these three levels:
https://drive.google.com/file/d/1OW9XYf66-n4_RWrezT93p8h8Q2pAzcS2/view
Using 60 month running means show here best that the temperature decrease at 30 hPa and the increase in LT (500-700 hPa) started long, long before the Honga Tonga eruption in January 2022.
Also shown by these running means is that the pause from 1998 till 2015 occured not only within LT but was also similarly observed in LS and above.
*
The IGRA2 radiosonde set oberves up to the 1 hPa pressure level (i.e. above 32 km), maybe it might be useful to download that data too.
I posted an Excel graphic earlier showing UAH lower stratosphere temperatures since Jan. 1995, though it doesn’t seem to have appeared. In any case, the data do confirm a cooling trend.
Sorry – this was posted in the wrong place.
Global
https://climatedatablog.wordpress.com/2025/12/04/uah-mean-and-median-global-for-nov-2025/
Tropics
https://climatedatablog.wordpress.com/2025/12/04/uah-mean-and-median-tropical-for-nov-2025/
As for each month
– UAH Global 12 month Median low pass still wrong;
– UAH Global 5 year Median low pass still missing.
Blindsley H00d is definitely NOT the author of the software he claims to be.
Otherwise, even if he were unable to correct his mistake, he would at least have added what was missing.
I AM the author. Regardless of what Blinny says.
Hell hath no fury like a Blinny scorned.
Prove this by extending what you are the author of with a UAH Global 5 year Median low pass.
Then anyone can believe you.
I still wait for his version of
https://docs.google.com/spreadsheets/d/174CxYCkDKfQMUhAR4TnWXeKj58yhIiCYvCOF4koSfec/edit?gid=447018934#gid=447018934
Bindy, are you envious that someone else produces more informative graphs than you do.
You are SO easy to bait, I have given you the source code on many occasions.
Blindsley H00d
” You are SO easy to bait, I have given you the source code on many occasions. ”
*
How long will you keep dodging around, Blindsley H00d? How long?
How many times shall I repeat that I’m not at all interested in your source code, neither
– to correct your wrong UAH Global 12 month Median low pass
let alone
– to include the UAH Global 5 year Median low pass which is still missing?
RLH,
Bindy could not read your source code as he has never written any code in the first place.
When I challenged him months ago he gave an answer that only those who bluff would use.
Ignore him, he is mostly harmless.
QAnon
You are such a cheap lying polemicist.
1. ” Bindy could not read your source code as he has never written any code in the first place. ”
Your proof for this denigrating allegation?
*
2. ” When I challenged him months ago he gave an answer that only those who bluff would use. ”
Where did you ever challenge me anywhere, QAnon? Show us the place!
*
3. Exactly like Blindsley H00d (aka RLH) you are apparently unable to disprove this 100% Excel based chart, which is not based on any own source, as it contains only UAH data – together with spreadsheets anyone experienced in Excel can easily understand:
https://docs.google.com/spreadsheets/d/174CxYCkDKfQMUhAR4TnWXeKj58yhIiCYvCOF4koSfec/edit?gid=447018934#gid=447018934
*
4. Here is a chart which is indeed 100% based on my own data processing:
https://drive.google.com/file/d/1_F00TcPvlRBk4NQ8GR_Q6cdhUtQ4CUIQ/view
And here is the source of my evaluation:
https://www.ncei.noaa.gov/pub/data/uscrn/products/hourly02/
Show us your ability to prove my work wrong, QAnon MAGAboy!
Bindy,
Oh dear, you seem to be a bit too defensive.
Is using Google spreadsheet (Clue in the link) programming?
Hey Anon, quick question –
Where’s your code?
Could be fun.
” Oh dear, you seem to be a bit too defensive. ”
Oh look: the little ankle biting dog suddenly stops barking.
*
” Is using Google spreadsheet (Clue in the link) programming? ”
This link
https://docs.google.com/spreadsheets/d/174CxYCkDKfQMUhAR4TnWXeKj58yhIiCYvCOF4koSfec/edit?gid=447018934#gid=447018934
has nothing to do with programming indeed.
Why should anyone write a program when a spreadsheet calculator does the job perfectly?
*
But Blindsley H00d is over 100% convinced that his program is correct, hence he needs no validation & verification process.
BACK AT THE RANCH
So much to say, so little time:
– Dirty Donald plans to end prison rape protections for trans & intersex people, memo says.
– DOJ’s newest recruitment ad features Judge Dredd, the comic satire about the dangers of lawless policing and authoritarian power.
– Egghead Marc’s investment firm hired the guy who choked a homeless man to death on the subway.
– A small startup funded by 1789 Capital, a venture capital firm where Donald Jr. is a partner, will receive a $620 million loan from the Defense Department.
– DC pipe bomb suspect Brian Cole allegedly kept buying bomb parts after planting two pipe bombs in DC ahead of January 6.
– Eric has gotten 10 times richer since dad’s election.
– Elon’s chatbot will, with minimal prompting, provide residential addresses of everyday Americans.
– The friendship between Donald and Jeffrey presumably ended over a beachfront property in Palm Beach in 2004, which Double-crossing Donald acquired to sell back to Russian oligarch Dmitry Rybolovlev after he painted the faucets gold.
– The gubmint’s grazing program was established a century ago to prevent abuse of public lands has grown into a massive subsidy program that benefits wealthy ranchers and corporations:
https://www.propublica.org/article/grazing-ranchers-public-lands-trump
WINWINWINWINWIN
stoopid b…”Here we see again the persistent, absolute stupidity of GR, CR dremt et al. Despite umpteen requests to explain how radiant energy from a cool body is different from radiant energy from a warm body, the closest they come is to incorrectly quote the Wien displacement law (WDL)”.
***
Do you have even the slightest ability to read and comprehend? I had just laid it out for you, using basic quantum theory, and you failed to grasp any of it.
https://www.drroyspencer.com/2025/12/uah-v6-1-global-temperature-update-for-november-2025-0-43-deg-c/#comment-1724857
I am not asking anyone to agree with me, or to accept what I am saying. It would be nice if someone could take enough interest to challenge what I am saying using fact-based science. As it stands, your critique suggests a misunderstanding of what I have written.
The argument that photons know nothing about their origin or the target is just plain silly and I explained why in detail. Photons, or EM, or quanta, have a specific frequency and that is their signature by which they are identified, for want of a better word. They don’t need to know where they came from, all a hotter body needs to know, via its electrons, is the frequency of the arriving EM.
I have a strong background in resonance related to electrons and this stuff comes easy to me. I have no problem getting it that electrons can behave in this manner and that in an orbit can be very specific as to what frequencies of EM affect them. However, they react equally well to heat, which is a bit of a mystery since heat has no frequency. Somehow, heat can increase the KE of electrons but that should not be all that surprising since heat is KE.
There your answer as to how EM from a colder body is different from that from a warmer body, there is a frequency difference. Electrons in specific atoms only responds to an extremely narrow band of frequencies of EM, within one hertz. Look up the atomic spectra of hydrogen to see that truth.
Einstein clued into this circa 1905 with his photoelectric effect theory. He asserted that whatever caused electrons to leave a surface when irradiated by light was not the intensity of the light but the frequency. He made one mistake, however, thinking there was a transfer of momentum from EM to electrons that caused them to be dislodged. That gave a false impression that EM has momentum even though it has no mass.
Bohr discovered the real reason for the electron displacement in 1913. It was the absorption of EM by the electrons that gave them the energy to break bonds in surface atoms and escape the surface. Today, many scientists still subscribe to the notion that EM, with no mass, can have momentum.
That would not have been apparent to Einstein in 1905 since the electron had only been discovered in 1898 and its relationship to the hydrogen single-proton nucleus was still being studied. However, the frequencies of absorption and emission of hydrogen had been known for some time and the frequency of each was within a fraction of a cycle. That’s what gave Bohr the clue that electrons must change orbital levels when absorbing heat of EM and emitting EM when they dropped back to their normal states.
BTW, I still don’t buy into the theory that electrons orbit a nucleus as claimed. After spending decades applying electronics theory, it does not make sense to me. I’m not saying its wrong but I think it may be far more complex than described.
I only used a reference to Wein once. His theory has little to do with my theory, which is based on Bohr-based quantum theory I learned in electronics and basic chemistry theory.
As far as Wein’s Law is concerned it attempts to show a shift in a frequency spectrum with temperature. It’s far more than wavelength/frequency versus intensity, it shows a shift in the peak intensity of a spectrum that is proportional to temperature.
It’s all about blackbody theory which was theorized initially by Kircheoff
That has little to do with my argument, mainly because it is far too general. I am getting down to the nitty-gritty of how EM is radiated and absorbed by electrons. Wein, Planck, Tyndall, and Clausius knew nothing about electrons and their interaction with EM. In fact, Planck lamented that had he known about electrons it would have made his work much easier.
“They don’t need to know where they came from, all a hotter body needs to know, via its electrons, is the frequency of the arriving EM.”
More persistent, absolute stupidity.
Answer this simple question:
15 µ radiation arrives at a receptor.
The receptor’s temperature is 300K.
Does the receptor absorb the radiation?
And don’t tell me it depends on the temperature of the source. 15 µ radiation can come from an infinite number of sources at different temperatures – both hotter and cooler than the receptor.
Once you have thought about this problem, the penny will drop and you will (or should) realize you have been made to look like a fool.
dremt….”I don’t care what happens at the quantum level to enable this all to work. Whatever it is, it must happen, otherwise thermodynamic laws would be violated”.
***
Get what you mean re quantum theory. I got into it inadvertently since electronics basic theory comes from quantum theory. When I learned electronics I did not know for years that I had been studying basic quantum theory. Of course, electronics per se is vastly more complex but one needs to learn basic quantum theory to get the basics of how electrons and electric charge flow and later, to understand how transistors and the like work.
Ironically, thermodynamics laws were developed half a century and more before heat transfer was understood at the atomic level. It reveals the genius of Clausius that he was able to figure it out using heat engine theory without understanding anything about atoms. Quantum theory only explains heat transfer, especially via radiation, which neither Clausius or any other scientist of his time understood.
In essence, what he did was follow basic scientific reasoning re pressure, temperature, and volume. If you hold one of those constant while you vary the other two, over a complete cycle of a heat engine, it becomes apparent that the process cannot be reversed re heat transfer.
This idea of a net transfer of heat is a new invention aimed at bolstering the pseudo-science behind the GHE and AGW. Clausius made it clear that heat can only be transferred hot to cold ‘by its own means’. He made it clear that radiation must obey the 2nd law wrt heat transfer. However, he had no idea at the time how heat transfer via radiation worked.
Neither do modern climate alarmist, it appears, they are so desperate to make heat flow cold to hot that they invented the lie about net heat transfer. Of course, much to their shame, some mechanical engineering texts preach the same thing. None of them, however, provide examples of that, they just preach it.
I agree, Gordon, there’s no such thing as “net heat”. Energy (EMR) goes both ways, but heat only flows in one direction – hot to cold. Some of them accept that, some (like Tim S) don’t. Of course, they won’t argue amongst themselves about it.
DREMT: If this new “net heat” theory is valid science, it would mean a new industrial revolution! By blocking “heat waves” from hot to cold, we would still get “heat waves” from cold to hot. Or did I miss something?
lol, exactly!
Max,
tell us how you block rays from hot to cold without affecting rays from cold to hot.
barry: I let alarmists to answer that question. “Net heat” is their theory. There is an old saying, that never argue with believers because it is waste of time. Does God exist or AGW? Same thing.
Max, your posit is unphysical. You can’t do it. So the corollary you thought made greenhouse theory absurd is moribund.
The net exchange of radiative energy determines heat flow. That’s it. It’s not a revolutionary idea, it is standard physics.
“Since the hot body radiates more heat (due to its higher temperature) than the cold body, the net flow of heat is hot to cold, and the second law is still satisfied.”
https://www.engineersedge.com/heat_transfer/black_body_radiation.htm
“Suppose both surfaces are at the same temperature so there is no net heat exchange…”
https://web.mit.edu/16.unified/www/FALL/thermodynamics/notes/node137.html
“When T2 is greater than T1… the net heat transfer is hot to cold.”
https://openstax.org/books/university-physics-volume-2/pages/1-6-mechanisms-of-heat-transfer
Clausius himself also talks about a “simultaneous double heat exchange” between two bodies radiating at different temperatures, noting that the flow of heat is from the warmer to the colder. He is describing net heat transfer in his tract on the 2nd Law.
barry states:
“The net exchange of radiative energy determines heat flow. That’s it. It’s not a revolutionary idea, it is standard physics.”
Sure. The net exchange of radiative energy (EMR), determines heat flow. Not the net exchange of radiative “heat”. There is no such thing as “net heat”. So, barry appears to accept that here.
Then, he suddenly contradicts himself by piling on with sources claiming that heat is radiated both ways between bodies of different temperature, and that there is such a thing as “net heat”. Which is wrong, no matter who says it.
DREMT 7:47 am again comments with correct physical meteorology & earns 2nd good job of the day. Maybe DREMT can extend his new physics track record?
As Nate correctly quoted google AI couple days ago, an object does not ‘contain’ heat as written by most modern day thermodynamics textbook authors. So, whomever wrote per barry at MIT dot edu “the net heat transfer is hot to cold” needs to be quizzed on how something not contained in an object at T2 could physically transfer into an object at T1 and then become not contained therein also.
“piling on with sources”
I guess that’s a way to belittle engineering resources, university physics texts docs and MIT’s physics.
There are many ways to same the same thing. Clausius spoke of objects emitting ‘heat rays’ and spoke of the double heat transfer between them resulting in the heat flowing from the hotter to the colder.
Similar language plays out in the modern age. Hair-splitting doesn’t change the fact that they are all saying the same thing, and scoffing at the language doesn’t change the fact of the physics.
But I bet it makes some people feel superior to sneer at physics texts from universities that don’t conform to their views on the terminology.
All that posturing is irrelevant to physics.
Heat doesn’t flow both ways, barry. It’s not “terminology”, it’s a mistake. There is no such thing as “net heat”.
And, nobody is sneering, or feeling superior. You just have a problem with me, so invent lots of things in your head about me and what you believe I think/do.
When faced with sources like universities, engineering websites and MIT using terminology you think is invalid – and I can show many more examples, including from Clausius himself – for some reason you don’t opt to reconsider your view. Not even slightly, not even for a second.
To me a rational person with a reasonable regard for these sources and just a little humility would ruminate – openly – about what this might mean.
But not you. MIT, universities and Clausius all have it wrong. There’s no hesitation about this from you, despite a clear indication that it might be worth revisiting your opinion.
It’s that lack of humility and instinct for reinvestigating opinion that leads to the epithet ‘superior’. I wouldn’t have that opinion if you investigated the language rather than flatly dismissed it. You don’t have to agree, just reflect on what these institutions might mean.
That might lead you to reflect that language is variable around the topic, and that while different physicists might use different terminology (even in different languages altogether), this does not mean they understand the underlying physics differently.
You may also come to the opinion that scoffing at alternative terminology does not in any way advance the discussion.
Or not.
Realising that your beloved institutions are essentially human, and can make mistakes, is the first step on the road for you prising open that utterly closed mind of yours.
If I said to you that “back-radiation” was a flow of heat from cold to hot, I’d never hear the end of it. But, apparently, an online textbook can tell you that heat radiates from cold to hot, and you’ll accept it without question. Then, it’s just “terminology”.
Keep up with your intense hatred and false accusations, though, barry. Always amusing.
“If I said to you that “back-radiation” was a flow of heat from cold to hot, I’d never hear the end of it.”
If you said that hot and cold objects radiate heat at each other I would tell you that it’s fine to use that terminology as long as you don’t confuse that usage with the classic definition of heat.
The classic definition is what you ARE using when you say heat is flowing from cold to hot in previous discussions.
Clausius himself describes heat rays coming from objects of different temperature, and he describes their mutual irradiation as a “simultaneous double heat exchange,” resulting in the flow of heat flowing from the warmer body to the colder.
I don’t know if it’s a hangover from Clausius’ usage, or if it’s a result of the well-used terms ‘radiant heat/ing/er’ in various contexts being applied, but the term heat is used variably, even in physics. It’s not a tough stretch of the mind to figure out how the term is being used in context.
You can’t just admit that your institutions have it wrong, can you barry? You have to try and find some way to make it all work. But, it doesn’t work. There is no such thing as “net heat”.
Physics can be translated into different languages and is easily understood, because ultimately it is the applucation of laws expressed with equations.
The equations shown in the MIT lessons are correct, and they are applied correctly, thus they get the correct answers, as Eli does for the GPE temperatures.
But you guys dont get the correct answers.
And that is much more important than precise semantics.
At this point astute readers will note that Sky Dragon cranks usually walk back their “there is no greenhouse effect” to “there is no backradiation”.
Better ignore that motte-and-bailey.
“thus they get the correct answers”
… is not ever enough since like N&Z they also need the correct physical reasoning for readers to usefully apply the author’s work. A few days ago, Nate correctly wrote heat is not contained in an object found in modern day relevant texts from which natural written physical reasoning should follow.
DREMT 6:25 am has made some progress understanding modern day thermodynamics and should get some credit for writing with correct physical reasoning: “There is no such thing as “net heat.””
If N&Z had reasoned out the optical depth of each of their celestial bodies plotted, they could have drawn the curve first then plotted each body measurements near the curve. There would have been no curve fitting needed except to estimate inherent estimate error.
Eli did not even use the radiative heat transfer equation, but I’m not being baited into another discussion on the GPE.
There is no such thing as “net heat”.
“Eli did not even use the radiative heat transfer equation”
Clearly you still havent learned that it is equivalent to using the SB law, which he did.
Thus you still can’t solve this basic textbook radiative heat transfer problem.
He didn’t use the radiative heat transfer equation, Nate. So what you said previously:
“The equations shown in the MIT lessons are correct, and they are applied correctly, thus they get the correct answers, as Eli does for the GPE temperatures.“
was a load of crap.
“You can’t just admit that your institutions have it wrong, can you barry”
What sophistry.
“your institutions”
You’ll use any rhetorical trick to diminish credible sources and claim your puritanical view of terminology is the final commandment.
You won’t discuss the issue. You won’t explore the usage, consider the alternative explanation, wonder if perhaps you’re wrong when so many science and engineering organisations use the terminology you scoff at.
No, you won’t behave like a true skeptic.
https://phys.libretexts.org/Bookshelves/University_Physics/University_Physics_(OpenStax)/University_Physics_II_-_Thermodynamics_Electricity_and_Magnetism_(OpenStax)/01%3A_Temperature_and_Heat/1.07%3A_Mechanisms_of_Heat_Transfer
https://courses.lumenlearning.com/suny-physics/chapter/14-2-temperature-change-and-heat-capacity/
https://www.sciencedirect.com/topics/mathematics/heat-transfer-rate
https://fiveable.me/key-terms/intro-college-physics/net-rate-of-heat-transfer-by-radiation
https://pressbooks.atlanticoer-relatlantique.ca/heatlightsound/chapter/15-1-the-first-law-of-thermodynamics/
https://people.utm.my/syahirsarkawi/wp-content/uploads/sites/2487/2022/09/Topic-5_Basics-of-Heat-Transfer.pdf
You find the term ‘net heat’, net heat transfer’ etc in physics texts, university course texts again and again. I could spend days linking you to authoritative sources (not some backwater blog).
What is ‘superior’ is someone knowing that the field of science and engineering regularly uses the terminology and still believing without question that the science world is wrong about the usage.
The absolutism is the giveaway, not the opinion.
Nate,
I noticed in one of your previous comments a mention to Eli.
Astute readers may note that Sky Dragon cranks often lies to deflect toward one of his three pet trolling topics. Their lies often take the form of denial.
Astute readers could also verify for themselves that Eli indeed applies the SB law. Ignoring Graham D. Warner’s lies might be more expedient.
There’s nothing to discuss, barry. There’s no such thing as “net heat”, and heat is not radiated both ways between bodies of different temperature. Find a thousand sources saying otherwise, if you like; they’re all wrong. And, I notice you’re continuing with your false accusations.
Yes, Eli uses the SB Law. That’s how he converts from temperature to radiative flux and vice versa. But, he does not use the radiative heat transfer equation, which is what’s relevant to the discussion.
DREMT 4:26 pm, the radiative energy transfer equation is just the 1LOT in formula form at steady state: “At equilibrium an equal amount of energy has to be going in as coming out.” of whatever control volume is in use.
Ball4 – Eli does not use the radiative heat transfer equation. Why are you all trying to pretend he does? Why is it always, “oh, but look at it this way…”
He doesn’t use the equation.
Why on Earth is Nate trying to steer the discussion onto the GPE again, anyway? And why are four of you responding to me at once, all of a sudden?
“Load of crap”
If you did understand ANY of this subject, you would know that the MIT equations come from SB law.
But you dont. Yet you keep on mansplaining as if you do.
That is the travesty.
“If you did understand ANY of this subject, you would know that the MIT equations come from SB law….”
…of course, but so what? He doesn’t use the radiative heat transfer equation! Just saying the RHTE comes from the SB Law doesn’t somehow mean that he’s used the equation!
“Find a thousand sources saying otherwise, if you like; they’re all wrong.”
When the thousand sources are written by expert physicists and engineers, and comprise standard texts in university physics courses, it is a fool who is sure he is right and the experts are wrong.
You mistake conviction for knowledge.
That’s nothing more than an appeal to authority, barry. What’s funny about this is that I know you disagree with them yourself. I know you disagree that a cold object radiates heat to a hot object. Yet, you’re defending them anyway, which makes no sense. Saying it’s “just terminology” also makes no sense. I think you have a reasonable idea of what heat is, therefore you know it’s not radiated from a cold to a hot object without work being done on the system. So, what’s the point of arguing it’s “just terminology”? Words have meanings, you know what “heat” means in this context, and you therefore know their usage is inaccurate. So, why defend it? Why attack me when you know I’m right?
That’s nothing more than an appeal to authority, barry. What’s funny about this is that I know you disagree with them yourself. I know you disagree that a cold object radiates heat to a hot object. Yet, you’re defending them anyway, which makes no sense. Saying it’s “just terminology” also makes no sense. I think you have a reasonable idea of what heat is, therefore you know it’s not radiated from a cold to a hot object without work being done on the system. So, what’s the point of arguing it’s “just terminology”? Words have meanings, you know what “heat” means in this context, and you therefore know their usage is inaccurate. So, why defend it? Why attack me when you know I’m right?
“Of course, but so what? He doesn’t use the radiative heat transfer equation! Just saying the RHTE comes from the SB Law doesn’t somehow mean that he’s used the equation”
The RHTE includes VF to account for any geometry, but the GPE was the simplest geometry with VF=1. So he could leave out VF.
Ignorance of this is not a sound argument.
In any case, YOU fail to account for the RHTE in your ‘solution’.
So you are just going to keep pushing a pointless non-argument?
While protesting that others are MAKING you argue?
Why?
Obviously Nate knows full well that I’m aware VF = 1 between the plates for the GPE. Again, Eli did not use the RHTE, so that’s beside the point.
Nate wrote:
“The equations shown in the MIT lessons are correct, and they are applied correctly, thus they get the correct answers, as Eli does for the GPE temperatures“
which is nonsense, because Eli didn’t even use the RHTE, which is the equation you’re referring to from the MIT lessons. I’m calling you on that because you’re full of crap. You’re also trying to initiate a discussion on the GPE, which isn’t going to happen.
“Saying it’s “just terminology” also makes no sense.”
It makes perfect sense. Application of the same physics equations can be discussed intrnationally in many different languages, yet the same answers can be found.
So this is not a real issue.
If you don’t think it’s a real issue, you can always butt out of the discussion, Nate. Obviously barry thinks it’s enough of a real issue to keep writing his epic comments and finding all those links. I think it’s an issue that barry can’t open his mind enough to accept his authority figures are even capable of making a mistake, even though he disagrees with them himself!
“because Eli didn’t even use the RHTE”
Wrong each time.
Please explain what part of the RHTE eqn he did not include.
Show where he uses it or shut up.
“Eli didn’t even use the RHTE”
As previously explained, Eli did use the RHTE since the RHTE is just the 1LOT in formula form for radiation in a vacuum. DREMT should know this but can only process limited hearsay.
Google:
Radiative heat transfer eqn.
AI overview
“The “radiative heat equation” most commonly refers to the Stefan-Boltzmann law, which calculates the power radiated by an object (\(P=\epsilon \sigma AT^{4}\)) or the net heat transfer between two objects (\(Q=f\sigma A(T_{1}^{4}-T_{2}^{4})\)”
barry 6:55 am: “When the thousand sources are written by expert physicists and engineers, and comprise standard texts in university physics courses, it is a fool who is sure he is right and the experts are wrong.”
Not necessarily, as I already pointed out. Whomever wrote per barry at MIT dot edu “the net heat transfer is hot to cold” needs to be quizzed on how something not contained in an object (heat) at T2 could physically transfer into an object at T1 and then become not contained therein also. DREMT is correct, there is nothing physical about “net heat transfer”.
This is just a long holdover of the once believed but discredited by experiment caloric theory where a fluid such as heat in an object could be poured from a higher temperature object to a cooler object. Proper physics now goes with the long ago experiments showing heat is not contained in an object as Nate pointed out a few days ago.
Astute readers might notice that Graham D. Warner has responded.
While they may expect him to switch from Step 1 (Pure Denial) to Step 2 (Sammich Request), they may appreciate this other “theory”:
https://tallbloke.wordpress.com/2012/02/25/hans-jelbring-stefan-boltzmann-law-and-the-construction-of-a-perpetuum-mobile/
Astute readers might wonder if Hans used any radiative heat transfer equation…
It’s the equation for the radiative heat transfer between two objects, Nate, as you know.
Show where he used it, or shut up.
https://www.drroyspencer.com/2025/12/uah-v6-1-global-temperature-update-for-november-2025-0-43-deg-c/#comment-1725555
You made the claim and keep pushing it to infinity and beyond as usual.
Back it up, or if you cannot, drop it.
“That’s nothing more than an appeal to authority, barry”
No surprise that you can’t distinguish expertise from authority.
Physics develops terminology to make reasoning about energy flows practical. Insisting that ‘net heat’ is invalid ignores that thousands of practitioners and researchers use the term daily in a mathematically consistent way. Dismissing it on semantic grounds turns language into a barrier instead of a tool.
You summarily reject expertise if your view is different from it. You don’t question yourself on it. That is a fallacy internal to your intellectual operation.
‘Net heat’ transfer is simply the algebraic difference between bidirectional flows (in our examples). Science has no problem understanding this.
Qnet = Qa->b – Qb->a
This relationship holds whether you measure each flow stream in watts, joules, calories or whatever. It holds whether you call the individual vectors energy or heat. Doing this does not violate any laws despite your insistence on only one meaning for the word heat.
Everyone else here understands that heat has more than one meaning, even in physics, and can easily distinguish which usage is being applied. Only you (and maybe ball) have difficulty.
You can continue to be puritanical about the meaning of heat, but you will look like an imbecile if you continue to hold that physicist practitioners and educators around the world don’t know what they’re doing when they use the phrase ‘neat heat’.
Oh wow…Nate wants me to prove that Eli doesn’t use the RHTE! Well, anyone can just look at his original GPE article. He shows his work. He does not use the RHTE. There you go, there’s your proof! You know, traditionally-speaking, it would be much easier for Nate to prove the positive claim than for me to prove the negative, but there you go.
I’m just going to say it – Nate’s a liar and a fraud.
And, God knows what barry is even talking about.
Here you go, Nate:
https://rabett.blogspot.com/2017/10/an-evergreen-of-denial-is-that-colder.html?m=1
As I said, Eli shows his work. If you can show where he uses the RHTE, that being the equation for the radiative heat transfer between two objects (barry quoted it in his last rambling essay, and you have quoted it from your Google search, the latter of the equations mentioned) then I will stop commenting for 60 days. If you can’t show where he uses it, then you stop commenting for 60 days. How about that?
To clarify, this is the RHTE:
Q = Fe Fa A σ (T1^4 – T2^4)
Where:
Fe = emissivity factor to allow for departure from black body conditions
Fa = configuration factor based on the geometry of the system (not all of the radiation emitted by a body may be intercepted by the second body)
σ = Stefan-Boltzmann constant
A = Surface area
T1 and T2 are the temperatures of the hot and cold bodies respectively.
DREMT 6:10pm: “If you can show where (Eli) uses the RHTE…then I will stop commenting for 60 days.”
Very first equation Eli writes down. So shown. Good, now we won’t have to read DREMT comments for 60 days.
barry 4:48pm: “heat has more than one meaning”
Unfortunately, yes. Unique to just about every commenter herein. That is a sure impediment to physical understanding leading to mass confusion in the field of thermodynamics demonstrated on this blog & elsewhere. Language does become a barrier then instead of a tool if each commenter uses his or her own meaning for ANY word.
Clausius gave the word “heat” only one meaning. It is very easy to deal with the definition of heat: Heat does not exist. Heat is not even measurable. Why waste time and effort defining something in more ways than one when it does not even exist and cannot be measured? This all leads to mass confusion using the term “heat” as evidenced on this blog. I know of no examples in which invoking a mythical substance called “heat” leads to increased physical understanding.
For example, DREMT writes: “There is no such thing as “net heat”.” Then, later, DREMT turns right around and writes: “It’s the equation for the radiative heat transfer between two object” as if there IS such a thing as “net heat”.
Nate was correct recently writing there is no heat in an object. Heat does not exist in nature except in barry’s et. al. imaginations – including the MIT dot edu author.
No, Ball4. This is the first equation Eli writes:
“(400 W/m2) = 2 σ Teq^4”
Not the RHTE. I clarified what the RHTE was. Does that mean you’re not going to comment for 60 days, then?
“Then, later, DREMT turns right around and writes: “It’s the equation for the radiative heat transfer between two object” as if there IS such a thing as “net heat”.”
Not at all. There is no such thing as “net heat”, but there is such a thing as “heat”.
Here is what you said.
“Eli did not even use the radiative heat transfer equation”
and my response:
“Clearly you still havent learned that it is equivalent to using the SB law, which he did.
Thus you still can’t solve this basic textbook radiative heat transfer problem.”
Which you called BS on.
And we have this:
”
AI overview
“The “radiative heat equation” most commonly refers to the Stefan-Boltzmann law, which calculates the power radiated by an object (\(P=\epsilon \sigma AT^{4}\)) or the net heat transfer between two objects (\(Q=f\sigma A(T_{1}^{4}-T_{2}^{4})\)”
The difference is the RHTE applies SB to multiple srfaces and finds the NET energy (Heat) flows between surfaces.
WHICH IS EXACTLY WHAT ELI DID in multiple steps
You just cant recognize it, most likely because of your poor algebra skills.
So now why dont you review what he did and come back and tell us what he did ‘wrong’ to get the ‘wrong’ answer.
Looks like Nate quoted Graham D. Warner denying that Eli used thermo for his plate. Astute readers might expect him to try to use some kind of special pleading to defend his indefensible claim. And then to try to gaslight them with his fixed point until the end of the month.
Graham is nearing his 100th comment.
We’re the 12th of December.
Very funny. Nate cannot show where Eli used the RHTE, because he did not use it. 60 days off for Nate.
DREMT 2:19 am can’t even copy and paste Eli’s eqn. correctly in trying to dodge responsibility for being wrong and showing integrity by disappearing for next 59 days.
When DREMT posts up Eli’s first eqn. correctly, then readers will observe DREMT trying to be honest and take ownership of being wrong. All the energy transfer in Eli’s GPE is by radiation so DREMT must know he can’t win his own premise and will show readers DREMT’s observed lack of integrity for the next 59 days.
God, they’re desperate.
DREMT,
Still unclear what you think about this statement,
“The equations shown in the MIT lessons are correct, and they are applied correctly, thus they get the correct answers, as Eli does for the GPE temperatures.“
is a “load of crap”
given that what he used is entirely equivalent to the RHTE, AND he gets the same final equations that he would have gotten by using the general form of the RHTE?
Do you need me to show you that?
Looks like Nate is finally conceding that Eli did not use the RHTE.
So, he should now stop commenting for 60 days.
“The RHTE includes VF to account for any geometry, but the GPE was the simplest geometry with VF=1. So he could leave out VF.”
Let me guess, Nate – Graham D. Warner is trying to suggest that to use an equation requires that it’s written in its most general form.
So not only does he confuse usage and mention, but by that logic, he is forced to accept that A x 1 isn’t equal to A!
Astute readers might expect more stonewalling from him. Since they ignore what he writes, that’s no big loss.
All wrong, Willard. Eli simply does not use the RHTE. As desperate as you all are, nothing any of you can say is going to change history and mean that he used that equation. He did not use it! As anyone can see for themselves.
“The equations shown in the MIT lessons are correct, and they are applied correctly, thus they get the correct answers, as Eli does for the GPE temperatures.“
Still cant say what is BS in this statement?
Eli did not write down the equations in the same general form as MIT because he didnt need to. The geometry of the problem was simple.
And as noted several times by me and Google/AI, writing down the SB law, applying it to every surface, then writing down the NET heat transfers effectively gives you the RHTE.
And he then uses 1LOT correctly to get the right answer.
I think you are obssessing over minor semantic points, while still not applying the RHTE and 1LOT CORRECTLY to get the right answer.
Nate, it’s quite simple. You pointed to the MIT lessons, and said that Eli used that equation (the RHTE was the one relevant to what barry was talking about at the time) to get the “correct” answer. But, Eli did not use the RHTE. So, you’re completely full of crap. And instead of just admitting that he didn’t use it, you endlessly try to put me down and personally attack me! He didn’t use it, and thus you should stop commenting for 60 days.
At this point astute readers might wonder – why wouldn’t Graham D. Warner simply move on and try to peddle in his pet vIEw FActORs all by himself?
After all, there’s no need to act like the Devil (who only comes in invited) if one always feels invited, like Graham.
But then that’d be to discount how he sucks at semantics, and how much he likes to gaslight.
There’s also the fact that he has a full month to milk out of this silly episode.
And the fact that he sucks at equations too.
So stonewalling it is.
At this point, there’s no need for astute readers to read any of his comments to predict where this is going, and know why.
More personal abuse, despite the fact that I’m absolutely correct (as usual).
“Everyone else here understands that heat has more than one meaning, even in physics, and can easily distinguish which usage is being applied. Only you (and maybe ball) have difficulty.”
Of course “heat” has many meanings, barry, but as I said (and you ignored):
“I think you have a reasonable idea of what heat is, therefore you know it’s not radiated from a cold to a hot object without work being done on the system. So, what’s the point of arguing it’s “just terminology”? Words have meanings, you know what “heat” means in this context, and you therefore know their usage is inaccurate. So, why defend it? Why attack me when you know I’m right?”
“You pointed to the MIT lessons, and said that Eli used that equation”
Nope, not what I actually said.
But let me rewrite it so it is abundantly clear for you.
The radiant heat transfer equations shown in the MIT lessons are correct in general, and when they are applied correctly, they get the correct answers, as Eli does for the GPE temperatures, by using equivalent radiant heat transfer equations applicable to that specific geometry.
Is it BS? If so, why?
Looks like Graham made his 108th and 109th replies this month.
B4 mentioned some “RHTE”, an acronym that doesn’t exist. Astute readers might recognize Graham’s way to sound technical by inventing jargon. He’s probably just appealing to the wiki:
https://en.wikipedia.org/wiki/Heat_transfer#Radiation
One should expect that he’s been trying to elide Stefan–Boltzmann from the equation he must pretend Eli hasn’t used.
Used.
As in – Eli solved a simplistic thought experiment about heat transfer without using any heat transfer equation.
Right.
Astute readers may notice what happens when the values for ϵ and F are 1.
Graham is just a silly goose.
Nate tries to rewrite the history of the thread.
Let me make it abundantly clear to him – Eli did not use the RHTE, and Nate claimed I was wrong to say that. But, I’m not wrong. Nate should stop commenting for 60 days.
It’s all BS. For eight years, Nate and others have tried to pretend that Eli’s GPE solution is standard textbook physics. It isn’t. They’ve certainly never shown anything like his solution in any textbook.
DREMT 10:47 am reveals he hasn’t read “any text book” on thermodynamics which all use the RHTE (DREMT term) equation Eli used in solving the GPE. Sad, but now known to be admittedly true.
If DREMT had any integrity at all admittedly not having studied thermodynamic texts, DREMT would refrain from commenting on this meteorology blog not just for his 60 days having lost his challenge, but forever.
Looks like Graham D. Warner commented.
Since it does not seem like a very short comment, he must not have gone for Step 1 alone – Pure Denial.
He could have gone for Step 2 – Sammich Request. Astute readers might notice how this would allow him to ignore the fact that his silly denial might very well have rested on selectively choosing one form of the equation (we just presented three) so as to ignore the Stefan-Boltzmann law.
He could have gone for Step 3 too – Saying Stuff. But that’s a bit short for that.
As for Step 4 (Cheap Bargaining), it’s too early in the month.
Whatever steps Graham chose, it’s better to ignore them.
That’s right, Ball4, many textbook examples use the RHTE. Eli did not use it, as Nate admits every time he says “using equivalent radiant heat transfer equations”. Of course, that’s also BS – Eli simply didn’t consider heat flow at all.
Ball4 should also stop commenting for 60 days.
“It’s all BS. For eight years, Nate and others have tried to pretend that Eli’s GPE solution is standard textbook physics. It isn’t. They’ve certainly never shown anything like his solution in any textbook.”
“It isn’t.”
Wow, DREMT now claims to be familar with whats in many physics textbooks!
As a matter of fact we did show you the problem worked out in online course content. As well as the general equation for multi-layer-insulation.
You mustve conveniently forgot.
DREMT 12:32 pm is humorously confused as those without integrity often find themselves since Eli’s GPE solution eqn. really is used in “any text book” on thermodynamics DREMT admitted not even reading. No wonder DREMT is so easily confused on this blog.
Neither Nate, nor Ball4, should currently be commenting. Both should be taking a 60 day break. Both of them are disgustingly dishonest. Nate has never shown a solution like Eli’s from any text. Obviously, if such existed, they could show it now easily enough.
DREMT,
“you know what “heat” means in this context, and you therefore know their usage is inaccurate.”
The context is very simple. Gordon rejected the terminology “net heat” as some kind of climate science invention and you joined in the mocking of it. I pointed out that the usage is common and well understood.
That’s the context. No other. We all know the classic definition of heat, and I know that you cannot accept another in physics.
And you want me to simply agree with you that this is the only valid use of the term.
I don’t agree. And neither do the physics and engineering communities.
They are not in the wrong here, DREMT.
Physics speaks of objects having a temperature radiating thermal energy, otherwise known as heat. This is common terminology at every level of science education.
Thus, two objects radiate “heat” at each other, and the “net heat” transfer is from hot to cold.
No problem if you don’t like this alternate usage. but it’s not invented by climate science, nor is it some strange perversion of physics language. It is language commonly used and commonly understood in physics. I’m sure there are a handful of “purists” with science degrees who think like you do. But experts don’t have a problem understanding the variation or the physics.
It doesn’t change how we here understand the physics. It’s a trivial side issue.
Actually, Gordon acknowledged (and I was already well aware) that “of course, much to their shame, some mechanical engineering texts preach the same thing” regarding “net heat”. You’re more than welcome to join them in being wrong. No such thing as “net heat”.
“…you know what “heat” means in this context, and you therefore know their usage is inaccurate“
Of course, the context I was actually referring to was “energy being radiated between two objects of different temperature”. barry knows that in this context, “heat” is only radiated one way, from hot to cold. So, he knows full well that those talking about “net heat” have it wrong.
“Nate has never shown a solution like Eli’s from any text. Obviously, if such existed, they could show it now easily enough.”
DREMT, you keep insisting you dont want to re-discuss the GPE, but here you are again asking for the evidence.
I have noticed in recent discussions that you just dont pay attention to contrary information provided by your opponents.
This is yet another example of that, since I most certainly did show you that, plus the general solution for the MLI, which can be used to find the solution of the GPE by plugging in e = 1 for emissivity.
Ring a bell?
If I show you the problem worked out in online course materials, will you acknowledge that you have been wrong about the solution to this problem, and dont actually know better than people with expertise in the subject?
Nothing more will occur in this discussion until you first acknowledge that Eli did not use the RHTE. Then, you will need to stop commenting for 60 days. Then you can post whatever evidence you want.
DREMT 8:46 am, Eli’s GPE has only energy transfer by radiative physics so Eli MUST have used the radiative energy transfer eqn. to solve his example problem despite DREMT’s confused comments to the contrary. The eqn. is used in any text book on thermodynamics that you need to read in order to eliminate DREMT’s confusion. Please follow DREMT’s own direction not to comment until this confusion is eliminated thus blog readers are no longer misled by DREMT.
“Nothing more will occur in this discussion until you first acknowledge that Eli did not use the RHTE.”
Ah, the usual evasion distraction tactics.
As noted several times, I acknowledge that he wrote down the SB law for both plates, which have VF =1, then found the net exchanges of energy betwee the plates and space. Which as I noted several times, is EQUIVALENT TO using the RHTE.
That is a factual account, and thus should satisfy you.
If it doesnt then go soak your head in ice water for awhile…. that may help.
“Then, you will need to stop commenting for 60 days.”
Show me where I agreed to do that..
Sounds like you want to put off finding out you were wrong as long as possible.
Nate is basically agreeing that Eli did not use the RHTE. But, he refuses to simply say that. Ball4 is simply a liar, which astute readers knew already. Both should stop commenting for 60 days.
Looks like Graham D. Warner responded with a one-liner. Either he repeated his incorrect claim, declared himself the winner or reiterated his silly toll bridge. Since I have a minute, here’s where Eli applies “the” equation:
https://rabett.blogspot.com/2017/10/an-evergreen-of-denial-is-that-colder.html
Compare that with the equation above:
ϕq = ϵσF(T_{a}^{4}-T_{b}^{4},
Here’s a little legend for those who are slow:
400 W/m2 => ϕq
σ => σ
T1^4 => T_{a}^{4}
T2^4 => T_{b}^{4}
What’s left?
ϵ and F.
For a blackbody fully facing an object, both can be neglected.
As we said a few times already.
Graham D. Warner has no business here.
At the very least, he can be ignored.
Willard can’t tell the difference between the RHTE and the equation he quoted from Eli’s GPE article. He apparently can’t tell the difference between “plus” and “minus”. And, he still personally attacks me!
Eli did not use the RHTE.
I forgot to add –
Astute readers might search for “for radiative transfer between two objects, the equation is as follows” on this page to get the quote, and ignore whatever prostation Graham D. Warner might be spouting.
Humorously DREMT 2:11 pm is unsuccessfully trying to mislead readers writing “Eli did not use the RHTE” to solve an example problem only involving radiative transfer. What a laugher. DREMT has no integrity.
That’s right, Ball4 – Eli did not use the RHTE, even though he was trying to solve a problem involving radiative heat transfer. That’s why his solution is such a joke. You’re laughing at the wrong person, though. You should be laughing at Eli.
And you should be doing so whilst taking 60 days off commenting.
“Eli did not use the RHTE, even though he was trying to solve a problem involving radiative heat transfer. That’s why his solution is such a joke.”
The joke is on you if you actually believe that..
For one thing: Google/AI told you the RHTE is the SB law, which he used.
If only there was a way to check the math to see if he would have gotten the same result if he had written down the RHTE in the MIT form, and taking it from there.
If only….
But no, so you rely on feelings, feelings that the people who can do math must be lying to you, again.
Nate, the SB Law is one thing, the RHTE is another thing. Related, but different. We’ve already identified what the RHTE is, everyone reading the thread now knows exactly what it is. Why can you not just directly state that Eli does not use the RHTE!? Why is every comment from you some sort of half-acknowledgement of that fact and then half some sort of excuse that “oh, it’s like he’s used the RHTE”, or “oh, it’s equivalent to using the RHTE”, or “oh, he uses the SB Law, which is related” or whatever?
Just simply and unequivocally state that he does not use the RHTE. What are you so afraid of? What do you think is going to happen if you just admit the truth!?
We’ve been back and forth on this for several days now and there’s really nothing to discuss. Ball4 and Willard have utterly disgraced themselves, and your credibility is hanging by a thread. For what? Anybody can see for themselves that Eli does not use that equation. So…why not just admit it!?
“That’s why his solution is such a joke”
This statement makes clear that you still dont understand that what Eli did was equivalent to using the MIT version of the RHTE.
And that his use of the SB law, which gives the emitted flux from each plate, then finding the net flux exchanged between objects, is perfectly valid, not a joke, and leads to the correct answer.
If you think starting from the MIT RHTE is going to produce a different result, SHOW US THAT.
If not, then your statement ‘Thats why his solution is a joke’ cannot be supported.
State, simply and unequivocally, that Eli did not use the RHTE.
Or, lose any remaining shred of credibility that you had.
Graham D. Warner has responded with a short outburst.
So astute readers can surmise it’s either Pure Denial or Sammich Request.
Which is it?
This can go on for the rest of December if you guys want it to. I’m certainly not stopping until Nate simply and unequivocally states that Eli did not use the RHTE.
Why should I take all this crap when I’m right?
Addentum. – Could be both, of course.
That should go without saying, but is there anything Graham could ever get “without saying”?
Going back 6 days:
https://www.drroyspencer.com/2025/12/uah-v6-1-global-temperature-update-for-november-2025-0-43-deg-c/#comment-1725490
“Clearly you still havent learned that it is equivalent to using the SB law, which he did.”
This is still an accurate statement of what he did!
I believe I made it clear that he used the SB law…but that didnt satisfy you.
Since then you’ve just been an asshole and a bully.
Looks that will continue indefinitely..
Meanwhile, you claim that
“Eli did not use the RHTE, even though he was trying to solve a problem involving radiative heat transfer. That’s why his solution is such a joke.”
suggesting that his solution would not be “a joke” if he had started with the MIT expression of the RHTE.
I asked you to show us how that would change the ‘solution’ into a non-joke, to back up your claim.
So lets see it!
And lets see if it agrees with your ‘solution’ with both plates at the same temperature.
Willard is apparently obsessed with somebody called “Graham”, that he keeps insisting everyone should ignore whilst doing the exact opposite himself.
Nate believes I am the one being a bully!
I can assure you, that’s not how it reads to anyone else. I’m being relentlessly personally attacked for being correct.
Nate, stop this nonsense about the SB Law. You know what the RHTE is, as does anybody reading. It’s not the SB Law, although it relates to it. Eli did not use the RHTE, and, until you can simply and unequivocally state that, this discussion goes no further.
Simple inspection of Eli’s work shows neither conductive nor convective energy transfer occurs in his example problem or in his equations. The only choice left is the radiative transfer energy equation actually used in Eli’s work.
DREMT 1:56 pm has laughably dug his indefensible position hole deeper than ever before.
Simple inspection shows that Eli does not use the RHTE. I don’t know WTF is wrong with you people, and how you got to be so utterly and despicably dishonest, but there you go.
Graham D. Warner has commented.
Without reading, we can surmise he reached his usual fixed point, stuck at the trivial step of his usual motte-and-bailey.
Better ignore him:
https://ntrs.nasa.gov/api/citations/19710021465/downloads/19710021465.pdf
Equations.
With an S.
Once again Graham has confused himself with his notation.
I have not confused myself with anything, and there’s no motte and bailey. We’ve identified what the RHTE is. Eli does not use that equation.
That’s all there is to this “discussion”.
Graham has responded a short comment.
One could bet it’s more a regression to Step 1 (Pure Denial) than a rush toward Step 4 (Cheap Bargaining), for Cheap Bargaining would require more words. Words like:
– “but what I mean by the acronym I just invented is”, followed by some handwaving;
– “but what I mean is more important than mathematical equivalence”
– “what I mean by “use” may not be obvious, but but but but but but”
– “of course there is not one heat transfer equation, in fact there’s not even one heat transfer equation for radiation, but but but but but but but but but but but but but but but but but but but but but but but but but but but but but but but but but but but but but but but but but but but but but but but but but but but but but but but but but but but but but but but but but but but but but but but but but but but but but but but but but but but but but but but but but but but but but but but but but but but but”
Astute readers may have recognized by now that Graham just built a silly toll bridge of no relevance whatsoever, since Eli indeed built his example to meet the requirements of a blackbody in vacuum perpendicular to another one. Not only implicitly, but explicity, as we already showed:
https://rabett.blogspot.com/2017/10/an-evergreen-of-denial-is-that-colder.html
So all that means is that Graham has another month to waste.
Better ignore him, like he ignored Nate for so long, all while responding to him.
A point of order:
Nate was actually the first to use the acronym RHTE for the radiative heat transfer equation, a long while ago, before this “discussion” even started. It’s not something I invented. It’s a term Nate and I use for an equation that we both know well. So, his obfuscation on the issue is laughable. He knows full well what is meant by the RHTE, and he knows full well that Eli does not use it.
There’s really nothing to discuss on this issue. Nate implied that Eli got the “correct” answer due to using the RHTE, but Eli does not actually use that equation.
Beyond that, I have no interest in discussing the GPE. I also have no interest in discussing any other equations.
I ignored Nate for several years. During that time, he persistently butted in on discussions I was in. I rarely, if ever, jumped in on his discussions. Willard is persistently butting in on my discussions whilst pretending to ignore me! Not the same thing at all.
“Nate, stop this nonsense about the SB Law.”
I pointed out clearly what equation he used, the SB law. Could not have been more clear.
Apparently you feel the need to keep bullying me anyway.
And its not all nonsense or ‘such a joke’ that his use of the SB law was perfectly equivalent to using the RHTE.
Eli was very clear in his diagram the directions of his SB-law emissions from each plate.
Anyone can see the arrows of emission from the BP to space and to the GP, each of which = sigma*Tb^4.
Anyone can see the arrows of emission from the GP to space and to the BP, each of which = sigma*Tg*4.
Then anyone with half a brain (even you) can figure out that the NET flux (heat) transfer between the BP and GP is
Q(BG) = sigma*Tb^4- sigma*Tg*4,
and for the BP to space
Q(Bs) =sigma*Tb^4, since the Ts of space is set to 0.
and for the GP to space
Q(Gs) =sigma*Tg^4
Which are the identical results as the MIT RHTE would produce for this geometry,
Yes or No?
So it is hard to understand, since it leads to the identical results, why this is even an issue for you. Nor why you try to use this to claim Eli’s ‘solution is such a joke’.
This is a way over-the-top fuss about a non-issue.
At the same time you keep evading the real issue, which is that using either the SB law or the RHTE produces the same solution, which does not agree with your ‘solution’.
Why am I accused of making a fuss? All I am doing is responding to people who keep hurling abuse at me for being correct on a trivial issue.
Nate is now (finally) admitting that Eli did not use the RHTE.
So, I’m correct. And, Nate, Ball4 and Willard should all stop commenting for 60 days.
“There’s really nothing to discuss on this issue. Nate implied that Eli got the “correct” answer due to using the RHTE”
“Implied”
That was your takeaway from it.
But in my very next post the same day I made clear what I meant.
“Clearly you still havent learned that it is equivalent to using the SB law, which he did.”
So right there, same day, you had your answer!
Thus the next week of arguing was about nothing at all!
Utterly stoopid waste of time.
And yet the bullying still continues.
What an asshole you are!
Nate has apparently “forgotten” that he wrote this comment:
https://www.drroyspencer.com/2025/12/uah-v6-1-global-temperature-update-for-november-2025-0-43-deg-c/#comment-1725548
He continues to personally attack me for being correct. Nate, Ball4 and Willard should all stop commenting for 60 days.
Funny, DREMT can’t correctly ‘splain why he is right, assertions don’t impress on a science blog. DREMT remains wrong, Eli really did use the radiative transfer eqn. in a solution to a radiative energy transfer example.
Even after Nate concedes the point, Ball4 is still lying…
For good measures, and since Graham D. Warner seems to have protested, let’s look af the first time Nate mentioned “RHTE”:
Better ignore Graham’s protestations.
The answer to Nate’s question should now be obvious to astute readers: Graham has little else than pushing pointless non-arguments.
Willard doesn’t seem to understand that Nate has now conceded that Eli didn’t use the RHTE. It’s over. The “discussion” is finished.
Astute readers might have noticed that Nate’s first mention of “RHTE” was when quoting Graham D. Warner.
What a sad, pitiful, and still perhaps lonely man, unable to know how to look for love.
Better ignore him.
As I already explained, Nate was the first to use the acronym “RHTE”, long before this “discussion” even took place. Probably more than a year ago, now, I’m not sure exactly, but it didn’t originate with me.
Nate, Ball4 and Willard should all stop commenting for 60 days. They won’t, because they have no integrity. But, they should.
Astute readers might consider Nate’s TLDR –
They might also consider the wiki entry:
They don’t need to be Alfred Tarksi to understand that Graham is not very good at semantics, which is a formal discipline.
Eli relies on “the” equation Graham fails to recognize.
His lackadaisical obduracy can be ignored.
Nevertheless, two more weeks until we get to another theme for another month where he’ll try to make himself relevant.
Eli did not use the RHTE. Those that have insisted he did should be taking 60 days off from commenting, instead of trying to pretend that drawing some arrows on a diagram and acknowledging that temperatures can be converted to radiative flux and vice versa via the SB Law constitutes using the RHTE!
I did not bring up the subject of the GPE, Nate did. I have no idea why. Maybe he was trying to make himself relevant?
Perhaps astute readers ought to pay due diligence to Graham D. Warner’s operative concept – to “use”.
Let’s consider a simple example:
1 x 2 x 3 = 6
Have I just *used* the laws of multiplication? Of course I did! But suppose I didn’t. What did I do instead – did I ask Graham’s best buddy?
That’s the kind silly supposition Graham is forced to contend about what Eli did.
Better ignore him for the rest of the month.
The depths they’ll sink to, to avoid simply admitting that they were wrong, is staggering.
Willard should not be commenting for 60 days.
Let astute readers entertain the following derivation:
A = B + B
A – B = B
A = 2B
B = A/2
Question – in what sense can we say that someone did not use one and not the other?
Another – why should anyone care if these are all equivalent, and in fact express the same relationship between A and B?
That derivation should help Graham find the center of his motte, i.e. that A = B + B is not the same equation as B + B = A.
Willard goes completely nuts when he’s proven wrong. What will be next? Will Willard be asking, “what does DREMT really mean by the word “equation””? Or will he take a line of argument that Eli used the RHTE “in spirit”? I can’t wait to see what he relentlessly comes up with.
Graham D. Warner seems to have responded.
Perhaps astute readers ought to ignore him and contemplate if:
https://rabett.blogspot.com/2017/10/an-evergreen-of-denial-is-that-colder.html
represents any kind of algebraic operation.
“Willard doesn’t seem to understand that Nate has now conceded that Eli didn’t use the RHTE.”
DREMT shamelessly pretends I just now ‘conceded’ something after I quoted myself stating that Eli used the SB law, ONE WEEK AGO.
DREMT has made it clear that he thinks the use of the RHTE to solve radiative heat transfer problems is absolutely essential.
Lets see what it has to say about his GPE solution:
His ‘solution’ has both plates at 244 K. The RHTE applied here gives the net energy transfer (heat) from Blue to Green plate: Qbg =sigma (244^4-244^4) = 0.
Zero. Thus NO NET energy is flowing to the Green plate.
Now apply the RHTE for the heat flow from GP to space.
Qgs = sigma(244^4 -0) = 200 W/m2.
There we have it. DREMTs solution has the GP losing 200 W/m2 to space, while getting no energy from any source.
His ‘solution’ utterly fails.
QED
“DREMT shamelessly pretends I just now ‘conceded’ something after I quoted myself stating that Eli used the SB law, ONE WEEK AGO.”
And, I pointed out that a day later, you said this:
https://www.drroyspencer.com/2025/12/uah-v6-1-global-temperature-update-for-november-2025-0-43-deg-c/#comment-1725548
But, you ignore anything that contradicts your narrative.
I told you, I will not be baited into discussing the GPE. That’s conclusively settled in my favour and will never be discussed again.
Astute readers might need to wait a long time before Graham makes a clear point. Here’s what it would look like. In
“you” refers to Graham, whereas “he” refers to Eli. And “it” is using the equation Graham holds essential. Thus interpreted, we have:
(N1) Using the SB law is equivalent to using the heat transfer equation.
(N2) Eli used the SB law, which is equivalent to the heat transfer equation.
(N3) All this is useless nitpicking: we all know how Eli proceeded with his thought experiment.
On Graham’s side, considering our experience’s motte-and-baileys and overall semantic abuses:
(G1) I alone can define to what “RHTE” refers, even though I did not introduce it.
(G2) Eli didn’t use heat transfer equation, because he DID NOT.
(G3) Prove he didn’t or else.
Thirteen days left.
N1 is false, Willard. Your argument fails accordingly.
No DREMT 12:52, your comment has no substance; you need to show how N1 is false.
I can convert the temperature of a blackbody plate at 244 K to its emitted radiative flux of 200 W/m^2 using the SB Law. I’ve used the SB Law, but radiative heat transfer has not entered into it. Thus, using the SB Law is not equivalent to using the RHTE. I’m not sure why anyone is claiming that it is.
Using the RHTE correctly gives the answer that the plates will be at the same temperature at equilibrium. Using it correctly means not holding Q constant:
https://climateofsophistry.com/2013/05/27/the-fraud-of-the-aghe-part-12-how-to-lie-with-math/
“I told you, I will not be baited into discussing the GPE. That’s conclusively settled in my favour and will never be discussed again.”
Bwa ha ha!
Here for a week you have been promoting the importance of using the RHTE to solve problems such as the GPE.
But when your ‘solution’ to that problem is shown to be totally inconsistent with the RHTE, and violates energy conservation, you simply declare that you were right anyway.
Now pls continue fussing endlessly over piddly semantics while living in denial of the facts.
“Here for a week you have been promoting the importance of using the RHTE to solve problems such as the GPE.”
Wrong, Nate. That was you. I was merely pointing out, correctly, that Eli does not use the RHTE, and being relentlessly abused and hounded by multiple commenters for being correct.
Now, the discussion is being moved into the domain of the actual specifics of the GPE. Which is not something I’m interested in discussing for the nth time. I’m only interested in discussing that which is necessary to confirm the point that Eli did not use the RHTE.
DREMT 2:17 pm, Eli’s GPE plate in the sun and the plate in the shade cannot be at the same temperature in steady state equilibrium. Use Eli’s RHTE solution to figure out where DREMT’s RHTE solution is incorrect.
And still no substance provided why N1 is false so until you do N1 is not false.
“Let astute readers entertain the following derivation:
A = B + B
A – B = B
A = 2B
B = A/2”
Yep, these are not equivalent equations according to DREMTs way of thinking.
Probably because he cannot do algebra.
All wrong, Ball4. N1 is false until proven correct. You are reversing the burden of proof, and completely ignoring everything I said in support of it being false.
Eli did not use the RHTE, nor did he use anything equivalent. He simply did not consider heat flow at all. That’s one of the main criticisms of his solution. The other criticism is that in ignoring the RHTE, he’s ignored view factors. The view factors between the Sun and the BP are not the same as the view factors between the plates, and Eli’s solution does not reflect that fact.
Here’s the correct solution to Eli’s problem, including use of the RHTE.
“The source supplies 400 W/m^2 to the blue plate. Given the geometry and view factors involved, the blue plate splits the 400 W/m^2 to emission on either side of itself, hence warms to a temperature to emit 200 W/m^2 on either side, thus conserving energy for said geometry.
We now introduce the green plate, which can be approximated as infinite plane parallel with the blue plate, and for this geometry the heat flow equation between the blue and green plate is simply
Q = sigma * (Tb^4 – Tg^4)
The green plate stops rising in temperature when Q = 0, i.e. when the heat flow to it goes to zero which is thermal equilibrium. Therefore when Q = 0 the green plate has a constant temperature of
0 = Tb^4 – Tg^4
Tb = Tg
The green plate thus achieves the same temperature of the blue plate, and emits 200 W/m^2 on its outside, this conserving the input energy from the sun source.
In the above correct solution, I utilize the laws of heat flow and hence the 2nd Law. You ignore the 2nd Law and claim that your solution is correct because you believe you’ve used the 1st Law. Your solution is therefore insufficiently based in reality, and hence wrong.”
DREMT 4:53 pm, when your green plate “emits 200 W/m^2 on its outside”, your blue plate is absorbing 600 W/m^2 so cannot be at the temperature of your green plate. DREMT’s solution is transient, not steady state equilibrium.
Look at Eli’s RHTE steady state solution consistent with 2LOT because S – So is positive to discover the faults in DREMT’s solution. No 2LOT consideration was thus ignored.
“…when your green plate “emits 200 W/m^2 on its outside”, your blue plate is absorbing 600 W/m^2”
No, Ball4. You are adding the emission from the GP back to the BP. Eli assumes he can do this because he is not using the RHTE. That’s the point that you have all missed for about eight years. Again:
“In the above correct solution, I utilize the laws of heat flow [by actually using the RHTE] and hence the 2nd Law. You ignore the 2nd Law and claim that your solution is correct because you believe you’ve used the 1st Law. Your solution is therefore insufficiently based in reality, and hence wrong.”
So, I’m only discussing the GPE specifics insofar as they make the point that Eli did not use the RHTE, which is partly why his solution fails. Another reason it fails is that, in not including the RHTE, view factors are effectively ignored. So, he doesn’t treat the transfer between the Sun and the BP and differently than the transfer between the BP and GP, despite the view factors being radically different.
“Eli did not use the RHTE, nor did he use anything equivalent. He simply did not consider heat flow at all. That’s one of the main criticisms of his solution. The other criticism is that in ignoring the RHTE, he’s ignored view factors. The view factors between the Sun and the BP are not the same as the view factors between the plates, and Eli’s solution does not reflect that fact.”
While applauding you for moving past piddly semantics, onto the key physics he discussed, I need to point out that your understanding of what he did is deeply flawed.
As I explained, what he did by applying the SB law to each object, then doing the accounting of net flows of energy from each object, is entirely equivalent to using the RHTE.
As you can see in this post, doing so gives the identical results as using the RHTE from the getgo.
https://www.drroyspencer.com/2025/12/uah-v6-1-global-temperature-update-for-november-2025-0-43-deg-c/#comment-1725959
This is simply algebraic equivalences, and thus should not be at all controversial.
In any case I had asked you:
“If you think starting from the MIT RHTE is going to produce a different result, SHOW US THAT.”
I got no answer.
Its not sufficient to just declare that the results would be different you have to show us the MATH.
DREMT 1:03 am: “You are adding the emission from the GP back to the BP” of course as required by the 2LOT to ensure BP S – So is positive (Clausius eqn. 64) and the BP blackbody absorbs all incident radiation (Kirchhoff).
There is no hope for DREMT to be correct violating 2LOT over the last 8 years + just refer to Eli’s RHTE for the correct 2LOT consistent GPE solution.
No Nate, what you did in your linked comment was to declare that the fact Eli uses the SB Law to convert temperature to radiative flux, and vice versa, and the fact that he has a nice diagram with some arrows, somehow means that he did the equivalent of using the RHTE. He did no such thing. Heat flow was not considered.
“If you think starting from the MIT RHTE is going to produce a different result, SHOW US THAT.”
Shown here:
https://www.drroyspencer.com/2025/12/uah-v6-1-global-temperature-update-for-november-2025-0-43-deg-c/#comment-1726052
Ball4 will be ignored as he’s just doing his usual incorrect waffling about 2LoT and pretending that Eli used the RHTE when he didn’t.
“Here’s the correct solution to Eli’s problem, including use of the RHTE.”
“The source supplies 400 W/m^2 to the blue plate. Given the geometry and view factors involved, the blue plate splits the 400 W/m^2 to emission on either side of itself, hence warms to a temperature to emit 200 W/m^2 on either side, thus conserving energy for said geometry.”
Yep we can agree on that. Notice he has applied conservation of energy (1LOT), which requires that energy flowing in = energy flowing out!
‘We now introduce the green plate, which can be approximated as infinite plane parallel with the blue plate, and for this geometry the heat flow equation between the blue and green plate is simply
Q = sigma * (Tb^4 – Tg^4)
The green plate stops rising in temperature when Q = 0, i.e. when the heat flow to it goes to zero which is thermal equilibrium. Therefore when Q = 0 the green plate has a constant temperature of
0 = Tb^4 – Tg^4
Tb = Tg
The green plate thus achieves the same temperature of the blue plate, and emits 200 W/m^2 on its outside, this conserving the input energy from the sun source.”
He is applying the RHTE correctly to find the heat flow between the plates, however he has not SOLVED for the temperatures of the plates.
He simply and erroneously declares that the heat flow between them must go to 0.
Why? This is not a rule or a law of phsics!
This is DEEPLY FLAWED reasoning.
He did not apply conservation of energy (1LOT) to the GP. Which he did apply to the BP. Which required that the inputs to the BP 400 W/m^2, equal to the output from the BP.
Thus his solution produces an unphysical, nonsensical result:
As I explained above, he has 0 NET energy transfer from the BP to the GP, yet 200 W/m^2 NET energy transfer from the GP to space.
If the GP is continuously losing energy to space, while not gaining energy from any source, then its internal energy must decrease, and it must cool. This is 1LOT, and also common sense.
If he had considered this correctly, he would find that the GP would COOL until a new equilibrium is reached.
Then the RHTE would show that
Qbg = sigma * (Tb^4 – Tg^4) = Q(green to space), and 1LOT would be satisfied.
And let me remind you that we had a lengthy previous discussion, where you acknowledged that any body, such as the GP, can be considered a Thermodynamic system, and therefore 1LOT must apply to it.
The overall point is that, over the eight years that have passed since Eli created this thought experiment, you’ve completely lost the plot and have moved 180 degrees from the reality of the situation…so that now you’re saying these sorts of problems need to be solved using the RHTE, and you give the GPE as an example of that! Of course, it was always pointed out back at the time that Eli did not use the RHTE, and that was one of the main criticisms of his solution! So, it’s a complete reversal of the facts to now be trying to use the GPE as an example for use of the RHTE, as you did in this thread!
You can point to his arrows and claim that he thought about heat flow, but you can’t point out in any of his calculations where he actually “did the equivalent of using the RHTE”…because he didn’t!
“He did not apply conservation of energy (1LOT) to the GP“
Nate, I must have explained to you about twenty times before exactly why there is no problem with conservation of energy in the 244 K…244 K solution. This is why I refuse to get into the weeds on these issues, again. It’s all already been done. If you haven’t got it through your head by now why there’s no issue with conservation of energy, how is going over it for a 21st time going to help!?
I only agreed to discuss GPE specifics to the extent they help explain how Eli did not use the RHTE, or equivalent. I’m not discussing the whole GPE thing again, from the beginning!
DREMT 8:36 am: There is still no hope for DREMT to be correct when ignoring Clausius eqn. 64 as DREMT has done ever since Eli posted the 2LOT compliant with eqn. 64 GPE solution which has been verified by reasonable experiment.
R. Clausius came up with the 2LOT to prevent 1LOT compliant solutions (such as DREMT’s imaginary GPE solution) that differ from nature.
Looks like Graham responded to Nate’s calculations with a short comment.
Astute readers may expect Step 3 – Saying Stuff.
This is so much of a sure thing that there’s no need to read what Graham said.
Better ignore everything he says, or at least anything that isn’t corroborated by Nate.
As expected, you have no explanation for how the GP emits NET energy to space while recieving no NET energy from any source.
As you agree, the energy input from the BP is cancelled leaving a NET of 0 going into the GP. Yet it keeps emitting to space!
This violates both 1LOT and common sense.
And I reviewed a more recent post by JP, and he also has no answer for this.
https://climateofsophistry.com/2021/05/19/green-plate-analyzed-and-demolished/
A commenter raises the exact point I raised above about the Green plate
Weekly_rise says:
2021/05/20 at 6:20 AM
Quoting another commenter :
‘Okay got it (I think). Is this right: the plate emits F on both sides. But the emission toward the source is cancels with the F absorbed from the source. Then the emission of F toward space balances the F absorbed from the source.’
“Doesn’t this explanation violate the conservation of energy? If the plate is emitting F on both sides it is emitting 2*F, so emitting a flux twice as large as the flux it is receiving. Am I reading that wrong?”
Then after JP has no sensible answer:
Weekly_rise says:
2021/05/20 at 9:42 AM
“It’s possible that the plane/point source distinction is throwing me off, but this still doesn’t make sense to me. I agree that the sourceward side of the plate will “cancel out†with the incoming flux, but in this case we’d say that both the incoming and outgoing fluxes are being canceled – not just the outgoing. So if we assume F coming in and F going out on the sourceward side, then both Fs cancel and there is no net flux on the sourceward side. But then we have the problem of there being a flux of F on the nighttime side of the plate. Where does that energy come from?”
And he keeps bringing it up, and he gets no real answer from JP, just hand-waving and obfuscation.
Eg he declares “Money is fermionic and energy is bosonic…maybe that’s the problem”
Puleez! This gibberish and thus pure obfuscation!
Then the commenter just disappears from the comments.
This feels familiar to me.
Well, astute readers are going to be confused – we have Nate insisting that the 244 K…244 K solution violates 1LoT, whilst Ball4 is happy that it’s “1LoT compliant”! Of course, Ball4 could explain to Nate why Nate is wrong, but I won’t hold out much hope of that happening.
We’re wandering further and further off-topic, exactly as I feared. Can we all now agree that Eli did not use the RHTE, or equivalent?
When Graham adds a little comment after Nate provided a demonstration, it usually indicates that he’s just saying stuff.
But more importantly, that he’s looking for his next fixed point. That usually involves saying remarkably silly, but that can be reduced to a trivial remark.
None of this matters, except that there are still 12 days left to the month.
As long as astute readers still ignore Graham, all is well.
”
I will not be baited into discussing the GPE. That’s conclusively settled in my favour and will never be discussed again.”
Multply absurd statement, now that you posted JPs flawed explanation, after arguing that Eli’s solution ‘was a joke’.
“Confused – we have Nate insisting that the 244 K…244 K solution violates 1LoT”
Yep it is glaringly obvious to anyone with a skeptical mind, and basic science literacy, as the commenter has.
Now it seems abundantly clear that neither you nor JP have answers for the failure of the solution to satisfy one of the most thoroghly tested laws of physics, Energy Conservation.
Your ‘solution’ is debunked, and thats all there is to it.
Let me remind you of another problem with JPs solution. He claims that it satisfies 1LOT for the system of 2 plates, and therefore it must be correct.
He has 400 W/m2 input, and 200 W/m2 output from the BP and GP to space. 400 in = 400 out.
Impressive!
But not really. Eli’s solution has 267 W/m2 output from the BP and 133 W/m2 output from the GP to space. 400 in = 400 out!
There are an infinite # of pairs of numbers that add up to 400, thus an infinite number of ‘solutions’ that satisfy 1LOT for the system of 2 plates.
Clearly that is no constraint on the correct solution.
But satisfying 1LOT for each plate does constrain the solution to the 267/133 result found by Eli.
Perhaps if Willard wants people to ignore me, he could lead by example.
Universally despised trolls aside, I think I’ve gone above and beyond in attempting the more difficult task of proving the negative claim. Whilst those making the positive claim have done absolutely nothing to attempt to prove it, even though their task should be much easier. So, we can conclude that Eli did not use the RHTE, or equivalent.
DREMT 10:46 am, no confusion since Nate has correctly stated the system 1LOT balanced and shows where DREMT gets the GPE solution transiently wrong internally where Eli’s radiative transfer eqn.s are correct.
There never has been hope for DREMT’s equal temperature equilibrium solution to be correct which ignores Clausius’ eqn. 64 and elementary school physics of a plate in the sun equilibrating in temperature with a plate near to it in the shade.
Whoops! A comment so correct the system decided to post it three times.
Nate knows that I’ve explained to him twenty times already why there is no problem with conservation of energy in the 244 K…244 K solution. Not for the 2-plate system as a whole, and not for the single plates either.
I’ll do him a deal – if he agrees that Eli did not use the RHTE, or equivalent, and thus him, Ball4 and Willard should all stop commenting for 60 days, I’ll explain the conservation of energy thing for the 21st time.
Can’t say fairer than that.
Astute readers can see the DREMT denial and evasion happening in real time.
They can see him with the strong urge to promote his unwavering belief in the Joe Postma GPE ‘solution’, while being completely unable to defend it with any logic.
No surprise, because it is absolutely illogical.
In the past he invoked ‘Clint has a theory’ with his blackbodies transforming into mirrors in fear of having to abs.orb radiant energy from colder bodies.
But by now he must realize that ‘theory’ is inconsistent with his new favorite RHT equation.
“Probably because he cannot do algebra.”
I forgot to say where I took inspiration for my derivation:
https://rabett.blogspot.com/2018/08/the-simplest-green-plate-effect.html
Astute readers might notice the equation in the first figure, at the right of the page.
As for Graham, well, let’s just ignore him.
Ball4, either my solution is “1LoT compliant”, like you said, or it violates 1LoT, as Nate suggests. You can’t possibly both be right.
God, they’re childish.
OK, I’ll explain it for the 21st time. The energy from GP cannot be added back to the BP. You should have understood that from Postma’s use of the RHTE, and 2LoT generally. But, the energy has to go somewhere. It doesn’t just disappear. So, it’s returned to the GP from the BP. In doing so, the energy balances across the board. The two plate system as a whole, and each individual plate, is all then in balance at 244 K…244 K. You should remember this from the colour-coded diagram.
Now that I’ve explained that, you’ll switch to another complaint.
And, round and round we’ll go.
“He is applying the RHTE correctly to find the heat flow between the plates, however he has not SOLVED for the temperatures of the plates.”
Well, that’s trivial. He already said the BP alone emits 200 W/m^2, so using the SB Law you can work out that the BP temperature would be 244 K. Then, using the RHTE, he establishes that the GP will be warmed to that same temperature.
“He simply and erroneously declares that the heat flow between them must go to 0. Why? This is not a rule or a law of phsics! This is DEEPLY FLAWED reasoning.”
It might not be a law of physics, but it’s something we’re all aware of and witness every day. Temperatures of objects tend towards equilibrating with one another. Your hot cup of coffee cools towards the room temperature, your ice cold beer tends to warm. Nothing controversial about it. As the BP has an external heat source, it stays the same temperature whilst the GP is warmed by it until it’s at the same temperature as the BP. In real life, there would be losses past the edges of the plates, and thus the GP could never come to the same temperature as the BP. But, in the thought experiment, there are no losses.
“It doesn’t just disappear. So, it’s returned to the GP from the BP. In doing so, the energy balances across the board.”
No. No amount of handwaving can undo what the RHTE tells us
The RHTE makes it abundantly quantifiable. The Net energy transfer Q = 0. Zero.
There is no NET energy transfer from B to G.
None. Zilch.
The GP has no source supplying NET energy to it. Yet you have it emitting energy to space, while maintaing its temperature.
This is simply impossible.
Sorry.
The heat transfer between the BP and GP is zero, and as a result both the BP and the GP are at the same temperature. The GP emits based on its temperature and emissivity, and part of that emission will go to space. So, that the GP emits 200 W/m^2 to space is already incorporated in the RHTE between BP and GP. There is thus no need to apply the RHTE between the GP and space. That’s partly why this:
“Qbg = sigma * (Tb^4 – Tg^4) = Q(green to space), and 1LOT would be satisfied.”
is wrong. The other reason it’s wrong is that it involves “holding Q constant”. That’s a no-no with the RHTE, as explained in the article I linked to previously, that everyone completely pretended didn’t exist.
2:54 pm: Read my comment more carefully. Nate, Willard, and I all agree with Eli’s long ago GPE solution using 1LOT radiative transfer eqn. consistent with 2LOT (Clausius eqn. 64). DREMT is thus wrong writing “both can’t possibly be right”.
The GPE plates equilibrate in steady state equilibrium at different temperatures consistent with 1LOT, 2LOT making DREMT’s transient solution wrong as there is no steady state equilibrium reached.
DREMT’S solution has no hope of being right admittedly ignoring Clausius’ eqn. 64 and elementary logic that a BP in the sun and nearby GP in the shade equilibrate at the same temperature.
You directly disagreed with Nate, Ball4.
Never mind, nobody expects any honesty from you.
DREMT, I did not disagree with Nate. DREMT just needs to pay better attention and quit disagreeing with R. Clausius.
Of course you disagree with Nate, Ball4. On the issue of whether the 244 K…244 K solution is “1LoT compliant”. It’s OK, though. As I said, nobody expects any honesty from you. Just as nobody expects you to have the integrity to stop commenting for 60 days, as all three of you should.
So, back on-topic, now that all Nate’s diversions have been dealt with…I take it that it’s now conceded by all that Eli did not use the RHTE, or equivalent. Excellent! Pointless “discussion” over.
“The heat transfer between the BP and GP is zero, and as a result both the BP and the GP are at the same temperature.”
Again, your premise does not come from any rule or law of physics.
“The GP emits based on its temperature and emissivity, and part of that emission will go to space. So, that the GP emits 200 W/m^2 to space is already incorporated in the RHTE between BP and GP.”
Indeed the GP emits according to its T, and the RHTE must be satisfied. And 1LOT MUST BE satisfied.
Eli solution does satisfy all of those. While JPs solution does not.
You still have no answer for this.
“There is thus no need to apply the RHTE between the GP and space.”
False. It applies to all.
Look this is really really basic. The GP is losing energy to space. It needs be replaced, else it must COOL.
In JPs ‘solution’ it is not.
No amount of handwaving can fix that.
“It might not be a law of physics, but it’s something we’re all aware of and witness every day. Temperatures of objects tend towards equilibrating with one another.”
Sure, as long as there is no external heat source keeping objects far from equilibrium.
“Your hot cup of coffee cools towards the room temperature, your ice cold beer tends to warm. Nothing controversial about it”
Now apply a heat source to the coffee. It does not equilibrate with the room. It can stay warmer than the room indefinitely. The passive cup walls end up at an intermediate temperatuture.
The BP in this problem has a heat source. It can stay warmer than space indefinitely. The passive GP ends up at an intermediate temperature.
All is well.
Yes, Nate, we’re all well aware that you simply don’t listen to what your opponent says, and you rarely support your assertions.
There’s no problem with 1LoT in the 244 K…244 K solution, as I’ve explained to the satisfaction of anybody rational.
Can we now get back on-topic, please?
Eli does not use the RHTE, or equivalent, and you three all need to take 60 days off commenting. Yes?
Looks like Graham responded to Nate. Since what Nate says is so rudimentary as to be incontrovertible, astute readers might expect the following defensive mechanisms from him:
– you-and-him fights in the form “but look at what B4 said”
– handwaving such as “look at what this Sky Dragon crank wrote somewhere”
– backtracking to what he was fleeing from
– playing dumb about what has already been settled.
Meanwhile, astute readers might wonder how “solving for T1 the answer is T1 = 262 K” and “without the greenhouse plate it was 244 K” can be said without using any heat transfer equation.
“There’s no problem with 1LoT in the 244 K…244 K solution, as I’ve explained to the satisfaction of anybody rational.”
I see no rational explanation from you.
Only vague hand-waving excuses that dont add up.
In your 244K/244K scenario the Green plate is recieving 0 net energy from the Blue plate, as we all agree the RHTE tells us.
And it is emitting 200 W/m2 to space, as we sll agree.
The issue to explain is quantitative. Numbers dont lie.
0 does not ever equal 200.
Sorry, simply declaring all is fine with this is not an argument.
Its just pure denial.
Nate’s continued diversion reveals that he’s conceded the point – Eli did not use the RHTE, or equivalent.
Excellent! “Discussion” over. 60 days off from Nate, Willard or Ball4. Bliss!
“Meanwhile, astute readers might wonder how “solving for T1 the answer is T1 = 262 K” and “without the greenhouse plate it was 244 K” can be said without using any heat transfer equation.”
That says it all, really. Willard sees that Eli did some calculations, and without having a Scooby Doo what Eli did, he just assumes that Eli must have used the RHTE, or equivalent. Just blind faith. No way of knowing who is actually right or wrong in this but just assuming I must be wrong, anyway. Funny.
Astute readers can see that you are suffering from extreme cognitive dissonance.
They know it is difficult to accept undeniable evidence that a long-held belief is false.
But many have done it. You can too.
Nate’s projecting again.
Why is he still commenting, though? He should have started his 60 days off by now.
Graham made a short comment.
Since there’s only ten days left in the month, he might be tempted to return to his favorite technique – gaslighting.
Astute readers might prefer to focus on Eli’s simplest version:
https://rabett.blogspot.com/2018/08/the-simplest-green-plate-effect.html
They might wonder how Eli came to that conclusion. They might also take a look at the second figure.
No RHTE or equivalent there, Willard.
Don’t have a clue, do you?
Please stop commenting for 60 days.
The RHTE, the one you claim to believe in, makee it clear that in the 244k/244K solution, there is no net energy transfer to the GP from the BP, the only source it has.
Zero.
You’ve said nothing to change this. There are no words or phrases that can undo this. Because it is straightforwardly correct.
Then we have the GP emitting according to its temperature and the SB law, 200 W/m2 to space. You agreed. Agsin thwre are no words or phrases that can undo this undeniable fact.
Then we all have to face the mathematical reality that 0 does not equal 200.
The GP is losing energy that is bot being replaced.
It has no internal nuclear or magical source creating new energy.
Thus the 244k/244k fails to work.
But you shamelessly declare that this is not a problem, and you have shown it.
Where? I dont see any such thing.
So you distract, tell us we are talking about something else. Squirm.
This explains why you have been so desperate to avoid talking about this.
It is difficult to deal with undeniable evidence that your long held beliefs are wrong.
But that is the reality.
Nate just keeps repeating his refuted argument, that he has made a dozen times before in previous discussions, apparently believing something new has happened. Strange.
Meanwhile, he should actually be taking 60 days off commenting.
Looks like Graham D. Warner has responded with a one-liner.
He must have exhausted his munitions by now.
Astute readers might wonder why Eli wrote
a = b + b
and
a = 2b
and
b = 2/a
if he’s not “using” thermo.
Willard chooses to display his ignorance, rather than stop commenting for 60 days.
“Nate just keeps repeating his refuted argument,”
Where did you refute it?
How did you refute it?
Did you refute that 0 does not equal 200?
Did you refute the RHTE, and its ZERO net energy transfer to the GP?
Or did you refute that the GP needs to emit 200 W/m2?
WTF do you think you refuted?
DREMT laughably hopes assertion is sufficient to refute basic science. DREMT has been out in the sun too long because its the same temperature as under the sunshade according to DREMT comments.
…but anyway, back on topic – Eli does not use the RHTE, or equivalent, and Nate, Ball4 and Willard should thus all stop commenting for 60 days…
So DREMT cant point out where or how he refuted anything.
Its just pure BS.
Given how hard he tried to evade this subject, that suggests that he KNOWS his GPE ‘solution’ is indefensible.
What do you guys think?
Nate should not be commenting, but due to a lack of integrity, carries on anyway.
“Nate just keeps repeating his refuted argument, that he has made a dozen times before in previous discussions, apparently believing something new has happened. Strange.”
Something new has happened. You spent over a week emphasizing the importance of applying tbe RHTE to this problem.
And doing so, you find that it shows, unequivocably, that the net energy transfer (Q) from the BP to the GP must be 0, in your 244K/244K solution.
Zero. There is no handwaving, nor excuses that can refute this fact.
Then we find another agreed upon unrefutable fact, that the GP, by the SB law, must emit 200 W/m2 to space.
Then we have the mathematical reality that 0 does not equal 200.
That leaves no logical way out of concluding that the GP must be losing internal energy, IOW COOLING.
You can howl into the wind all you want that this is no problem, and you have refuted it.
But then we see that when ask to point out specifically where and how you refuted it, you demur, you squirm, you tell us ‘look over there, at that squirrel’.
It is glaringly apparent, for all to see, that you have not refuted anything.
Because you cannot.
And we can blame Joe Postma if you prefer, for effectively misleading people with his bizarre erroneous thinking.
Example:
”
“The source supplies 400 W/m^2 to the blue plate. Given the geometry and view factors involved, the blue plate splits the 400 W/m^2 to emission on either side of itself, hence warms to a temperature to emit 200 W/m^2 on either side, thus conserving energy for said geometry.”
He correctly applies the RHTE equation and 1LOT to the BP, at first, to accurately find that its T when energy in =energy out.
But in the next step, with the GP present, he applies the RHTE to find that the BP can NO LONGER lose 200 W/m2 on the side facing the GP. It us only losing 200 W/m2 on one side!
But now, inexplicably, he fails to recognize that the BP nno longer has energy in = energy out!
400 in and 200 out. It should warm! But no, he decides to depart from obeying the laws of physics and common sense, right there.
And of course, same mistake for the GP.
This makes absolutely no sense. Thus he fails to find the correct answer.
No, Nate. Nothing new has happened. You think there is a 1LoT problem with the 244 K…244 K solution, and you have done for years. This is despite the fact that I’ve explained to you dozens of times, over the years, exactly how and why everything balances. You just can’t learn.
And, I’m not “squirming” or “howling” or doing anything. I’m trying to keep the discussion on-topic, but you refuse to concede that Eli did not use the RHTE, or equivalent. So you, yes YOU, are the one squirming and howling, and trying to change the subject.
Because, you know you shouldn’t be commenting, for 60 days.
“This is despite the fact that I’ve explained to you dozens of times, over the years, exactly how and why everything balances. You just can’t learn.”
So you claim. But when asked to produce that ‘explanation’ you have mothing to offer.
Its all just a great big lie.
If you say so, Nate.
Why are you still commenting? You should be taking 60 days off.
“No, Nate. Nothing new has happened. You think there is a 1LoT problem with the 244 K…244 K solution, and you have done for years.”
I dont need to think that. Its an obvious mathematical fact. Ive proven that here on this thread. And have done so several times.
“This is despite the fact that I’ve explained to you dozens of times, over the years, exactly how and why everything balances.”
Well, then it ought to be be very easy for you to show us that ‘explanation’.
But no. You will evade showing it. Because you know it stinks.
You have tried various tactics, such as ‘Clint has a theory, talk to him’.
JP tried ‘heat is bosonic, but money is fermionic’
You’ve tried ‘the GP emission is just returned by tbe BP’.
a. There is no physical mechanism for a blackbody to do that.
b. Then the NET BG energy transfer would be 200 W/m2, not in agreement with the RHTE.
Look, there is NO WAY to explain that 0 = 200.
Man up, and be honest. You have no sound explanation in your back pocket.
Yawn. Nate…are you going to stop commenting for 60 days, or not?
We’ve been over and over the GPE a hundred times. We’ll never agree on it. So what? Why bother!?
Nate’s on autopilot, just hammering away at his fixed points. So, this is just for anyone curious. Here’s how we know that there’s a 2LoT violation in Eli’s solution:
1) With the energy from the GP to the BP returned to the GP, all agree temperatures would be 244 K…244 K.
2) With the energy from the GP to the BP not returned to the GP, all agree temperatures would be 262 K…220 K.
3) All other energy flows in 1) or 2) above are identical. It’s just the returned energy from BP to GP that makes all the difference.
4) The above means that it’s the “back-radiation” transfer from GP to BP that is solely responsible for the difference in solutions. If that transfer is returned to the GP, then it’s 244 K…244 K. If it’s not returned, then it’s 262 K…220 K.
5) If a single vector of IR radiation is thus responsible for increasing the temperature of the BP, and decreasing the temperature of the GP, then that vector of IR radiation is being treated as though it were a transfer of heat!
6) Such a transfer of heat, from cold to hot, violates 2LoT.
7) The 262 K…220 K solution, is thus impossible. As much as it distresses Nate, and others, that means the energy from GP to BP must be returned to the GP. Whereupon 1LoT is conserved, and everything balances at 244 K…244 K.
QED.
5;53 pm: 5) obviously treats EMR as heat but EMR is NOT heat. So 5) is wrong
6) also treats EMR as heat so is also wrong
6) should be 2LOT demands a T increase for all real processes absorbing radiated energy so Eli’s solution meets that demand whereas DREMT’s solution does not thus there is no hope for DREMT to be correct. A plate in the sun and nearby plate in the shade are only transiently the same temperature.
DREMT’s solution meets 1LOT criteria transiently, the 2LOT shows Eli’s solution is steady state equilibrium.
EMR is indeed not heat, which is why a single vector of IR radiation cannot be responsible for the BP warming and GP cooling, yet that is precisely what Eli’s solution entails. Thank you for your agreement that Eli’s solution is debunked.
An object provides cooling “shade” by not being a perfect conductor. Eli’s plates are perfect conductors.
Nobody else on the blog has ever argued that the 244 K…244 K solution violates 2LoT. Ball4 is alone in his bizarre beliefs.
Ball4 should not be commenting for 60 days.
“1) With the energy from the GP to the BP returned to the GP, all agree temperatures would be 244 K…244 K.”
All agree ? Hardly.
As noted above, but natirally ignored.
If you want energy emitted by GP toward BP to be returned:
a. There is no known physical mechanism for the BP, a blackbody, to reject the flux from the GP.
This is pure fantasy.
b. If the energy emitted by tbe GP were returned to it, then the NET energy transfer from the BP to the GP would be 200 W/m2!
This absolutely CONTRADICTS what the RHTE finds, which is a NET energy transfer = 0.
Which you already agreed must be the case!
So you are fundamentally contradicting yourself. Both you and JP, when claim the GP emission is returned.
Sorry, the only way for there to be a net energy transfer from the BP to the GP is for there to be a significant T difference, according to the RHTE.
Or sre you now saying the RHTE must be scrapped?
Nate fails at the first step.
1) is a conditional statement, Nate, i.e. if the energy from GP to BP is returned to the GP, then the temperatures will be 244 K…244 K.
You don’t dispute 1)! It’s just part of the overall chain of logic.
Never mind, Nate. It’s over your head. In fact I never even intended it as a response to you, since I know it’s pointless talking to you.
DREMT 10:13 pm finally learns EMR is NOT heat, admits his 5), 6) are wrong, and his GPE solution is only transient while Eli’s GPE solution has reached steady state equilibrium.
Ball4 hands me the crown of eternal victory every time he says, “EMR is NOT heat”. Thx, Ball4.
Neither Ball4, nor Nate, should currently be commenting. Funny.
“1) is a conditional statement, Nate, i.e. if the energy from GP to BP is returned to the GP, then the temperatures will be 244 K…244 K.”
“You don’t dispute 1)! It’s just part of the overall chain of logic”
I just did dispute it. Because it makes absolutely no sense.
244K/244K gives net energy transfer of 0, according to everyone.
Not 200 W/m2, which is obtained if energy emitted by GP is returned to it.
What is the point of talking about impossible contradictory nonsense?
It’s a conditional statement, Nate. If I was saying, “the energy from GP to BP is returned from BP to GP” then you could dispute it. However, that’s not what I’m saying, in 1).
Sorry that you cannot understand basic logic. I’ve realised that it’s not just that you’re close-minded. You actually lack the intelligence to understand.
And, I’m sorry that you don’t have the integrity to stop commenting for 60 days, as you should.
DREMT 9:31 am admits EMR is NOT heat, so his 5),6) were wrong, and admits DREMT’s GPE solution is transient while Eli’s GPE solution is steady state equilibrium, nice concessions.
Ball4, once again, hands me that crown of eternal victory. Thx, it’s a pleasure to wear it…and, all so effortless!
To pre-empt Nate’s response, I’m sure he will just repeat the same things he’s said already, so there’s nothing to respond to there.
It’s getting to the point where I might have to insist on only one response from me every 24 hours. And, nothing on Christmas Day, of course.
“1) With the energy from the GP to the BP returned to the GP, all agree temperatures would be 244 K…244 K.”
Conditional or not, there is no truth in that statement.
For the reasons I stated.
You just dont listen.
No, NO, NO, You cannot avoid a 2LOT violation by violating 1LOT!
No one in the right mind can believe this ill-logic.
I can see that you are quite bothered by having people push back against your defense of the JP ‘solution’.
But no one is forcing you to keep defending what is obviously indefensible.
To stop is simple. Then never ever bring it up or promte it or defend it, or brag that you won that argument, again.
So if I say to Nate, “if the energy from GP to BP is returned to the GP, then the temperatures would be 244 K…244 K” he thinks I’m saying, “the energy from GP to BP is returned to the GP, and so the temperatures are 244 K…244 K”!
He can’t tell the difference. He’s gone blind to basic logic!
Nate, this is the most ridiculous you’ve ever been. And, you’ve been pretty ridiculous before.
I will continue to link to the points 1) – 7) for the rest of my life. Because it’s “absolute rational clarity and irrefutable logic”.
2:59 pm: … that has already been thoroughly refuted.
Refuted by what? Your semantic nonsense or Nate’s failure to understand basic logic!?
You’re just a boring, relentless troll, Ball4.
“So if I say to Nate, “if the energy from GP to BP is returned to the GP, then the temperatures would be 244 K…244 K” he thinks I’m saying, “the energy from GP to BP is returned to the GP, and so the temperatures are 244 K…244 K”!”
Not at all. You keep missing the point.
Im saying “If the energy from gp to bp is returned to the gp, then the temperatures would not be 244k/ 244 k, according to the RHTE”
And all do not agree.
And why have an impossible premise at all? Pointless.
“If the energy from gp to bp is returned to the gp, then the temperatures would not be 244k/ 244 k, according to the RHTE”
Wrong. If the energy from the GP to the BP is returned to the GP, then it’s effectively like the energy never left the GP in that direction. The temperatures in that case would be 244 K…244 K. You seem to be suffering from some sort of complete breakdown in understanding of this problem.
1) and 2) are not up for debate, Nate. Move on.
DREMT is refuted by noncompliance with 2LOT as already explained.
Looks like Graham has built himself a toll bridge.
Astute readers can ignore it, and him.
They can instead follow Eli’s simple demonstration:
https://rabett.blogspot.com/2018/08/the-simplest-green-plate-effect.html
At the advice of one of Eli’s bunnies, I installed LED lights on my aquarium, and installed reflectors around them. I can touch the LEDs, but they’re clearly warmer than without reflectors.
Perhaps Sky Dragon cranks can tell us why.
Ball4 confuses “asserted” with “explained”, and Willard discovers “radiative insulation”.
Nothing new.
“If the energy from gp to bp is returned to the gp, then the temperatures would not be 244k/ 244 k, according to the RHTE’
“Wrong. If the energy from the GP to the BP is returned to the GP, then it’s effectively like the energy never left the GP in that direction. The temperatures in that case would be 244 K…244 K. You seem to be suffering from some sort of complete breakdown in understanding of this problem.”
Handwaving assertion lacking anything to back it up. Magical thinking.
If the energy from the GP is returned to it. AND the energy emitted by the BP is still transferred to the GP, then that is a net transfer, Q, of 200 W/m2.
If you had bothered to check with your now favorite equation, the RHTE, you would find 244k/244k is inconsistent with a NET energy transfer of 200 W/m2.
Here is you quoting JP:
”
The green plate stops rising in temperature when Q = 0, i.e. when the heat flow to it goes to zero which is thermal equilibrium. Therefore when Q = 0 the green plate has a constant temperature of
0 = Tb^4 – Tg^4
Tb = Tg”
You guys are using the premise that Q = Net energy transfer =0 between the plates, and that results in Tb =Tg, as we all would agree.
None of us should then turn around and claim, Q = 200 W/m2 and THAT means Tb = Tg!
That is a fundamental contradiction.
“Handwaving assertion lacking anything to back it up. Magical thinking.“
No, just basic, previously agreed knowledge about the GPE. You can refer back to the diagram with the colour-coded arrows, if you like.
I know you disagree that the energy from the GP to the BP can be returned, but that’s irrelevant to 1), since it’s only a conditional statement.
If you think 1) is wrong, then you ought to think 2) is wrong, too. But, you don’t think 2) is wrong, so 1) is also fine. You’re just desperate.
”
No, just basic, previously agreed knowledge”
Not by me.
Your present day contradictions are laid bare for all to see.
And we can all see that you are simply ignoring them.
I ignore it because it doesn’t challenge 1).
It’s just a distraction.
To accept 1, you must shamelessly reject the RHTE.
Why are you ok with that?
More distraction.
The points 1) – 7) debunk the GPE. With no “back-radiation” warming/insulation, there’s no version of the GHE that works.
Now, when are you going to stop commenting for 60 days?
Assertions are not arguments.
And you admitted that you are ignoring all your contradictions.
Repeating debunked assertions just lower your credibility further.
Go relax and have a Merry Christmas.
“Assertions are not arguments.”
The points 1) – 7) are an argument.
“And you admitted that you are ignoring all your contradictions.”
I said I was ignoring “it” – your distraction – because it doesn’t challenge 1.
“Repeating debunked assertions just lower your credibility further.”
You certainly haven’t debunked the points 1) – 7).
“Go relax and have a Merry Christmas”
I did, thanks. You were the only person commenting on Christmas Day, I see. Merry Christmas, Nate, and a Happy New Year. Maybe your New Year’s resolution can be to take 60 days off from commenting?
““Repeating debunked assertions just lower your credibility further.”
You certainly haven’t debunked the points 1) – 7).”
Well, I have pointed out that your solution violates 1LOT for both plates.
Your only ‘answer’ for this is to contradict the RHTE, by having TB =TG while transferring 200 W/m2 of NET energy, Q.
The RHTE is absolutely clear that the NET energy transfer for equal temperatures is 0.
You suggest this happens by a magical (unphysical) rejection of EM radiation by a blackbody.
These contradictios prove beyond doubt that your item 1 is impossible.
You have no answers.
To claim these problems are only a distraction that can be ignored, is thoroughly dishonest!
No, it’s completely honest, and correct. The issues you raise do not actually challenge 1). They’re just a distraction.
Once again, I need to point out that assertions are not arguments.
It is pure assertion that the facts I laid out just above are ‘just a distraction’.
They demonstrate that your #1 is impossible.
And you make no actual counter argument, other than to declare this ‘a distraction’
This is you stuck in a mode of pure denial, or pure delusion.
Which is it?
I already told you. If I was saying, in 1), that the energy from GP to BP is returned to the GP, and thus the temperatures are 244 K…244 K, then I would need to counter your argument. But, I’m not saying that. 1) is a conditional statement. You don’t seem to grasp basic logic.
And I already explained, several times, but you ignored iseveral times, that “and thus the temperatures are 244 K..244 K” does not follow from your premise.
https://www.drroyspencer.com/2025/12/uah-v6-1-global-temperature-update-for-november-2025-0-43-deg-c/#comment-1726361
Because “if the energy from the GP is returned to it. AND the energy emitted by the BP is still transferred to the GP, then that is a net transfer, Q, of 200 W/m2.
If you had bothered to check with your now favorite equation, the RHTE, you would find 244k/244k is inconsistent with a NET energy transfer of 200 W/m2.”
Hopefully you will read and pay attention this time, and acknowledge that this is a serious problem for your #1.
Nate has a reading comprehension failure. Try again.
Look, astute readers can see that you have no answers. No rebuttal.
They can see that you’ve stopped trying to square your beliefs with the available facts and logic.
Because it isnt possible.
Astute readers can see that you’re not able to read, or understand basic logic.
I’m tired of repeating myself.
All you are repeating is assertions that it doesnt matter that 200 does not equal 0.
Proving that you are bonkers.
You’re being completely ridiculous. All 1) and 2) are saying is as follows:
1) If the energy from GP to BP is returned to the GP, then the plate temperatures are 244 K…244 K.
2) If the energy from GP to BP is not returned to the GP, then the plate temperatures are 262 K…220 K.
It makes absolutely no sense to try to dispute 1) unless you are also disputing 2)! Clearly, whether or not the energy from GP to BP is returned to the GP must make a difference to the plate temperatures! If 1) is not 244 K…244 K, then what the hell else could it possibly be!? Remember the diagram with the colour-coded arrows.
Your “is 200 W/m^2 equal to 0 W/m^2” simply doesn’t enter into the logic on this, I’m afraid. You’re completely missing the (very simple) point. You have two conditional statements that are inter-related, and one can’t be correct without the other also being correct.
“1) If the energy from GP to BP is returned to the GP, then the plate temperatures are 244 K…244 K.”
No logic that you have offered to show that is true. Whereas I have shown you multiple times that this contradicts what the RHTE finds.
“2) If the energy from GP to BP is not returned to the GP, then the plate temperatures are 262 K…220 K.”
It makes absolutely no sense to try to dispute 1) unless you are also disputing 2)!:
Not at all. You are creating a false dichotomy here. The truth pf #2 has no connection to #1, which is a contrived unphysical abomination.
“Clearly, whether or not the energy from GP to BP is returned to the GP must make a difference to the plate temperatures! If 1) is not 244 K…244 K, then what the hell else could it possibly be!? Remember the diagram with the colour-coded arrows.”
This illustrates that you are simply guessing, not deriving the temperatures.
Your #1 is unphysical, it fails to agree with the laws of physics (RHTE, blackbody properties), so what is the point of trying to analyze it?
OK, so logic is not Nate’s strong suit.
But, he accepts 2), therefore he accepts 1).
Whether he understands why, or not, I don’t care.
“OK, so logic is not Nate’s strong suit.”
Predictable response when I point out that you offered no actual logic to support the claims you made.
Your ‘logic’ is
1. Lets also have blackbody act like a mirror. Then Lets have a heat transfer with no temperature difference in violation of the RHTE.
2. Lets have heat transfer with a temperature difference in agreement with the RHTE. Lets have blackbodies abs.orb all radiation they recieve.
Then you weirdly declare that if I accept (2) which agrees with the known laws of physics, then I need to accept (1) which doesnt!
Pfffft!
Now we can expect you to triple down on these not at all logical assertions.
You really don’t understand basic logic.
You seem to think 1) and 2) are as follows:
1) The energy from GP to BP is returned to the GP, so the temperatures are 244 K…244 K.
2) The energy from GP to BP is not returned to the GP, so the temperatures are 262 K…220 K.
But, that is not what 1) and 2) are.
Nothing I can say will ever get through to you. Think what you want, you’re just a complete waste of time.
“You seem to think 1) and 2) are as follows:
1) The energy from GP to BP is returned to the GP, so the temperatures are 244 K…244 K.”
No matter how many times I correct you on this, you just keep pretending I never have.
Here:
https://www.drroyspencer.com/2025/12/uah-v6-1-global-temperature-update-for-november-2025-0-43-deg-c/#comment-1726456
And here:
https://www.drroyspencer.com/2025/12/uah-v6-1-global-temperature-update-for-november-2025-0-43-deg-c/#comment-1726361
And notice, each time you have no rebuttal.
Are you drunk, stoned, sleepy?
If not, then what is your excuse?
You’ve just departed completely from reality.
Can you really not read!?
I said that is not what 1) is.
Take some time off and actually try to read, carefully, what I’m saying.
Gaslighting and playing very very dum to evade reality.
It appears that you will continue to believe in things totally inconsistent with facts and logic.
So embrace your Flat Earther thinking.
But know that it will not sell here on a science blog.
I’m not gaslighting, Nate.
You have made a couple of arguments against the following:
1) The energy from GP to BP is returned to the GP, thus the plate temperatures are 244 K…244 K.
However, that is not my version of 1). My version of 1) is:
1) If the energy from GP to BP is returned to the GP, then the plate temperatures are 244 K…244 K.
You don’t seem to understand that your arguments only counter your version of 1). They do not counter my version of 1). So, it’s not that I can’t or won’t refute your arguments. It’s that I don’t need to refute your arguments, because they don’t challenge my version of 1). They’re just a distraction.
“You have made a couple of arguments against the following:
1) The energy from GP to BP is returned to the GP, thus the plate temperatures are 244 K…244 K.
However, that is not my version of 1). ”
You have falsely accused me of that several times already.
It could not have been more clear that I argued that 244K/244K does not follow from your premise ‘if energy from gp to bp is returned to the GP’.
AND I have also argued that the premise is impossible.
How did you not get that?
Unless you can say what else the plate temperatures would be besides 244 K…244 K, if the energy from GP to BP was returned to the GP, then you don’t have any argument at all. Just saying, “oh, it wouldn’t be 244 K…244 K” is not convincing. What would it be, and why? You can’t answer because you’ve got nothing.
You are the one ‘just saying’ it would be 244K/244K, without any calculation or logic.
Which, as Ive noted for awhile now, is pure assertion, not an argument.
As I have pointed out, 244k/244k cannot satisfy the RHTE and your premise.
Look, its very simple, your solution cannot work.
You are done.
There you have it – Nate’s got nothing.
An eight year argument settled in my favour.
The reason the plate temperatures would be 244 K…244 K if the energy from GP to BP was returned to the GP is pretty straightforward:
Both plates would then be receiving 400 W/m^2 over half their surface area, and would thus be emitting 200 W/m^2 from their entire surface area. 200 W/m^2 corresponds to a temperature of 244 K given that the plates are blackbodies.
See how easy that was to explain? Now, if Nate wants to say the plate temperatures would not be 244 K…244 K if the energy from GP to BP was returned to the GP, then he has to say what the temperatures would be, and why.
By settled in DREMT’s favor means DREMT’S solution is just a transient solution depending on initial temperature of the GP whereas Eli’s original solution is the steady state system equilibrium temperature.
Your standard acid trip summary.
“What would it be, and why?”
For the umpteenth time, your premise would give Q =200 W/m2.
We know 244K/0K produces that.
But as noted, it is toally pointless to try to find a ‘solution’ for a premise that violates the laws of physics.
Nate, dodging the question means you concede the issue. Thanks.
Guess you didnt want that answer…
Let’s summarize your case:
‘If I throw out two laws of physics, then I can get any answer I want, except yours is definitely wrong’
Brilliant reasoning!
So your answer is seriously that the GP is at 0 K!? Despite receiving 400 W/m^2!?
You are the one violating laws of physics, with that answer.
Garbage in garbage out.
In case this is unclear, your premise is the garbage in.
It throws out Kirchoffs Law, which requires that a blackbody to abs.orb all radiation that hits it.
By getting rid of that, it causes the net transfer of Q = 200 W/m2.
As noted, one pair of Temps that satisfies the RHTE that produces Q = 200 W/m2, is 244K/0K.
GIGO.
Now you.
Tell us how your solution produces 200 W/m2 and also satisfies the RHTE.
1) is a conditional statement. The condition is that the energy from GP to BP is returned to the GP. Under that condition, the plate temperatures can only be 244 K…244 K. The GP cannot be 0 K.
5:34 pm: The GP could be introduced at 3K. The energy from the GP to BP is returned to the GP. The temperatures are not 244K…244K so they can be other temperatures as well. See Eli’s solution for the steady state system equilibrium temperatures.
There is no question that my point 1) is correct.
If you want to challenge the points 1) – 7), which debunk the GPE, you’ll need to try something else.
DREMT’s point 1) is correct only transiently. See Eli’s solution for the steady state system equilibrium temperature solution.
“The reason the plate temperatures would be 244 K…244 K if the energy from GP to BP was returned to the GP is pretty straightforward:
Both plates would then be receiving 400 W/m^2 over half their surface area, and would thus be emitting 200 W/m^2 from their entire surface area. 200 W/m^2 corresponds to a temperature of 244 K given that the plates are blackbodies.”
Well, your idea of having the emission of the GP returned to it was intended to satisfy 1LOT. And it does.
But in doing so you violate 2 laws of physics.
1. Kirchiff’s law by having a blackbody (BP) act like a mirror to reflect the GP emissions.
2. The RHTE, by having a NET transfer of 200 W/m2 between BP and GP whilst having 0 temperature difference.
This heat transfer without a temperature difference is pure fantasy!
Rejection of the RHTE is particularly egregious, given your claim that Eli’s solutiom was “a joke because he didnt use it”.
Your solution is much more of a joke by not even satisfying
it
Your ‘solution’ satisfies 1 law (1LOT) while ditching two other laws. Sorry, you dont get to pick and choose which laws of physics can be sacrificed.
In contrast, the Eli solution satisfies Kirchhoffs law by having the emissions of the GP abs.orbed by the BP.
It satisfies the RHTE by having a heat transfer of 133 W/m2 from BP to GP with 262K/220K. Which most certainly satisfies 2LOT!
It satisfies 1LOT by having 133 W/m2 input and output from GP, and 400 W/m2 input and 267+133 = 400 W/m2 output.
Nate, you still don’t get it.
1) is not my entire argument. It’s just one conditional statement. The condition is that the energy from the GP to the BP is returned to the GP. Given that condition, the plate temperatures will be 244 K…244 K. That’s all 1) is saying. If you then follow through the rest of the numbers you’ll learn why Eli’s solution violates 2LoT. That then means the energy from the GP to the BP must be returned to the GP, to avoid the 2LoT violation.
Bringing up what you bring up does not challenge 1), nor can it fix the 2LoT violation. I don’t need to rebut it, but you keep repeating it anyway!
You either can’t follow basic logic or something in your head is refusing to let you. I don’t know which it is but you’re really not progressing…although at least I guess you now realise my solution doesn’t violate 1LoT. So, that’s something.
DREMT 7:50 am is forced to just announce erroneously “Eli’s solution violates 2LOT” since DREMT has never been able to show any violation when there is none. Eli’s solution increases its universe entropy so remains in accord with Clausius eqn. 64 as required.
There is no hope for DREMT’s position.
The points 1) – 7) annihilate Eli’s solution eternally:
https://www.drroyspencer.com/2025/12/uah-v6-1-global-temperature-update-for-november-2025-0-43-deg-c/#comment-1726288
All Ball4 ever does is argue by assertion.
DREMT 5:25 pm reveals huge desperation calling Clausius’ eqn. 64 an “assertion”.
There continues to be no hope for DREMT’s GPE position. Refer to Eli’s original GPE for the correct solution.
Ball4 puts words in my mouth, as usual.
Don’t just assert that somehow Eli’s solution is in accord with this equation and mine isn’t – actually show it! Show your work! Write a comment longer than a couple of lines, and without your usual repeated phrases. Make an effort, for once.
DREMT 7:48 pm: No need to rewrite Eli’s GPE eqn.s as my own work – refer to them as I’ve commented. DREMT’s claim “Eli’s solution violates 2LOT” is made without any work being shown. Show DREMT’s work! I’ve already pointed to Clausius’ eqn. 64 for DREMT’s use. Get to work!
Ball4 cannot support his assertions. No surprises there.
Clausius’eqn. 64 and Eli’s eqn.s are not assertions DREMT, let’s see your work proving Eli’s GPE doesn’t comply with eqn. 64. It won’t be possible to do so & DREMT will continue to just announce stuff because that’s all he has.
Nobody is impressed by you reversing the burden of proof, Ball4.
DREMT preferring to comment with assertions rather than eqn.s from Eli and Clausius keeps DREMT’s credibility on a science blog at zero. I’ll continue to comment with results from their published eqn.s.
So you are saying if you allow yourself to treat the laws of physics as an a la carte menu, then you can get your ‘solution’.
Which allows heat to flow without a temperature difference.
But unfortunately for cost of HVAC, the world doesnt operate that way.
Oh well.
And no, as I made clear, having heat flow from the warmer BP to a colder GP, in Eli’s solution, satisfies 2LOT just fine.
Ball4, you made a claim that Eli’s solution accords with an equation from Clausius, and mine doesn’t. It’s on you to provide support for that claim. As it stands, you haven’t done so, and so the claim will be ignored by any astute readers.
You’re also claiming that I’m the one arguing by assertion, yet actually I made a seven-point logical argument which nobody has been able to refute.
That means I win the overall argument. Sorry, Nate.
DREMT 11:52 am, Clausius eqn. 64 refutes your points 5),6) as I already explained. Your arguments were assertions without backing 1LOT, 2LOT eqn.s like Eli and Clausius use. DREMT has zero credibility using assertions without ref. to those basic eqn.s.
The points 1) – 7) are a reasoned argument so no, none of it is “assertion”. You didn’t explain how any of it is refuted. You never explain anything, you just assert it and then provide no support when requested.
DREMT’S 2:36 pm reasoning in 5),6) is faulty as I’ve already explained. DREMT’s reasoning isn’t 2LOT compliant as Clausius points out in his eqn. 64. DREMT has no referenced eqn.s so is pure assertion easily defeated by Clausius’ 2LOT work.
There is no hope for DREMT’s asserted logic when it fails 2LOT in equation form.
You haven’t explained a thing, Ball4.
You just keep on with your assertions.
Now DREMT misses that Clausius’ 2lOT eqn. 64 and Eli’s work with 1LOT eqn.s are not assertions.
No hope for DREMT’s credibility rising above zero.
I’m not saying those equations are assertions. I’m saying you’re simply asserting that Eli’s solution accords to this Clausius equation and mine doesn’t. You’ve done absolutely nothing to provide any support or evidence that your assertion is correct. I’m certainly not just going to believe you, because you’re the most dishonest person I’ve ever encountered on the internet.
Maybe you will convince some people!? I’m not sure. I’ve never seen a single person on here besides you suggest that my solution violates 2LoT. It’s just you, out on a limb. So, you don’t appear to be winning anyone over.
Meanwhile, the points 1) – 7) remain undefeated.
Seems like an easy victory for me. All you are going to do now is keep repeating yourself. You certainly won’t show any maths connecting Eli’s equations to this Clausius equation, and you won’t even provide any sort of written explanation. You’ll just continue to assert that somehow Eli’s solution accords to the Clausius equation and mine doesn’t. Keep on asserting, that’s not going to convince me, and I doubt anyone else, that you’re right.
DREMT continues assertion after assertion. Won’t work, never will. Applying Clausius’ 2LOT eqn. 64 speaks too loudly to overcome by DREMT simply asserting stuff.
DREMT’s credibility remains at zero.
Ball4 proves me right.
“Meanwhile, the points 1) – 7) remain undefeated.”
In your mind only, because you ignore the fatal flaws in your logic.
As you may recall:
Google/AI what is heat?
“Heat is defined as the form of energy that is transferred between bodies or systems as a result of a temperature difference. In physics, an object does not ‘contain’ heat; the correct term for the energy stored within a substance is internal energy or thermal energy”
Recall what you agreed to earlier this month.
“sure. The net exchange of radiative energy (EMR), determines heat flow.”
But now you shamelessly propose in Your #1 that heat flow of 200 W/m2 with no temperature difference, not something that occurs in this universe.
Nor does it agree with the RHTE.
Now continue telling us about your alternate universe.
That’s not a challenge to 1), Nate, so no need to rebut what you keep repeating.
Can’t learn, can you?
#1 violates 2 laws of physics, so it ie a false premise.
As to the rest of your 7 points:
“2) With the energy from the GP to the BP not returned to the GP, all agree temperatures would be 262 K…220 K.”
All agree? Good. So what you are clearly saying here is that if we dont violate the laws of physics with 1, then even you agree that Elis solution results.
It seems to me that is the end of tbe argument right there!
But for fun, lets look at the rest:
“3) All other energy flows in 1) or 2) above are identical. It’s just the returned energy from BP to GP that makes all the difference.
4) The above means that it’s the “back-radiation” transfer from GP to BP that is solely responsible for the difference in solutions. If that transfer is returned to the GP, then it’s 244 K…244 K. If it’s not returned, then it’s 262 K…220 K.”
Not quite. If the RHTE is valid, as you and JP and all others agree, then the so-called back radiation being abs.orbed by the BP is simply an unavoidable consequence.
Thus, it is the RHTE. a valid law of physics, that is responsible.
“5) If a single vector of IR radiation is thus responsible for increasing the temperature of the BP, and decreasing the temperature of the GP, then that vector of IR radiation is being treated as though it were a transfer of heat!”
This was your old spin, and no one elses. On Decemer 8, you agreed that “The net exchange of radiative energy (EMR), determines heat flow. back radiation is not heat!”
So this:
“6) Such a transfer of heat, from cold to hot, violates 2LoT.”
and this:
) The 262 K…220 K solution, is thus impossible.”
no longer makes logical sense. (it never did).
“As much as it distresses Nate, and others, that means the energy from GP to BP must be returned to the GP. Whereupon 1LoT is conserved, and everything balances at 244 K…244 K.”
Nope, only if you ditch the RHTE, which neither you or JP voted to do.
Now we can expect you to ignore these fatal flaws, and justshamelessly declare 1-7 valid again.
Thats what you do.
Nate…1) and 2) are both simple, conditional statements. They’re irrefutable, unless you could find an alternative for the plate temperatures in each case, and a valid reason for them. You’ve failed to do so thus far, so we have to accept that 1) and 2) are correct as written.
3) and 4) show that with all energy flows considered, the difference between 244 K…244 K and 262 K…220 K comes down to only one energy transfer. The “back-radiation” transfer from GP to BP. If one energy transfer is responsible for an increase in temperature of the BP and a decrease in temperature of the GP, then that energy transfer is being treated as though it were a transfer of heat. As 5) and 6) point out, such a heat transfer, from cold to hot, violates 2LoT.
7) just shows that to avoid the 2LoT violation, it’s necessary for the energy from GP to BP to be returned to the GP, which will also satisfy 1LoT.
I’m afraid just chanting, “RHTE, RHTE” won’t change the above. Especially since Eli never even used the RHTE, or equivalent. Yeah, you should be taking 60 days off commenting for that, by the way.
Looks like Graham has made more than 200 comments this month.
In fact, he made more than 20% of the comments.
Ignoring them saves lots of time, more so now that he must be stuck on repeating his toll bridge over and over again.
People stop responding to me = it stops.
People keep responding to me = it continues.
Everyone who engages with me knows they’re entering into a conversation where they won’t be getting the last word. It can stop whenever they want it to. I’m simply sticking to my long-running experiment of never backing down from any discussion. All I do is respond when people respond to me, or mention me. It’s painfully simple, yet people keep complaining as if I’m taking up too much blog space. Don’t want me to take up blog space? Then don’t respond to my comments.
“I’m simply sticking to my long-running experiment of never backing down from any discussion”
Yep.
And clearly facts, logic and the laws of physics are shamelesdly ditched in order to ‘never back down’.
That aint honest debate.
Nate, I’ve been completely honest, as always.
Your arguments miss the mark. You seem unable to think clearly on this issue. You just keep repeating things that don’t debunk the points 1) – 7). You spent considerable time disputing point 1) even though it’s just a simple conditional statement for which you have no alternative. Only recently did you even attempt a rebuttal of the entire argument and I’m afraid all you could manage was a garbled mess.
So you wait for me to respond to yet another stalker so you can pounce on one sentence and attack my character through false accusations!? And you call me “shameless”!
Graham D. Warner seems to have replied.
Better ignore him.
Yes, if you would actually start ignoring me, that would be great, Willard.
But, you and I both know I live rent free in your head, so there is no chance of you ever being able to ignore me.
Another comment by Graham.
He must be gaslighting again.
Astute readers should ignore it.
Willard immediately proves me right.
You’ve made it clear what your priority is. It is to keep arguing, right or wrong, logical or illogical. Just keep the argument going.
You’ve demonstrated that here, for example, by making totally contradictory claims.
Here are a few of the highlights from a gallery of your contradictions:
“If a single vector of IR radiation is thus responsible for increasing the temperature of the BP, and decreasing the temperature of the GP, then that vector of IR radiation is being treated as though it were a transfer of heat!”
But earlier you stated:
“The net exchange of radiative energy (EMR), determines heat flow. back radiation is not heat!”
So, is back radiation heat or is it not heat? Cuz both cannot be true!
According to the standard definition of heat, it is NOT HEAT.
Then sorry there is NO 2LOT VIOLATION.
Then we have ‘To use the RHTE or NOT to use the RHTE.
You spent a week quite irate that Eli did not use the RHTE, “even though he was trying to solve a problem involving radiative heat transfer. That’s why his solution is such a joke.”
Also you correctly stated it:
“To clarify, this is the RHTE:
Q = Fe Fa A σ (T1^4 – T2^4)”
Notice when T1 =T2 the RHTE give Q =0!
But more recently:
““The reason the plate temperatures would be 244 K…244 K if the energy from GP to BP was returned to the GP is pretty straightforward”
Notice that you are insist the temperatures of the two objects are EQUAL, and yet you inist that the 200 W/m^2 emitted by the GP is returned to it, making the NET TRANSFER Q = 200 W/m2 between the objects!
Sorry this is a profound contradiction.
Your solution plainly DOES NOT SATISFY THE CRITICALLY IMPORTANT (according to you) RHTE.
That is why YOUR solution is a joke.
“You’ve made it clear what your priority is. It is to keep arguing, right or wrong, logical or illogical. Just keep the argument going.”
That’s not at all what I said, Nate. I have absolutely no interest in keeping arguments going, I just respond to those that do. I won’t back down when I know I’m correct.
There is no contradiction re “back-radiation”. “Back-radiation” is not “heat”, which is why that single vector of radiation cannot cause the BP to warm and the GP to cool. Yet that is what Eli’s solution has it doing.
“You spent a week quite irate that Eli did not use the RHTE”
Absolutely not. I wasn’t irate at all that Eli did not use the RHTE. I did get slightly irate about being constantly personally attacked by multiple commenters for being correct about the fact that he didn’t use it, however. It’s nice to finally hear you admit that he didn’t use it. Perhaps now you will stop commenting for 60 days, as you should.
Nothing you say challenges the points 1) – 7), which remain correct.
“I wont back down when I know Im correct”
Hmmm. You have low competence in the subject of heat transfer physics, as established here many times by those who are competent in it, yet you say ‘I know Im correct’.
Thus you greatly overrate your competence in this subject.
Then you must have one of the worst cases of Dunning-Kruger syndrome ever.
No you cannot manufacture a 2LOT violation without HEAT flow from cold to hot. That is pure fantasy.
Notice that you completely ignored the RHTE contradiction pointed out above.
Both you and JP stressed the importance of the RHTE being applied here, and its result that Q = 0 is was fully expected for the 2 plates.
But then you turn around and ditch the RHTE, to claim Q = 200 W/m2 with equal temperatures.
Your ‘solution’ fails to satisfy the RHTE.
Yet you ignore this failure, and keep asserting that this ‘solution’ is correct.
This is not you ‘not backing down’, against opponents, it is you ‘not backing down’ against contradictory facts and logic.
“Hmmm. You have low competence in the subject of heat transfer physics, as established here many times by those who are competent in it”
Huh? The only person here who regularly suggests that is you.
“No you cannot manufacture a 2LOT violation without HEAT flow from cold to hot. That is pure fantasy.”
Huh? The “back-radiation” transfer in Eli’s solution is being treated like heat flow from cold to hot.
“Notice that you completely ignored the RHTE contradiction pointed out above.”
Of course! I’ve told you already, your point about the RHTE doesn’t challenge the points 1) – 7), so I have no need to address it.
“Huh? The “back-radiation” transfer in Eli’s solution is being treated like heat flow from cold to hot.”
Only by you, and only for the purpose of creating a faux 2LOT violation.
Then out of the otherside of your mouth you say ‘back radiation is not heat’
If it is not heat then why the f*k are you trying to use it as heat?
Perfecr example of you having no competence in Thermodynamics, and just making a fool of yourself..
Then still no honesty about your failure to satisfy the RHTE.
Then a total lie that it makes no difference!
Explain why YOU are exempt from a key law of physics!
Nate completely loses his shit, as he does so often.
The “back-radiation” transfer is being treated like a transfer of heat because it is solely responsible for the BP warming and the GP cooling in Eli’s solution. I don’t know how you get yourself so confused on this issue. “Back-radiation” is not heat, and so it should not result in the BP warming and the GP cooling.
You still are not being honest about the failure of your ‘solution,’ to satisfy the RHTE, and have no answer as to why YOU, but not Eli, are exempt from applying and satisfying it.
Until you do answer, your claims should be regarded as BS.
The fact is that the RHTE for blackbodies RELIES on the fact that emissions from both bodies are abs.orbed.
There is no physical mechanism for the BP, a blackbody, to reflect radiation from the GP
That is why the net Q of bodies at the same temperatures must be 0, zero.
This not optional as you suggest.
And the consequence of Q=0 is that the GP must cool and the BP must warm.
No violation of any law required.
But apparently you cannot wrap your mind around these extremely simple facts.
I’m being completely honest when I say that I don’t need to rebut your point about the RHTE, because it doesn’t challenge the points 1) – 7).
Please feel free to keep wasting your own time.
DREMT is correct EMR from the GP to the BP is not heat but DREMT misses when that EMR is absorbed by the BP the EMR is transformed into thermodynamic internal energy of the BP which raises the BP total thermodynamic internal energy thus the BP avg. thermodynamic internal energy increases so the BP temperature increases.
DREMT has missed this basic physics since at least the GPE was first introduced. Eli got the correct GPE solution.
As noted but ignored, adherence to the RHTE requires that the GP emissions are abs.orbed by the BP.
Your 7 points argue that the consequence of simply applying the RHTE, results in a 2LOT violation.
But we all agree (at least we used to) that the RHTE is valid. Therefore your 7 points logic must be flawed.
Yet, rather than trying to find the fatal flaws. which must be there, you choose a ‘solution’ that does not satisfy the RHTE by having the BP act as a mirror, somehow.
So you seem content that your ‘solution’ to this simple radiant heat transfer problem, does not satisfy the radiant heat transfer equation.
Then you are content that your ‘solution’ is a joke.
And you are content to keep on defending this joke ‘solution’
You can say the points 1) – 7) “must be” flawed, Nate, but you can’t actually point to what those flaws are.
Ball4 comes along, openly admitting that in Eli’s solution, the internal energy from the GP is transferred to, and builds up in, the BP at the expense of the GP. That could only happen as the result of a transfer of heat.
Neither Ball4, nor Nate, should currently be commenting. Both should be taking 60 days off.
DREMT yet again mistakes EMR for heat; EMR is NOT heat. Eli’s GPE solution handled the EMR correctly.
EMR is not heat; thus internal energy from the GP cannot be transferred to, and build up in, the BP at the expense of the GP, yet that is what happens in Eli’s solution.
DREMT now explains how DREMT’S solution fails 2LOT and Kirchhoff while Eli’s solution is consistent with both.
Ball4 simply lies, as usual.
DREMT writes EMR is not heat then proceeds to comment as if treating EMR as heat. Eli’s original GPE solution handled EMR correctly. A plate in the sun and nearby shaded plate cannot be at same system steady state temperature as DREMT insists.
I’m not the one treating EMR as heat, since I don’t have the GP transferring its internal energy to the BP, where it builds up at the expense of the GP.
Objects provide “shade” by not being perfect conductors. Eli’s plates are perfect conductors.
You are still not making any sense, or facing up to your problem. Which is that you need to satisfy the RHTE, else your ‘solution’ is wrong, plain and simple.
Yet you continue to ignore this problem by diverting our attention to a non-problem.
There is no 2LOT violation unless heat flows from cold to hot.
There is no heat flowing from cold to hot at any time in Elis solution.
There is only EMR emitted from a cold object and being abs.orbed by a warmer object, as it MUST DO to satisfy tbe RHTE. And you agree this is not heat!
Who cares that someone somewhere wants to call it heat, but that doesnt make it heat. And we both know it is not heat.
And as a result of this one-way transfer of EMR, which must occur, the heat flow from the BP is reduced, never REVERSED
That reduction in heat loss coupled with the ongoing heat input from the sun, causes it to warm.
I think even you can follow the flow of heat during this process from the hot sun to the warm BP to the less warm GP and then to the cold of space, never flowing the wrong way to bother the 2LOT.
Now tell us again about your fantasy that someone, but not me or you, is treating the one way EMR as heat, and why we should care?
“EMR is not heat; thus internal energy from the GP cannot be transferred to, and build up in, the BP at the expense of the GP”
There is never never NEVER any transfer of internal energy from the GP to the BP. Its internal energy only transfers to space. There us transfer of the sun’s internal energy to the BP.
Again, the flow of heat is always from the BP and it simply reduces when the GP is put in place.
“At the expense of” is not equivalent to backwards heat transfer.
If I add insulation to a heated object, the object warms. Did the insulation need to add some of its internal energy to the heated object?
No that is obviously absurd.
The Colorado river flows from the Rocky Mtns downhill to the Pacific ocean. Its water always flows downhill. It can never flow uphill.
Along the way there are dams which cause lakes to form.
The Glen Canyon dam makes Lake Powell. Below that dam is Lake Meade whose water is held back by the famous Hoover Dam.
Now when Lake Powell gets to low, its dam shuts off its outflow to Lake Meade. And the river’s continous flow raises the water level of Lake Powell, while Lake Meade’s water level drops
Therefore we can say that Lake Powell raises its water volume ‘at the expense of’ Lake Meade.
Would you then claim that water must have flowed uphill from Lake Meade to Lake Powell?
I dont believe you would. Because ‘at the expense of’ does not mean that.
And it was not necessary since new water is constantly being supplied by the river.
But this is exactly the situation with the internal energy levels of the two plates.
In that case ‘at the expense of’ also does not mean heat flowed ‘uphill’ from the GP to the BP.
It was not necessary since new internal energy is constantly being supplied by the sun.
Let see if this helps.
The longer your posts get, the less you say, Nate.
I don’t need to rebut your point about the RHTE, because it does not challenge the points 1) – 7). Will this penetrate that skull of yours this time!?
“There is never never NEVER any transfer of internal energy from the GP to the BP.“
Of course there is, Nate. Follow the points 1) – 7). Try to understand that every other energy flow is accounted for. The only difference between the 244 K…244 K solution and the 262 K…220 K solution is that in the latter the “back-radiation” transfer does its thing. In the former 2LoT prevents it from doing its thing. So, that “back-radiation” transfer, in the 262 K…220 K solution, is absolutely transferring internal energy from GP to BP.
One last thing – I don’t need any help understanding your way of looking at it. Your way is easy to understand. My way is more difficult to understand. You need help to understand my way of looking at it. Not the other way around.
“I don’t need to rebut your point about the RHTE, because it does not challenge the points 1) – 7).”
Untruthful assertion.
You kep saying that #1 is a conditional, so it does not need to be possible.
However at the end of your points 1-7, you CONCLUDE that #1 is in fact what must happen.
But is sleight of hand. Because now it needs to be physically possible.
But it is clearly NOT possible since it plainly violates the RHTE a valid law of physics.
It is clearly not possible because it violates Kirchhoffs law, a valid law of physics..
It is clearly not possible because there is no available mechanism for a blackbody to reflect the radiation emitted by the GP.
Thus #1 is pure fantasy.
Therefore your 1-7 aint logical. Sorry.
Then there is the absurdly bad logic about 2LOT, with doubletalk about heat, in the middle, as noted above, that you have no answer for.
“I dont need any help understanding your way of looking at it. Your way is easy to understand”
It is easy to understand, because it is logical and agrees with common sense.
So it is baffling why you continue to keep arguing for something that is indeed “difficult to understand” because it is not logical nor agrees with common sense, nor the laws of physics.
Glad to hear that the dams and lakes example is understandable to you.
Then it is understandable to other readers, who will now understand why your ‘at the expense of’ statement does not mean what you claim, that internal energy flows uphill from the cold object to the warm object.
They will understand that to ignore the heat source as the source of internal energy increase of the BP, makes no logical sense.
It’s not possible to violate 2LoT, hence the energy from GP to BP must be returned to the GP.
A blackbody cannot be used as an excuse to violate the laws of physics.
The RHTE isn’t violated, anyway. Heat flow between the plates is zero, as it should be at equilibrium. However, that doesn’t mean that there can’t be EMR flowing between the plates.
Do you not ever get bored just saying the exact same thing over and over again?
Does it really matter that much if someone who you apparently have no respect for anyway disagrees with you about some thought experiment!? Was it really worth yet another 30 day back-and-forth!?
Will you now, finally, just stop commenting for 60 days, as you should!?
DREMT 6:29 again confused EMR with heat when EMR is not heat so DREMT uses 2LOT rule about heat incorrectly. DREMT doesn’t know Clausius’ wrote eqn. 64 to handle that problem causing DREMT to get the physics backward going against eqn. 64 so there is no hope DREMT is correct.
The BP must absorb EMR from GP to satisfy eqn. 64 and increase universe entropy in the process. Eli did not make the physics mistake made by DREMT.
Let’s be absolutely clear – the 262 K…220 K solution treats EMR as heat. Specifically, it treats the “back-radiation” transfer as though it were heat.
The 244 K…244 K solution does not treat EMR as heat.
No DREMT, there is no heat flow in the GPE as you have admitted. It’s all EMR exchange which means your application of 2LOT as if there were heat flow is wrong. You have to apply Clausius’ eqn. 64 since there is only EMR. Then you get the right physical answer per Clausius’ as Eli showed you long ago.
You’ve demonstrated absolutely nothing regarding this equation, and nobody on this blog but you thinks (or pretends) that the 244 K…244 K solution violates 2LoT.
In the 262 K…220 K solution, the “back-radiation” transfer is treated as a transfer of heat, since it involves the GP transferring internal energy to the BP, where it builds up at the expense of the GP. That violates 2LoT.
Keep responding to me until the discussion closes for comments if you like. You won’t get the last word, so I’m not sure why you’re bothering.
Other commenters agree with Eli’s solution thus agree DREMT is wrong. Just happens that DREMT is wrong due to violating eqn. 64 which is easily referenced except by DREMT.
Sure. Other commenters think I’m wrong. But, none of them think the 244 K…244 K solution violates 2LoT. You’re alone in your own little delusional world, unable to demonstrate that this equation proves what you claim it does. That doesn’t stop you asserting the same things over and over again, like a broken record. Keep wasting your time, it’s no problem for me to point out that you can’t support what you claim.
Meanwhile, my points 1) – 7) can be followed by anyone.
“The RHTE isn’t violated, anyway. Heat flow between the plates is zero, as it should be at equilibrium. However, that doesn’t mean that there can’t be EMR flowing between the plates.”
OMG. Off the rails we go…pure desperation.
Your solution returning the GP emissions by some magical mirror-blackbody results in a net transfer of 200 W/m2, which is the Q in the RHTE, which does not agree with the Q=0 given by the equation.
The RHTE is violated. And no you dont get to have it both ways.
“Do you not ever get bored just saying the exact same thing over and over again?”
Do you?
Does it really matter that much that heat transfer doesnt work the way you want it to?
Was it really worth yet another 30 day back-and-forth, to keep defending the wrong answer?
DREMT again admits not knowing Clausius’ work proves DREMT is wrong about the GPE even after I’ve given the exact reference. Refer to Eli’s solution that many other commenters point out is correct complying with both 1LOT and 2LOT.
No desperation here, Nate, just enjoying my win.
As I’ve said, many times, and you’ve failed to grasp, many times, your point about the RHTE doesn’t challenge the points 1) – 7). So, you can think what you want about it, and I can think what I want about it – it makes no difference. The 262 K…220 K solution is debunked all the same.
Why don’t you answer this question:
Do you agree with Ball4 that the 244 K…244 K solution violates 2LoT?
I expect you won’t answer.
Ball4 agrees with me that in the 262 K…220 K solution, internal energy from the GP is transferred to the BP, where it builds up at the expense of the GP. I remember him saying so in a previous discussion. For some reason he doesn’t get that’s a 2LoT violation, whereas Nate clearly does understand that’s a 2LoT violation since he vehemently denies that occurs. Of course, Nate will never argue with Ball4. That’s a foregone conclusion.
For some reason? DREMT 6:51 pm has already been given the reason: DREMT’S solution doesn’t comply with Clausius’ work in eqn. 64.
The internal energy from the GP is transferred to the BP via EMR which DREMT admits is not heat so internal energy of the BP builds up to steady state equilibrium per eqn 64 – no heat involved so no violation of 2LOT.
Once DREMT admitted EMR is MOT heat, DREMT lost the argument then knowing Eli correctly solved the GPE consisting only of EMR transferring internal energy between the objects.
There you have it, folks:
[NATE] There is never never NEVER any transfer of internal energy from the GP to the BP. Its internal energy only transfers to space. There [is] transfer of the sun’s internal energy to the BP.
[BALL4] The internal energy from the GP is transferred to the BP via EMR…so internal energy of the BP builds up to steady state equilibrium per eqn 64…
They directly disagree with each other. And, you get the impression that if Nate agreed with what Ball4 said there, he would be forced to concede that Eli’s solution involves a 2LoT violation! Ball4 agrees with me that the BP gains internal energy from the GP, in other words that the GP (the cooler body) cools some more so that the BP (the warmer body) gets warmer still. That’s as clear a 2LoT violation as I can imagine there being!
So now, astute readers should understand that from this point forward, they no longer need to be arguing with me. They should be arguing with each other.
DREMT 1:22 am incorrectly writes “the GP (the cooler body) cools some more”. No DREMT, as Eli writes the GP “has to heat up”; GP never cools from its introduction in the original GPE as DREMT erroneously writes.
DREMT’s GPE solution remains a clear violation of Clausius’ 2LOT work as shown by eqn. 64 thus there is still no hope for DREMT’s non-equilibrium GPE solution to be correct at steady state GPE equilibrium. Eli’s solution remains consistent with Clausius’ eqn. 64.
Ball4, you’ve agreed that the GP transfers internal energy to the BP. That means the GP is cooler at equilibrium than it would otherwise be, without that transfer occurring. That’s borne out by the difference between the 262 K…220 K and 244 K…244 K solutions. When the energy from GP to BP is returned to the GP, the GP is warmer and the BP cooler.
It doesn’t matter what temperature the GP is introduced at. 262 K…220 K still involves a 2LoT violation, and is thus impossible.
DREMT next erroneously writes “That means the GP is cooler at equilibrium than it would otherwise be”. No DREMT, of course the GP continues to emit as it warms up so is cooler than it would be transiently without normally emitting. This is part of its enthalpy capacity until GP reaches steady state equilibrium temperature cooler than the BP – the BP is in sunlight, the GP is shaded by BP so cannot be at the same equilibrium steady temperature.
Eli’s GPE solution still complies with 1LOT and Clausius’ 2LOT work as evidenced by eqn. 64.
Is Ball4 denying that 220 K is cooler than 244 K, or that 262 K is warmer than 244 K?
Who knows? The guy will literally just say anything.
Regardless of his nonsensical attempts to save face, he’s agreed that the GP transfers internal energy to the BP, where he claims it builds up, at the expense of the GP. That’s a 2LoT violation, and he’s in direct disagreement with Nate.
Predictably, he’s now trying to make that my problem.
No desperation here, Nate, just enjoying my win.
”
As I’ve said, many times, and you’ve failed to grasp, many times, your point about the RHTE doesn’t challenge the points 1) – 7).”
Saying the same crap while offering no substantive rebuttal to its debunking.
Several debunkings.
That aint honest debate!
We’ve just had a long discussion, with the gaping holes in your logic not filled to anyone’s satisfaction, yet you call that a ‘win’?
You saying crap like this is an excellent way to lose respect on this forum.
That is entirely on you.
“Let’s be absolutely clear – the 262 K…220 K solution treats EMR as heat. Specifically, it treats the “back-radiation” transfer as though it were heat.”
Just plain weird.
What is ‘it’? And how is ‘it’ treating something that all agree is ‘not heat’ as heat?
Nate, you haven’t debunked the points 1) – 7). Pretending that you have is a great way to lose respect on an online forum.
You failed to answer my question, as predicted.
You failed to argue against Ball4, as predicted.
Thanks for proving me right on those two predictions. I do love being right.
No “direct violation of 2LOT” once DREMT admitted EMR is not heat and Nate agrees objects do not contain heat. No heat inside the plates or outside the plates means there is no heat to be found anywhere in the GPE.
DREMT also knows Nate agrees with Eli’s GPE solution because the temperatures Eli computed comply with 1LOT and 2LOT as evidenced by Clausius’ eqn. 64. DREMT’s solution is merely transient not steady state equilibrium.
I quote Nate and Ball4 directly disagreeing with each other and neither of them can even admit that’s the case. Truly pathetic.
DREMT 4:22 pm, please actually read again my previous comment this time with understanding: DREMT knows Nate agrees with Eli’s GPE solution…
DREMT’s GPE solution remains only transient.
Yes, Ball4, I already read your previous comment. Like I said, neither you nor Nate can even admit that you disagree with each other, despite the fact that I quoted exactly what you disagree on. Truly pathetic.
DREMT 3:07 am, the only commenter disagreeing in this whole thread with Eli’s long ago GPE solution is DREMT who has never pointed out Nate disagrees with Eli’s solution.
DREMT’s GPE solution temperature remains only transient while Eli’s is correct for steady state equilibrium.
You always play the same stupid games, Ball4. You know very well I’m not suggesting you or Nate disagree with Eli’s solution. You don’t disagree with each other on that. You disagree with each other on something very important, and fundamental to this discussion, however. I quoted exactly your disagreement, here:
https://www.drroyspencer.com/2025/12/uah-v6-1-global-temperature-update-for-november-2025-0-43-deg-c/#comment-1727714
DREMT 9:30 am, again, Nate gets the same answer as Eli does for the GPE. Anything else is immaterial; if any disagreement really was fundamental, Nate would get a different GPE answer than Eli which is not the case.
Why are you acting like you have no idea what the disagreement is about? You can read, can’t you?
You have said that internal energy from the GP is transferred to the BP, where it builds up at the expense of the GP. Nate has said absolutely not, in no way is any internal energy from the GP transferred to the BP!
If Nate agreed with your stance he would no doubt accept that there’s a 2LoT violation in Eli’s solution.
If you agreed with Nate’s stance on 2LoT then you would have to accept that the 244 K…244 K solution does not violate 2LoT. Nate has never said that he thinks it does. He’s accused it of violating just about every other physical law, but he’s never said that he thinks it violates 2LoT.
If you two would ever actually argue against each other then we might finally get somewhere. But, I know neither of you has any interest in learning anything.
DREMT 2:53 pm: DREMT is the commenter with no interest to learn by leaving out Nate’s full comment: “Again, the flow of heat is always from the BP and it simply reduces when the GP is put in place.”
In context, Nate was writing about the net energy transfer BP to GP. DREMT has not shown enough competence in this field to so realize that fact. If DREMT were actually correct about Nate’s position, then Nate would not be supporting Eli’s physically correct GPE solution.
Ball4, I originally quoted precisely what you disagree on. I linked you to that comment. Then I just summarised it for you again.
No amount of your misdirection is going to get you out of this one. Stop arguing with me, start arguing with Nate.
5:53 pm: No argument with Nate in DREMT’s clip since DREMT quoted Nate out of context. DREMT’s confusion here can easily occur when commenters use the unnecessary term “heat” as a noun.
Neither of you used the term “heat” in the relevant quotes, Ball4. Again:
[NATE] There is never never NEVER any transfer of internal energy from the GP to the BP. Its internal energy only transfers to space. There [is] transfer of the sun’s internal energy to the BP.
[BALL4] The internal energy from the GP is transferred to the BP via EMR…so internal energy of the BP builds up to steady state equilibrium per eqn 64…
If Nate agreed with your stance on the internal energy transfer, I have no doubt he would agree there’s a 2LoT violation in Eli’s solution. So it’s you Ball4, not Nate, who should already be thinking that Eli’s solution is wrong. Your stance on the internal energy transfer is not compatible with Eli’s solution being correct. Nate should think Eli’s solution is wrong once you argue with him and convince him that your stance on the internal energy transfer is correct. Off you go, now.
Constantly moaning about the length of these discussions, while also constantly baiting people to continue the discussion. While also desperately trying to distract from your failed illogic.
You are just a hot mess of contradictions.
DREMT seems to realize that HE cant find any evidence to support his claim that internal energy ever flowed from the GP to the BP in Elis solution. And wants Ball4 to find some.
And Ball4 is correct that Eli’s GP was brought from the cold surroundings.
It did the job that a cold blanket would do to insulate a heated human in a cold room.
Both the blanket and the GP warm when put in place, acting as passive insulation for a heated object, and obviously not needing to supply any internal energy to the body being insulated.
Obviously, the heat source was the source of heat warming the human and the BP.
It makes ZERO sense to think any of this is a 2LOT violation.
DREMT 1:18 am incorrectly claims Nate didn’t use the term “heat” after I quoted Nate using the term in the comment DREMT clipped. It’s a pity DREMT resorts to such losing tactics.
Eli’s solution remains correct as it complies with Clausius’ 2LOT as evidenced by Clausius’ eqn. 64 while DREMT’s solution is only transient in nature.
I’m not “baiting”, Nate. The reason you respond to me so incessantly is because you know, deep down, that I’m right. If you truly thought there was nothing to what I was saying, you would have dropped this years ago. The only reason I respond to you is because, as I said, it’s just an ongoing experiment for me to leave no comment directed to or involving me without a response. So, you (and Ball4) are 100% responsible for the length of this discussion.
I’m not trying to distract from anything. The logic in my points 1) – 7) remains undefeated.
It’s also a pity that there is no hope for DREMT’s 1) – 7) to all be correct when DREMT hasn’t been able to show they all comply with Clausius’ 2LOT as evidenced by his eqn. 64 when it’s obvious they do not.
All wrong, Nate. I’ve produced an irrefutable chain of logic (the points 1) – 7)) that demonstrates beyond all doubt that in the 262 K…220 K solution, internal energy from the GP is transferred to the BP, where it builds up at the expense of the GP. And, I’ve even managed to convince one of you (Ball4) that that’s the case.
So, Nate, you should be arguing against Ball4. You won’t, because you have no integrity, but that’s what you should be doing.
“I’ve produced an irrefutable chain of logic (the points 1) – 7))”
Obviously not, since you had several opportunities to provide answers when glaring flaws in the ‘logic’ of these points 1-7 were pointed out.
But you could not provide answers.
You simply ignore the fatal flaws in your logic, eg pretending there is no heat source.
All you are doing is showing readers that you are deeply dishonest, or deeply delusional about your competence in this subject.
Likely both.
There is one way to stop getting responses from me. Stop baiting by mentioning my name.
No DREMT 9:03 am, Clausius’ 2LOT eqn. 64 shows internal energy from the GP must be transferred to the BP where it builds up from GP to equilibrium steady state temperature shown by Eli long ago. There is no hope remaining for all of DREMT’s 1) thru 7) having been defeated by not complying with 2LOT.
DREMT lost his case after admitting EMR is not heat.
No, Nate, astute readers will have noticed three things:
1) You never pointed out any holes in the logic of points 1) – 7). Instead you kept repeating fixed points about blackbodies and the RHTE which did not even challenge the points 1) – 7).
2) You refuse to challenge Ball4, even as he openly states that which you believe would be a 2LoT violation in Eli’s solution – namely that internal energy from the GP is transferred to the BP where it builds up at the expense of the GP. He says that, and you ignore him. I say it, and you challenge me!
3) You still haven’t answered my question – do you agree with Ball4 that the 244 K…244 K solution violates 2LoT?
Sorry that being wrong makes you angry. It’s not my fault that I’m right, though. Just the way it is.
Pitiful DREMT 12:43 pm flounders around writing words I did not state in 2). Nate is correct to challenge DREMT writing words as in 2).
DREMT lost his case after admitting EMR is not heat.
“writing words I did not state in 2)”
Lol. You’re hilarious, Ball4. In the comment preceding my last one you said the same thing I wrote in 2). Everyone can see that.
No DREMT, read more carefully – what you wrote is wrong; implied the GP is not continuously warming. What I wrote is correct. Pay better attention & quote my words. I do know physics is not your strong suit.
You’re a joke. This is what you said:
“…internal energy from the GP must be transferred to the BP where it builds up from GP to equilibrium steady state temperature shown by Eli long ago”
Nate has repeatedly said that absolutely no internal energy from the GP is transferred to the BP. You are in complete, abject disagreement.
Neither of you has the integrity to admit it.
Truly pathetic.
As astute readers expected, DREMT is thoroughly dishonest.
‘Fixed points’ translation:
Contradictory facts and logic flaws that are unexplained.
Then again unexplained.
Then again and again and again….unexplained.
Your strategy is to ignore your logical failures and contradictions, and hope they will simply go away.
But they dont.
-To concluse that an impossibility (a blackbody reflecting light) MUST happen, is the ultimate logical failure.
-EMR is not ‘heat’ nor being treated as ‘heat’ by Eli or me or you. Its flow from cold to hot is never a 2LOT violation, and it must happen according to the RHTE.
-satisfying the RHTE cannot be the cause of a 2LOT violation.
-Heat does flow from a hot heat source (sun) to a cooler BP. Ignoring this heat souce and assigning its consequence to another cause is a logical failure.
Keep those failures of logic coming!
I’m one of the most honest commenters at this blog, Nate.
By contrast, you are focusing only on the first of my three points, and completely ignoring the second and third points. This is deliberate.
I will repeat them for you:
2) You refuse to challenge Ball4, even as he openly states that which you believe would be a 2LoT violation in Eli’s solution – namely that internal energy from the GP is transferred to the BP where it builds up at the expense of the GP. He says that, and you ignore him. I say it, and you challenge me!
3) You still haven’t answered my question – do you agree with Ball4 that the 244 K…244 K solution violates 2LoT?
Now – you can either respond, or concede the entire argument. Up to you. Failure to respond will be taken as an automatic concession.
If DREMT had enough competence in this field, he would notice I never wrote “at the expense of the GP.” since the GP is always warming it never goes into the expense mode of cooling as DREMT writes. It’s still a pity that DREMT misses that fact meaning the GP increasingly emits more EMR toward the BP as GP warms and DREMT has admitted this EMR is NOT heat.
That EMR from GP is absorbed by BP in accord with Clausius’ eqn. 64 and the system eventually reaches steady state equilibrium as Eli showed long ago.
DREMT is the physics jokester on this blog generating much humor filled entertainment being so plainly wrong for many years.
That Eli has the GP introduced at some impossibly low temperature is just more sophistry designed to hide the 2LoT violation. It makes no difference, though – the buildup in the BP in Eli’s solution is at the expense of the GP. Plainly, 220 K is cooler than 244 K, the latter of which is what the GP temperature would be if the “back-radiation” transfer were returned to the GP. So, if the “back-radiation” transfer is allowed to happen, the GP is 220 K. If the “back-radiation” transfer is not allowed to happen (it instead gets returned to the GP) then the GP is 244 K. That literally proves beyond any doubt that the buildup in the BP is at the expense of the GP.
All that aside, though – you still disagree with Nate, regardless of “at the expense of”. Nate says the internal energy from the GP is never transferred to the BP. You say it is. So, your objection to “at the expense of” is another red herring – a distraction from the fact that you disagree with Nate.
“The internal energy from the GP is transferred to the BP” does not equal “the internal energy from the GP is never transferred to the BP”.
You and Nate disagree. Get over it, and start arguing with him instead of me.
DREMT 12:40 pm misses that Eli has not introduced the GP at any specific temperature evidently due to poor DREMT reading skills. There is no build up “at the expense of the GP” since the GP never enters expense mode always accumulating internal energy so GP always warms up to steady state as I already explained = another piece of evidence DREMT has poor physics comprehension.
DREMT clips Nate out of context. Already explained above that DREMT quoting Nate in context removes any disagreement. DREMT is the commenter repeating errors all these years and needs to get over them.
DREMT lost the argument when he admitted EMR is not heat. Get over it.
I missed nothing, Ball4. Eli mentioned no specific temperature for the introduction of the GP, but it had to have been cooler than 220 K when introduced, or the GP would not be “warming”.
The reality is that the BP, on its own, is at a distance from the Sun where it equilibrates at 244 K. Thus, a more realistic temperature for any introduced object, like the GP, would also be 244 K. But, Eli wasn’t going to say that the GP cools on introduction because then the 2LoT violation would be obvious! The GP, introduced at 244 K, would (according to Eli’s solution) cool some more via transferring internal energy to the BP so that the BP, the warmer object, could warm some more! As obvious a 2LoT violation as you could possibly imagine. So, he hid that by introducing the GP at a temperature below 220 K.
Like I said, though, it doesn’t matter what temperature you introduce the GP at. You were unable to rebut my reasoning for how we know the GP transfers internal energy to the BP where it builds up at the expense of the GP, in Eli’s solution. That’s that, then.
As for your disagreement with Nate – there is no “context” which can possibly save you, I’m afraid. Your “internal energy from the GP is transferred to the BP” does not equal Nate’s “internal energy from the GP is never transferred to the BP”. It’s as simple as that. Fun to watch you wriggle, though.
DREMT 5:53 pm, all points already thoroughly refuted above and DREMT has no new approach this time.
DREMT lost the argument when admitting EMR is not heat.
So, Ball4 simply lies, once again, and when Nate is called on to actually respond to the fact that Ball4’s stance on the transfer of internal energy would represent a 2LoT violation in Nate’s view, he runs away!
Nate obviously does not agree with Ball4 that the 244 K…244 K solution violates 2LoT, or he would have said so a long time ago.
Neither Nate, nor Ball4, have the integrity to argue against each other over their disagreements. Truly pathetic.
DREMT erroneously manufactures a disagreement when there is none. All of DREMT’s points remain thoroughly refuted since the GP warms continuously. Humorously DREMT has nothing new to warrant a response.
Eli’s GPE solution remains correct; DREMT’s is wrong.
Astute readers will note there have been three disagreements between Ball4 and Nate throughout this discussion:
1) Nate initially said the 244 K…244 K solution violated 1LoT, whereas Ball4 said it was “1LoT compliant”. Nate eventually realised he was wrong, and has dropped the 1LoT violation complaint.
2) Ball4 says that in the 262 K…220 K solution, internal energy from the GP is transferred to the BP, where it builds up. Nate says that internal energy from the GP is never transferred to the BP. He believes the build up of internal energy in the BP comes only from the Sun.
3) Ball4 believes the 244 K…244 K solution violates 2LoT. Nate does not.
Of the three, 2) is the most significant disagreement. However, 3) is funny, since accusing the 244 K…244 K solution of violating 2LoT is pretty much Ball4’s entire argument against it. He’s asserted that (without support) about fifty times throughout this thread.
Well, Nate’s run away once challenged, but let’s annihilate his earlier points for completeness:
“-To concluse that an impossibility (a blackbody reflecting light) MUST happen, is the ultimate logical failure.”
This doesn’t challenge points 1) – 7). In any case, a blackbody cannot be used as an excuse to violate 2LoT.
“-EMR is not ‘heat’ nor being treated as ‘heat’ by Eli or me or you. Its flow from cold to hot is never a 2LOT violation, and it must happen according to the RHTE.”
EMR is being treated as heat in the 262 K…220 K solution. We know that’s the case, because internal energy from the GP is transferred to the BP, where it builds up at the expense of the GP. That means the “back-radiation” transfer is being treated as a transfer of heat.
“-satisfying the RHTE cannot be the cause of a 2LOT violation.”
There is no such thing as “satisfying the RHTE”. If you think there is, show where such a statement has ever been made by anyone but you.
“-Heat does flow from a hot heat source (sun) to a cooler BP. Ignoring this heat souce and assigning its consequence to another cause is a logical failure.”
Nobody is ignoring the Sun. The Sun is present in both the 244 K…244 K and 262 K…220 K solutions. The only difference between those solutions is that in the latter, the “back-radiation” transfer is allowed to happen, and in the former it isn’t (it gets returned to the GP). So, we know the “back-radiation” transfer ultimately increases the temperature of the BP, and decreases the temperature of the GP. That’s how we know internal energy from the GP is transferred to the BP, where it builds up at the expense of the GP, in the 262 K…220 K solution.
DREMT 10:49 am and 8:09 am presents nothing new. All of DREMT’s points have already been thoroughly refuted above since both BP and GP continuously warm up to steady state equilibrium after the GP is introduced. A response is only warranted if DREMT presents something new.
Eli’s long ago solution remains correct having survived all attacks; DREMT’s solution is wrong as shown above in this thread.
Ball4 continues to lie. I guess he has no other choice, given that even his own “team mate” (Nate) doesn’t agree with him on a lot of what he says, and he has no rebuttal to any of my arguments.
One of my favourite wins. Great to see one of the most dishonest commenters on the internet (Ball4, aka “Trick” or “The Twister”) reduced to such depths of intellectual depravity. The permanent internet record forever displays his sheer malevolence and utter contempt for reality in lurid detail. A thick, hated troll that lost – the argument, and any remaining scraps of credibility he had left.
All that is needed is to scroll up and find all DREMT points thoroughly refuted. DREMT 6:32 pm simply repeating the same old story does him no good. No further response is needed unless DREMT tries something new.
Eli’s long ago GPE solution remains correct having survived all attacks; DREMT’s GPE solution is wrong as shown above in this thread.
Ball4 continues to lie.
No need to get excited.
There is simply Heat flow, which is the NET transfer of energy.
Google/AI what is heat?
“Heat is defined as the form of energy that is transferred between bodies or systems as a result of a temperature difference. In physics, an object does not ‘contain’ heat; the correct term for the energy stored within a substance is internal energy or thermal energy”
“Energy in Transit: Heat is energy that is moving or in transit, always flowing spontaneously from a region of higher temperature to a region of lower temperature until thermal equilibrium is reached.”
Nobody’s getting excited, Nate. As Tim S disagrees with you, I wonder if he’ll be along to argue with you?
That is almost a complete answer. Sensible heat involves a temperature change and latent heat involves a phase change.
The specific heat, which quantifies the relationship between temperature and heat per unit mass is also a function of temperature.
The heat of fusion and melting point is constant over a wide range of pressure for chemicals with a sharp melting point such as water. Organic chemicals with a melting point range are more complex.
The heat of vaporization is a strong function of the liquid temperature for evaporation, or the dew point temperature for condensation. It is also a function of pressure, as the boiling point temperature is a function of pressure. The specific heat is a function of temperature as stated and is different for the liquid and vapor. Thus, the heat of vaporization decreases with increasing temperature from the triple point to the critical point where it becomes zero.
Tim S seems to have forgotten that he wrongly said heat is radiated both ways between bodies of different temperature. Let’s remind him:
https://www.drroyspencer.com/2025/07/uah-v6-1-global-temperature-update-for-june-2025-0-48-deg-c/#comment-1709193
I do not have any animosity toward DREMT. I am actually amused that he is probably a lot smarter than Nate, and possibly better educated, but Nate easily wins the argument, even if he needs help from AI. I have encouraged DREMT in the past to make better use of his talents, but he prefers to play the fool, and yes it is a disgusting abuse of the freedom of expression allowed by Dr Spencer on this blog.
Here’s what you said, Tim:
“The cooler surface sends radiant heat back to the hot surface as described above.”
Nate disagrees with you, but won’t argue with you about it.
As anyone can see from reading through the thread at the time, you personally attacked me for simply pointing out that you’d made a mistake. Nate came along, expressing agreement that energy (EMR) flows both ways, but heat only flows from hot to cold. So, Nate agreed with me, and disagreed with you. Then, Nate started personally attacking me as well. Even though I’m the one he agreed with.
It really is bizarre how much abuse I receive despite being the one in the right.
Anyone who defends the GHE gets a pass from anyone else who defends the GHE. It’s just really weird. Are you guys like a secret society or something? Is it all secret handshakes and having one trouser leg slightly rolled up?
What is the explanation for someone who insist on being wrong, and obsesses over a misplaced word in one sentence, as if that proves his case? Does that somehow refute a basic scientific relationship that can be researched in any number of reliable sources to now include AI?
So, now you’re claiming it was a misplaced word!? Anyone reading through the thread can see that you clearly believe, quite passionately, that heat is radiated both ways between objects of different temperature! You wanted to give me a “dressing down” for correcting you on that!
“wont argue with you about it”
Because Im not obsessesed with scoring imaginary points over pedantic semantics, as you are.
Once again, Nate proves me right. Seems to be all he can do these days.
“Nate proves me right”
Never good to mimic our chief tr.oll, Clint.
I said nothing to prove you right.
The readers can decide that for themselves.
Looks like Graham D. Warner commented again.
Readers might appreciate the theory in the comments:
https://rabett.blogspot.com/2020/10/how-greenhouse-gases-heat-surface.html
They might also recognize equations.
Well, we shouldn’t be hearing from either Nate, or Ball4, for 60 days! Great.
Looks like Graham D. Warner has responded once again.
It’s “DREMT”, Willard. The name you agreed you would use.
ark….”Thus in 1862 John Tyndall described the key to climate change. He had discovered in his laboratory that certain gases, including water vapor and carbon dioxide (CO2), are opaque to heat rays. He understood that such gases high in the air help keep our planet warm by interfering with escaping radiation”.
***
What are heat rays? In the day, Tyndall and every other scientist thought heat flowed through the atmosphere as heat rays. People like Tyndall, smart as they were, thought heat, as actual heat, flowed through the atmosphere via radiation. They could not conceive as we do that heat does not flow through the atmosphere but must first be converted to electromagnetic energy, which in no way resembles heat. If it encounters a mass cooler than the radiating mass, the EM can be absorbed and converted back to heat, as new heat. That heat is no longer related to the heat associated with the radiation on the emitting surface, therefore it cannot be claimed to affect that surface in any way.
That defeats Tyndall’s argument right there since he thought heat was being trapped by GHGs in the atmosphere. Amazingly, many scientists today still believe that rot, even though since 1913, the real mechanism has been revealed by Bohr. It also defeats the arguments of Fourier and Arrhenius, who believed the same thing. We might as well include Callander since he apparently fell for it.
The point is, the basis of the IPCCs arguments on behalf of AGW is based solely on Fourier, Tyndall, Arrhenius, and Callandar. It is egregiously wrong, making the IPCC the spreaders of pseudo-science and propaganda.
That’s where the nonsense about GHGs trapping heat originates and the basis for the comparison of our atmosphere to a greenhouse.
Tyndall was a very smart guy and it bothers me that he was not privy to information about heat and radiation that we take for granted today. Had he even the slightest idea about the process, I am sure he’d have taken a different view.
https://pbs.twimg.com/media/DXshisOUQAAroN7.jpg
I’m still waiting for you to explain why the spectral flux is lower than the black body radiation.
The terminology has changed; the physics has not.
Tyndall’s laboratory results stand today; modern spectroscopy (HITRAN, HITEMP) confirms them with superb precision.
Fourier’s qualitative reasoning, that a planet’s surface temperature is set by a balance between incoming solar radiation and outgoing infrared emission and that an intervening atmosphere alters that balance, has been validated with even greater rigor by modern radiative-transfer theory and satellite observations.
It is not possible to determine a person’s level of formal education with certainty from a single comment. However, the specific misunderstandings and the pattern of errors offer insight into someone who has not completed formal post-secondary education in physics or engineering, and whose understanding of thermodynamics and radiative transfer remains at a pre-university or self-taught level.
You posted at Postma’s blog using the email address of a known historian. If that’s you, then you have not completed formal post-secondary education in physics or engineering yourself. Which is fine, but don’t go around pretending that you have.
Generally, the whole “academic snobbery” on here is pathetic, anyway.
I note that Graham D. Warner just posted.
Better ignore him.
Yes, please do.
Tyndall: Heat a mode of motion
https://darwin-online.org.uk/converted/pdf/1868_Tyndall_Heat_mode_motion_A6175.pdf
pg 248
Describing a heated ball of copper which glows red
” Like the rays of light, the rays of heat emanating
from our ball proceed in straight lines through space, diminishing in intensity, exactly as light diminishes..”
Eli kindly provides some support for Gordon’s assertion that “in the day, Tyndall and every other scientist thought heat flowed through the atmosphere as heat rays”. It’s good of Eli to support Gordon – is that Eli’s first ever act of basic human decency?
Tyndall show that heat (thermal radiation) and light have the same properties. That’s pretty good for 1860s.
I’m sure anybunny would agree.
Sam Altman Has Explored Deal to Build Competitor to Elon Musk’s SpaceX. The OpenAI CEO has publicly talked about the possibility of building ‘a rocket company’ and the potential for developing data centers in space. WSJ December 3, 2025. https://www.wsj.com/tech/ai/sam-altman-has-explored-deal-to-build-competitor-to-elon-musks-spacex-01574ff7
“Data centers in space” is probably the dumbest idea of 2025, and there are many to choose from. It simply will not work!
Why?
1/ Insufficient power supply.
2/ Severe thermal-management challenges. Heat dissipation must be done through radiation which would require enormous radiator area.
3/ Radiation damage to electronics.
4/ Poor satellite-to-ground communications/bandwidth constraints.
5/ Servicing: how would data centers in space deal with getting the vast quantities of replacement hardware into and out of orbit? Old-style server farms continuously replace dead hardware.
6/ All the above add up to disproportionate cost, complexity, and poor cost-performance ratio.
Notably there seems to be no argument explaining why it is a good idea to put data centers in space rather than somewhere else; anything that you do in space can be done way cheaper on earth. FLOPS/$ are much better pretty much anywhere besides space. The fact this crazy idea is even being considered so we have more AI just confirms the notion that we are in a bubble. The bottom line is that the initial investors don’t have to produce a working final result. They only need to convince secondary investors that the hare-brained scheme might work such that they throw their money away and the initial investors can walk off with the cash, IPO or not. If they can pull off an IPO, then the banks and funds get involved in keeping people quiet about the emperor’s new clothes.
There are other more useful ideas than data centers in space. For example, Earth observation missions.
The thermal-management challenges arise from the required use of radiators to reject waste heat. These radiators perform bidirectional radiative exchange, and their net heat rejection is governed by the heat balance Qnet= Qemitted – Qabs where a b s o r p t i o n includes Earth IR emission, Earth albedo, and direct solar flux.
When the radiators face deep space:
A b s o r b e d flux is minimal and net radiative emission is maximized, but the risk of working fluid freezing increases, requiring heaters and controlled flow.
When the radiators face Earth:
Incident Earth IR and albedo significantly reduce net heat-rejection capacity and may constrain operations.
During the Sun-lit portion of each orbit:
The radiator panels must be oriented to avoid direct solar illumination or shielded to maintain acceptable thermal performance.
Clearly, actively orienting large radiator panels does require power, and all of that power ends up as additional heat that must be rejected. The effect is small compared to the primary thermal load, but it is real and adds to the system’s complexity.
IBM CEO warns that ongoing trillion-dollar AI data center buildout is unsustainable – says there is ‘no way’ that infrastructure costs can turn a profit. https://www.tomshardware.com/tech-industry/ibm-ceo-warns-trillion-dollar-ai-boom-unsustainable-at-current-infrastructure-costs
“AI is the asbestos we are shoveling into the walls of our society and our descendants will be digging it out for generations.”
Google CEO talking about data centers in space.
https://x.com/elonmusk/status/1998130316079460703?s=20
test2
DREMT:
“I don’t care what happens at the quantum level to enable this all to work. Whatever it is, it must happen, otherwise thermodynamic laws would be violated. Why the fixation on photons, I have no idea. Other than I guess it’s a great way for you guys to endlessly obfuscate. Absorbed? Reflected? Don’t know. Don’t care! Whatever happens, it does not lead to warming.”
Spoken like a 3yo having a tantrum. Stick your fingers in your ears and scream at the top of your voice. My advice? Scream louder.
If you say so, studentb. As far as I was aware, I was cool as a cucumber when I said it. But, you’re the mind-reader.
Clipping this bit out to start a new thread is probably easier for you than responding to the parts of my original comment that you cannot refute, huh?
dremt offered an honest and scientifically valid statement and you responded, calling it infantile. He was backing the views of Clausius, who knew nothing about quantum theory wrt electrons in atoms and EM, yet still figured out that heat can only be transferred cold to hot by its own means.
If I read Dremt correctly he is saying that a knowledge of quantum theory is not required to understand the 2nd law, and I agree. All I am trying to point out is the understanding of heat transfer at the atomic level, for which quantum theory helps. Clausius was a lot smarter in math and science than I will ever be and he proved the 2nd law without the slightest understanding of quantum theory. In fact, he claimed there was no need to understand heat transfer at the atomic level.
I should point out that no scientist in the day of Clausius understood how heat was transferred via radiation. They had not a clue that heat (thanks to Bohr in 1913) was first transformed to EM first, meaning it was dissipated as heat and recreated as EM. At the other end, if the EM was absorbed by a cooler surface, the EM could be transformed back to heat, although that heat had nothing to do with the original heat.
However, any EM emitted by electrons in the atoms of a surface have a discrete frequency. If that energy is to be absorbed by a surface in another area, the frequency must at least match the frequency of the electrons in that surface. If it is lower in frequency, it cannot be absorbed and that is the case where the emitting surface is cooler than a hotter receiving surface.
Stoopidb and others seem to think that any frequencies emitted by one body must be absorbed by any other body. Such is their lack of understanding of basic quantum theory.
Earlier, you attacked my comment that photons don’t need to know anything, it is their frequency that decides whether they are absorbed by electrons in the atoms making up a surface. I explained it in detail yet you failed to rebut my comment, all you did was carry on with your pseudo-science.
You were the one having a tantrum, as you usually do, offering an ad hom attack in lieu of scientific evidence.
The encouraging factor for me is that alarmists collectively seem to be almost as misinformed as you. They fail to grasp the basic science involved and have resorted to creating pseudo-science by incorrectly modifying basic science laws to suit their nonsense.
typo…”…that heat can only be transferred cold to hot by its own means”.
Should read…”that heat cannot be transferred cold to hot by its own means”.
Of course, stoopidb will latch onto that typo because he is desperate to push his alarmist pseudo-science and needs to toss dirt. Then again, I doubt that he caught the typo since he obviously skims posts and cherry-picks what he wants to see.
Answer this simple question:
15 µ radiation arrives at a receptor.
The receptor’s temperature is 300K.
Does the receptor absorb the radiation?
And don’t tell me it depends on the temperature of the source. 15 µ radiation can come from an infinite number of sources at different temperatures – both hotter and cooler than the receptor.
Once you have thought about this problem, the penny will drop and you will (or should) realize you have been made to look like a fool.
“If I read Dremt correctly he is saying that a knowledge of quantum theory is not required to understand the 2nd law, and I agree.”
You did indeed read me correctly, Gordon, thanks.
See how studentb uses quantum theory only to obfuscate the issue?
“Answer this simple question”
Nope, he cant be bothered with any pesky contradictory facts or logic.
Hes got belief, and thats all he needs!
I think Gordon’s moved on, Nate.
“Fourier’s qualitative reasoning, that a planet’s surface temperature is set by a balance between incoming solar radiation and outgoing infrared emission and that an intervening atmosphere alters that balance, has been validated with even greater rigor by modern radiative-transfer theory and satellite observations.”
The Radiative Energy Budget considers the Entire not reflected solar energy absorbed as heat. It is overlooked (in the Budget) the Immediate IR Emission vs Heat Absorption Ability interplay.
–
Link: https://www.cristos-vournas.com
Fourier’s qualitative reasoning can be put in equation form:
(1-α)So/4 = σT^4
The atmosphere’s role is captured in the comparison between the effective radiating temperature (255 K) and the surface temperature (288 K).
Sorry Ark, but your cult has misled you, again.
The “255K” comes from the calculation for an imaginary sphere. It has NOTHING to do with “Earth’s effective radiating temperature”.
You’ve been heavily indoctrinated, and I doubt you can ever recover.
Yes, you are sorry!
Arkady,
“Fourier’s qualitative reasoning can be put in equation form:
(1-α)So/4 = σT^4
The atmosphere’s role is captured in the comparison between the effective radiating temperature (255 K) and the surface temperature (288 K).”
–
It was a wonderfull thought – to assume a planet temperature can be estimated from the incident on the planet solar energy. The induced on the planet temperature will radiate IR to space, an equilibrium temperature occured – let’s calculate that equilibrium temperature…
It is a wonderfull thought.
The equation produces (255 K).
The measurements produce (288 K).
Next step:
Something else – maybe atmosphere has an effect on temperature.
or
Maybe the equation is incomplete, maybe the equation is imperfect???
–
https://www.cristos-vournas.com
Christos Vournas at 2:27 AM.
The equation above is the energy balance at the top of the atmosphere, hence the 255 K temperature.
Writing the energy balance at the surface requires expressions for the upwelling and downwelling shortwave and longwave fluxes at the top of the atmosphere, and between the atmosphere and the surface. This is how you calculate the 288 K surface temperature.
In Engineering we call this Nodal Analysis, where you divide a complex system into a series of nodes, and write the equations that influence the state of the node under study. It’s a powerful method.
Arkady,
“The equation above is the energy balance at the top of the atmosphere, hence the 255 K temperature.”
There is not planet Effective Temperature (Te) at the TOA. The 255 K is Earth’s surface Effective temperature Te = 255 K.
This temperature (255 K) should be corrected for the specular reflection, which is neglected in the equation.
The corrected effective temperature for Earth is:
Te.correct = 210 K.
–
https://www.cristos-vournas.com
Sorry again Ark, but that equation is for the SURFACE or an IMAGINARY sphere. It has NOTHING to do with Earth, or TOA.
And you don’t “calculate” the 288K. That is the average surface temperature from measurements.
But your “Nodal Analysis” was funny.
Christos asks 2:27 AM: “Maybe the ((1-α)So/4 = σT^4) equation is incomplete, maybe the equation is imperfect???”
The eqn. is textbook perfect and complete at the 1bar earthen surface for a very, very optically thin earthen atm. But the earthen atm. happens (thankfully) to be optically thick with measured emissivity 0.7 near the less humid poles & measured emissivity about 0.95 near the humid equator regions for a planetary average 1bar atm emissivity of around 0.8.
A term for that optical depth on average needs to be added to the eqn. which you can find in a meteorology 101 atm. radiation textbook bringing the result to 288K for the global avg. temperature near the earthen surface.
The satellites look at a downward scene patch that does not exclude 90 degrees so system specular reflection is included in their scans measuring out to on avg. 255K = Te for our planet (ever since the NIMBUS satellite results were reported in the early 1970s) which makes your analysis of Te = 210K inconsistent with instrumental measurement. Christos need to up his game to better compare results of his analysis with measurement of earthen planetary Te.
Christos Vournas at 1:37 PM.
288 K = Earth’s average surface temperature.
255 K = Earth’s emission temperature at ~5 Km altitude.
210 K = somewhere in the Mesosphere at ~ 70 Km altitude.
This is well established knowledge.
What is “Earth’s effective radiating temperature”???
Because a material surface,
at 255K (-18C) on Earth doesn’t radiate 240 W/m^2…
at 288K (15C) on Earth doesn’t radiate 390 W/^2…
I think “Earth’s effective radiating temperature” is a mathematical abstraction.
–
https://www.cristos-vournas.com
Christos, “Earth’s effective radiating temperature” (commonly Te) is a measured brightness temperature at about 240 W/m^2; Earth’s surface temperature is a measured kinetic temperature at about 288K. No “abstraction” in either.
Thank you, Ball4
“Christos, “Earth’s effective radiating temperature” (commonly Te) is a measured brightness temperature at about 240 W/m^2; Earth’s surface temperature is a measured kinetic temperature at about 288K. No “abstraction” in either.”
the temperature of 255K nowhere in the entire world emits 240 W/m^2.
the 288K nowhere in the entire world emits 390 W/m^2.
The Earth’s CORRECT Effective Temperature Te.correct = 210K, it is also a mathematical abstraction. But it is, at least, a correct mathematical abstraction.
Because, when dealing with mathematical abstractions, we shouls pay respect to what they relay on, so the abstractions
to get correctly calculated.
Earth’s CORRECT Effective Temperature Te.correct = 210K
–
https://www.cristos-vournas.com
Christos Vournas at 5:19 AM.
Earth’s effective radiating temperature (Te) is an abstraction in the same sense that “center of mass” is an abstraction: a simplified, but physically useful, aggregate property derived from averaging over a complex system.
Earth’s Te describes the total radiative emission of the Earth-atmosphere system as seen from space. The total emission comes from various atmospheric layers where GHGs are a b s o r b i n g/emitting, cloud tops, and a small portion directly from the surface through the atmospheric window under clear sky conditions.
The Sun has an effective radiating temperature of ~5772 K. Do you accept that fact?
Thank you, Arkady,
“Earth’s Te describes the total radiative emission of the Earth-atmosphere system as seen from space.”
1362W/m^2 (0,7)*Φ * πr^2 = 1362W/m^2 (0,7)*0,47 * πr^2 =
= 444W/m^2 * πr^2 is the total radiative emission of the Earth
most of the IR radiative emission of Earth occurs at the instances of Solar energy /surface interaction process.
It is the immediate IR emission.
The rest, the absorbed as heat, when there is a radiative energy equilibrium – the rest is IR emitted by the surface as regular IR emission.
The regular IR emission is very weak.
Planetary IR emission is not describable by the Stefan-Boltzmann emission law.
The S-B emission law describes bodies emission with much higher temperatures, havinsg large inner sources of heat, like sun.
Or very hot fillamens (rods), which have aquired energy content much higher of what their surfaces are capable to instantly emit – and which equetes them to the bodies having large inner sources of heat.
Also, the S-B law’s emission intensity is not a result of EM energy /surface interaction process.
–
https://www.cristos-vournas.com
Christos Vournas.
You wrote: “The S-B emission law describes bodies emission with much higher temperatures, havinsg large inner sources of heat, like sun.
Or very hot fillamens (rods), which have aquired energy content much higher of what their surfaces are capable to instantly emit – and which equetes them to the bodies having large inner sources of heat.”
My doctor uses a handheld IR thermometer which uses the S-B equation to convert the detected IR radiation power into an accurate temperature reading of around 37 C. I can categorically state that none of his patients have any “large inner sources of heat.”
Christos erroneously writes: “Earth’s CORRECT Effective Temperature Te.correct = 210K”
If Christos’ analysis (brightness Te=210K) does not agree with NIMBUS measurements of planet Earth (brightness Te=255K) then Christos’ analysis work is known to be wrong. I’d suggest Christos pull the reports and search for why that is the case.
Thank you, Arkady,
“My doctor uses a handheld IR thermometer which uses the S-B equation to convert the detected IR radiation power into an accurate temperature reading of around 37 C. I can categorically state that none of his patients have any “large inner sources of heat.” ”
37 C is ~310 K
According to S-B formula, when T = 310 K
it should emit 523,63 W/m^2
Of course none has. None of them emit 523,63 W/m^2.
Thermometer is calibrated, thermometer doen’t use the S-B equation to convert the detected IR radiation power into an accurate temperature reading.
Thermometer is calibrated to convert the detected IR radiation power into an accurate temperature reading.
Stefan-Boltzmann equation doesn’t take any part in the doctor’s patients temperature measurements.
–
https://www.cristos-vournas.com
Christos Vournas at 11:53 AM.
“it should emit 523,63 W/m^2”
It’s actually closer to 514 W/m^2 because emissivity is ~0.98.
“thermometer doen’t use the S-B equation”
I’m willing to read any reputable source you provide in support of your denial.
So you know, this denial of the applicability of the S-B equation at lower temperatures has been thoroughly debunked already. See the post here: https://www.drroyspencer.com/2025/12/uah-v6-1-global-temperature-update-for-november-2025-0-43-deg-c/#comment-1724704
Thank you, Arkady. It is a very interesting and educating material you have provided:
https://www.drroyspencer.com/2025/12/uah-v6-1-global-temperature-update-for-november-2025-0-43-deg-c/#comment-1724704
“Procedure
ä IMPORTANT: The voltage into the lamp should NEVER exceed 13 V. Higher voltages
will burn out the filament.
¬ BEFORE TURNING ON THE LAMP, measure Tref
, the room temperature in degrees
Kelvin, (K=°C + 273) and Rref
, the resistance of the filament of the Stefan-Boltzmann Lamp
at room temperature. Enter your results in the spaces on the following page.
– Set up the equipment as shown in Figure 3.1. The voltmeter should be connected directly to
the binding posts of the Stefan-Boltzmann Lamp. The Sensor should be at the same height as
the filament, with the front face of the Sensor approximately 6 cm away from the filament.
The entrance angle of the thermopile should include no close objects other than the lamp.
® Turn on the power supply.
Set the voltage, V, to each of the settings listed in Table 3.1 on
the following page. At each voltage setting, record I, the ammeter reading, and Rad, the
reading on the millivoltmeter.
äIMPORTANT: Make each Sensor reading quickly. Between readings, place both sheets
of insulating foam between the lamp and the Sensor, with the silvered surface facing the
lamp, so that the temperature of the Sensor stays relatively constant”
–
Here it is how the sensor is calibrated:
“¬ BEFORE TURNING ON THE LAMP, measure Tref
, the room temperature in degrees
Kelvin, (K=°C + 273) and Rref
, the resistance of the filament of the Stefan-Boltzmann Lamp
at room temperature. Enter your results in the spaces on the following page.”
–
Not thouroughly debunked yet… it is a calibrated measurement, it doesn’t say what W/m^2 the 288 K emit. It simply measures Ω to T relation in the sensor’s circuit.
–
https://www.cristos-vournas.com
Christos Vournas at 1:42 PM.
Obviously you didn’t read Mr Chmilenko’s (the author) comment.
He wrote:
Talk to him.
Goodbye.
He wrote:
“We did measure the IR intensity, this is the equipment manifest and experiment guide. …
I didn’t see any measurements’ results. Did you?
Goodby.
SOLAR MINIMUM UPDATE
Frustrated with their investor-owned utilities, a number of communities across the country have pushed for municipal takeovers in recent years. Initiatives to buy out private electric companies failed at the ballot in Maine and San Diego in 2023 and 2024, but Ann Arbor, Michigan, is building its own utility to operate alongside its private provider with the hope that public ownership will lead to more efficient service, a faster transition to renewable energy and lower bills.
https://insideclimatenews.org/news/05112025/california-investor-owned-utilities-vs-public-utilities/
Never fear – Dozing Donald will lower gas prices any time soon!
ark…”The thermal-management challenges arise from the required use of radiators to reject waste heat. These radiators perform bidirectional radiative exchange, and their net heat rejection is governed by the heat balance Qnet= Qemitted – Qabs where a b s o r p t i o n includes Earth IR emission, Earth albedo, and direct solar flux”.
***
It just occurred to me that radiant barriers used in construction serve no purpose as heat blockers through blocking radiation. QT tells us that heat is dissipated at the instant radiation is created, therefore there is no heat to block by the barriers wrt to radiation.
It appears the barriers are doing nothing more than adding an extra barrier to block direct conduction. Since many of them have an air gap built in, that also serves to further block conduction.
There is no such thing as a bidirectional radiative exchange. Furthermore, radiation is not heat. Therefore summing fictitious radiative quantities has nothing to do with summing heat quantities.
I have encouraged you and others to study basic quantum theory to understand why. Basic QT is not hard to understand since it is actually based in Newtonian physics. The wave equation employed by Schrodinger, which is the basis of real QT, comes from Newtonian mechanics. It is based on the incorrect notion, by de Broglie, that electrons have duality as a particle and a wave. Schroddy got the wave idea from de Broglie.
The fact that it works is more a fluke than a scientific accomplishment. Feynman got it right when he claimed QT works but that no one knows why. No one still knows why since QT has never been verified at the atomic level. That’s mainly because no one has ever seen an electron, a neutron, or a proton, or an atomic nucleus, and without that direct info, QT, basic electronics theory, and basic chemistry theory are nothing more than quaint ideas that happen to work.
Also, QT theory has become so obfuscated that it cannot be described in realistic terms. That’s very convenient to someone pushing, sci-fi, no one can prove them wrong because no one understand it.
Still, the fiction that radiation and heat are one and the same persists to this day. Infrared energy is not radiant heat. Neither form of energy has the slightest thing in common. IR/EM is an electric field orthogonal to a magnetic field and has a frequency. It contains no heat. Heat. on the other hand, is the energy associated with atomic motion, has a temperature, and no frequency.
The wonderment of it all is that the simple, tiny electron is the common factor between the two and that applies throughout the entire universe. That simple, beautiful truth discards the theory of evolution and the Big Bang theory, since no one can still explain how simple atoms work. On their own they have no means of forming the excellent intelligence in this universe that is life.
It is abundantly clear that the universe is a design based on intelligence. The idea that it is a fluke that emanated from a Big Bang, or that life emanated from an ancient cesspool, from inorganic elements, and by sheer fluke, is repugnant to me. The beauty in the universe and the beauty of life surely came from an intelligent creation of some form.
Or, did it come from anything? The human mind needs explanations and the deeper the mystery, the more the human mind strives to find a reason. Then, when it theorizes a reason, it reaches out to other minds to agree. If enough agree, the idea is anointed as fact, even though their is not the slightest scientific evidence to back it.
“It just occurred to me that radiant barriers used in construction serve no purpose as heat blockers through blocking radiation.”
C’mon, Bordo:
Radiant barriers are installed in homes — usually in attics — primarily to reduce summer heat gain and reduce cooling costs.
https://www.energy.gov/energysaver/radiant-barriers
Thank you for giving me the cleanest way to expose Sky Dragon crank silliness!
https://ibb.co/8DhPNRwn
ent…”https://pbs.twimg.com/media/DXshisOUQAAroN7.jpg
I’m still waiting for you to explain why the spectral flux is lower than the black body radiation”.
***
The diagram at the link is a depiction of someone’s idea of spectral radiation. It is not a measure of instruments.
Even at that, I don’t get what you mean. As you know, there is no such thing as blackbody radiation, an idea concocted by Kircheoff circa 1850 since no one in the day knew what radiation was or where it came from. In his day, it was believed that heat was transferred through air as fictitious heat rays.
Blackbody theory is essentially a desperate thought-experiment trying to explain thermodynamics that could not be explained since atomic theory had not yet been revealed. As it stands, the theory has lead us astray, giving the incorrect notion that heat can be transferred directly by radiation, as heat, and that it can be transferred in both directions simultaneously.
If you look at the diagram, the first thing you note is the ordinate which is in milliwatts per metre^2. I suppose if you integrate those number between 600 (16.7u) cm^-1 and 730 (13.7u) cm^-1 you would get 28 w/m^2 in that range. However, they are claiming some 18 w/m^2 is absorbed by CO2.
I don’t understand the use of wavenumbers since the drawing is essentially backwards from the way we think of a wavelength progression. A wavenumber is an inversion of a wavelength and only a masochist would use it.
What is the total surface radiation, again? I think it’s claimed to be 240 w/m^2. That means the 18 w/m^2 claimed to be absorbed in the diagram is 18/240 = 7.5% of the total radiation. It’s clear then that 92.5% of surface radiation goes directly to space.
Surely you don’t think the tiny amount absorbed by CO2 makes the slightest difference to warming. The Ideal Gas Law places the amount at 0.06C per 1C of overall warming.
I don’t like this diagram because it lies about water vapour. If you look at Fig.1 in the following link, it is clear in the bottom right quadrant that the WV spectrum covers the CO2 spectrum at 15m. There is no way to separate CO2 absorption spectrum from WV spectrum since they overlap. Clearly, this diagram represents a fictitious thought experiment.
https://pmc.ncbi.nlm.nih.gov/articles/PMC6351392/
“…I don’t get what you mean.”
“I don’t understand the use of wavenumbers.”
“What is the total surface radiation, again? I think it’s claimed to be 240 w/m^2.”
“I don’t like this diagram ..”
Everyone, just have a look at these utterances by GR.
They are so bizarre that I am now thinking that GR is deliberately feigning ignorance in order to amuse himself. If so, I say well done! You deserve a medal for trolling.
It seems people denying the GHE deny Kirchhoff’s law that emissivity = absorp.tivity.
If Earth emits IR in the 15um range, it must equally as efficiently absorb IR the 15um range (or any spectra associated with GHGs).
Deniers’ logic holds that the warm surface emits IR at 15 um,
but cannot absorb IR at 15 um if the source is cooler.
If the warmer surface truly could not absorb radiation from a cooler atmosphere at the wavelengths emitted by GHGs, then its absorptivity at those wavelengths would be zero — and by Kirchhoff’s Law its emissivity at those wavelengths would also have to be zero.
But we know that’s not the case because we have direct measurements of surface emissions matching GHG spectra, and therefore the surface MUST absorb GHG emissions, or Kirchhoff’s law is broken.
barry provides a chance to point out the cultists that plaque this blog. People like barry, dlhvrsz, Nate, gordon, Norman, studentb, Bindidon, Willard, and Tim S like to stalk Skeptics/. They will try tactics to discredit Skeptics, and if that fails, they will resort to insults and false accusations.
Here, barry is trying two such tactics. He is trying to claim that all Skeptics believe that 15μ photons cannot be absorbed by Earth. And he is trying to claim that Skeptics deny Kirchhoff’s laws.
Here are some of the falsehoods the cultists try to promote:
* All photons are always absorbed.
* All photons are equal.
* Imaginary black bodies are real.
* All energy is the same.
* Flux is energy.
* Insulation is “proof” that cold can warm hot.
There are more, but you will see these often.
Beware.
You mentioned my name. Just know I’m genuinely sorry if explaining that warmer water transfers its own internal energy to floating ice cubes came across as an offensive cult tactic. People have different thresholds for what they find objectionable, and I will try to keep that in mind.
Cultist dlhvrsz offers another example of childish tactics.
He couldn’t answer my direct question, so he dodged it. Then he tries to make it as if I were the one doing something wrong!
Kids these days….
“He is trying to claim that all Skeptics believe that 15u photons cannot be absorbed by Earth.”
Nope, you can’t read.
“And he is trying to claim that Skeptics deny Kirchhoff’s laws.”
That is a corollary of believing a warmer object cannot absorb photons from a cooler object because of the temperature difference.
barry… “But we know that’s not the case because we have direct measurements of surface emissions matching GHG spectra, and therefore the surface MUST absorb GHG emissions, or Kirchhoff’s law is broken.”
surface emissions matching GHG spectra
but, surface emissions are not caused by the absorbed GHG emissions – the Kirchhof’s law doesn’t say something…
–
https://www.cristos-vournas.com
barry says:
”It seems people denying the GHE deny Kirchhoff’s law that emissivity = absorp.tivity.”
The only people denying that are the folks who believe the equilibrium temperature of the earth to be 255k when in fact according to SB laws and Kirchoff it should be about 278.5K.
Also the foundations of the CO2 theory has huge gaps. Its like the Japanese Kugo death ray that was imagined out of Tesla’s Teleforce.
We have argued this point ad nausem where the warmists rely 100%, and correctly so on the fact that the atmosphere is opaque to IR and that the surface view of the atmosphere is warmer than outerspace.
But where the gap exists in the CO2 theory they don’t continue logically from that point which would be that the atmosphere would first have to get warmer to change the surface climate. Instead the argument is Kugo rays warm the surface with cold molecules up in the atmosphere which then warms the atmosphere.
The CO2 theory seems to suffer from the same problem the Japanese ran into, a lack of a sufficient source of power.
Seems to me the only significant climate change effect that isn’t a slave to gas laws is the unique ability of water vapor to warm the atmosphere at elevations in the atmosphere constantly changing via weather patterns where condensation occurs providing almost to the digit the necessary GHE from 278.5K to 288k at 1/2 of the heat transferred by latent heat into the atmosphere.
IMO, changes in mean annual insolation both from solar changes and celestial object position changes (e.g.barycentric motion) could refute the Al Gore theory but politically that’s not likely to happen anytime soon despite evidence of it being all over the place in observation records and being recognized by NASA for many decades.
Bill,
Sorry, I don’t know any ‘Al Gore’ theory.
“But where the gap exists in the CO2 theory they don’t continue logically from that point which would be that the atmosphere would first have to get warmer to change the surface climate.”
Keeping it as simple as possible but not too simple….
CO2 absorbs upwelling IR – most strongly in the 15um band. Absorp.tion in the 15um band is saturated in the lower troposphere, so the layer at which it can escape to space – the effective emission height – is higher up in the atmosphere, where CO2 is less dense.
Adding CO2 raises the effective emission height. But this layer is colder (lapse rate), so it doesn’t emit as much IR (if nothing else changes). The surface warms to compensate, until radiative balance is restored. The atmosphere is not adding heat to this process, it is simply slowing the rate at which heat escapes.
It’s like throwing a second blanket over you. The heat from your body takes longer to escape to the room. The colder second blanket has to warm up in order to equilibrate between the heat beneath and the colder room, so the first blanket gets a little warmer, as it is no longer giving its heat up directly to the room, but now to a warming blanket above. Heat loss from the first blanket is slowed. The heat you are supplying it is steady. What happens when a heated object has its rate of heat loss slowed? It gets warmer. This is the convective analogy for the radiative action in the enhanced GHE. There’s no 2nd Law violation in either, because the 2nd Law is about bulk heat, not vectors of radiation.
barry claims he doesn’t “know any ‘Al Gore’ theory”, then goes on to explain the ‘Al Gore’ theory, which is just his cult’s nonsense.
He’s STILL trying to claim all photons are the same. The 15μ photon can’t warm Earth’s 288K surface temperature. barry is STILL trying to boil water with ice cubes.
barry hasn’t learned that endlessly repeating nonsense does NOT make it valid. He should have learned that from gordon and Bindi….
“The 15um photon can’t warm Earth’s 288K surface temperature”
A photon at that wavelength carries a specific amount of energy, and yes, all photons at exactly that wavelength carry the exact same amount of energy.
More 15 um photons striking the same surface at the same time provide more energy than one.
A 15um photon does not come from an object at a fixed temperature. That 15um photon can come from an object at any temperature. It can’t come from all gases, though, as gas molecules emit in discrete bands. CO2 emits in the 15um band most strongly, and this is the case whether the CO2 molecule is in a layer of air at 30 C or -30 C.
You seem to be connecting the wavelength of a photon with some set temperature. If so, this is a fundamentally flawed view of the matter.
Enough 15 um photons could melt an ice cube – all they are doing is adding energy, and at a certain level of constant bombardment the amount of internal energy increase will be sufficient to break the crystal structure and melt the cube. 15um isn’t a function of temperature, it’s a function of energy.
…
I just asked an AI if enough 15um photons could melt an ice cube. It replied that 5.04 X 10^23 photons could melt a 20g ice cube at 0C.
barry says:
”Sorry, I don’t know any ‘Al Gore’ theory.”
Barry you believe in the popular science theory espoused by Al Gore. He created it from a non-theory developed by Dr Roger Revelle while taking an undergraduate class from him at Harvard.
Dr. Revelle was working on the idea but never developed his view into a published theory during his lifetime. Al Gore though with the power of the US government budget did develop it into a popular theory that really has no or established scientific proof behind it.
What we do have is a lot of models based upon the idea that the undocumented theory is true and their performance has been abysmal suggesting a strong need to look elsewhere.
Main stream science though is well funded and thus they continue to believe if they keep tweaking the theory they will get to perform. Donald Trump though is a guy that demands results and doesn’t abide with unproductive self centered concerns. He doesn’t demand perfection he demands that tweaks actually start producing results.
We have a GHE but how it is created still needs an improved description.
The Al Gore theory shoots off from the fact that if the atmosphere gets warmer the surface will get warmer also. However the Al Gore theory doesn’t claim the atmosphere needs to get warmer and that all it needs is more CO2 and that the radiation from that additional CO2 will warm the surface which in turn will warm the atmosphere.
Of course obviously since the Al Gore theory is simply an undescribed science theory that suggests that CO2 may not be saturated adequately to work at a full single layer within a narrow temperature band of the troposphere and has more to give. It also posits that should that band be saturated that the long standing theory that posits only water as having the capability to change the lapse rate may be false you can still arrive at the Al Gore Theory.
Nate firmly established that over a year ago when I challenged him to produce a scientific paper underlying the Al Gore Theory.
And the paper he came up with said what I just said in the above paragraph. So Nate and I are apparently still in agreement on this fact and the difference between Nate believing the Al Gore Theory is based purely upon the speculation that the uncertainties identified in the paper don’t exist. And the author himself being paid to produce the paper kind of handwaves the uncertainties to the side as well as his opinion. With Al Gore as the father of global warming (being the money guy) and Dr. Roger Revelle recognized as the ”Grandfather”, which he is recognized as such; one can say that Revelle recognized the uncertainties in every presentation on the matter I saw him give during his lifetime demoting it in Revelle’s mind to the status of a concern that needed more research and he spent much of his time promoting that need.
So while Al Gore might not be the first guy that jumped to the conclusion, he clearly was its best salesman.
“Nate firmly established that over a year ago when I challenged him to produce a scientific paper underlying the Al Gore Theory.”
We may all be in agreement that Al Gore never published a scientific paper in his life. So instead of chasing ghosts let’s talk about the extant greenhouse theory.
barry says:
”We may all be in agreement that Al Gore never published a scientific paper in his life. So instead of chasing ghosts let’s talk about the extant greenhouse theory.”
Lol! there is no extant co2 based GHT to create one, one has to put at least a dent in the long known uncertainties. al Gore leading the charge has had by far created the largest noise, but no dent has been observed.
IMO, the mechanisms of the Milankovic theory lays a foundation itemized by hays etal that is applicable to nonlinear orbital effects making up the lionshare of climate changes. so the question isn’t at all if but instead begs for more organized observation and quantification of the obvious physics to see what might be lrft over for attribution to unidentified objects or to cyclical or chaotic internal heat sequestrations or releases or changes in solar brightness.
bill, when you deny that there is an extant greenhouse theory, you’re just being nutty.
https://en.wikipedia.org/wiki/Greenhouse_effect#History_of_discovery_and_investigation
Barry you are not keeping up with the discussion.
I said in my original post above that there is a GHE. The article you refer to is an article describing the GHE without pointing to any theory at all. Scanning the article it mostly does just that and I have little to argue about.
It even notes the observation that air with water vapor has an increased GHE which I agree with that because water is unique in how it ”warms” the atmosphere via delivering massive amounts of latent heat into the atmosphere daily where that heat is dissipated in all directions first by warming the atmosphere then having that warming emit more to space and more to the ground in the eventural dissipation of that extra heat to space and then. . .begging like a drug addict for another fix to maintain the temperature. . .which promptly and regularly arrives the next morning.
When the article does get into the topic of CO2 it becomes much more vague as if there might not be any Al Gore Theory. For example it says:
”Some authors have referred to this altitude as the effective radiating level (ERL), and suggest that as the CO2 concentration increases, the ERL must rise to maintain the same mass of CO2 above that level.[82]
This approach is less accurate than accounting for variation in radiation wavelength by emission altitude. However, it can be useful in supporting a simplified understanding of the greenhouse effect.[81] For instance, it can be used to explain how the greenhouse effect increases as the concentration of greenhouse gases increase.”
But of course Nate debunked that as a theory with the paper he produced showing that extant science doesn’t support that, thus its proper name is the Al Gore Hypothesis and not the Al Gore theory, except that millions do believe in the Al Gore Theory.
The article goes on to say that other persons before Al Gore proposed similar if not the same hypotheses. Its just that Al Gore repopularized it by a multi-billion dollar marketing program using the resources of the US government.
But it’s not a genuine theory because to have a genuine theory you need to punch through extant science with substantial evidence to support this idea. You stuff like hot spots and all that that come and go leaving nothing correlated to the increases in CO2.
And the claim that has occurred appears to be a unicorn and is why I challenged Nate to produce that advance of science and he came up with was a paper that stated a hypothesis begging to be tested and promoted to the level of theory.
Of course politically leaning scientists don’t feel the need to do that and prove that the GHE variability provided by water vapor, which locally saturates, and then condenses, but not globally is not provided by the latent heat it releases instead of radiation steadily increasing without an increase in atmospheric heat content.
Quite simply no evidence exists that establishes that increased amounts of CO2 just passively sitting in the atmosphere and not actively running a conveyor belt of additional heat from the surface is sufficient to increase the GHE.
If you dispute that then you can actually be the first to produce her the paper that scientifically establishes that idea as a genuine theory. Even the guy awarded the Nobel Peace prize in physics for this was puzzled he got the award but said thank you very much.
So you need to be more careful and delineate between a description of an effect and its cause which is established by a complete and tested theory. The thread going on here is about the theory, not the condition. We know that must be a theory to result in the condition and hypotheses have been proposed but not established. Just that its the case that some become deemed so important that they skip over the science to get the result they desire or believe fervently in. Other more level headed scientists tend to have an open mind to anything not established as false and work to try to estimate changing conditions while pondering how those changes occurred. The Al Gores of the world don’t tend to be level headed.
[GILL] I said in my original post above that there is a GHE.
[ALSO GILL] In fact to this day Jupiter and Saturn are the only recognized explanation for the observed approximate 100,000 year interglacial periods, but it seems obvious that its more than just Jupiter and Saturn is begging for a modeling effort to narrow the gaps in our understanding of decadal, centennial, and millennial climate changes that belies the Al Gore theory which denies these changes that are obvious in the observation records.
ROFLMAO!
bill,
You’re simply rewriting history. You can’t be that ignorant.
“The existence of the greenhouse effect, while not named as such, was proposed as early as 1824 by Joseph Fourier.[10] The argument and the evidence were further strengthened by Claude Pouillet in 1827 and 1838. In 1856 Eunice Newton Foote demonstrated that the warming effect of the sun is greater for air with water vapour than for dry air, and the effect is even greater with carbon dioxide…
John Tyndall was the first to measure the infrared absorption and emission of various gases and vapors. From 1859 onwards, he showed that the effect was due to a very small proportion of the atmosphere, with the main gases having no effect, and was largely due to water vapor, though small percentages of hydrocarbons and carbon dioxide had a significant effect.[19] The effect was more fully quantified by Svante Arrhenius in 1896, who made the first quantitative prediction of global warming due to a hypothetical doubling of atmospheric carbon dioxide.[20] The term greenhouse was first applied to this phenomenon by Nils Gustaf Ekholm in 1901.[13][14]…”
https://en.wikipedia.org/wiki/Greenhouse_effect#History_of_discovery_and_investigation
“When Callendar compiled measurements of temperatures from the 19th century on, he found they were right. He went on to dig up and evaluate old measurements of atmospheric CO2 concentrations. He concluded that over the past hundred years the concentration of the gas had increased by about 10%. This rise, Callendar asserted, could explain the observed warming. For he understood (perhaps from Hulburt’s calculation) that even if the CO2 in the atmosphere did already absorb all the heat radiation passing through, adding more of the gas would raise the height in the atmosphere where the crucial absorption took place. That, he calculated, would make for warming…”
https://history.aip.org/climate/co2.htm
CO2’s role in greenhouse theory was developed well before Al Gore was even born
“By 1956, such computations could be carried out thanks to the increasing power of digital computers. The physicist Gilbert N. Plass took up the challenge of calculating the transmission of radiation through the atmosphere (he too did it out of sheer curiosity, as a diversion from his regular work making calculations for weapon engineers). He nailed down the likelihood that adding more CO2 would increase the interference with infrared radiation. Going beyond this qualitative result, Plass calculated that doubling the level would bring a 3-4C rise…”
Not to mention ancillary research that buttressed theory:
“In 1955, the chemist Hans Suess reported an analysis of wood from trees grown over the past century, finding that the newer the wood, the higher its ratio of plain carbon to carbon-14. He had detected an increase of fossil carbon in the atmosphere….
Revelle did not at first recognize the full significance of his work. He made a calculation in which he assumed that industry would emit CO2 at a constant rate (like most people at the time, he scarcely grasped how explosively population and industry were rising). This gave a prediction that the concentration in the air would level off after a few centuries, with an increase of no more than 40%. Revelle did note that greenhouse effect warming “may become significant during future decades if industrial fuel combustion continues to rise exponentially.” He also wrote that “Human beings are now carrying out a large scale geophysical experiment of a kind that could not have happened in the past nor be reproduced in the future…
n 1959 two meteorologists in Sweden, Bert Bolin and Erik Eriksson, caught on. They explained the seawater buffering clearly — so clearly that during the next few years, some scientists cited Bolin and Eriksson’s paper for this decisive insight rather than Revelle and Suess’s (only in later years was Revelle always cited for the discovery).
The central insight was that although seawater did rapidly absorb CO2, most of the added gas would promptly evaporate back into the air before the slow oceanic circulation swept it into the abyss. To be sure, the chemistry of air and seawater would eventually reach an equilibrium — but that would take thousands of years. Arrhenius had not concerned himself with timescales shorter than that, but in the 1950s some geoscientists were beginning to pay attention to faster changes. Bolin and Eriksson predicted (correctly, as it turned out) that atmospheric CO2 would rise exponentially…”
This is all before Gore had become a teengager. The warming of the surface from increasing CO2 concentrations was a mature theory before he left high school, and well before he became a public figure and made a movie about it.
It was Thatcher and Reagan, 2 conservative leaders, that led the charge to create the IPCC, primarily impelled by the then large body of science and scientific consensus on the risk of global warming from CO2 accumulating in the atmosphere. Gore didn’t make this happen.
Even in 1958 the theory was televised in the US.
https://www.youtube.com/watch?v=T6YyvdYPrhY
By amusing coincidence, the description of that video says:
“Even in the 1950s it was known that we were affecting the earth’s average temperature. It was of course not something Al Gore made up in 2006…”
Gore added some urgency with his film, perhaps, but it is the laziest denialist revisionism to crown him the primary source of the enhanced GHE due to CO2. This was already a mature theory and was largely responsible for two conservative leaders establishing the IPCC.
Don’t be an eejit, bill.
Barry to simplify what I said for simpletons is that yes there is a GHE. And yes many scientists throughout history speculated it might be due to CO2.
The Al Gore Theory is the backradiation theory espoused and popularized by Al Gore. Can you find a science paper that claims that increasing CO2 can warm the surface without first warming the atmosphere?
I asked Nate to do this and we have discussed that at length. Now you seem to be embarked on some idea of disclaiming the Al Gore Greenhouse theory as if it’s any different than anything you have posted in this thread about the ”extant greenhouse theory”.
I will simply ask you, as I asked Nate, to post the study that convinced you that CO2 is the keystone species that creates the GHE.
After you do that then maybe we can make some progress and we can also establish whether you have really considered it or just went along with the mob.
This is such a waste of time, bill. The notion of backradiation has been around for decades, Al Gore didn’t invent it.
And if Gore said somewhere (you don’t bother to quote him) that the atmosphere sends radiation back to the surface and ewarms it, so what? This makes zero difference to the science of the GHE. Gore is a politician. If his rendition of the GHE is too naive or lopsided according to you, it is immaterial to the actualities.
It gets tedious talking about the optics of this. Why are we even bothering with the thoughts of a politician? People don’t agree the world is warming from GHGs because of his description of it as the atmosphere warming the surface without itself getting warmer. The vast majority of people couldn’t even get the far into the description.
This is pointless.
“But of course Nate debunked that as a theory with the paper he produced showing that extant science doesn’t support that”
FALSE!
The opposite is true. The paper explicitly supports the theory!
barry says:
”This is such a waste of time, bill. The notion of backradiation has been around for decades, Al Gore didn’t invent it.
And if Gore said somewhere (you don’t bother to quote him) that the atmosphere sends radiation back to the surface and ewarms it, so what?”
——————
Its already been conceded here Barry that you have to warm the atmosphere to warm the surface. That has been claimed a thousand times in here when warmists tell us that we have greenhouse effect because the atmosphere is not as cold as outerspace.
Thus you have no study that establishes it scientifically, thus as your ignoring my request to actually produce a study that proves what you are claiming.
You can’t do that because none exists. Its strictly a mesmerizing myth made into a popular theory by Al Gore so it deserves the name the Al Gore Theory.
If I am wrong about then post the evidence.
barry says:
”This makes zero difference to the science of the GHE. Gore is a politician. If his rendition of the GHE is too naive or lopsided according to you, it is immaterial to the actualities.
It gets tedious talking about the optics of this. Why are we even bothering with the thoughts of a politician? People don’t agree the world is warming from GHGs because of his description of it as the atmosphere warming the surface without itself getting warmer. The vast majority of people couldn’t even get the far into the description.
This is pointless.”
It is all pointless until you post the evidence of how it actually works.
If you won’t commit to an observation that clearly and unequivocally supports your hypothesis you are left with a warming atmosphere and surface that we don’t have a quantitative answer as to how its occurring. That’s the bottom line.
Even the greenplate theory requires a warming view and how the view is warming if the surface isn’t warming from the sun by simply adding few molecules to an already saturated view (saturated for all material intents and purposes) the bottom line is there is no climate crisis from CO2 emissions and everybody but the nutcases know thats true.
Nate says:
December 12, 2025 at 9:25 AM
“But of course Nate debunked that as a theory with the paper he produced showing that extant science doesn’t support that”
FALSE!
The opposite is true. The paper explicitly supports the theory!
—————
I will reply here to this because its integral to my discourse with Barry. Nate your study simply assumes that saturation doesn’t exist and makes assumptions about the nature of the atmosphere in dispute with meteorological hypotheses used for centuries. And does so without producing anything but a handwave as evidence.
Sure one can believe in Santa Claus and after that its easy to claim he slides down the chimney on Xmas eve to deliver gifts.
I have been waiting for years for evidence. You were challenged and all you could come up with is a theory Santa Clause exists. And of course Barry hasn’t come up with anything. Instead he posted extensive descriptions of the GHE without a single cohesive and established theory of what causes it.
He can’t even produce what caused him to believe in it. Suggesting he is just following the Pied Piper (aka Al Gore) all the while denying it.
“It is all pointless until you post the evidence of how it actually works.”
No, rabbiting on about some “Al Gore theory” is completely pointless if what you are actually interested in is a referenced description of how the enhanced GHE works from additional atmospheric CO2.
It’s even more pointless because it doesn’t tell us where there are holes in your knowledge. What do YOU think is missing? That’s far more instantly engaging than some nebulous theory by a politician that never got published.
So, over the years people have here provided referenced material for and empirical evidence of:
The IR absorp.tive properties of CO2 and the surface
Satellite and ground-based measurements of radiance brightness in the bands associated with CO2, confirming the occlusion of of upwelling IR in the 15um range from aloft, and increased emission in those same bands heading to the surface from the atmosphere, confirming the spectral effect from aloft and below of increased CO2 in the atmosphere, tracked over time. These findings are complimentary, as expected.
We have empirical evidence of the warming of the surface and the troposphere, as well as the cooling of the stratosphere – a signature of greenhouse warming.
Globally nights are warming faster than days – another signature of GHG warming (as opposed to the sun, which would have the opposite effect).
Same with faster warming Winters than Summers at high latitudes across each hemisphere.
Faster warming at the poles – not typical of a pattern associated with insolation increase. However, orbital mechanics could make insolation the primary driver of faster polar warming, however, the current orbital parameters don’t support, and the current rate is faster than previous – geological – changes.
Cooling of the mesosphere and thermosphere – observations agan are consistent with greenhouse warming, not solar warming.
We have empirical evidence of rising CO2 and rising surface temperatures, particularly from when emissions and atmospheric accumulation accelerated from around 1970.
We have empirical evidence of the CO2 rise coming from fossil fuel burning, and empirical evidence corroborating surface warming from thousands of proxies, such as sea level rise, global glacier retreat, flora and fauna migration patterns over time etc.
I’m happy to provide references for any of these if you’re really going to check them out and not just be argumentative. Only the ones you truly doubt though.
Or is it the physics of the matter that you have issue with, even after all the corroborative evidence and the ‘fingerprint’ evidence of GHG/CO2 warming?
barry says:
” ”It is all pointless until you post the evidence of how it actually works.”
No, rabbiting on about some “Al Gore theory” is completely pointless if what you are actually interested in is a referenced description of how the enhanced GHE works from additional atmospheric CO2.”
Well OBVIOUSLY you continue to refuse to provide the support wrt to why you believe in the Al Gore Theory and want to just bury it as indeed it has been getting embarrassing for you. And it should. But how do you explain this to Greta Thunberg and the hordes of scientists over the past 25 years preaching imminent doom?
WRT to how the enhanced GHE is assumed to work it lacks any evidence of being true to the extent that when the models don’t perform they keep plowing ahead anyhow.
Meanwhile, alternative theories are just ignored in the best traditions of the CIC and special interests.
So your theory isn’t working and special interests influencing funding decisions won’t provide the funding to modernize the Milankovic mechanisms and address the concerns of Hays et al that the 100,000 year eccentricity variable isn’t linear. IMO, that is an astonishing abrogation of the public trust.
We have probably spent will over a trillion dollars pursuing one theory and aren’t moving any closer to validating it.
So no I don’t understand how the enhanced GHE works as it seems so vague without any additional external input. so the atmosphere must be warmer than the surface to have more to give to the surface, yet if it gives that warmth the atmosphere will cool.
Nate’s source ran up against that problem and simply said:
”The fact that a saturation of the absorptivity of the atmosphere leads to a saturation of the greenhouse effect is directly related to the hypothesis of an isothermal atmosphere. When this simplification is removed and the decrease of temperature with altitude is considered, as is the case in the troposphere, the greenhouse effect can continue to increase even if the absorptivity of the atmosphere is saturated.”
So where is the evidence of that being true?
The folks actually paying attention for a longtime have noted that from the time of Arrhenius estimates of how much warming from CO2 changes that would occur have not only varied widely but had to live through advancing science that discovered that traditional climate change measured by changes the earth had already undergone was in error because the CO2 changes trailed the temperature changes as paleontology dating methods improved. That theory of course is now on the rocks replaced with the Milankovitch theory.
“Well OBVIOUSLY you continue to refuse to provide the support wrt to why you believe in the Al Gore Theory”
There is no theory of the enhanced greenhouse effect that espouses the surface warms while the atmosphere doesn’t. And that is why no one – especially you – can produce a peer-reviewed paper to the contrary.
“WRT to how the enhanced GHE is assumed to work it lacks any evidence of being true to the extent that when the models don’t perform they keep plowing ahead anyhow”
Well this is as wafty as your pap on the “Al Gore theory.”
Which models? What component being modeled?
Do models forecast global warming with increased CO2? Yes. Has CO2 increased? Ye. Has the globe warmed? Yes.
Models are working fine.
Did you mean something more specific? How many posts will it take until you say something precise about this, eventually?
“So no I don’t understand how the enhanced GHE works”
After years of engaging on the topic, you haven’t even bothered to learn the fundamentals. It’s fine to disagree, but not fine to disagree if you don’t even know what you are disagreeing with.
“so the atmosphere must be warmer than the surface to have more to give to the surface, yet if it gives that warmth the atmosphere will cool.”
Yes, you’ve learned nothing. The atmosphere slows the rate at which energy leaves the surface to space. The greenhouse effect is a regulator of that function. Heat doesn’t shift like some bundled quantity from the atmosphere to the surface. The whole system processes energy through absorp/tion and reemission, through convection and collision, and the rate at which that energy is processed regulates the temperature of the surface (and atmospheric layers).
“The folks actually paying attention for a longtime have noted that from the time of Arrhenius estimates of how much warming from CO2 changes that would occur have not only varied widely…”
Estimates have varied very little over the last 50 years as the science has been refined. Mind you, they’re not a lot different from Arrhenius’s estimates, which were a bit higher (5-6C / doubling CO2), and which fall in the very upper range of modern estimates.
“traditional climate change measured by changes the earth had already undergone was in error because the CO2 changes trailed the temperature changes as paleontology dating methods improved”
The lead/lag observations are well-known and well incorporated into the understanding of the greenhouse effect. This didn’t upend working theories at all, except in your imagination.
You appear to have learned very little about the actual science of enhanced greenhouse warming. You are repeating tedious and long-debunked canards from 3 decades ago, as well as inventing some nonsense of your own.
But please – do show where the discovery of CO2 lag to temperature in ice age changes confounded the then understanding of the enhanced GHE. Good luck corroborating this invented notion!
Bill Hunter,
Do yourself a favour and acquaint yourself with the true history of work on ice age cycles, and where and how the greenhouse theory came to be linked to this research.
https://history.aip.org/climate/cycles.htm
Unbind yourself from faulty narratives of how scientific understanding evolved.
barry says:
”Bill Hunter,
Do yourself a favour and acquaint yourself with the true history of work on ice age cycles, and where and how the greenhouse theory came to be linked to this research.
https://history.aip.org/climate/cycles.htm
Unbind yourself from faulty narratives of how scientific understanding evolved.”
Maybe you ought to read you sources Barry. Your link is completely consistent with what I said.
Arrhenius proposed CO2 as an explanation of the changes in historical ice in the late 19th century. Milankovic was 15 turning 16 years of age at the time. Milankovic’s work started around the 1920’s and was not accepted until the 1960’s.
Milankovitch did not overturn Arrhenius, as Arrhenius never claimed CO2 was responsible for the TIMING of the ice ages – there was no data to make any link for THAT. Arrhenius argued that CO2 increase could be responsible for global temperature changes in ice age periods – periods that were not well understood in their duration or number.
Milankovitch’s orbital mechanics provided a theoretical clock for the timing of the ice ages, which was confirmed decades later from ice core drilling. The same ice core work discovered a corresponding but lagged timing of CO2 rise and fall, which ultimately confirmed Arrhenius’ thesis that CO2 is responsible for global temperature changes, amp;ifying the waring already underway from insolation changes at the poles.
Arrhenius’ work was never refuted by geologists – that actually confirmed it.
You seem to be imagining that Arrhenius proposed a timing model of the ice ages based strictly on CO2, which Milankovitch theory supplanted. That is false as Arrhenius proposed several causes for CO2 rise, including warming oceans holding less CO2, resulting in more in the atmosphere – precisely the theory built on the back of Milankovitch cycles warming the polar oceans – particularly the NP.
Far from being at odds, as your fanciful narrative seems to have it. These theories were complimentary. It just took time to get the tools and the data to bind them, as geologists did in Vostok in the 1980s.
You have a weird idea that Milankovitch and Arrhenius has competing theories. They didn’t, they just approached a problem from different places, and it turns out that both theories worked together.
Yes, I do read my sources. And I read further.
But you have the link just above – please quote the bit where Milankovitch overturns Arrhenius. Good luck!
barry says:
”Milankovitch did not overturn Arrhenius, as Arrhenius never claimed CO2 was responsible for the TIMING of the ice ages – there was no data to make any link for THAT. Arrhenius argued that CO2 increase could be responsible for global temperature changes in ice age periods – periods that were not well understood in their duration or number.”
LOL! Well he did about as good as modern science has done unless you consider that the correlation of a single event (the industrial age) is the difference between a scientific link and no scientific link.
I am still waiting for you to provide the paper that explicitly through physics and observation that CO2 is responsible for at least half the warming we have experienced. You haven’t been able to do that but I assume that you assume a link today.
I can agree that maybe Arrhenius didn’t meet your standard but modern science did. But the fact is Arrhenius by way of historic links was motivated in his research to find the cause of the ice age and claimed CO2 as a capable effect.
I can also agree he was probably a better scientist than the charlatans who have been running around for the past 5 or 6 decades loudly claiming a link and testifying to political bodies which I assume Arrhenius didn’t. But he influenced a lot of people and still does today.
https://www.sciencehistory.org/stories/magazine/future-calculations/
”Arrhenius was primarily interested in the causes of the ice ages”
https://tinyurl.com/2fbamcp6
barry says:
”Milankovitch did not overturn Arrhenius, as Arrhenius never claimed CO2 was responsible for the TIMING of the ice ages – there was no data to make any link for THAT. Arrhenius argued that CO2 increase could be responsible for global temperature changes in ice age periods – periods that were not well understood in their duration or number.”
LOL! Well if you consider that the correlation of a single event (the industrial age) is the difference between a scientific link and no scientific link.
Beyond that what wasn’t contributed by Arrhenius?
I am still waiting for you to provide the paper that explicitly through physics and observation that CO2 is responsible for at least half the warming we have experienced.
Arrhenius was motivated in his research to find the cause of the ice age. But I agree he didn’t declare the matter settled.
“I am still waiting for you to provide the paper that explicitly through physics and observation that CO2 is responsible for at least half the warming we have experienced.”
STILL waiting? You never once asked for that in this discussion.
You’re all over the place, bill.
I’ll remind you of what you said.
1. There is an “Al Gore” theory that supposedly posits the GHE warms the surface without the atmosphere getting warmer.
What a hoot! No one can produce any evidence this is a theory. Not you. Not us. But somehow you keep saying it is a theory.
If lightning strikes a strawman in a forest and nobody witnesses it, does it burn?
2. Models fail the enhanced GHE theory – but specifically for CO2. Water vapour is a greenhouse gas…
Well models with enhanced CO2 warm. And in real life… no problem then.
3. Milankovitch proved Arrhenius wrong.
bill Mk2 – well no he didn’t.
So, models work in general. There is solid science behind CO2 arming, from empirical spectral measurements of CO2 absorp.tion, satellite and ground-based measurements of spectral darkening/brightening in those bands, ‘fingerprints’ of greenhouse warming, like contraction and cooling in upper layers of the atmosphere while the troposphere expands and warms, global nights warming faster than days, global winters warming faster than summers, polar regions warming faster than tropics. And we have the evidence that fossil fuel CO2 is accumulating in the atmosphere and the oceans.
And much, much more evidence.
How do you manage to overlook all of this?
Oh, you already said:
“I don’t understand how the enhanced GHE works”
I think we’ve found the problem. As you’ve been talking with very knowledgeable people about it for quite some time, I suspect you will never understand it.
barry says:
”STILL waiting? You never once asked for that in this discussion.
You’re all over the place, bill.”
Sure I did! I said in this thread: ”If you dispute that then you can actually be the first to produce her the paper that scientifically establishes that idea as a genuine theory.”
barry says:
”I’ll remind you of what you said.
1. There is an “Al Gore” theory that supposedly posits the GHE warms the surface without the atmosphere getting warmer.”
That’s what you believe and that’s the Al Gore theory that additional CO2 in the atmosphere increases the surface forcing and upon that occurring the surface then warms the atmosphere. What do you think you have been arguing with Clint about wrt to 15u photons?
barry says:
”So, models work in general. There is solid science behind CO2 arming, from empirical spectral measurements of CO2 absorp.tion, satellite and ground-based measurements of spectral darkening/brightening in those bands, ‘fingerprints’ of greenhouse warming”
Broadening of spectral bands are seen via the interaction of water and CO2.
But water vapor doesn’t condense until it reaches a specific altitude/temperature profile so broadening of the spectral lines is not an indicator of significant warming but instead just an indicator of increasing CO2 which we already know about.
Further, the ultimate questions aren’t that CO2 is absorbing light and increasing; the question is how does that affect the surface.
Thats the paper you were asked to produce as it deals with the issues of saturation and the falsification of the current isothermic atmosphere hypothesis that doesn’t have an entry for CO2.
I have always admitted a degree of certainty that increasing CO2 will cause some warming. But of course the question is how much.
Current assumption its more than all of it which I think is a joke. The ~900 year pattern of just Jupiter and Saturn call that out and has never been rejected since it has been a key element of NASA for many decades. Uranus and Neptune are certainly factors due to their long orbit period and create a ~3,500 year cycle. These patterns are seen in ice cores and not attributable to either precession of tilt changes and since at least sometime within the LIA we hit the bottom of the dominant cycle coming dutifully ~450 years past the MWP beginning approximately in the 13th century and of course the Roman Optimum came ~900 years before that. And to the Uranus/Neptune ~3,500 year cycle well that would take us back to the Minoan Warm Period that was the tallest of the whole bunch.
And of course the bigger ice age switching between major glacials and interglacials involves stuff we don’t fully understand but is believed to be a frequency variation of these orbital effects that builds of over thousands of years of ice accumulation and retreat and influenced by the tilt and precession variations.
Poor old Milankovic only had way out of date ephemeris and a slide rule and despite massive improvements on both its heresy to suggest a model and an update.
Barry says:
”like contraction and cooling in upper layers of the atmosphere while the troposphere expands and warms, global nights warming faster than days, global winters warming faster than summers, polar regions warming faster than tropics. And we have the evidence that fossil fuel CO2 is accumulating in the atmosphere and the oceans.”
Well we know water vapor changes is influenced by any kind of surface or atmosphere warming, especially changes in insolation. And we know that water vapor does change the lapse rate thus warming the atmosphere when water vapor is at its highest. So none of that has yet been attributed to CO2. Since water variation is seen along with gas pressure laws as the variables of what would be an isothermic atmosphere without them you aren’t making any progress with those arguments.
Barry says:
”And much, much more evidence.”
Apparently not worth mentioning.
Barry says:
”How do you manage to overlook all of this?”
See above.
Barry says:
Oh, you already said:
” “I don’t understand how the enhanced GHE works”
I think we’ve found the problem. As you’ve been talking with very knowledgeable people about it for quite some time, I suspect you will never understand it.”
I explicitly outlined the holes in the theory above and have done repeatedly, and asked you to fill them in. . .to which you reply you don’t understand why I don’t understand. If you can’t understand the issues related to saturation and to isometric atmosphere hypothesis you will not understand why your theory is incomplete.
“Sure I did! I said in this thread: “If you dispute that then you can actually be the first to produce her the paper that scientifically establishes that idea as a genuine theory.” ”
Lord, you just aren’t following your own side of the conversation. When you said the above you were referring to:
“Quite simply no evidence exists that establishes that increased amounts of CO2 just passively sitting in the atmosphere and not actively running a conveyor belt of additional heat from the surface is sufficient to increase the GHE.”
This is NOT the same posit as:
“I am still waiting for you to provide the paper that explicitly through physics and observation that CO2 is responsible for at least half the warming we have experienced.
That was the first time you mentioned magnitude of the enhanced GHE.
As for the first quote – you are entirely – supremely – ignorant of the topic if you think AGW theory posits heat being moved from the atmosphere to the surface.
This is bone-headedly wrong. That’s not how it works. And it would be foolish to imagine you could be dissuaded from this atrociously misinformed view if you still hold it after years supposedly informing yourself.
What a wretched waste of time you’ve spent “learning” about AGW.
Barry says:
”This is NOT the same posit as:”
what difference does make when you can’t answer any of them?
“what difference does make when you can’t answer any of them?”
What difference does it make that you can’t remember what you’ve said in a conversation? It means that no progress can be made in the conversation, because your brain empties the discourse out and we have to loop back to square one all the time.
Which dovetails neatly with your admission that you don’t understand the enhanced GHE. You’ve been explained many times and you simply can’t retain it. Hence the cartoon wrongness of a “conveyor belt” moving heat from the atmosphere to the surface. That is so NOT what anyone here or anyone else purports.
And I’ve explained the way the enhanced GHE works, the history of the research on it AND described the evidence for it that corroborated several predictions about – yet again – in this very thread.
Here, here, here, here.
Apparently your mind is extremely porous.
Of the many paragraphs you write above that are way off base, I’ll choose this one.
“That’s what you believe and that’s the Al Gore theory that additional CO2 in the atmosphere increases the surface forcing and upon that occurring the surface then warms the atmosphere. What do you think you have been arguing with Clint about wrt to 15u photons?”
Let’s break it down.
“That’s what you believe…”
That’s not what I believe. As you’ve been told.
Mind. Sieve.
“that’s the Al Gore theory that additional CO2 in the atmosphere increases the surface forcing and upon that occurring the surface then warms the atmosphere”
When will you corroborate that this is what Al Gore espouses? Answer. Never.
“What do you think you have been arguing with Clint about wrt to 15u photons?”
I’ve said a few things.
1. It doesn’t matter the source temperature for 15um photons WRT to absorp.tion. The warmer surface readily absorbs photons of any wavelength that the surface emits, irrespective of temperature of the source or surface.
2. 15um is well within the major absorp.tion range of the surface, which emits strongly from 4um to 40um – and per
Kirchhoff’s Law absorbs equally in that range.
These poins have NOTHING to do with your fixation on the atmosphere failing to warm as the surface does. The atmosphere ALSO absorbs 15um photons, and heat (in the classic sense) NEVER flows from the atmosphere to the surface, just as adding a blanket making you warmer does not transport heat from the blanket to your body.
The atmosphere and the blanket REGULATE heat loss from the warmed surface. How do you not get this after all these years?
So, that was ONE paragraph. My posts would be endless if I picked up on every bit of nonsense you post.
How about you learn about the enhanced GHE properly, and then state your case clearly and precisely about why you think it doesn’t work?
barry says:
” ”what difference does make when you can’t answer any of them?”
What difference does it make that you can’t remember what you’ve said in a conversation? It means that no progress can be made in the conversation, because your brain empties the discourse out and we have to loop back to square one all the time.
——————
No its your refusal to engage in the key issues. I pointed out the paper Nate provided that made two assumptions not supported by any science.
All my other questions worded perhaps in different ways are all subject to those uncertainties. Current models don’t address them and the modelers do not want to address them. They want to avoid them so they can pretend current science promotes additional full-fledged warming from increased CO2 despite that being currently in the tank simply from poor model performance issues and the lack of dealing with short and midterm Milankovic orbital effects.
So take on the issue of saturation and the closely related issue wrt to the inability of CO2, unlike water and the gas laws, to change the lapse rate.
If you don’t go straight to that with an honest effort all you are doing is obfuscating.
bill,
You must relieve yourself of the notion that the atmosphere delivers heat to the surface.
Increases in GHGs regulate the escape of upward radiation to space. The atmosphere radiates in all directions, including to the surface and within itself.
An increase in distributed energy affects the whole column, from the surface to the effective emission layer (and beyond). So, the surface and the atmosphere warm at the same time.
The ‘saturated’ layer near the surface continues to absorb more IR as a result of pressure broadening. This finding is corroborated in two ways – by satellite spectroscopy and by laboratory experiment. They confirm each other. Even the CO2 saturated layers are only saturated in the centre of the absorp.tion band, not the ‘wings’ either side.
And even if this were not true, there is no doubt (as you seem to suggest otherwise above), that atmospheric gases thin out with altitude, including CO2, and that saturation does not extend to the effective emission height. Saturation requires a critical density of molecules, which in the real atmosphere tapers off with height.
We have unimpeachable evidence of the lapse rate.
We also have good evidence of a rising effective emission layer. The height of the tropopause is an excellent proxy for effective emission height, and we have clear evidence it has risen.
We also have empirical evidence of darkening of the spectral bands in the atmosphere that demonstrate both the increase of CO2, as well as the effect this has on upwelling and downwelling radiation passing between the atmosphere and surface and out to space.
As if these ‘fingerprints’ weren’t enough, we also have more fingerprints of specifically greenhouse warming (as opposed to solar or volcanic, for example). Cooling stratosphere, shrinking mesosphere, thermosphere, nights warming faster than days (global av), winters warming faster than summers, poles warming faster than tropics, etc.
The evidence for CO2 warming is extensive, often checked and repeated, comes from a multitude of different approaches, and they all corroborate the understanding and the predictions about how the Earth would warm under GHG increase, that were made long before we had the tools to discover how well those predictions did: such as cooling stratosphere, nights warming faster than days, poles warming faster than lower latitudes, winters warming faster than summers.
I cannot understand how anyone who has properly looked into the issue can so blithely claim there is no evidence for it. The trove of it is vast and multifaceted, from lab spectroscopy to lidar retrieval, from millions and millions of empirical measurements corroborating a mature theory that is now 160 years old. Arrhenius considered that CO2 could amplify temperature changes from small perturbations that clocked ice age shifts. 90 years later his theory was buttressed by the discovery that CO2 did indeed track ice age shifts, lagging by a few hundred years, amplifying the small perturbation of insolation changes due to orbital variation.
Imagine that. Arrhenius’ prediction was found to be correct. CO2 concentration HAS changed with each ice age epoch.
And this is only one tiny piece of the evidence massed that supports the understanding of the enhanced GHE.
Now, do you need references for any of this? Do you yet understand that the atmosphere regulates heat LOSS, it does not ADD heat?
Dr Spencer has explained many times that the atmosphere regulates the planet’s thermal loss. It’s not an activist’s idea. It’s not bad science. Even qualified ‘skeptics’ know the enhanced GHE is well-supported.
Barry says:
”An increase in distributed energy affects the whole column, from the surface to the effective emission layer (and beyond). So, the surface and the atmosphere warm at the same time.”
LOL! Oh really Barry. I have never heard that version of the story. You will need to provide sources supporting your astoundingly unique claim. Of course you won’t because clearly you can’t.
If energy throughout the ”whole column” increases more energy goes to space so you have more system cooling not warming on the basis of no change in external input. For this to be otherwise, one would have to throw out the Stefan Boltzmann law.
Further Nate’s source on this admits to the uncertainty of the saturation principle and the isothermal atmosphere hypothesis such that the work he does in the paper would establish a reasonable means of warming if both of his uncertainties were of no concern.
So obviously Nate’s source had no answer for it, thus Nate has no answer for it, and you. . .well seems to me you just have no idea at all wrt to this.
So man up here and admit you have little idea what you are arguing about. IMHO, there is no coming back from where you have gone. That obviously cannot be blamed on a typo.
bill,
“I have never heard that version of the story. You will need to provide sources supporting your astoundingly unique claim”
It’s like you live in an alternate universe
Many of the seminal papers on GHG warming describe both the surface and the atmosphere warming.
Eg, Manabe and Weatherald 1967: Thermal Equilibrium of the Atmosphere with a Given Distribution of Relative Humidity
https://journals.ametsoc.org/view/journals/atsc/24/3/1520-0469_1967_024_0241_teotaw_2_0_co_2.xml?tab_body=pdf
Page 243, summary and conclusions, mentioning the sensitivity of the surface to the atmosphere is twice as large to warming from various factors including CO2 rise.
How have you NOT understood this?
There’s more: Ramanathan and Coakley 1978:
https://ramanathan.ucsd.edu/wp-content/uploads/sites/460/2017/10/pr15.pdf
Throughout, this seminal work makes it clear that, as well as various feedbacks of opposite sign, the troposphere and the surface warm and cool together, though at different rates to perturbation.
The Charney Report, too, notes the simultaneous rise in temperature in troposphere and surface from a doubling of CO2.
https://geosci.uchicago.edu/~archer/warming_papers/charney.1979.report.pdf
Have a look at 3.1, Direct Radiative Effects.
I could go on and on, citing climate model reports, seminars, and hundreds of sources. But these are some of the seminal works, not some blog or newspaper wrap-up.
Perhaps you’ve been confused by more popular tracts, that emphasise the radiative effects on the surface – where we live – over the rest of the atmosphere.
Whatever the case, you are appallingly deficient in your understanding, and the view laid out in these seminal [a[ers is not “astoundingly unique,” it is standard.
I can’t believe you are so blithely and hubristically ignorant of the basic concepts of the enhanced GHE.
Mo wonder you claim to have no understanding!
Barry says:
”Mo wonder you claim to have no understanding!”
Indeed Barry that is 3 impressive modeling papers that describes an idea of how heat transfer might work in the atmosphere.
But none of what they describe has any basic science that establishes that the atmosphere works that way.
All three papers fall down in addressing the two points of saturation and the falsification of the isothermal atmosphere hypothesis.
You did not provide a single paper on basic science and only provided papers on modeling efforts based upon heretosofar assumptions that have no basis in basic science on the key questions I mentioned that Nate’s source brought up and cast out with a wave of the hand.
But worse for your cause is Manabe (lead author of your first paper) actually acknowledged that he did nothing wrt to those issues in a separate communication.
And much worse for you the Charney report you linked to did the same thing in the paper in the last paragraph.
In the last paragraph they acknowledge that we really don’t know but that its worth studying. And they specifically acknowledged simplified assumptions (same as Nate’s source) that could completely destroy (vitiate) any rational threat from anthropogenic CO2.
So you ignorantly concluded as you proudly put that stuff up that I don’t know what I am talking about.
Yet the most recent and most reputable of the bunch acknowledges exactly what I said.
The National Academy of Sciences, men of impeccable credentials, acknowledges those same uncertainties that are so uncertain that they could completely nullify model outputs.
Its hilarious you mocking a lack of understanding as if you had one shred of it yourself.
Meanwhile I have acknowledged that mankind is responsible for some warming of the planet but the fact is only we know is the planet naturally warms and currently is warming. However the science community has not offered up any well modeled rationalization for why or how much of the warming is naturally, which I am convinced it is.
So when are you going to figure out what’s going on Barry? Ever?
Special interests profit from treating the public like a mushroom farm, keeping us in the dark and feeding us shiit. You seem to be a happy camper about it. Why is that?
You’re just moving the goalposts, bill, and forgetting conversation.
YOU derided the notion that the enhanced GHE includes the atmosphere and surface warming at the same time.
You said:
“Oh really Barry. I have never heard that version of the story. You will need to provide sources supporting your astoundingly unique claim. Of course you won’t because clearly you can’t.”
Well, I did, in some of the groundbreaking ad most often cited papers on the matter.
Where is your acknowledgement that you were wrong? That surface + atmosphere warming is NOT an “astoundingly unique claim.” but fundamental to the theory – in these fundamental papers on it?
THIS must be why you never learn anything. You just drop the matter entirely, move on to another talking point, forgetting you just got the evidence you laughingly assumed didn’t exist.
And when I bring up papers on saturtation, you ignore them and move onto yet another thing – probably “the models are wrong!”
I’ve already talked about saturation here and you’ve ignored the substance.
Before we move on to (go back to) saturation or whatever other reflex contrariness you come up with, let’s see if we have rectified your misapprehension that the enhanced GHE with waring surface AND atmosphere is not a “unique claim” but standard.
Because if you don’t deal with what you snidely dismissed, then I know for sure it’s a waste of time talking to a sieve,
barry says:
”Well, I did, in some of the groundbreaking ad most often cited papers on the matter.
Where is your acknowledgement that you were wrong? That surface + atmosphere warming is NOT an “astoundingly unique claim.” but fundamental to the theory – in these fundamental papers on it?”
—————
Why should I acknowledge that Barry? Your own sources confirm that your claim is false. Check out Fig 16 for Manabe/wetherald.
You OTOH can’t be as specific as that as you have nothing to support your claim which is: ”An increase in distributed energy affects the whole column, from the surface to the effective emission layer (and beyond). So, the surface and the atmosphere warm at the same time.”
Figure 16 of your Manabe and Wetherald source shows that to be false and you now have to falsify your own source to show that you are right. You might consider to stop digging Barry. All you are doing is burying yourself.
bill,
Fig 16 shows different temps throughout the troposphere and surface for different CO2 concentrations.
On the next page it describes the graph. The first sentence is:
1) The larger the mixing ratio of CO2, the warmer is the equilibrium temperature of the troposphere and the surface.
Did you flick thru the paper without your glasses to try and find something that says the opposite of what I already pointed out to you in the conclusion? Did you read the conclusion, or ignore it while you desperately tried to deny what the paper says?
You’re not going to pull your head out of the sand, are you?
You are in classic denial. Everything that goes against your view you filter out, and look for any tittle – even filtering out lines in a graph – that supports it.
The fact that the enhanced GHE is predicted to warm the troposphere and the surface at the same time is standard knowledge and the standard view.
But now that you’ve committed to the crank view that the theory has the surface warming but not the atmosphere, you are in hot denial when seminal papers say exactly the opposite of what you have criticised. You’re committed to this straw man no matter what.
This intellectual disingenuous makes you impenetrable to understanding the truth of the matter and a complete waste of effort.
barry says:
”Fig 16 shows different temps throughout the troposphere and surface for different CO2 concentrations. On the next page it describes the graph. The first sentence is: 1) The larger the mixing ratio of CO2, the warmer is the equilibrium temperature of the troposphere and the surface.”
Barry the troposphere is not the whole atmosphere as shown in Figure 16.
You are now admitting you were ignorant of the effect of CO2 in the atmosphere and after a little reading you now think you know it all. Seems typical of your approach.
Barry says:
”But now that you’ve committed to the crank view that the theory has the surface warming but not the atmosphere, you are in hot denial when seminal papers say exactly the opposite of what you have criticised.”
You are still stuck on an unestablished ability of CO2 to get warmer up in the atmosphere via radiation. How do the molecules in the troposphere warm if the stratosphere with CO2 is getting colder?
It seems you believe that CO2 changes from cooling to warming via some undescribed magic trick.
The Charney Report, your third source, leaves the door wide open there to nullify the model calculations you are relying upon. You can build models on scientific laws but you can’t build scientific laws out of models.
And making a scientific law out of a model is exactly what you are trying to do here. Your first two links are models. Your third link is a review of a model by the NAS. Further the NAS did not bless the model because it understands,like I understand, and you don’t understand. . .you can’t build scientific laws out of models.
bill,
“Barry the troposphere is not the whole atmosphere as shown in Figure 16.
You are now admitting you were ignorant of the effect of CO2 in the atmosphere”
I have described the effect of CO2 increase in different layers of the atmosphere for many posts, including the fingerprint of a cooling stratosphere.
You are absolutely hopeless.
YOU are the one who used the term “atmosphere” when describing the ridiculous notion of no change in the atmosphere while the surface warms from CO2 increase.
YOU termed it the “Al Gore theory,” while providing no source for such a claim. Meanwhile I provided landmark, fundamental papers corroborating the dual atmosphere (troposphere)/surface effect that you said was my “unique claim.”
You ignored every time of the many times I said the stratosphere cools in response while the troposphere warms, and are now trying to hang your hat on the few times I’ve said atmosphere, where I followed your own usage.
I delineated the troposphere and stratosphere 14 days ago in this thread, talking to YOU, and many times since,
Your ‘gotcha’ requires you to ignore all those posts.
Meanwhile…
“Barry the troposphere is not the whole atmosphere as shown in Figure 16.
You are now admitting you were ignorant of the effect of CO2 in the atmosphere”
No, the graphic shows the cooling stratosphere and warming troposphere in response to increased CO2, as I’ve been telling you for two weeks.
I quoted point 1) that verifies the troposphere warms while the surface does. Guess what point 2) says, describing the very same figure 16?
2) The larger the mixing ratio of carbon dioxide, the colder is the temperature of the stratosphere.
No, bill, I’ve been describing the standard science accurately here since we began in this thread, drilling down into more detail as you denied everything,
You’re hopeless. Can’t even read a graph.
As you’re never going to admit you were wrong to deride the notion that the atmosphere changes temperature along with the surface change as a result of enhanced CO2, there is no point RE-addressing your pother points, as you will pull the same stunts that helps you stay in denial.
and I would be RE-addressing those points, as you keep on ignoring what I say to your gish gallop of talking points.
You’re pig-ignorant of this matter. And you will never learn. You are unable.
Barry says:
”You are the one who used the term “atmosphere” when describing the ridiculous notion of no change in the atmosphere while the surface warms from CO2 increase.”
Oh so you are going to claim I used the premise that ”the surface warms from CO2 increase”? ROTFLMAO!
Try carefully to understand.
1) we agreed, or at least most of us in here agreed, that the GHE exists because the atmosphere is warmer than outerspace thus slowing cooling of the surface.
Taking that as a premise then for the GHE to increase the atmosphere must ”first” warm more than it is.
2) We have been running down a lot of bunny trails marked by you. First it was yes the whole column must warm at the same time. From that we have
a) no you didn’t mean the whole column and that I confused you and thats not in accordance with your daddy’s Fig 16. So now you say CO2 causes the troposphere to warm and the stratosphere to cool. Whether you did earlier or not doesn’t matter to me.
b) But that doesn’t seem consistent with the idea of all else being the same why increased CO2 acts differently in the troposphere versus the stratosphere. So what is the cause of troposphere warming all else being the same or cooler.
and c) The occurring simultaneously ”at the same time” is not consistent with the notion of an enhanced GHE coming from a warming of the atmosphere. Its atmosphere first that is consistent with that notion suggesting you have simply handwaved away the underlying basic science and everything just magically warms at the same time with no warmer source.
So I accept you becoming confused in 2(a) but you need to go over those (b) and (c) and explain those inconsistencies. Pointing to Fig 16 doesn’t help.
Barry says:
”YOU termed it the “Al Gore theory,” while providing no source for such a claim. Meanwhile I provided landmark, fundamental papers corroborating the dual atmosphere (troposphere)/surface effect that you said was my “unique claim.”
That’s not correct either.
3 a) none of the papers you provided are landmark without first clearing up how the GHE operates in basic science in 2(b) and (c) above. First, all these papers are based on the same model, Second, they are models without underlying basic science issues noted in 2(b) and (c) being clarified in plain English.
3(b) your third paper admitted to uncertainty that could vitiate the entire model. . .meaning of course they couldn’t find the basic science underlying those issues either. I have little to no hope for you as everybody constantly fails at this.
So in fact Fig 16 is what I am disputing. And so far you have not been helpful in the least and being inconsistent, confused, and finally you just point back to Fig 16 and declare that as a fact.
Barry says:
”You’re pig-ignorant of this matter. And you will never learn. You are unable.”
pig-ignorant of what? I thought we agreed on how a GHE is supposed to work. I am agreeing with that. Now I am trying to understand what you think the basic science is underlying the applied science in models.
The Manabe and Wetherald model which Manabe himself admits to being ”applied” science means that basic science lacks a reference and that M&W doesn’t establish the basic science underlying it. Establishing that basic science in plain consistent English is necessary to get the masses to understand it without brow beating them into it.
Worse the Ramathan model takes the same approach. And the Charney report is just a review of several other similar models.
Charney on behalf of the NAS notes the uncertainty of those models in bulk saying uncertainty could nullify them all.
Obviously Charney is the most influential of them all. And Charney doesn’t give any comfort beyond there being a massive government effort to sell this stuff.
I am just trying challenging your notion that the science is settled and the more we talk about it the more obvious it becomes you don’t have any answers.
Clint,
“trying to claim that all Skeptics believe that 15u photons cannot be absorbed by Earth”
Not all ‘skeptics’, just the ones that believe a surface cannot absorb photons from a cooler source.
barry, tell us how a 15u photon from a “cooler” source is different from a 15u photon from a “warmer” source.
barry, maybe you can answer the simple question dlhvrsz evaded:
https://www.drroyspencer.com/2025/12/uah-v6-1-global-temperature-update-for-november-2025-0-43-deg-c/#comment-1724785
Or, maybe not….
Geez CR, you are as thick as a brick.
Allow me to quote nate who replied to you:
“This has only been explained to you about 47 times.
Why do you keep pushing this horribly bad analogy?
Ice cubes add MASSS to the water along with their thermal energy.
Radiation adds energy via photons, which are essentially massless.”
“barry, tell us how a 15u photon from a ‘cooler’ source is different from a 15u photon from a ‘warmer’ source.”
There is no difference.
Just when I thought it couldn’t get any funnier, studentb uses Nate as a “science source”!
The kids are soooo confused about “adding energy”. Adding energy does NOT always result in an increase in temperature. It has to be the “right kind” of energy.
A 15μ photon has about 83 μeV of energy. A 10.6μ photon (WDL photon from an ice cube) has about 117 μeV of energy. Two 15μ photons have a combined energy that is more than the ice photon. So, could two 15μ photons melt an ice cube?
Of course not! A billion, trillion 15μ photons couldn’t melt an ice cube. Just like a billion, trillion CO2 15μ photons can’t raise Earth’s 288K surface temperature.
What will the children try next?
Clint R
Do you have any evidence for your assertions? Or are you just making unsupported claims. At this time i do not know if a highly powerful beam of 15 micron photons would melt ice. You maybe need some expiramental evidence to support your claims if you want it to be valid science. Without evidence your post is your opinion what happens. We do know a CO2 laser will cut steel. Now you would need to produce an intense beam of photons from CO2 to verify such a beam is not able to melt ice. Please a little less of your opinions and give more evidenced based science.
LOL.
Now we have “ice photons” !
And a restating of his misunderstanding of the WDL !
It is like talking to a brick wall.
Barry, maybe you could help poor CR. His stubborn ignorance is wondrous to behold.
Norman, I’ve provided plenty of evidence. But you just don’t understand any of it. I try to make things simple for you, like the example of a “ball-on-a-string”, but you still don’t get it.
Keep bringing up a “CO2 laser”, like Nate and some other cult kids do. It shows you have no understanding of thermodynamics.
What nonsense will you try next? A microwave oven, perchance?
Clint R 9:04 am asks: “So, could two 15μ photons melt an ice cube?”
Of course they could when absorbed and the ice cube is less than Clint’s 166 μeV short of the total thermodynamic internal energy it needs to melt.
Absorbed EMR energy increases the real ice cube object’s thermodynamic internal energy in that isolated process so always increases the object’s temperature due to 2LOT.
What will Clint R’s imagination try next?
Clint R
No you have not provided any evidence at all. You peddle your opinions but you support none with any real evidence. I have asked you many times to provide evidence but you never do.
Your “ball on a string” does not provide any evidence of the Moon’s rotation. The ball on a string just represents rotation around a central point. Not different than a record on a record player. The record rotates around the center spindle. Not an orbit at all. I have given you several examples of things you can do to show why the Moon must rotate once on its axis in order to keep the same side facing the Earth. You do not have the mental capacity to understand them and you do not have the ambition to test them out. One was walk around a table. You have to rotate your body at the same rate you are moving around the table to keep the same side facing the table. If you do not rotate your body as you walk then all sides of your body will face the center. I have asked you to take two cans. Leave one in the center and move the other one around the center can. You have to rotate the “orbiting” can as you move it around the center can to keep the same side facing the can. You simply are not able to learn or understand anything related to science. You make up things, peddle your opinions as fact and when challenged you resort to calling people children and belonging to a cult.
Sorry your posts are all cultish. You provide not evidence for anything but babble on and insult.
Since you think laser photons are different than others (not sure what the difference would be since they all have the same energy, just one is in a coherent beam and the others are not). Anyway I did suggest using a very strong light source, just use a filter so only 15 micron photons go through but have it had maybe 1000 W/m^2 of energy and see what it does to the ice. Until you provide real evidence, not your opinion, it is not science!
Perfect! Ball4 clings to his belief that photons from ice can boil water! I don’t think even Norman would go along with such nonsense. But, Norman has never had thermodynamics, so who knows….
I wonder how many of the cult kids would step up to agree with Ball4?
Ark? Bindi? Willard? dlhvrsz? barry? Nate? TimS? gordon? studentb?
Norman, a “record on a record player” is NOT orbiting, it is spinning. The ball-on-a-string IS orbiting, but NOT spinning. You’re unable to tell the difference.
I can’t make it any easier for you….
Clint R
You have your opinions (no facts). Well his is a counter opinion than yours.
https://climatepuzzles.org/2021/03/carbon-dioxide-cant-warm-to-more-than-minus-eighty/
Clint R
If you want to do real science instead of blah blah opinions on things you know nothing about (that would be science) then do a real world experiment.
Buy these windows:
https://www.edmundoptics.com/f/sodium-chloride-nacl-windows/14170/?srsltid=AfmBOoozFn5hKEA_vKHpsMoCdWx3JY_zFa7-B3h5AGC0praWgi2ftY0J
Build a container with the window as your exit path for generated IR. Inside the container fill it with pressurized CO2 only and heat the gas by some method. Put ice under the sodium chloride window that allows IR from the heated CO2 to reach the ice. Run a real world experiment. Prove that IR emitted by CO2 cannot melt ice. Make it science or just kindly shut up, your opinions get stale after years of your endless unsupported, unscientific posts.
Clint R 6:13 pm – Could be “photons from ice” or the sun. As barry pointed out, it doesn’t matter. They are the same.
Norman, did you find another link you can’t understand?
As you must spend all your time searching for links, did you ever find one that claims ice cubes can boil water?
He will not find a credible source that says ice cubes boil water through heat transfer.
Hey Puffman, riddle me this –
A few conservative representatives with ties to the FBI and the Justice Department have spilled that the true details of the Epstein files are “worse” for Dozing Dnald than previously reported, according to journalist David Schuster.
https://newrepublic.com/post/202813/department-justice-admits-republicans-epstein-files-worse-donald-trump
why are you trying to present cranks and contrarians as skeptics?
You know NOTHING about skepticism!
That’s correct, dlhvrsz.
Norman is unable to support his false beliefs.
Norman does not believe that ice cubes transfer heat to water and cause it to boil.
dlhvrsz 10:33 pm IS correct ice cubes cannot boil water through heat transfer; it is the added absorbed radiation into water from ice that can increase water temperature thus can boil water. Ice cubes (or any other object) do not contain heat thus none can transfer out.
It is Clint R that doesn’t attend lab courses to support any comments here.
Sorry dlhvrsz, but you can’t cover for Norman. Up above, he’s claiming CO2 can melt ice. That’s the same because, if you need more warming, just add more ice!
If a cult kid doesn’t openly deny the ice-boiling-water nonsense, then he believes it. But, the kids can’t deny it. Then they would be admitting that CO2’s 15μ photons can NOT warm Earth’s 288K surface.
Clint R
You are not correct.
https://www.drroyspencer.com/2025/12/uah-v6-1-global-temperature-update-for-november-2025-0-43-deg-c/#comment-1725294
I asked you to do an experiment with heated CO2 to demonstrate if your opinion on the issue is true or just your made up opinion.
I have not stated that ice will boil water.
dlhvrsz
What I would claim, is that heated water surrounded by 0C ice would reach the water boiling point with less added heat than it would if surrounded by much colder liquid nitrogen. My point is the surroundings alter the heat flow from a hot object to a colder one. The closer the cold surface is to the hotter one, the less heat is transferred. This would cause a heated surface to reach a higher temperature. One can easily understand this by simple case of a room in winter with no insulation on thin walls. The room temperature will reach a certain temperature based upon the heat addition. If the same heat is applied but now thick insulation applied to walls, the room gets noticeably warmer with same heat input. Like a car with closed windows in summer sun. The air inside can reach considerably higher temperature than the outside air even with the exact same solar input energy. Reducing the amount of energy that leaves a surface will lead to a warmer temperature for the surface when heat is added to it.
Norman, there’s no need for another rambling novella. Just state unequivocally that ice cubes can NOT supply the correct energy to cause water to boil.
You can’t do that because your cult believes differently. You’d be excommunicated!
Prove me wrong.
barry says:
Clint,
Not all ‘skeptics’, just the ones that believe a surface cannot absorb photons from a cooler source.
——————–
The problem here Barry is you are arguing as proven as science a description of a symbolic paradigm.
The paradigm isn’t known to be real its just known to be consistent with results. The results of course is that given a temperature of the atmosphere, to the degree it is warmer than outerspace calculated on a line by line basis of spectral emissions, the surface will be warmer.
Thats known what isn’t known is exactly how that happens so somebody trying to describe photons as objects they made a diagram. You looked at and determined that the problem of exactly how energy transfer occurs we can see in the diagram these little photons traveling around and disappearing at the surface.
Then you assumed we actually know that the diagram is correct in every detail.
Even Einstein shrieked about the characterization of that diagram and the nature of photons as to him this remained an obscure quantum process while agreeing with the mathematical results. And no doubt you can’t, as usual, actually produce a scientific work that explicitly establishes what you are claiming. And that is true even while being able to find a lot of studies that might refer to it while assuming without empirical evidence of it being established. (the reason the word empirical was coined)
So the emperor has no clothing despite all his minions running amok claiming he is dressed in fine attire. Careful though you might have to answer to the gate keeper who continues to faithfully assist Al Gore.
bill,
You make the classic error of thinking that if you don’t understand a thing then it is not understood by anyone.
Throughout history thinking you understand is not a thing. The actual truth is the closest you can get to understanding of anything is being aware of the myriad of elements that you are pondering that you know you are uncertain of.
BACK AT THE RANCH
Dozing Donald rages that Henry Cuellar didn’t pay him back for a pardon by switching parties.
Kash Patel pontificates that “When you attack our nation’s capital, you attack the very being of our way of life”, oblivious of January 6.
Treasury is bragging on his social about bond returns, which is a recession indicator.
A random admiral admitted that Pete Hagueseth has given the order to murder foreign citizens.
Dozing Donald told Vlad that Canada was a vassal state – good luck with that one!
Meanwhile, the editorial board of the South Florida Sun-Sentinel, the newspaper which serves an area including Palm Beach (Mar-a-Lago) along with many retirees, is calling for Congress to convene a blue ribbon health panel to independently evaluate Dozing Donald’s health and his medical fitness for office.
And the Oxford Word of the Year 2025 is…
Rage bait: Online content deliberately designed to elicit anger or outrage by being frustrating, provocative, or offensive, typically posted in order to increase traffic to or engagement with a particular web page or social media account.
About kinetic energy
Anyone can try this! Take two identical glass containers, fill one with CO2 and the other with our atmospheric air mixture. Hang them outside in the sun so that the temperatures can be easily read. The particles of sunlight bombard the molecules. CO2 is one and a half times heavier than our air mixture. It takes longer to reach its final temperature than normal air, then both gases have the same temperature, and when the sun goes down again, the normal air mixture cools down faster than the CO2. That’s all there is to it!
That’s funny, Klaus.
It’s a pretty good parody of a typical “climate science” paper. I especially liked the “That’s all there is to it”!
Klaus,
In case you don’t know, Puffman has been riddling commenters under various sock puppets for more than a decade. Here’s proof that even his riddle about his pet radiation isn’t his after all:
https://web.archive.org/web/20150529083441/http://www.drroyspencer.com/2015/05/trmm-satellite-coming-home-next-month/#comment-192293
Puffman has had over the years more sock puppets than riddles.
Hope this helps.
I wonder if any of the cult kids can find anything wrong with Klaus’ “experiment”.
I won’t hold my breath….
It’s good Clint R is not holding his breath. Klaus’ experiment has the optical depth size of a glass container. Earth’s optical depth is planet sized.
Clint R
Something you should do is provide valid science for your opinions and assertions. You want someone to find things wrong with Klaus’ experiment. Why not ask yourself why you NEVER provide valid science on a science blog yet you insult nearly everyone calling them cultists and children, yet you have not yet provided any support for any of your opinions. Why is it so hard for you to find valid science for your ideas? That is because not one is science based they are made up blog nonsense that you endlessly peddle here and pretend you know science.
False, Norman. I have provided plenty of valid science. You just don’t have the background to understand any of it. I try to “keep it simple”, so kids can easily understand it. Like the model of “orbiting without spin”, which you STILL can’t understand.
But keep proving me right with your stalking, insults, and false accusations. You’re making me look good!
Clint R
What valid evidence have you provided? I have seen zero. You offer unsupported opinions over and over
Link to a valid experiment or textbook that agrees with your points. You have not done this as far as i have observed
CR: “I have provided plenty of valid science. You just don’t have the background to understand any of it. I try to “keep it simple”, so kids can easily understand it.
LOL again!
He is correct since his “science” comprises “ice photons”, a complete misunderstanding of the WDL, rantings about the moon etc.
His stubborn ignorance is wondrous to behold.
If you are actually trying to learn something or demonstrate different properties of gases, you need to add 4 more gases to your experiment. Argon is very dense and inert. Helium is very light and inert. Methane is lighter than air, but with a very active radiant spectrum. Hydrogen is the lightest of all.
I think you are probably seeing differences in natural convection rather than radiant properties. What are the dimensions and orientation of your test containers? You could try different orientations. Get back to us with the results.
Hi Klaus,
I am very keen to learn about experiments. I am trying to understand how yours has similar conditions to the temperature of a planetary surface or troposphere. Wouldn’t you need an object representing the planet?
What are your conclusions, do you have any data to share?
Klaus at 1:44 PM: “Take two identical glass containers, fill one with CO2 and the other with our atmospheric air mixture. Hang them outside in the sun so that the temperatures can be easily read. …”
You are describing the same experiment done by Eunice Newton Foote, reported in the 1856 paper titled Circumstances Affecting the Heat of the Sun’s Rays, and read at the annual meeting of The American Association for the Advancement of Science.
https://archive.org/details/mobot31753002152491/page/382/mode/1up
Hi there
Is there a reason the 13-month average not updated? I think it’s about 6 months out of date.
As the plot states, it’s a centered average, not a trailing average. So, it’s up to date.
Build a sodium chloride glass greenhouse that allows IR out.
Build a regular glass greenhouse as a control one.
See what happens.
Christos,
Do you have any idea how to make the glass transparent to IR?
What would be interesting is to create an experiment where it was study the convective processes from surface to high atmospheric altitudes. All these experiments with gasses in small containers, how are they actually similar to large scale atmospheric processes?
Given the findings from Nikolov and Zeller, on needs to ave an experiment that can give room for adiabatic processes to exist.
Thank you, David.
I think there is no material a 100% transparent.
When EM energy hits a surface there is the reflection, there is the immediate IR emission, and there is the heat absorption.
Does the solar visible light penetrates glass, or the SW EM energy is recreated as visible SW on the other side of the solid material (glass)???
–
https://www.cristos-vournas.com
–
christos…that has already been done by R. W. Wood in 1909. He set up two boxes, one with glass and one with halite on top. Halite is the generic name for sodium chloride and as an equivalent to glass, in clear sheets, it is known to pass infrared energy.
Wood was famous in his time for his expertise on gases based on their spectrum. He was consulted by Neils Bohr for info on sodium vapour. He could not see why the amount of CO2 in the atmosphere could warm the atmosphere significantly and set out to verify it. He concluded that warming in a greenhouse was due to the glass blocking heated air molecules and not to blocking infrared.
People who believe the infrared-blocking as a basis for greenhouse warming are subscribing to old theory from the 19th century. Scientists in those days believed heat moved through air via heat rays. They were not talking about infrared energy, which is not heat, but heat actually moving as heat rays.
They were wrong. An equal amount of heat must be dissipated as infrared energy is formed. Therefore, in a greenhouse, the IR claimed to be blocked by the glass was formed at the expense of heat. Blocked IR no longer has anything to do with the heat in the greenhouse.
The temperature of a greenhouse is controlled by adjustable windows that can be opened to release some of the heated air. In large greenhouses the windows are controlled by thermostats that control motors. I know a guy here who has a pane removed on either vertical end of the greenhouse with a fan installed. The fans are controlled by a thermostat.
Last time I looked, you can’t blow infrared from a greenhouse. Also, there is no evidence that recycled IR can warm anything. Ergo, blocking IR does nothing since it cannot be recycled to raise the temperature of air in a greenhouse. That would represent perpetual motion.
Interesting and very important insights, thank you, Gordon.
“blocking IR does nothing since it cannot be recycled to raise the temperature of air in a greenhouse. That would represent perpetual motion.”
–
Of course. It is not important whether the greenhouse covering lets IR radiation through, and how much of it.
The important thing is that greenhouses let the solar radiation through in the greenhouses.
–
https://www.cristos-vournas.com
“blocking IR does nothing since it cannot be recycled to raise the temperature of air in a greenhouse. That would represent perpetual motion.”
No Gordon, since Prof. Tyndall did just that experimentally and didn’t invent perpetual motion. When he turned off his Bunsen burner, the added motion stopped. Same for our atmosphere doing the same process: turn off the sun and the added motion stops.
I tend to think an airless glass greenhouse on our Moon…
the ground lunar regolith in that greenhouse will be much warmer, and the heat will eventually penetrate much deeper. than at adjoining lunar area outside the Lunar Airless Glass Greenhouse.
–
https://www.cristos-vournas.com
For anyone who thinks the UAH record, based on anomalies, suggests significant warming, I refer them to this old post by Ian Schumacher, who used to post here.
See figure 5, which is fairly current UAH temps (’79 – 2009) plotted on an absolute temperature scale.
https://web.archive.org/web/20100430000147/http://www.ianschumacher.com/global_warming.html
The current plot, which looks major up close, appears as essentially a flat line on the extended scale, except for 1998 which appears as a pimple.
“figure 5, which is fairly current UAH temps (’79 – 2009)”
You have to be joking.
Only a brain dead imbecile would post such nonsense.
Are you OK? Is somebody caring for you?
Studentb,
What is the problem with your manners “brain dead imbecile”?
I am following this blog and it is full of meaningful contributions and points of view, but when I read post like this I just feel sick.
One can have different opinions without having to use such foul and disrespectful language.
Is it possible for you to express your opinions a bit smoother, for everyones sake?
David 9:06 AM
You must be new here.
Take a look at this post, https://www.drroyspencer.com/2025/05/our-urban-heat-island-paper-has-been-published/#comment-1704970, where you will find some truly “foul and disrespectful language.”
A sampling:
The old saying applies: People who live in glass houses…
Karl,
What is the problem with your selective hall monitoring?
Puffman keeps talking about cults and children.
Bordo keeps ranting about alarmism.
Gill keeps trying to associate sound science with Japanese Kugo death ray and fat Al Gore.
Graham keeps, well, nobody cares.
Do you often go in your friends’ house and decide how things should work?
David, thanks for bringing some maturity to this blog. It’s sorely needed.
The blog has been taken over by cult kids. “Cult” being a false religion where beliefs are more important than reality. And of course, “kids” comes from their massive immaturity.
Lacking a knowledge of science, the cult kids rely on insults and false accusations. Just this week, we see several cult kids claiming that ice cubes can boil water. Cult kid barry is the latest, to join the chant. When I first started commenting here, I remember barry always tried to sound like an adult. But, he lost it when Trump won. barry ranted for weeks about how the tariffs were going to end the world. Now, he’s claiming AI told him ice could boil water! He probably uses his freezer to cook his meals!!!
(Now watch for the childish reactions from Willard and studentb.)
Kids these days…
Clint R 12:41 pm, no a freezer won’t cook his meals since it SUBTRACTS thermodynamic internal energy from water thus cooling the water.
Absorbed radiation from ice ADDS to thermodynamic internal energy of water thus warming the water. It’s really fairly simple physics even a more astute child than Clint would understand.
I forgot to mention Ball4 in the list of cult kids. He’s so inconsequential he’s easy to forget.
https://www.drroyspencer.com/2025/12/uah-v6-1-global-temperature-update-for-november-2025-0-43-deg-c/#comment-1725195
But, I’ll include him from now on. He’s one of my stalkers proving me right.
ark…my foul-mouthed spiel pales with the outright crude response from stoopidb. I took the time to say why I was potty-mouthed, that the author was suggesting in essence that we burn books with which we don’t agree.
I normally accompany disdainful language with a scientific explanation of why I feel that way, I am never disrespectful to a person who attempts to discuss science without ad homs and insults. In fact, I enjoy a good debate based on science.
David was commenting on a blatant, insult-laden response by stoopidb, which is his MO. He seldom makes an attemot to discuss what is written.
You have the most current UAH temp record to date published by its compiler if you just scroll up, but instead you used the wayback machine to remove the last 16 years and pick a different scaled y-axis, Gordon?
If I post a picture of myself from 16 years ago you’ll find out that I’m actually 5 kilograms lighter than I seem!
Okay, I’m finally convinced. I hereby declare the greenhouse effect to be nonexistent.
“This absorption, the difference between the blue and green lines above 0.3 microns, has an important practical significance: It is responsible for the absorption of approximately 79 W/m2 in the atmosphere and should a bunny care to include it the 100 W/m2 scattered back into space”
that’s encouraging. Now, what, pray tell, is your new theory to explain warming in the atmosphere since 1850?
May I suggest that you look into rewarming from the Little Ice Age. I mean, do you think it at all possible that such a recovery contributed? If you do, you are way ahead of the IPCC and a damn sight smarter.
My primary interest in global warming is the depth psychological dimension, though I also respect the statistics. With that in mind, can you please explain why in 2010 the ‘trend’ of global warming reported on this website was 0.14 but now is 0.16?
because of recent additional warming
SOLAR MINIMUM UPDATE
“Remember — global warming! And then the temperature started going down like a rock. Remember? Remember?”
https://bsky.app/profile/atrupar.com/post/3m7lv555ih52s
Bit win for Dozing Donald!
Transcript from the video:
“we had global warming and they sent that big, beautiful ship with all scientists on it, and it went into deepest Alaska. It went up through the ice and the global warming, it was getting so warm, except unfortunately they had a bad few weeks. It go so cold that the ice just crushed.”
So, DJT is apparently using this event (let’s pretend it is real, even though who knows?) to argue that global warming has somehow ‘failed’ just because there is still ice in the Arctic and it can be dangerous?
” Yep, climate science. What a load o’ hogwash. Ain’t no way that’s real. Them fancy scientists and leftist folk gon’ change their story every time it gets cold. *BELCH* ”
– Carl Anderson of rural Alabama, with a toothpick hanging from his mouth.
dlhvrsz,
I agree, it is like when they go to look at melting glaciers and saying “look, it is global warming. And it is the humans fault”.
There is Global Warming. The cause is orbital.
–
Link: https://www.cristos-vournas.com
Meanwhile, Trump the real estate investor believes property in Greenland will increase in value!
Hmmm.
David, it is nothing like that.
I was a teenager in the early 2000s, and climate change was already widely recognized as a major environmental issue. No one I knew, myself included, thought that cold weather or the existence of ice at the North Pole somehow disproved global warming. Then again, the American education system isn’t exactly stellar…
What worries me even more is that DJT wants to cut funding for climate science while clearly not understanding the issue at all, as his ridiculous comment makes obvious.
https://medium.com/@mm.dylan/the-ghost-of-lysenko-when-politics-crushes-science-cab6491c87b6
dlhvrsz, you weren’t “educated”, you were “indoctrinated”. The difference is that you can’t think for yourself. If presented with reality that debunks your beliefs, you will revert to your indoctrination.
A perfect example is your inability to address the simple issue presented here:
https://www.drroyspencer.com/2025/12/uah-v6-1-global-temperature-update-for-november-2025-0-43-deg-c/#comment-1724785
For Clint R 10:45 am, why? Already explained above & many times before. The added ice cubes SUBTRACT thermodynamic internal energy from water thus cooling the water so the mixture temperature trends down.
Absorbed radiation from ice ADDS to thermodynamic internal energy of water thus warming the water. It’s really fairly simple physics even a more astute child than Clint would understand.
Hey Puffman, riddle me this –
I Asked the Pentagon About Pete Hegseth’s Mentor. Then the Threats Started.
https://www.motherjones.com/politics/2025/12/eric-geressy-goodreads-pentagon-dod-pete-hegseth-jack-posobiec-threat/
Do you realize that nobody denies winter weather, whereas we got cranks here under various sock puppets (you, Karl, perhaps even Walter) who deny basic climate facts?
The cult kids can’t keep from proving me right.
Just no self-control.
Clint, I am not sure how to be any clearer unless you are willing to communicate with me. Calling me a cultist does not help move the conversation forward.
Also, when you call me ‘indoctrinated’ for recognizing that weather isn’t the same as climate, does that mean YOU believe weather is climate?
dlhvrsz, the best way to be “clearer” is to face reality, instead of building straw men. You’re a cultist because you adhere to your indoctrination instead of accepting reality.
For example:
https://www.drroyspencer.com/2025/12/uah-v6-1-global-temperature-update-for-november-2025-0-43-deg-c/#comment-1724785
So, to directly answer your question:
“The ice cubes add energy, yet the temperature does NOT go up. Why?”
Why is the explanation that warm water transfers its energy to the colder ice cubes not acceptable to you? Is that really a refusal to deal with reality?
Also, I’m curious about the accusation of sock puppeting directed towards you by Willard. Who were you and the others before, and why are the three of you sock puppeting? Will you tell me?
You’re still evading, dlhvrsz. If you really accepted that then your GHE nonsense would go away. The energy “trapped” by CO2 has no effect on the surface because the surface transfers thermal energy to the colder atmosphere. You’ve just [correctly] debunked the GHE nonsense.
So do now you unequivocally agree that ice cubes can NOT boil water?
On the other nonsense, I have been accused of being at least 7 different people. That’s just the cult kids making false accusations. They have also claimed that my physics is wrong, but they can’t provide even one example.
Hey Puffman, riddle me this –
Michael Glasheen was testifying before the House Committee on Homeland Security, and told Democratic Representative Bennie Thompson that after antifa, a political designation and movement that stands for “anti-fascism,” was designated by Dozing Donald as a domestic terrorist organization, “that’s our primary concern right now.”
https://newrepublic.com/post/204308/fbi-leader-threat-antifa-questions-congress
Who died and made you the King of Riddles in my sub-thread?
dlhvrsz,
This is really interesting what you are writing:
“I was a teenager in the early 2000s, and climate change was already widely recognized as a major environmental issue”
I am a bit older than you, I was a teenager in the 90s. Here in Sweden where I grew up people are complaining about there no longer being cold winters, like when we were kids. So am I, and there is a fact that the winters have become warmer since the 80s. I was also (when I was a teenager) convinced that it had to be due to air pollution and greenhouse effect.
Then a few years ago when the “climate crisis” came onto the agenda again I thought, well nothing has really happened with the climate here since I was a teenager, has it? I am a sailor so I am monitoring weather closely, my safety at sea depend on it.
I started digging. In short what I found was that, what largely determines wintertemps here is the AO and NAO, and in the 1970s occured the GSA, great salinity anomaly: https://www.sciencedirect.com/science/article/abs/pii/S0079661198000159. This affected the NAO and AO over a decade, hence the cold childhood winters. The full cycle of it is not even in the UAH timespan, that is how little data we have.
Conclusion, people tend to find answers that fit how they “feel”. All mid aged Scandinavians “feel” that the winters were cold and snowy when they were kids, which is valid. So they are easy bait for the climate crisis agenda. I was also indoctrinated, yes the wording is correct. It is certainly not easy when the MSM is doing the best they can to make you believe it. Once you see it, it becomes obvious, there is no real evidence for it.
My recommendation is that you revisit your own wording: “climate change was already widely recognized” and reflect. Is it the “widely recongized” that makes you belive it, “the flock always knows”?
Great read, David. Thanks for sharing.
What you mentioned about Sweden resonates with my experience in Maine. The NAO and AO are key drivers of our winter weather here too.
One thing to consider is that our personal climate experience spans only a relatively short period. If you were to extend a multivariate analysis of the NAO/AO to include winter average temperatures in Sweden going back to the 1800s, I think you’d likely find that while these internal modes influence winter weather, the overall rise in winter temperatures can’t be solely attributed to them. I haven’t conducted this analysis myself, but I base this observation on similar studies I’ve come across.
And regional warming tends to be more noisy. It reflects how energy is distributed across the planet. Global average warming, on the other hand, is a better reflection of total planetary energy uptake, and that’s the metric people tend to focus on. While I’m not as alarmist as Guy McPherson, I do believe the rate at which the Earth is warming is cause for concern.
Apologies..
That said say: If you were to extend a multivariate analysis of Swedish winter temperatures to include NAO/AO going back to the 1800s…
dlhvrsz,
Please beware that David has pulled “But Damascus”:
https://climateball.net/but-damascus/
Conversion stories are as powerful for scientists as they’re ridiculous for pseudonymous commenters like David.
Cheers.
The first thing needs to be realized is that Stefan-Boltzmann formula doesn’t apply to terrestrial temperatures.,,
The 15C (288K) do not emit 390 W/m^2, no matter what the
J = σ T^4 W/m^2 calculates!
Also the -18C (255K) do not emit 240 W/m^2, no matter what the
J = σ T^4 W/m^2 calculates!
–
https://www.cristos-vournas.com
cissy clint…”People like barry, dlhvrsz, Nate, gordon, Norman, studentb, Bindidon, Willard, and Tim S like to stalk Skeptics”.
***
That’s a cheap shot, even by your non-standards. I am one of the only skeptics here who is willing to back his skepticism with empirical science. You, on the other hand, like to see yourself as a skeptic, yet you cannot address any of the science I present in reply to your sci-fi.
I have never stalked you, I reply to your fairy tail posts so others who may read your drivel can get a scientifically-based rebuttal. Remember, it was you who began stalking me, for no known reason, issuing ad homs and insults, again, for no known reason other than me possibly saying something that you, in your neurotic mind-set, may have take as a personal attack. A stable person with an interest in real science, might have asked what I meant.
The only thing with which I disagree on your list of gripes is that flux is not energy. There is nothing else it can represent and the only argument you have in your favour is that humans invented flux to represent energy acting through an area or volume. That is, flux is an imaginary concept, like temperature, another human definition, and as such, cannot be energy itself.
However, in the same obfuscated human mind, it is intended as a measure of energy, in part. I say ‘in part’ because flux, as defined by Newton, has a far broader meaning.
An example from electronics. When you have an inductor in a circuit, labelled as L, for inductance, if you have a current changing instantaneously, di/dt, then by Faraday’s Law…
E = -L.di/dt.
E = voltage
However, associated with di/dt is an instantaneous change in magnetic flux, d(fi)/dt, induced in the inductor, L, by the change in current. Here, flux is associated with a phenomenon produced in an inductor, a coil, by the changing current. By the same token, a changing magnetic flux can induce a changing current in a coil. That’s how transformers and electric motors operate.
This is proof absolute that flux is a representation of energy in the human mind. As for what it is in reality, like energy itself, no one knows. Even Clint doesn’t know, although he pretends to understand it.
Since temperature is a human definition aimed at quantifying the energy heat, flux is a human definition representing the energies electromagnetic and magnetic energy. Of course, as defined by Newton, flux, or fluxion, is a definition of an instantaneous change in a function, which is the basis of differential calculus. It can represent anything that changes, in essence. However, since it is aimed generally at changes over one, two, or three dimensions, it often represents a change of energy passing through those dimensions.
However, the way you present flux, it is a reality which you cannot define. In other words, you use the word without being able to define what it is, or what it represents. Same with time, you use the word but you cannot define it.
I have written extensively on the fact that energy is an undefined generic term that represents several different types of energy. Yet, you have denied one of those forms…heat…as even being a form of energy. You have claimed many times that heat is a mere transfer of energy but you fail to identify which energy is being transferred, which has to be thermal energy, or heat.
According to you then, heat is a transfer of heat. That is typical of your understanding of science. To be a skeptic, you should at least understand what it is of which you are skeptical.
I have stated my skepticism in scientific terms. I am totally skeptical that a real greenhouse effect can exist in the atmosphere. I am skeptical that humans are in any way responsible for global warming (AGW) over the past 175 years and I have used the Ideal Gas Law to prove it. I have also tried to explain any warming as a rewarming from the 400+ year Little Ice Age.
When you have claimed that entropy is a measure of disorder, I have asked you why the equation for entropy only involves heat and temperature, and you have failed to reply. I have pointed to the subjective definition of entropy by Clausius that defines entropy as the sum (integral) of infinitesimal transfers of heat in a process at temperature, T, you have failed to accept that.
I have gone so far as to use the Gibbs’ Free Energy equation, in which entropy is represented as heat loss in a system, to prove that entropy is a measure of heat transfer.
Gibbs does use the word energy but he was a great admirer of Clausius, who used the word heat freely, and it is clear that his equation is a summation of heat quantities. That becomes clear when the other term accompanying entropy…enthalpy…is defined as the total heat in a system. Free energy then is the sum of enthalpy and entropy, where enthalpy is total heat and entropy represents a loss of heat. The heat remaining to do work is then the free energy, in this case, free heat.
The thing to note is that Joule discovered an equivalence between heat and work, circa 1840. Therefore, Gibbs’ equation could be manipulated to included work, and that may be why he opted to call it energy, rather than heat. It would not make a lot of sense to refer to the loss of work in a system. The Joule equivalence does not mean heat is work, or vice-versa, it simply means that either can be substituted for the other but not in an equation unless both are converted to one the same form.
Clausius noted this important point in his written work between 1850 and 1879. In fact, much of his work was about the equivalence of work and heat. In the day, he would have been roundly criticized by Clint, from the peanut gallery, for referring to heat as energy.
Keep rambling incoherently, gordon. You’re not even fooling studentb.
That’s clearly because he secretly supports your gobbledy-gook. Both of you together couldn’t make one decent human brain.
If either one of you had one more brain cell it would be lonely, if you had two cells they’d quarrel.
barry…”It seems people denying the GHE deny Kirchhoff’s law that emissivity = absorp.tivity”.
***
Barry…old cobbah….Kircheoff applies only at thermal equilibrium and for blackbodies only. Anything can be claimed for two bodies in thermal equilibrium since one is dealing with microscopic interactions between bodies at the same temperature.
Personally, that makes little sense to me since two bodies in thermal equilibrium must be at the same temperature. If two masses at the same temperature are touching, they must necessarily be at the same temperature at the contact point but what does that have to do with two bodies separated by air?
I think laws from the likes of Kircheoff as applied to heat transfer are outdated. They have been superseded by Bohr’s theory of 1913 which explained such transfers at the atomic level based on science that far superseded anything Kircheoff had available.
It makes no sense to me either why we keep talking about blackbodies. They served a purpose at one time before atomic theory, based on electrons, protons, and neutrons was understood, but the theory makes little sense now.
“Kircheoff applies only at thermal equilibrium and for blackbodies only”
Wrong on both counts.
The law states that the emissivity of surface is equal to its absorp/tivity. This has nothing to do with “thermal equilibrium.” And this law applies to all surfaces, not just blackbodies.
If a surface emits weakly in a certain wavelength then it will absorb EQUALLY weakly.
Are you sure you’re not thinking of a different law?
What this means for absorbing photons is that the temperature of the source of the photons irradiating the the surface is irrelevant. All that is relevant is if and how well the receiving source emits photons of a given wavelength. If it emits in that wavelength strongly, it will absorb photons of that wavelength EQUALLY as strongly.
That is the total of Kirchoff’s law. Not at all dependent on the surface being a blackbody, or on two surfaces being in thermal equilibrium. Those conditions are not relevant to the law.
barry…the whole point of the post from Ian Schumacher re fig.5, is to show how these anomalies compare to an actual scale using absolute temps. Most anomalies are presented in an enlarged scale, making them appear to be overly-significant.
Cool – then I can use an actual scale of the breathable atmosphere and we can see how my height changes over time.
Of course, we’ll see virtually no change, even though I’ve grown 4 times taller than I was at birth.
On an “actual scale” I’m about the same height as an adult as I was as a child.
Come on, Gordon, there’s no clear reason to use absolute temps, unless you want to obscure the change over time.
Sinclair writes:
“The swing in temperature from an ice age and back again can be more than 11C.”
Tsk, these are polar, not global temps that he’s comparing with US global.
But why did he limit his scale? Start at zero Kelvin and end a few degrees warmer than the surface has ever been – 1000K at the formation of the planet.
Now the swing from ice ages and out don’t even show. How much do we learn from this?
You use the scale that encompasses the change and variability and not much more, so you can see all clearly. Why obscure it? You don’t assess relative magnitude or significance from a visual.
” For anyone who thinks the UAH record, based on anomalies, suggests significant warming, I refer them to this old post by Ian Schumacher, who used to post here. ”
and
” barry… the whole point of the post from Ian Schumacher re fig.5, is to show how these anomalies compare to an actual scale using absolute temps. Most anomalies are presented in an enlarged scale, making them appear to be overly-significant. ”
*
As usual, the ignorant Robertson donkey (who regularly insults me as an alarmist eijit (he means ‘idiot’ of course) endlessly posts incompetent blah blah, without having the tiniest clue of what he is braying about.
*
Over a year ago, as I tried for the umpteenth time to explain Robertson why his NOAA-based ‘understanding’ of anomalies is wrong, I posted a graph containing for UAH both
– the correct anomalies as computed by anyone who knows how to do (starting with Roy Spencer en personne, nicht wahr)
– the departures of the absolute values relative to their mean of the same reference period as the real anomalies:
https://drive.google.com/file/d/1zMrnVDsGrI63WWKdlKmt2ez_RWvNpyag/view
*
You see in the graph how small UAH’s anomaly value interval (about 1.6 C) is compared to the abswolute value interval (about 3.2 C).
*
By the way, don’t waste your time in searching for absolute values in UAH’s data: you won’t find any.
The only way to obtain them is to recompute them backwards out of the grid by adding cell by cell, for each month, the climatology’s absolute value found in the ‘tltmonacg’ file (the ‘grid baseline’) for the same cell in the same month to the anomaly in the tltmonamg files:
https://vortex.nsstc.uah.edu/data/msu/v6.1/tlt/
Emissions Gap Report 2025: Off Target… https://wedocs.unep.org/rest/api/core/bitstreams/4830e1a8-14c0-44a5-a066-cdd2ba5b3e10/content
Given the current trajectory of global emissions, the goal of limiting global warming to a 1.5 C temperature rise over pre-industrial, is dead.
Emissions are still rising. Updated national climate pledges barely budge projected warming, and world policies are driving the planet toward nearly 3 C of warming by the end of the century.
I read above that some commenters here were “teenagers in the 1990s and early 2000s.” My youngest son graduated high school in the year 2000; his Earth Science class studied the GHE, climate change, climate feedback mechanisms, and related atmospheric processes. Granted, he attended a very good school, but the point is that this material was already embedded in major Earth Science textbooks throughout the 1990s, so claims of uncertainty or novelty reflect a choice to ignore information that has long been readily accessible.
Ark, how does it feel to belong to a cult that chooses “to ignore information that has long been readily accessible”?
It has been well known for over a century that ice cubes cannot boil water. Yet your cult, as demonstrated above, believes otherwise.
That ice cube analogy just isn’t a valid comparison to the greenhouse effect.
When Gemini is more interesting than a human(?): https://tinyurl.com/vk5u6yrn
Sorry dlhvrsz, but it’s a pretty good analogy.
The reason you can’t boil water with ice cubes is the same reason CO2’s 15μ photons can’t raise Earth’s 288K average surface temperature.
You just have to understand radiative physics and thermodynamics….
More from Gemini:
Thinking is Difficult, That’s Why Most People Judge.
Hey Ark, you know that AI stands for “ARTIFICIAL intelligence”, right?
If you want to have some fun, ask your AI for a definition/description of the GHE. That’s always good for a laugh….
Hey Puffman, I bet you can’t answer this one –
Pentagon Unveils New GenAI Platform, It Immediately Starts Flagging Pete Hegseth’s War Crimes
https://abovethelaw.com/2025/12/pentagon-unveils-new-genai-platform-it-immediately-starts-flagging-pete-hegseths-war-crimes/
Why didn’t you answer dlhvrsz’ question about your many socks?
Arkady: The brainwashing of students started already in 1986 when the Advisory Group on Greenhouse Gases (AGGG) was founded and couple years later when IPCC started to publish their climate reports based on consensus science.
max…as you know, the phrase ‘consensual science’ is an oxymoron.
More humourously, an oxy-Clint, oxy-studentb, or oxy-Binny, who are all morons. Nyuck, nyuck.
Of course, political correctness prevails these days and the terms idiot, imbecile, and moron are now lumped under the safe phrase ‘intellectually deficient’ or ‘intellectual disability’.
When I call Binny an idiot, I find it more apt than calling him intellectually deficient. When people call me an idiot, as does my g/f quite often, she realizes under it all that I am actually a genius, and an exceptionally good-looking one at that. 🦁
F600;
As one of my authority figures, Curly, of the 3 Stooges would say, ‘Nyuck, Nyuck’. I also like Shemp’s expression…’zeep-voo-voo-voo but it’s harder to do in print.
BTW…I did not know that Curly and Curly-Joe were different people. Curly was an original who introduced Nyuck, Nyuck, Curly Joe was a later development from outside the Howard family.
Seriously, the Stooges are on every Saturday night (ME-TV), in prime time, and it’s the only time I get a seriously good laugh. Other than, of course, reading posts from Clint, Studentb, Binny, etc.
Alarmist climate theory is a gas, gas, gas.
In 1982, the Exxon internal “Primer on the CO2 Greenhouse Effect” ( https://corporate.exxonmobil.com/-/media/Global/Files/climate-change/media-reported-documents/03_1982-Exxon-Primer-on-CO2-Greenhouse-Effect.pdf) accurately summarized the foundational climate science of its time, acknowledging that anthropogenic CO2 emissions from fossil fuel combustion were increasing atmospheric CO2 concentrations and would cause measurable warming over coming decades. It projected that a doubling of atmospheric CO2 could raise global average temperatures by roughly 1.3 C to 3.1 C and noted that significant reductions in fossil fuel use were required to stabilize CO2 and limit warming.
Now, more than four decades later, the Emissions Gap Report 2025 (posted above) confirms and expands this scientific trajectory with contemporary quantified analysis. The 2025 report finds that global GHG emissions are on track for nearly 3 C of warming by the end of the century.
Also of note is the fact that Exxon’s internal estimates of a carbon budget for stabilizing CO2 emissions predate widespread public use of the term “carbon budget” in scientific and policy discussions. Their estimates align reasonably well with later academic and IPCC-derived budgets for a 2 C pathway.
“What’s the use of having developed a science well enough to make predictions if, in the end, all we’re willing to do is stand around and wait for them to come true?” Frank Sherwood Rowland, Nobel Prize in Chemistry 1995.
Yeah Ark, Exxon got it wrong. They obviously believed the nonsense. Like Greta, they didn’t have a clue about radiative physics.
I wonder if Greta knows you can’t boil water with ice cubes….
ark…re Gemini AI…an excellent video from Judith Curry, a real scientist, on consensus and chicanery in the climate alarm world.
BTW…she used to be an alarmist till someone urged her to review her facts re hurricanes. Like the good scientists she is, she did review her work and found it was wanting. This lead to her changing her mind.
When she did become skeptical, Michael Mann leveled a torrent of misogynist crap at her. Of course he did it in private, not realizing it would ever be released in the Climategate emails.
https://gemini.google.com/app/badd878d9cf141c6
ark…from Gemini AI…
“2/ There is no parallel between basic, observable physics (ice and boiling water) and the complex, data-driven, and evidence-supported field of atmospheric science and climate modeling. Climate science does not claim to overturn basic physics; it uses physics to understand complex systems”.
***
This is really an abuse of AI, using it as a very fast lookup of Google articles. At the same time, Google has a strong bias against skeptics, labeling them as issuing misinformation, thus the biased response above. AI is meant to be a processor programmed to think for itself, an impossibility if you understand computer hardware, albeit in a restricted manner since no one knows how intelligence operates.
The claim that climate science uses physics to understand complex systems is misleading. There is no such science as climate science for one thing, it is an inaccurate cover name for a variety of sciences from atmospheric physics to meteorology, to a variety of other sciences and pastimes, ranging as far as economics. More generally, it is referred to as climatology.
The alarmist brand of climate science ranges into pseudo-science and perversions of real physics. Google AI, is in denial that such perversions exist since it is programmed, like the IPCC, to see only information pertaining to the perverse climate alarmist views.
In this video, which I posted earlier, from Judith Curry, she goes into such perversions in a far more eloquent manner than myself. I simply lack her patience when it comes to out and out idiots trying to frighten people.
https://youtu.be/vVi01vJ4nxM
Google AI also lumps in unvalidated climate models with this science, suggesting it to is a ‘complex, data-driven, and evidence-supported field’. A stupid lie. Therefore, we know Google AI, despite the inference that its replies are based on intelligence, is actually passing off misinformation as fact. Hardly intelligence, even of the artificial variety.
There is no such science as climate science for one thing
https://www.unsw.edu.au/science/study-with-us/study-areas/climate-science
https://handbook.newcastle.edu.au/program/2025/40245 [Bachelor of Climate Science]
https://handbook.mq.edu.au/2019/Majors/UGMajor/Climate+Science
https://study.unimelb.edu.au/find/courses/graduate/master-of-climate-science/
https://www.unisq.edu.au/study/degrees-and-courses/major/climate-science-bachelor-environmental-science
https://www.jsg.utexas.edu/academics/undergraduate/degrees-offered/bs-in-climate-system-science/
https://www.albany.edu/daes/programs/phd-climate-science
https://www.stonybrook.edu/commcms/somas/education/undergraduate/degrees/cci.php
https://www.umt.edu/academics/programs/climate-science-environmental-change/
etc
clint…”The reason you can’t boil water with ice cubes….”.
***
The thing that bothers me most about this statement is that alarmists are actually arguing obliquely that it might be possible. They won’t agree that the notion is absurd that ice cubes can boil water, even resorting to situations where water can be forced to bubble at lower temperatures by reducing pressure.
Boiling with reference to water is the bubbling in water we see when it reaches a temperature of 100C. You can add large chunks of ice to the water and the result is a cooling of the water, perhaps to the point where the boiling stops temporarily while the ice melts.
Using the S-B law on ice at 0C, suggests it is radiating at 315 w/m^2. The Sun itself produces less than 300 w/m^2 of infrared at the surface and it is being debated if this can cause skin damage with lengthy exposure. According to S-B, however, that is the calculated heating produced by ice.
I claim ‘heating’ because the watt is a measure of work and is used as a heat equivalent wrt heat itself. Therefore, if IR at 315 w/m^2 contacts skin, it should be able to produce an equivalent amount of heat in human skin.
Here’s the irony. A heating blanket only produces about 15 w/m^2 to 80 w/m^2. Why bother when packing the equivalent of a square metre of ice around you can do the same job? Duh!!!
To get a better idea of what 300 watts means, we can fire up 3 x 100 watt light bulbs in close proximity and see what kind of heat is produced in the cover of a metal enclosure.
Of course, the 300 watts with light bulbs is a measure of the electrical power supplied to light them, but a watt, is a watt, is a watt. The energy budget of the light means that 300 electrical watts in must equal 300 watts out, as heat and light.
The watt in this case is primarily a reference to the amount of heat the current produces in the tungsten filaments of the bulbs. Some of the electrical energy is converted to heat and some to light.
Roughly 95% of the electrical energy in a 100 watt incandescent bulb is converted to heat and only about 5% to light.
Therefore, if S-B is used to determine the power available from ice per m^2, it is the equivalent in heat of nearly 3 x 100 watt light bulbs.
Don’t think so.
gordon, you have no clue, and you can’t learn.
A 100W incandescent bulb is likely emitting over 500,000 W/m² at its filament. You don’t understand the difference between “flux” and “power”. And you’re unable to learn.
But keep clogging the blog with your confusion. People need to see what happens to cultists. It’s not a pretty sight….
That’s brilliant [/sarc off].
The Sun can deliver 1300 watts/m^2 to TOA but a 100 watt bulb can radiate 500,000 w/m^2. You can’t even detect a warming radiation from a 100 bulb at a distance of 10 feet, yet you can easily feel heat induced by radiation from the Sun, some 93 million miles away.
I gave you the figures, only 5% of 100 watts is radiated from a 100 watt bulb, making it about 5 watts. That 5W spreads out in a sphere getting weaker as the square of the distance from the filament. At 10 feet, it should be reduced to about 5 milliwats/square metre.
No, the bulb would only be emitting about 8000 W/m². It’s the element that is emitting more than 500,000 W/m².
Don’t worry about it. You have no hope of understanding. Go watch the 3 Stooges.
Don’t know why you insists on making a fool of yourself when some simple judicious thought could reveal the flaw in your own arguments.
A 100 watt incandescent lamp with a tungsten filament outputs 100 watts of energy. Of that 100 W, 95% of the energy is heat and 5% is EM. That means 95 watts are heat and 5W are EM.
That 5 watts occurs at the filament itself with a small area compared to the sphere it would divide into at 1 metre radius. As you know, power dissipates in proportion to the square of the distance from the source in accordance with the inverse square law.
To get the power per m^2 at 1 metre, you divide by 4.pi.r^2 = 12.57r^2 = 12.57 m^2. Therefore 5 watts/12.57m^2 = 0.4 W/m^2, a far cry from your 500,000 w/m^2.
At 10 metres, that becomes 5W/12.57.100 m^2 = 5W/1257 m^2 = 0.004 W/m^2.
That explains why you feel little or no radiant energy from a 100 watt incandescent lamp.
This explains also why chicks in a brooder heated by an incandescent lamp can survive. The proximity of the lamp obviously supplies enough energy, both as heat and EM to keep them warm. If you put them in a room with a single 100 W bulb on the ceiling, they’d get no warmth.
1000 w/m^2 of IR is dangerous to human skin cells, can you imagine what 500,000 w/m^2 would do to human skin?
The 500,000 W/m² does not all leave the bulb, gordon.
You can’t understand any of this. And, you can’t learn.
BACK AT THE RANCH
More details on the Big Ag protectionist measures, I mean the aid packages to relieve small farmers:
https://bsky.app/profile/thechrisbenson.com/post/3m7r2ijbsh22m
Meanwhile, Dozing Donald’s tariffs are the largest US tax increase in terms of percent of GDP in over 30 years. Give that man a Peace Prize!
For several months now, every time ENSO 3.4 tries to rise above -1 °C it fails.
https://postimg.cc/ykVKS2Vw
Found this comment from David:
https://www.drroyspencer.com/2025/12/uah-v6-1-global-temperature-update-for-november-2025-0-43-deg-c/#comment-1725072
David’s comment is over a week old, but gordon did not respond. It’s a good question, for several reasons. First, it shows David is willing to question his beliefs. He has shown to be a Skeptic, but now he’s got a question that bothers him. He’s not going to simply believe in skepticism, he wants to learn. That’s the difference between a Skeptic and a cultist.
Second, David’s question goes right to the core of the CO2 nonsense — Can “cold” warm “hot”?
So, how are we able to use photons from a colder source in a warmer device? The one-word answer — Engineering.
A simple handheld IR thermometer can read the temperature of a colder object because of its design. A properly doped semiconductor is powered by a battery and designed to produce a voltage based on the energy of the photon. That voltage is then translated into a temperature. The device requires both the proper design, and an energy source. The combination allows it to do what nature cannot do.
We see this all the time. A human cannot fly. But, put the human in a properly designed airplane, with fuel, and he can fly as long as the fuel holds out.
It’s important to note that the cult kids cannot distance themselves from the “ice cubes boiling water” nonsense. They can’t leave their cult beliefs, so they can’t learn.
Hey Puffman, riddle me this –
https://engineeringlibrary.org/reference/radiant-heat-transfer-doe-handbook
How would you call Equation 2-12, and what makes you think you’ll be able to recruit “David” for Team Sky Dragon Cranks?
Clint,
thank you for picking up and answering my question. The answer shows thar it requires advanced engineering as opposed to a regular “self powered” thermometer, so therefore I conclude that the example is not useful for illustrating radiative physics, since it relies on external power.
To Willard, it is interesting how your comment pinpoints the obstacles around finding knowledgeable insights and formulating hypothesis in the general climate discussion or what you wat to call it.
I am seeking insights for my own interest, I am not on anybodys “team”. I have though experience as a team leader from the days in military. I can conclude that a team is not a good construction for nurturing ideas and free individual thinking, it is the exact opposite. a team cannot “think” but in a forum like this, ideas can be shared in written form, which is a good way to rach new insights. It does not requre a team though.
It is so obvious that this method is used to “kill” critical minds, putting them in a “bad team” to make people scared of joining them. MSM is doing it all the time. Now recently when Bill Gates stepped out to be more sensible around the “climate crisis”: He was immediately put into the bad “Epstein crew”, it is most likely false anyway given how they operate, BBC is now quite clearly proven to be a non-reliable source.
David,
It is unsurprising that you blame me for your lack of research skills or your overall incuriosity.
Please rest assured that your abusive behavior can’t be buried under bastardized benevolence for long, and that however magnanimous you might wish to portray yourself, in the end you shall be judged by the Climateball gods for your overall contributions hereunder.
Otherwise we might be temped to believe Dozing Donald when he declared his commitment to to the Murican values for which Charlie lived and died, and discount his mad tweet in response to Rob Reiner’s death:
https://www.cnbc.com/2025/12/15/rob-reiner-death-trump.html
We’d also have to ignore all the things you decided not to respond.
Best of luck trying to throw Bordo under the bus.
Clint R
In all the posts you are invoved in, other thab ball4, who makes the claim a colder surface can raise the temperature of a non-heated hotter surface. You keep on with the ice boiling water but who made this claim? You have not provided evidence that hot CO2 gas will not melt ice cubes. I have proposed a science experiment for you. We all know you don’t do any science so you will never perform any science. You pretend to hbe scientific but when science is requested you divert to some insult.
Norman, you’re making false accusations again.
Please clean up your act, and resubmit.
Clint R
What is thefalse assertion you accuse me of?
Assertion???
Playing with words is NOT cleaning up your act, Norman.
Last chance. Get an adult to help you, if necessary.
norman…”You have not provided evidence that hot CO2 gas will not melt ice cubes”.
***
Makes no sense Norman. Any gas above 0C should melt ice if it comes into direct contact with it. Whether radiation from the hotter gas will melt ice depends on how far it is located from the ice. It would be hard to tell whether any melting came from radiation or from air heated directly by the bulb and base, the latter making up 95% of the 100 watts output.
Radiation from a 100 watt incandescent light bulb will melt ice only if it is located very close to the ice. A 100 watt incandescent light tungsten filament could reach 3000 C yet at a distance of 1 metre, the radiation power has dropped to 0.4 W/m^2. At 10 metres it is a puny 0.004 W/m^2.
If you hang that bulb outside a foot away from an icicle, it will not melt the ice.
You are confusing what we have been talking about with something else. The point being made is that radiation from ice cannot heat a body at a warmer temperature. That means, in the atmosphere, heat cannot be transferred from colder GHGs in the atmosphere to the surface, or to any gases at a warmer temperature.
You guys are claiming a net transfer of heat, which is an impossibility since heat cant be transferred by its own means from cold to hot. It is also an impossibility since electrons in the atoms of a mass, while at a warmer temperature cannot absorb EM from a cooler mass.
That is basic science you should understand but in all the time I have been posting here I have noticed no attempt from you to understand it. You argue with me about dipoles in molecules, failing to grasp the dipoles are actual electrons orbiting multiple atoms in a molecule. The orbital becomes a dipole because the electrons tend to spend more time in the orbit closer to an atom that is more negative than the other atom.
Alarmist climate science is based on an obfuscation of verified hard science, also known as empirical science. Alarmists have methodically taken verified science and modified it to suit their pseudo-science. Then they have the temerity to claim that those of us advocating empirical science are spreading misinformation.
“The radiation from ice cannot heat a body at a warmer temperature” goes against the 2LOT so there is no hope for Gordon to be correct. Experiments do show radiation from ice can cause a higher temperature several inches deep in water.
Gordon
For clarification I had previously posted this to Clint R.
https://www.drroyspencer.com/2025/12/uah-v6-1-global-temperature-update-for-november-2025-0-43-deg-c/#comment-1725333
He claims that the photons emitted by CO2 cannot melt ice, he will not accept that CO2 lasers melt steel. So I set up an experiment he can perform to validate his hypothesis with an actual experiment.
Clint R can vary how far the ice is from the IR window as to get a good and valid experiment. He would also have to do it in a cold room so that only the IR emitted by the hot CO2 will have the potential to melt ice as all other sources of energy are below the melting point of ice. Also the container holding the hot CO2 will have to be insulated to prevent IR from the container altering what the test is designed to do.
Where do you get your facts that only electrons absorb IR? A whole field of study (IR spectroscopy) says you are wrong. You say I do not learn. I have used IR instrument when I was taking Chemistry classes to help identify unknown compounds by the IR signature. The electrons are not the only source of charge in a molecule. The positive nucleus provides the opposing charge. The energy an electron gains when absorbing visible light gives it energy to move up the electrostatic gradient. It does not gain kinetic energy, it gains potential energy based upon its position in the electrostatic field.
In a dipole molecule one side is actually negative and the other positive. External fields can orientate the dipole based upon this. Not less negative as you suppose but actual positive! The IR emitted by a dipole molecule matches the frequency of the dipole vibration. It is a vast branch of science you ignore in favor of your made up version. Why not spend time and study spectroscopy and learn what is being discussed. It is empirical science, experiment verified. Read up on it.
Dang Norman, you can’t refrain from proving me right. I point out every time that you make up false accusations, and here you go again:”…he will not accept that CO2 lasers melt steel.”
Where did I ever “not accept” that?
You’re sooooo desperate.
You know why you make up crap? Because you’ve got NOTHING.
And your phony “experiment” tries to equate 15μ photons to “hot CO2”, and boiling water to melting ice. You need some serious help from a responsible adult.
Otherwise, keep proving me right. I can take it.
clint to david…”A simple handheld IR thermometer can read the temperature of a colder object because of its design. A properly doped semiconductor is powered by a battery and designed to produce a voltage based on the energy of the photon. That voltage is then translated into a temperature”.
***
This is almost a viable explanation. Not taking a shot here, just clarifying.
All semiconductors are properly doped, meaning the silicon is injected (doped) with foreign atoms that add electrons to the silicon base of the semiconductor or detract from it. If the doping atoms add electrons, the silicon is named an n-type whereas electrons lessened is called a p-type.
Doping involves introducing atoms to the natural silicon that have an excess of electrons wrt the natural silicon in their covalent bands. Or, other types of atoms that have a lack of electrons wrt the silicon atom. The latter as said to produce an excess of holes, but I don’t buy that analogy and have managed a career in electronics thinking only of electron flow. A hole has no mass and speaking of entities flowing that have no mass is as nonsensical as EM having momentum.
A diode is formed when an n-type silicon is bonded to a p-type. At the junction, the electrons from the n-type interact with so-called holes in the p-type, setting up a small potential of about 0.7 volts in the silicon type, a potential that must be overcome before an electron current will flow through the diode.
We know from practice, that a silicon diode in series with a resistor making up a complete circuit with a 10 volt power source will have 0.7 volts automatically dropped across the diode, leaving 9.3 volts across the resistor.
If a p-type is sandwiched between two n-types, we get an NPN transistor, and the reverse becomes a PNP transistor. These devices are designed so that a ‘small’ current between one side of the NPN device, the emitter, and the middle region, the base, will stimulate a ‘larger’ current from the emitter to the third slab, the collector. So, we run a small current from emitter to base and through a limiting resistor to the power supply, while the collector end goes through another resistor to the power supply.
If we control the current running through the base circuit, that action will control a larger current running through the collector circuit. The difference between the base current and the collector current is the gain of the transistor, or the amplifying factor.
It should be noted that we are not getting something for nothing. All currents, both base current and collector current, come from the same power supply.
If we can arrange the materials in the device so they will favour frequencies in the infrared region, and create a small window in the device to allow infrared to enter the semiconductor, the IR will affect the amount of current running through the device. It does that by interacting with electrons in the device and the electron current is proportional to the frequency of the IR.
This can occur only because electrons are extremely small particles that will react to a relatively weak EM field. That was the basis of older TVs and the current cathode ray tube. Electrons boiled of a tungsten filament are drawn toward a positive source up to 40 kilovolts. En route, the electrons are shaped into a narrow beam using magnets and electromagnets.
Also, EM waves from radar and communications stations can produce enough electron current in an antenna (about 6 millionths of a watt) that can be amplified using the method described above for transistors.
It should be noted that subjecting the device to heat will have an entirely different effect. Semiconductors don’t take kindly to heat and steps are taken to limit external heating, even internal heating. If the device gets over-heated internally due to over-current conditions, it is subject to thermal runaway, where electron current is artificially stimulated. It can burn a device out if not limited quickly.
That runaway is being applied by alarmists to heat in the atmosphere and the theory is nonsense. That would require a positive feedback system that cannot exist without an amplifier.
Gordon,
That was a very extensive and clear explanation of the Thermal imaging sensor, thank you. The parallel with radars is interesting of course where the echoes are detectable from very far distances over widespread transmitted area, enough to create a high resolution image.
Basically, detection does not require absorption which is what I was after.
I remember from school that I was fascinated by the “electro boiling” you mentioned, you could then apply a magnetic field in a gas chamber containing a surface of boi1ing electrons and create different luminous patterns by modulating the magnetic field.
Came across this paper on glacier calving at the toe of glaciers where they meets the ocean. This, of curse, results in ice bergs and the infamous broken ice shelves alarmists like to rave about. Although this paper seems to think it is a complex problem, climate alarmists base it all on global warming, even if there is no evidence of such warming on the Antarctic mainland, for example.
https://www.uib.no/sites/w3.uib.no/files/attachments/benn2007esr.pdf
P. 29 of 37 under conclusions…
“The importance of calving and related dynamic processes in the mass balance of past and present glaciers and ice sheets means that there is a pressing need for practical but robust ‘calving laws’ in prognostic ice sheet models. In this paper, we have argued that such ‘laws’ need to be firmly rooted in an understanding of physical processes, including both the fracture mechanics and dynamic aspects of the calving problem”.
Modelers see no problem, they simply program CO2 into the model with a seriously exaggerated warming factor.
Skeptics’ objections to mainstream climate science are easily sourced from online echo chambers where such ideas freely circulate. They are, however, conspicuously absent from any actual institute of higher learning. Until now!
From the University of Unexamined Conclusions, Department of Applied Intuition, with copies on permanent reserve in the Apodictic Certainty Library, an authoritative review of climate ‘skepticism’: advanced dismissal of radiative transfer, feedbacks, and energy balance. Prerequisites waived. …
Introduction to that thing: https://ibb.co/ZRTXr1pz
Hemorrhoidal Theory: https://ibb.co/XZnS1zy0
Fac quod vis.
One might note that the “University of Unexamined Conclusions” is not a real or accredited educational institution, but rather a rhetorical concept that plays on Socrates’ famous statement, “The unexamined life is not worth living,” to highlight science’s need for critical self-reflection.
The phrase is used metaphorically to warn against the dangers of:
1/ Operating on implicit assumptions without questioning their validity. Just because we assume something is true doesn’t mean it is.
2/ Reaching foregone conclusions without considering alternative perspectives or evidence.
3/ Failing to apply critical thinking to deeply held beliefs.
SOLAR MINIMUM UPDATE
Prominent Geologist says ‘Global Cooling is Here!’ Cooling could ‘plunge the Earth into another Little Ice Age!’– October 30, 2008. Dr. Easterbrook, Emeritus Professor at Western Washington University, has authored eight books and 150 journal publications. http://www.ac.wwu.edu/~dbunny . Excerpt: Rather than drastic global warming at a rate of 0.5C (1F) per decade, historic records of past natural cycles suggest global cooling for the first several decades of the 21st century to about 2030, followed by global warming from about 2030 to about 2060, and renewed global cooling from 2060 to 2090. […] Recent solar changes suggest that it could be fairly severe, perhaps more like the 1880 to 1915 cool cycle than the more moderate 1945-1977 cool cycle. A more drastic cooling, similar to that during the Dalton and Maunder minimums, could plunge the Earth into another Little Ice Age, but only time will tell if that is likely. http://icecap.us/index.php/go/joes-blog/global_cooling_is_here_evidence_for_predicting_global_cooling_for_the_next_
Another Global Cooling prediction: ‘Sunspots are now predicting a 30-year cooling of the earth’ – By Global warming co-author Dennis Avery, an environmental economist – October 27, 2008. Excerpt: The sunspots are now predicting a 30-year cooling of the earth. That would thicken the Alaskan glaciers somewhat, but probably wouldn’t refill Glacier Bay with ice. That’ll have to wait for the next icy age. http://canadafreepress.com/index.php/article/5851
https://archive.ph/lbwrd#selection-681.0-685.1
How did these predictions fare?
Willard: “How did these predictions fare?”
It’s too early to say. We are now on top of 11-year solar cycle. Solar activity had been weakened with each cycle since the 70’s. Cycles 24 and 25 were record low. At the same time centennial 80-100-year Gleissberg Cycle is starting over like it did in 1910. So some researchers suggest that we are heading for a new grand solar minimum within the next few decades.
A grand solar minimum is a prolonged period of very low solar activity that often lasts for decades. Dalton minimum lasted from 1790 to 1830 and the Maunder minimum from 1645 to 1715. During these periods even solar maximums are weak.
Current 11-year solar cycle 25 began in December 2019 and has peaked this year as predicted. So we still have to wait 5-6 years for cycle 25 to end and see what happens then.
(DON) Rather than drastic global warming at a rate of 0.5C (1F) per decade, historic records of past natural cycles suggest global cooling for the first several decades of the 21st century to about 2030,
(MAX) Too early to say.
Willard: The length of the Gleissberg Cycle varies normally between 80 and 100 years. Current cycle started 1910 and is already 115 years long and will be 120 years when SC24 ends. Sinuhe, the Egyptian, often repeated this famous phrase “So there has ever been and ever will be”, reflecting the cyclical nature of life, death, and destiny. Sorry Willard, but the cycles of the Sun are not in our hands.
(DENNIS, in 2008) The sunspots are now predicting a 30-year cooling of the earth.
(MAX) We need more data.
Do these fools with their boiling ice cubes realize that boiling point is not a fundamental property of water. Boiling point is a function of temperature and pressure as the vapor pressure is a strict function of temperature (this will be difficult for some to understand). So yes, in the vacuum of outer space ice cube will boil all by themselves except it is called sublimation.
Exactly, there is no boiling without pressure.
The air in agricultural greenhouses is one of the items “put” there.
Air, in agricultural greenhouses, gets warmed as everything else inside there.
When ventilating greenhouses it lets in a colder air – just replacing warmer items with colder ones, thus the ventilation lessens the inside temperature, because it removes heat.
–
https://www.cristos-vournas.com
Clint R
Since you are of sound opinion that I post “false accusations” about you, I would like to clear things up on some issues.
I can ask some questions for clarity. You can respond with the following. a) for Yes b) for No c) for don’t know.
1) Can a hot surface absorb IR from a colder surface?
2) Can the IR emitted by hot CO2 melt ice?
3) Can the IR emitted by a colder surface reduce the cooling rate of a hotter surface?
4) If you answered “Yes” to Question 3) Can the emitted IR from a colder surface result in a hotter temperature of a heated surface?
That should be good for now. Maybe more if you take the time to answer these.
Thanks for omitting your usual insults and false accusations, Norman.
1) Can a hot surface absorb IR from a colder surface?
Depends on the photons and molecules involved. Photons can be different and varied, as can molecules. But the “general” answer would be “no”. There are some specific cases where photons from a colder surface could be absorbed, but that would not result in an increase in temperature.
2) Can the IR emitted by hot CO2 melt ice?
It would depend on which CO2 photons are involved. 15μ photons from CO2 could not melt ice.
3) Can the IR emitted by a colder surface reduce the cooling rate of a hotter surface?
No.
4) If you answered “Yes” to Question 3) Can the emitted IR from a colder surface result in a hotter temperature of a heated surface?
You may be confused by conduction where insulation can “slow the cooling”. But radiative flux is NOT insulation.
Clint R
Thanks for your response.
Your answers go against established physics and experimental evidence. Can you provide any sources that support your claims to make them actual science or are posters on this blog just supposed to accept your answers with no evidence?
You could easily test or have tested by your local High School science classes the result of Question 3 “3) Can the IR emitted by a colder surface reduce the cooling rate of a hotter surface?”
They may have vacuum pumps and could evacuate the air from the container. Have a hot object of same temperature (for the various tests) and record the cooling rate with some temperature measuring device connected to hot object. Greatly minimize any conduction so that radiant energy is the primary source of energy loss by the hot object. Change the temperature of the external container and see if the radiant energy of the colder external container will alter the cooling rate of the hot object located within it.
Sorry Norman, but you’ve reverted to your childish false accusations — “Your answers go against established physics and experimental evidence.”
WRONG!
My answers go against YOUR beliefs. That’s why you get so frustrated. You can’t show where my physics is wrong. You’re just making false accusations, again.
Grow up.
No Clint R 5:58 pm, all 4 of your answers go against the 2LOT since no entropy is produced during your described processes. Thus, there is no hope for Clint R to be physically correct.
b4…like Norman, you make a claim then fail to back it with a scientific explanation, I thought Clint’s answers were to the point and well within the realm of physics. None of the questions had anything to do with the 2nd law or entropy.
You talk about entropy being ‘produced’, but entropy, like temperature, is a simple relative measure of a ‘one-way’ heat transfer and heat level measurement, respectively. It’s not something that can be produced, it is a measure of the heat lost in a process and unavailable to do work.
Entropy can only be zero or +ve. If the process is reversible, it is zero and if irreversible, it is positive. It can never be negative, indicating the basic truth in the 2nd law that heat can never flow cold to hot, by its own means. That includes radiation, as indicated by Clausius.
In a case of thermal equilibrium, where two bodies of the same temperature are in very close proximity, it might be possible for a photon from one body to cross to the other and be absorbed but that cannot happen if there is a temperature difference where the photon is leaving the colder body.
To understand that requires an understanding of Bohr’s 1913 theory of the hydrogen atom. It is a simple theory and should not challenge anyone. Norman needs to understand Bohr since he thinks IR can be emitted from some other source than an electron in an atom.
There is simply nothing else there that can emit IR. That is made clear in the hydrogen atom where IR is emitted by the electron in hydrogen.
Clint R
My main point is to demonstrate what science really is. It is based upon evidence and experiments, observations and logical thought.
Your incorrect opinion of me is that I am frustrated because your answers go against my “beliefs”. No, I am asking you for evidence to support your answers. This is science and not frustration. You state the radiant energy of a colder surface will not slow the cooling rate of a hotter surface. Established science definitely says it will do this and even have equations established that will calculate the rate of reduction. Since your opinion is that it will not you need to provide evidence to support this with a valid experiment. Why are you afraid to provide real world evidence? When scientists have different ideas on how something works the resolution is experiment.
https://www.engineeringtoolbox.com/radiation-heat-transfer-d_431.html
This established physics link shows your physics is NOT valid or based upon any known laws of physics. It has a calculator in this link where you can change the temperature of the colder object and the rate of radiant energy loss by the hotter one is clearly reduced (calculated in watts).
Norman, you’re STILL making the same mistakes. You can’t learn.
In this example, you confuse your “beliefs” with reality. You have your beliefs, gained from the CO2 cult. Then you go to the Internet to find things you believe support your beliefs. That ain’t science.
When I show you that your beliefs are invalid, you get frustrated and angry and resort to insults and false accusations.
Your link uses the bogus “radiative heat transfer equation”. But that equation has no validity. It subtracts fluxes, which cannot be subtracted. The math may be correct, but the physics is WRONG. It’s like saying you can run 1000 mph because if you ran 1000 miles in one hour the equation shows you would be going 1000 mph. The math is correct, but the conclusion is WRONG.
Until you can admit you don’t have a valid model of “orbiting without spin”, you’re just faking science.
Now, what will you try next?
Clint R
My take from your post is that you have no scintific evidence to support your false beliefs. Rather than do any real science, like an actual experiment you divert and do some personal attack on me and science.
Gordon 12:51 am: As R. Clausius pointed out long ago, all real processes produce positive entropy so none of Clint’s processes can therefore be real as they do not show positive entropy.
There is no hope for Clint R to be correct.
Sorry Norman, but your “take” is only your belief. That ain’t science.
I explained the science to you, but you can’t understand it. In your “take”, you can run 1000 mph!
Like your cult brother, Ball4, you understand little of this. He’s using the term “positive entropy” to show he understands NOTHING about thermodynamics.
And now you revert back to insults and false accusations. Keep proving me right. I like being right….
Humorously here is no hope for Clint R being right when his described processes go against the 2LOT.
I did a little more reading and found out the paper is saying the same thing I’ve been saying. The only big change is at the edges of the CO2 band. There is no significant change over the part of the CO2 band that is saturated.
“For the CO2 15-μm band system (660 cm−1), the change in emission height, emission temperature, and tropopause flux is maximum on the edges of the band (Figs. 12b–d), where the CO2 optical thickness is about a few units”
The reason they come up with overall warming is their assumptions on water vapor are incorrect. The reduction in high altitude water vapor as measured by NOAA radiosondes over decades is ignored by climate science.
So you no longer believe this?
“They got the energy involved wrong. They only considered an increase in absorbency without also increasing emissivity.”
Thinking about what I wrote to B4 earlier re entropy.
The Clausius equation for entropy indicates that entropy must be greater than or equal to zero. It can never be negative since that would indicate a heat transfer from cold to hot, by its own means. It also means there can be no net transfer of heat, which would indicate a two way transfer between bodies of different temperature.
There is so much confusion on the Net re entropy and the 2nd law. The 2nd law is stated in seriously obfuscated ways, indicating to me that whoever is writing the articles does not understand it or entropy. I am no authority on entropy but I do understand the integral in the equation representing it and I can equate that to the ‘sum’ of infinitesimal quantities of heat in the Clausius subjective definition of entropy.
For example, I just read an article in which they stated entropy as….
integral ds = integral dq/T
The Clausius equation is…S = entropy = integral dq/T. There is no such thing as ds since entropy as a differential would render the meaning of Clausius meaningless.
That former equation is nonsense since Clausius defined entropy as the integral (sum) of infinitesimal change in heat (dq) at temperature T. That means you must establish a heat bath at temperature, T, then draw infinitesimal quantities of heat from the bath. The sum of the small quantities is the entropy.
Clausius coined the word entropy to indicate a transformation. By transformation he meant two things…
1)a transfer of heat from hot to cold.
2)an equivalence between heat and work. That is, heat can be converted to an equivalent amount of work and vice-versa.
One must understand both points to understand what Clausius is talking about in the 2nd law and entropy.
Ergo, entropy becomes the heat lost in a system and no longer able to do work. We can see that in the Gibbs frer energy equation…
free energy = G = H – TS
Where TS is the heat lost from S = integral dq/T
It says the integral dq = T.entropy, meaning the total heat lost, Q = T.S. This equation is often butchered on the Net.
Clausius also stated that heat transfer via radiation must obey the 2nd law. That amazes me, that he would know that, since scientists of his day were not privy to modern atomic theory and it’s relationship to radiation. He knew nothing about electrons since they were not discovered till significantly after his death. Yet, amazingly, he was able to state a definition for internal energy related to atoms, that involved both heat and work, as the vibration of internal atoms.
Entropy, as applied to a heat transfer via radiation reveals that heat cannot be transferred, by its own means, both ways between bodies of different temperatures. That was finally corroborated by Bohr’s 1913 statement of the basis of quantum theory, which is based on the single proton and electron in the hydrogen atom.
The fly in the ointment re radiation is that the creation of the radiation means an equivalent loss of heat at the emitting surface. The energy transferred then has no heat in it. If a body contacting the radiation is colder than the emitting surface, it can absorb the radiation and convert it back to heat.
If the receiving body is hotter, the radiation is ignored. I have explained the reason using Bohr’s theory and the electrons orbiting the nucleus of an atom and it supports the 2nd law as written by Clausius.
Gordon now writes: “the radiation is ignored”.
Now Gordon’s claimed process does not produce positive entropy so cannot be real per R. Clausius work long ago
There is no hope for Gordon to be correct.
NB: Gordon also writes “heat transfer by radiation”. Gordon still does not realize EMR is NOT heat.
Sadly, it appears the ‘bait and switch’ scam is now being employed by alarmists, B4 leading the way. The scam involves people advertising a product as bait only to switch the product to one of lesser quality, or one that is more expensive, when the hapless customer arrives. Here, the scam is used to bait the poster by misquoting (cherry-picking) what was said out of context, then switching the context again to make it appear as if B4 has the slightest idea of what he is talking about.
To summarize, climate alarmist bait and switch is about switching contexts. In yet another example, Norman offers questions, thinking he already knows the answer. He is trying to lure the reader into responding so he can clobber him with his peculiar understanding of science.
This is a sad technique used on forums throughout the Net and is commonly referred to as trolling. People employ the technique to rile other posters hence interfering with the running of the forum. Thankfully, I am wise to the process and don’t bite. I am replying here only to advise readers of the technique often used by alarmists. I am not trying to infer that Ark or Norman are trolling but B4 works at it hard.
In this same thread Ark uses it to make skeptics appears to be incompetent parrots who regurgitate only what they find on certain sites, deemed to be spreading conspiracy theories and misinformation. The sad part is that such chicanery represents exactly what he is trying to accomplish.
At least Ark and Norman try to post about science, as they see it, while B4 is mainly happy with sniping from the sidelines and using obfuscation to mask his lack of understanding of subjects.
The scam operated by B4 is as follows…
1)he cherry-picks words I have posted in such a manner as to misrepresent the context in which the words were offered. After I convinced him that radiation is not heat, he uses my claim in nefarious ways. His claim here re radiation not being heat has nothing to do with what I posted.
Furthermore, B4 does not understand entropy yet he insists on using the term to obfuscate his lack of understanding of the 2nd law.
2)After me spending considerable time explaining what Clausius meant by a positive entropy, B4 makes a disingenuous and meaningless association between positive entropy and my statement that radiation from a cooler body is ignored by a hotter body. This has nothing to do with entropy hence is a science-related obfuscation aimed at scamming the reader.
Gordon 2:47 am: no, the Clausius eqn. 64 for entropy is S – So = integral dQ/T which must be positive for a real process and Gordon’s process I noted does not have S – So positive thus cannot be real.
If Gordon is going to try to take anyone to school on what R. Clausius wrote, Gordon needs to use what Claudius actually wrote.
Gordon 4:30 am tries to walk back his own words but still needs to rewrite them physically correct. There is no cherry picking as I usually include a ref. to Gordon’s entire comment for readers.
Several news outlets have reported that China National Nuclear Corporation (CNNC) has connected the world’s first commercial supercritical CO2 generator to the grid. This unit is reported to have been installed at a steel plant in Guizhou province in southwest China.
The installation reportedly comprises two 15 MW units, and represents a meaningful shift from research and demonstration toward operational deployment.
One might note, with mild irony, that we (the US) have spent roughly two decades producing superb PowerPoint slides, roadmaps, and workshop proceedings on supercritical CO2 cycles, while China has now taken the more old-fashioned step of connecting one to the grid. Evidently, the thermodynamics were always sound; it was the permitting, funding, and tolerance for actually pouring concrete that proved more challenging.
https://youtu.be/wEwfIw6MUOo
Arkady: There have been similar power generation plants in commercial use from the late 1930’s in USA. They used mainly air as a working fluid, but other mediums were also used, including CO2. So there¨s nothing new here, other than smaller size of the whole unit.
A layman will not understand that CO2 becomes supercritical at 31.1 C and 1070 psi, and in the 1930s we only barely had the metallurgy to keep a standard steam boiler from exploding.
Even more important than the engineering marvel that is operating machinery handling a supercritical working fluid, is the fact that the CNNC rig is a grid-connected commercial operation. This is where the rubber meets the road.
Arkady: In the original Benson’s supercritical steam generator there was nothing that could explode. Completely safe system. And in 1957 they could operate Benson’s boiler at ultra-supercritical level! That unit in Ohio was also the first commercial supercritical steam-electric generating unit in the world that was connected to the grid.
Chinese are only re-inventing the wheel that was built in Berlin 100 years ago.
So, not the 1930s, not CO2, and you can’t name one grid-connected commercial sCO2 installation. Only dismissive rhetorical bias.
ark…”Skeptics’ objections to mainstream climate science are easily sourced from online echo chambers where such ideas freely circulate. They are, however, conspicuously absent from any actual institute of higher learning. Until now!”
***
Number one, your reference to mainstream climate science is a reference to mainstream consensus, not science. It is backed by unvalidated climate models that are programmed in such a manner as to output what the programmers want them to say.
The warming effect for CO2 is pegged at 9% to 25%, depending on the amount of water vapour, whereas the Ideal Gas Law pegs it at the mass percent of CO2, roughly 0.06%, That translates to a warming factor of 0.06C over the claimed 1C warming over the past 175 years, whereas nitrogen and oxygen are responsible for 99% of the warming.
The models are also programmed with a warming factor from a mysterious positive feedback which cannot exist in the atmosphere since there is no amplifier and the amplifying (runaway) positive feedback cannot work without an amplifier.
For another, I don’t go on any other blogs than Roy’s blog to discus science. The only other blogs to which I have contributed were those related to automotive issues or reverse engineering. I source skeptical views on science I have learned as part of my electronics career and as part of my studies of electrical engineering at university level.
When I first started trying to understand climate theory, it was in relation to a statement made by the IPCC that it is 90% likely that humans are causing the current warming. I had a very strong probability and statistics course as part of my EE courses and went deeply into the meaning of the confidence level, such as the 90% version spouted by the IPCC. I was curious as to how they could make such a statement never mind trying to apply a confidence level to opinion.
It did not take long via a Google search to find an article by Richard Lindzen, an MIT professor in atmospheric physics at the time. I was impressed by his credentials since MIT does not usually hire fools to teach the top-level students who attend MIT. Still, I was not prepared to accept his word based purely on academic status.
Lindzen served as both an expert reviewer and lead author on IPCC reviews and was highly critical of the process. He was particularly critical of the IPCC practice of having 50 politically-appointed lead authors write the Summary for Policymakers independently of the 2500 reviewers they had appointed. What seemed to irk him, and me, was the practice of issuing the 50-man Summary then re-writing the main 2500-person report to suit the Summary.
That is chicanery by any definition and indicated to me that the authority figure for climate alarmists is corrupt. Still, I wanted to remain open-minded and went about considering other claims made by alarmists. Not one of them has panned out.
I went through an IPCC review, page by page, looking for evidence, based on the scientific method, that the puny amount of CO2 in the atmosphere could cause global warming. I found not one explanation, only indirect references to 18th and 19th century scientists like Fourier, Tyndall, and Arrhenius, none of whom advocated a catastrophic warming effect from the CO2.
When I looked for evidence of rewarming from the Little Ice Age, I found about 1 paragraph, which focused on the propaganda that the LIA major cooling effect was in Europe only. I say major because the LIA caused glaciers like the Mer de Glace glacier in France to expand so much that it wiped out long-established farms and village in its path. Off the European coast near the UK, the briny ocean froze as much as a mile off-shore. How could that possibly affect only Europe while the rest of the planet was unaffected?
A scholar, Syun Akasofu, a geophysicists who pioneered studies on the solar wind, went against the flow and claimed the IPCC erred by excluding warming from the LIA. Rather than welcome his views, scientists who had formerly been friends turned on him. That typifies the reaction of alarmist climate scientists who fail to welcome skepticism but reject it and try to have skeptics disbarred as scientists.
That attitude typifies the extremes of the lunatics who had skeptics burned at the stake at one time. Rather than confer and discuss rationally, alarmists try, through stacked peer review processes and other nefarious means, to exclude skeptics from scientific discussions,
Only egotistical cowards engage in such behavior.
Ark is in the same camp, trying to discredit rather than discussing science intelligently.
david …”I remember from school that I was fascinated by the “electro boiling” you mentioned, you could then apply a magnetic field in a gas chamber containing a surface of boi1ing electrons and create different luminous patterns by modulating the magnetic field”.
***
The process is officially called thermionic emission. The idea is that heat is causing valence electrons to be literally boiled off the surface of a tungsten filament but it is actually electrons running through a very narrow, high resistance tungsten filament that produces the effect. We need to be careful in realizing that the actual physical process is not boiling, rather more an ejection due to valence electrons acquiring enough KE to eject.
I find it misleading referring to heat as the source when it is actually an outcome of electron processes. We are not introducing heat into the system, only electrons and their charges. The cause of the ejected electrons is electrons in valence bands gaining enough energy to escape the valence bands in surface atoms. The question arises as to how it works, a prosses I think remains unknown.
The KE that enables the electrons to escape is heat but it is not the cause of the escape, it’s the result of something else.
The actual source of the ejected electrons is the electric current applied to a high resistance like tungsten which is formed into a narrow filament. Therefore, the only energy introduced is electrical energy, which has no heat associated with it.
The heating is due to a large number of electrons being forced through a narrow area which has considerable resistance. That action causes the mass to heat up but that’s not what causes the electrons to eject. It is a gain in angular velocity of the valence electrons that causes an increased KE, hence an increased orbital trajectory.
The Joule heating involved is mathemitically described as…
Q = I^2R.t
The I^2R is measured in watts, or it’s equivalent, P = EI. There is also P – E^2/R but I have found you need to be careful applying that form.
So, it reduces to Q = P.t and that seems to say that current and resistance somehow conspire to create heat over a period, t.
But, how???
I would love to be able to see to the atomic level, to see what actually happens. In a copper conductor, there are 29 electrons in a copper atom allegedly distributed in orbitals with 2, 8, 18 electrons plus 1 sole valence electron. There are 74 electrons in a tungsten atom, distributed as 2, 8, 18, 32, 12, plus 2 valence electrons.
Tungsten has 3.3 times the resistance of copper per metre. It’s extra orbitals seem to make it harder for electrons to navigate their way through the tungsten atomic matrix, however, current flow is actually a measure of the number of electron charges not the electrons themselves. Somehow, the charges are able to transverse the tungsten atoms independently of the electrons.
There is a lot of bs on the Net about seas of electrons and the so-called metallic bond, and how a copper conductor is a matrix of positive ions with a sole valence electron free to do what it wants. The point is, we cannot explain the actions of essential particles like electrons, yet we are willing to bray about how physics works in general through generalities.
That applies across the board to climate theories where those espousing climate alarm conveniently ignore electrons which are the sole source of electromagnetic energy. From what we do know about them, they are amazing little critters that are essentially responsible for all EM in the universe as well as equally important to mass. Without them, there can be no mass, hence no universe.
The same can be claimed about protons and neutrons, however, it is the bonnie, wee electron that is free to move hence free to create EM.
norman…”Where do you get your facts that only electrons absorb IR? A whole field of study (IR spectroscopy) says you are wrong”.
***
I get my facts from basic chemistry and from decades of studying and applying electrons and electricity theory.
Once again, I ask you, where else in an atom can IR be emitted or absorbed? Consider the sole hydrogen atom. It has one proton in the nucleus and one orbiting electron. It absorbs and emits EM at several distinct frequencies/wavelengths, and according to Bohr, the electron is the sole element in the hydrogen atom that can emit/absorb EM as it transitions orbital to orbital.
Molecules are nothing more than these atoms bonded by electron bonds.
Lets look at elemental carbon, C, and oxygen, O. Carbon has 6 electrons, 2 in the inner orbital and 4 in the nest orbital. Oxygen has 8 electrons, 2 in the inner and 6 in the outer. What else is there that can absorb or emit EM? IR is EM, it has the same electromagnetic field and the same orthogonal magnetic field as any other EM, the only difference being the frequency of the electric and magnetic fields.
If you combine carbon and oxygen to form carbon dioxide, you get the following linear structure…..
O=====C=====O
The dashed lines represent double ELECTRON bonds either side of the C atom representing shared electron bonds. The dashed lines then are electron orbitals where the shared electrons spread out around both atoms in valence orbitals.
As in the hydrogen atom, the only way for CO2 to absorb and emit any frequency of EM is to emit/absorb via those electron bonding orbitals.
Norman, there is nothing else in CO2 that can emit/absorb EM, including IR. The protons in the nucleus do interact with the electrons in both atoms to create vibration but they do not radiate EM for the simply reason they lack orbitals and the means to change relative orbital energies.
That is the key. Electrons can change orbital energy levels, gaining KE as they transition upward then dumping it as EM as they transition downward. They can emit IR by dropping only one or two energy levels than several right to the ground level.
I won’t get into dipoles unless you can accept what I just said. Dipoles are formed based on electronegativity in the C and O atoms that affect electrons to form charges at either end of the dipole. The charges are both negative, from the electron charges, but one charge is less negative, making it relatively positive.
If you reply, try to post a link to your sources that allegedly refute what I am saying.
Norman, I have a lot of time for you and I know you mean well. However, I think you’d be better as a skeptic and I invite you to join our ranks. You can bring Clint with you. ☺ ☺
where else in an atom can IR be emitted or absorbed
Once again 7:43 am, the whole atom is needed to absorb and emit IR. The tiny electron is too small to absorb the entire photon.
Gordon Robertson
Your statement: “The charges are both negative, from the electron charges, but one charge is less negative, making it relatively positive.”
Is not based upon any Chemistry. It is just something you thought was true but it has zero basis and easily disproved. Water alone will prove this notion as false. Water exists as a liquid because of hydrogen bonding. This is the force of attraction between the positive (hydrogen) side of the water molecule and the negative (oxygen) side of the water molecule. Less negative does not create any bond with another negative. Negatives repel regardless if one is more or less negative.
Here is a video on hydrogen bonding. This should correct your false notion on “less negative” dipole. The dipole is actually positive and negative.
https://www.youtube.com/watch?v=aZ8JxFwR_nY
You say: “If you reply, try to post a link to your sources that allegedly refute what I am saying.”
Here is a video which totally refutes your understanding of IR, how it is absorbed, and how dipoles work. It is very detailed and quite real. Labs all over use this science to determine what an unknown compound is and it works very well in the real world. Not sure it will change anything with your thought process but you did request it.
https://www.youtube.com/watch?v=D8LtfCw74-0
Norman, I have seen you be on the right side of science, as above when you try to explain infrared emission to gordon. You even found a typo in one of my calculations. No other cult kid was able to do that. In addition, only you and Professor P have ever been able to correctly answer one of my physics problems. All the other cult kids run from physics. So you obviously have some ability. That’s why it’s sad to see you resort to insults and false accusations.
It also looks bad when you try to make up crap, like gordon and Ball4 do. I would encourage you to leave your cult and start seeking truth. If you don’t like me, look at other Skeptics that set a good example here, like DREMT, Richard M, Thomas Hagedorn, and David. (I know there are other good examples so sorry if I didn’t mention them all.)
It’s sad that a lot of “science” has been perverted, but it’s even worse that people, that should know better, help with the perversion. If you don’t understand, ask questions. And when you are faced with reality, don’t reject it, hating those that bring it to you. Sometimes reality is simple, like a ball-on-a-string.
Now, to this latest issue with infrared emission. You are correct about the charge distribution within some molecules. It is this charge distribution that allows for both the absorp.tion and emission of photons. gordon can’t understand the electron orbital transitions are much higher energy than infrared. Like a true cultist, he’s stuck in his beliefs and unable to learn. He just keeps clogging the blog, rambling nonsense and mentioning Bohr, Clausius, and Pauling, hoping to gain some credibility. (Notice he still hasn’t learned how to spell “Kirchhoff”. He just can’t learn.)
Here’s hoping you will take some of this to heart. It’s okay to question institutions, especially when they attempt to pervert reality.
Clint R
When I started interest in Climate Change, initially I was very skeptical as I had been taught of the great fear of Global Warming when I was in College in the 1980’s. I did strongly believe the scientists when they predicted massive changes in climate that could lead to crop land becoming deserts. It was a concern but lost interest in it, then I got into it again and started on blogs like Skeptical Science. I was being a skeptic on this blog and it did seem to be cult minded. I was eventually banned and came here. I had beliefs and ideas but the more I interacted I realized my knowledge was lacking so I spent effort at learning the physics behind heat transfer. Gradually I understood GHE, how it works and why it is a potential danger.
You bring up ideas that are not supported by established science. It is wonderful to question established views but not wonderful just to outright reject them like saying a well established radiant heat transfer equation has no validity. That is not questioning, that is just stating an unsupported point. If you want to prove established science is a cult, wrong or intentionally deceptive you have to do this with evidence, experiments or observations. An argument that fluxes don’t add or subtract is not valid with no supporting evidence . The established science and the establishment of the radiant heat transfer equations was not just made up out of thin air to deceive people. It is based upon years of rigorous and countless experiments with careful measurements and detailed experimental set-ups. A rational skepticism would maybe question the conclusion of an experiment or point out possible misinterpretations of results but it would not claim (without evidence) the science wrong. If you want me to accept your point that the radiant energy of a cold surface can’t slow down the cooling rate of a hotter one (which established physics says will happen as given in the “Engineering Toolbox” site I linked you to in a previous post.
I am going on evidence based science. When evidence is provided I at least will consider it. With no evidence provided I will stick with the established physics and not assume all the researchers that did experiments over several years by several different people were out to intentionally deceive people. It is a possibility that the Conspiratorial World View is the correct one, but I think it is an extremely low possibility and so unless really strong evidence is provided to overturn the established view, I will continue to accept what established science claims.
Sorry for the long post but you bring up some material that needs to be addressed.
Yes Norman, your comment was long. But, you didn’t address anything I said. You evaded.
You stuck to your cult beliefs, in complete denial of REAL established science. You clung to your cult beliefs, evading reality. Want an example?
WRONG!
That bogus equation definitely was made up. It has NOTHING to do with radiative heat transfer. Fluxes don’t simply add/subtract because they consist of photons, and photons don’t simply add/subtract. Your cult has NO understanding of radiative physics and thermodynamics.
Prove me wrong: Add two photons for us. In a vacuum, photon A has a frequency of “F”, and a direction of 15°. Photon B has a frequency of “2F”, and a direction of 85°. What is the “sum” of the two photons?
You can’t answer.
It gets even worse for you:
* What is your definition/description of the “greenhouse effect”?
* What is your definition/description of “orbiting without spin”?
You can’t answer either question so that your answer can’t be easily shot down with basic science. Prove me wrong.
You belong to a cult that feeds you crap, and you swallow it down without question. Up above you see your cult claiming that ice cubes can boil water! Yet you get mad at those trying to help you.
Clint R
Not sure what you are asking here, does not make much sense to me.
“Prove me wrong: Add two photons for us. In a vacuum, photon A has a frequency of “F”, and a direction of 15°. Photon B has a frequency of “2F”, and a direction of 85°. What is the “sum” of the two photons?”
The energy of the photons adds at a surface. 10 identical photons hitting a surface will add 10 times the energy to the surface as will 1 photon.
I have told you plainly that if you want people to accept your posting, you have to provide valid evidence. If you claim a well established and used equation is bogus than you need to prove this statement with verifiable evidence and some experimentation. The basic heat transfer equation is a skeleton form. When used in engineering more factors are added like emissivity, view factor. You can call a valid equation bogus all you need to, it does not make it bogus. Experimental evidence could determine it is bogus. Your declaration and assumptions about radiant energy transfer will not make a valid equation bogus. That is why I would not want to join your invalid skeptic group. You are a counter cult to the cult minded at Skeptical Science blog. You do not provide evidence to support your claims. You think repeating them or stating them with authority somehow makes them true. Science has never worked that way. An experiment is required. You need to prove a cold surface will not slow the cooling rate of a hotter one. You have not done this.
Clint R
* What is your definition/description of the “greenhouse effect”?
* What is your definition/description of “orbiting without spin”?
I have answered both of these multiple times.
Greenhouse effect works as a radiant insulation. The visible light spectrum of solar energy is transparent for the atmosphere so it passes through and is absorbed by the Earth surface which then heats up. The surface does not reach a temperature to emit visible light but does emit in IR band. The GHG reduce the rate IR energy is lost by the surface, so the radiant surface cooling process is reduced allowing the same solar input to maintain a higher surface temperature. Hotter air in a car sitting in the Sun is a good example of how reducing the rate of energy loss (even with same input energy…inside air in car vs air outside car) can allow the same solar input to maintain a higher temperature.
On the orbiting without spin. I have told you many times to get a couple cans out and run a test. Orbiting without spin (moving one can around the other “orbiting” the center can) would be to move the can around with no rotation of your hand. The center can will see all sides of the can. If the Moon did not rotate once per orbit humans on the surface would see all sides of the Moon and it would have perpetual day on one side and perpetual night on the other. This would be a non-rotating moon. Any rotation of the Moon on its own axis and you will have a day/night cycle. If it rotates once every 28 days you have 14 days and 14 nights. Other rotation speeds would result in different day/night lengths.
Sorry Norman, but you have failed again.
Your attempt to explain the bogus GHE didn’t even mention CO2. And your attempt to explain orbiting didn’t take into account you must rotate the can to make up for lack of gravitational effect. Gravity provides the vector to keep Moon from rotating. Like the string on the ball. You have no understanding of the sciences involved.
Which proves me right, again. I don’t mind….
Clint R
Not a failure at all. Your statements again have no supporting evidence so they are just babble. Not really meaningful. You say “bogus”. Means nothing! I did refer to CO2 with the general term GHG (this is short for Green House Gases and is not limited to CO2 which is just one of them, water vapor, ozone, methane and others are also part of the greenhouse effect).
I gave you a clear real world example of a “greenhouse effect” with air in a car reaching a higher temperature than air outside. Both are heated by the same solar input, one is much hotter. The difference is in rate of energy loss. So what is your evidence it is “bogus”? I said that is NOT science! I am getting more certain with each and every one of your posts you have no understanding of the foundation of science. It seems you think if your brain says something is real it magically is true. Science does not work on that basis. It is based upon experiment. If you wish to be a real or valid skeptic of established science you must do experiments to prove the established science wrong. I gave you an experiment you can perform to prove your statement that a cold surface will not slow down the rate of heat loss of a hotter surface.
Clint R
YOU: ” Gravity provides the vector to keep Moon from rotating. Like the string on the ball. You have no understanding of the sciences involved.”
What?? Where do you get your nonsense from? No science book would make that claim! Gravity does not stop rotation like a string!!
Do you know how many planets rotate in our solar system that are gravitationally linked to the Sun? Gravity only bends the path of a mass into a circular path. It is not holding on to the planets in a rigid way like a string. Your brain is stuck in elementary class. I think it is time for me to give up with trying to educate you in science. From past encounters with your thought process I did realize nothing would change your level of ignorance and arrogance. I respond when I see you posting primarily in hope of not letting your nonsense destroy the inquiring minds who visit this blog.
Again Norman (Noman), I’m sorry you failed.
You had one chance to define/describe your cult’s GHE, and you completely forgot to mention CO2. Then, you had one chance to define/describe “orbiting without spin”, but you chose to evade the issue, ranting that planets can spin. The point you can’t understand is a spinning planet, or moon, would reveal all sides to its host. Gravity, by itself, does not produce spin. If only gravity were affecting a planet or moon, the host would only see one side of it.
You always claim that I avoid science, but you didn’t answer the science problem about adding photons. You’re convinced fluxes simply add, yet you can’t add photons!
So, as usual, you blew it.
Also, as usual, you resorted to insults and false accusations, proving me right again. Works for me….
BACK AT THE RANCH
Former U.S. Justice Department special counsel Jack Smith told lawmakers in a closed-door interview on Wednesday that his team of investigators “developed proof beyond a reasonable doubt” that Dozing Donald had criminally conspired to overturn the results of the 2020 election, according to portions of his opening statement obtained by The Associated Press.
https://www.ctvnews.ca/world/article/jack-smith-tells-us-lawmakers-his-team-developed-proof-beyond-a-reasonable-doubt-against-trump/
The warming effect of CO2 in the Earth’s atmosphere cannot be estimated from the Ideal Gas Law because it doesn’t take into account the radiative properties of CO2. It only describes the mechanical behavior of a gas.
The peak IR emission from the Earth’s surface matches a significant natural frequency of CO2. It is this resonant affinity that makes CO2 an effective greenhouse gas.
Sorry Ark, but 15μ does not match 10μ.
You’re making crap up again.
The Ideal Gas Law is blind to the specific molecular properties and spectral a b s o r p t i o n features of greenhouse gases, as demonstrated in the observed spectrum: https://ibb.co/kVPKxgbM
Ark, you are blind to the fact that that graphic doesn’t mean what you believe it means.
But, I’ll let you provide the exact wording — What do you believe it means?
Arkady,
“The peak IR emission from the Earth’s surface matches a significant natural frequency of CO2. It is this resonant affinity that makes CO2 an effective greenhouse gas.”
–
–
But there is not any “peak IR emission from the Earth’s surface”…
And, Earth’s surface doesn’t emit at “a significant natural frequency of CO2″…
–
https://www.cristos-vournas.com
Earth’s surface emits broadly from 4um to 40um. There are long tails either side, but this is the central emitting range with the peak at 10um.
Of course, CO2 and other gases sit well within this spectral range.
Thank you, barry.
“Earth’s surface emits broadly from 4um to 40um. There are long tails either side, but this is the central emitting range with the peak at 10um.
Of course, CO2 and other gases sit well within this spectral range.”
Arkady,
“The Ideal Gas Law is blind to the specific molecular properties and spectral a b s o r p t i o n features of greenhouse gases, as demonstrated in the observed spectrum: https://ibb.co/kVPKxgbM”
What do you see in the observed spectrum that proves something about the CO2 – because it is not obvious by just looking at graph.
What it is the graph exactly say?
–
https://ibb.co/kVPKxgbM
The IGL and the heat diffusion equation are measuring the effect of the CO2 warmed by IR radiation. After the CO2 warms it must transfer that heat to the 2500 molecules of nitrogen and oxygen (plus other minor gas molecules/atoms) surrounding each CO2 molecule, and that’s where the limitation of 0.06C comes in.
When you have a gas in a mix making up only 0.06% of the total gas, and it needs to transfer heat to the rest of the 99.94% of the gas, the amount of heat it can transfer is proportional to it’s mass percent. Do the math, there is no magic to CO2 that can allow it to warming the atmosphere significantly.
That’s because the transfer is via direct conduction, which is a very inefficient way of transferring heat, molecular collision to molecular collision.
It’s likely less than 0.06C per 1C warming of the gas due to the inverse temperature relationship with altitude. When the gas molecules are in ambient temperatures ranging from an average of +15C to lows greater than -60C, how much heat can survive never mind be transferred.
Also, after a certain height in the stratosphere, the air gets so thin it is close to a vacuum. Seems to me that a lack of air molecules renders temperature measurements a moot point.
The fact that the Ideal Gas Law [“and the heat diffusion equation“] cannot replicate the measured satellite data defeats all attempts to obfuscate the radiative forcing of CO2 (and other greenhouse gases). Despite CO2 being ~0.04% of the atmosphere by volume, it dominates the spectrum near 15 μm.
This expanded figure 8.3 (Petty 2006) https://ibb.co/chfy3mmq shows that, if atmospheric heating scaled with mass fraction, the CO2 trough would be negligible.
Another obfuscation is the misunderstanding of the atmospheric temperature structure. The stratosphere is not “close to a vacuum” in the radiative sense.
Vertical Temperature Profile: https://ibb.co/QFW5vSr6
Arkady,
“The fact that the Ideal Gas Law [“and the heat diffusion equation“] cannot replicate the measured satellite data defeats all attempts to obfuscate the radiative forcing of CO2 (and other greenhouse gases). Despite CO2 being ~0.04% of the atmosphere by volume, it dominates the spectrum near 15 μm.”
–
Please, Arkady, explain what exactly do you see in that figures? What measured satellite data? What ideal gas law?
–
What I am convinced is that the entire earthen atmosphere doesn’tplay a significant role, not to mention the trace content in thin air of the greenhouse effect gases.
CO2 doesn’t warm earth’s surface – never did, and never will, because there is too little of CO2 ib the atmosphere.
Arkady, you say: “Despite CO2 being ~0.04% of the atmosphere by volume, it dominates the spectrum near 15 μm.”
CO2 dominates nothing, because there is nothing to dominate. How it comes, you say, CO2 diminates? What does CO2 dominates?
–
https://www.cristos-vournas.com
Christos, it takes the sun shining thru added ppm CO2 and other IR active gas to warm the lower atm. regions as shown in part by top post.
Thank you, Ball4.
Doesn’t lower atmosphere get warmed by surface?
Doesn’t it get warmed by convection?
–
https://www.cristos-vournas.com
Christos, the extreme lower atm. in contact is equally warmed and cooled by surface and convection as has been thoroughly measured over climate time-frames. Sun warming lower atmosphere with added ppm CO2 as measured is monotonic warming.
Christos Vournas at 11:17 AM.
The image I provided serves as empirical evidence for the very phenomena you are denying. (https://ibb.co/chfy3mmq)
There is nothing more that I, or anyone, can do to help if you refuse to accept the established facts of physics and evidence from measured data. Education is a choice, and the resources are widely available for anyone genuinely interested in the science.
Thank you, Arkady,
“…to accept the established facts of physics and evidence from measured data.”
–
There are no evidence from measured data in the graph you provided.
Please provide evidence.
–
https://www.cristos-vournas.com
Thank you, Ball4.
First, what exactly we discuss – is it about the, as many times allegedly said, that the tiny rise of the trace CO2 content in earth’s thin atmosphere is a so much strong forcing that it is capable of causing a rapid global warming,
or the discussion is about the atmosphere – in general – being mistakenly considered as a “warming blanket”?
–
https://www.cristos-vournas.com
Ark, you keep linking to those graphs. You are implying that they mean something. So what do they mean to you?
You should be able to explain the links you find, right?
Exactly the physics would involve the optical depth of a planetary atmosphere such as Earth’s.
yes, of course water vapour makes a measurable difference. But it is localized where and when a higher air humidity occurs.
The difference is local and limited.
It has nothing to do with the alleged average global +33C atmospheric greenhouse effect.
Because earth is warmer than moon not from the existence of atmosphere (the blanket effect), but because earth has the planetary surface (N*cp) product 155,42 times higher than moon’s..
Now let’s compare Tmean.earth /Tmean.moon = 288K /220K – = 1,309
and (155,42 )^1/16 = 1,3707
//////////////////////////////
Moon with Earthen Albedo a = 0,3 would have Tmean.moon = 210K
288K /210K = 1,3714
///////////////////
–
https://www.cristos-vournas.com
clint clown…”Now, to this latest issue with infrared emission. You are correct about the charge distribution within some molecules. It is this charge distribution that allows for both the absorp.tion and emission of photons. gordon can’t understand the electron orbital transitions are much higher energy than infrared. Like a true cultist, he’s stuck in his beliefs and unable to learn. He just keeps clogging the blog, rambling nonsense and mentioning Bohr, Clausius, and Pauling, hoping to gain some credibility. (Notice he still hasn’t learned how to spell “Kirchhoff”. He just can’t learn.)”
***
At least I reference Bohr, Clausius, Pauling, et al, all we get from you are uniformed opinions based on your own distorted and grade school view of science. If you want to prove me wrong, you will need to use your understanding of these experts, which is slim to none, and explain why my interpretation of them is wrong.
You are still carrying on with the nonsense that electrons don’t or can’t emit/absorb IR. I have asked you, and Norman, in the past, to explain what else in an atom or molecule can emit or absorb IR. You two seem to think a molecule or an atom has a magic box marked ‘for IR emission and absorption only’.
IR is electromagnetic energy of a lower frequency and a longer wavelength and as such has an electric field orthogonal to a magnetic field. Furthermore it has a distinct frequency/ wavelength. Do you think it coincidence that the frequency and electric/magnetic fields in EM come from electrons, the only particles that have an electric and magnetic field and an orbital frequency?
Norman has opined that EM gets its frequency from vibrations in a molecule but where do the vibrations come from? Only one place, the electron bonding the atoms together. The vibrations are in the electron bonds and are by the interaction of the positively charged nucleus interacting with the negatively-charged electron as it orbits.
Here again is the CO2 molecule…
O=====C=====O
The dashed lines are double electron bonds connecting the O-atoms to the lone C-atom. That is where the vibrations occur, either as longitudinal vibrations along the x-axis or slightly about the x-axis on either end of the C-atom. The only way the vibrations can change is if the electrons in those bonds gain or lose KE.
The proton cannot change its kinetic energy relative to the electron but the electron can wrt the proton by absorbing heat, EM, or electrical energy. As the electron gains and loses KE the bonds vibrates more or less. Also, as it gains KE and drops to a lower orbital, it emits EM with a frequency proportional to its angular frequency.
I have also pointed out to Norman, and he has failed to confirm it, that the hydrogen atom has only one electron and one proton. Yet, it emits and absorbs IR. No magic IR box there, or significant vibration, the only element that can emit and absorb EM is the electron. What are the chances it does that re IR only in hydrogen?
Go on, Norman, check it out.
https://tinyurl.com/4urx2eem
Gordon Robertson
I gave you a really good link to a video explaining if great detail the dipole motion that generates and absorbs IR. The IR graphs that are produced are well explained by the correct understanding that the frequency of IR absorbed is based upon the strength of the molecular bond that determines the frequency the dipole vibrates at. You have a vibrating plus and minus charge which is what EM is a vibrating electromagnetic wave. Electrons will generate EM but so will dipoles and protons or any moving electric charge object that changes velocity. You can post your made up nonsense for many more years. It is sad you do not at least try to understand where the real science is and prefer your own made up unsupported version.
I would like you to explain an IR graph based upon your current theory that dipolar molecules cannot absorb IR but only electrons. What electron transitions are responsible to explain and IR graph?
The current understanding works extremely well in explaining the graphs and it actually helps scientists identify unknown compounds based upon how different molecular bonds absorb IR.
https://docbrown.info/page06/spectra/ethanol-ir.htm
Explain how your understanding produces this graph? Which electron transition generate this graph. You are lost in the wilderness of nonsense and made up ideas. Wish it was not the case but here we are. You won’t be able to come up with an explanation for the graph because your ideas are really wrong and very bad, totally a fabrication of your limited understanding of Chemistry and an unwillingness to give up your made up beliefs (probably and ego thing where you believe you are a genius and all the other scientists are just clowns who have no real thinking abiltity…too bad you are missing out at how incredibly intelligent they were to figure out all these things).
norman…it’s pointless having this discussion with you since your understanding of basic atomic theory is simply not there. You keep talking about molecular bonds emitting and absorbing EM without understanding that the bonds are actually electron orbitals. It is electrons that bond the atoms making up a molecule, not a rubber band or something like that, or a battery with a distinct negative and positive terminal.
You also fail to grasp the fundamentals of electronegativity, which is fundamental to understanding dipole bonds. If you have a single electron with a negative charge orbiting two atoms in a molecule, and the electron charge spends more time in the presence of one atom, it automatically gives that orbital a more negative charge on that end of the orbital. That is a dipole by definition. In a relative sense that means the other end of the orbital less negative, hence RELATIVELY more positive, forming a dipole.
You are missing the point that in an electron orbital there can be only negative charges. There is no positive charge anywhere, as in a proton. In a capacitor, if you charge one end with electrons, it makes that plate more negative relative to the other plate but the other plate is classed positive wrt the more negative end. That does not mean it contains positive charges.
If you have even one proton, with a +ve charge, separated from an electron with a negative charge, you have a distinct positive and negative charge. A battery operates by separating the -ve charge on the electron from other ions in a chemical mix. That is done by using electrodes that attract electrons and electrodes that produce a relative positive charge on the other electrode. When the electrodes are connected to a conductive circuit, the electric charge at the electrode with an excess of electrons ‘senses’ the other electrode through the circuit (electric field) and wants to dump its charge to produce a neutral condition.
You posted a link to water molecules the other day in which the H-end was marked +ve and the O-end -ve. That is incorrect and the author is either stoopid or misinformed. The H-end and the O-ends are both negative but the oxygen atom, having a stronger electronegativity, has negative electron charge for a longer time hence is slightly more negative than the H-end.
test
ark…”The image I provided serves as empirical evidence for the very phenomena you are denying. (https://ibb.co/chfy3mmq)
There is nothing more that I, or anyone, can do to help if you refuse to accept the established facts of physics and evidence from measured data. Education is a choice, and the resources are widely available for anyone genuinely interested in the science”.
***
You present a graphic that is more fiction than fact, then accuse anyone questioning it as having a lack of education. It is clear that your problem is the typical belief system acquired by students who readily absorb everything taught to them by paradigm-driven universities while failing to think for themselves.
The prof becomes the authority figure. I moved on from that belief system long ago. Many of my profs were excellent but they were required to offer lectures based on a university prescribed paradigm. Our job as student was to regurgitate the paradigm accurately on exams for fear of failing. I learned much later that a good deal of what I had been taught was subject to change and some of the physics taught today, with a high content of imaginative rubbish, is plain wrong.
The graphics you present are simulations, not actual measurements by instruments. There is a good reason for the simulations, there is no way for measuring instruments to ‘see’ through the atmosphere hence are limited to certain depths of perception. The rest is done by humans, who extrapolate the measurements generously to show what they want to see.
It is well revealed in this file, the amount of simulation that is involved.
https://gmd.copernicus.org/articles/16/1379/2023/gmd-16-1379-2023.pdf
It’s clear from this article that a lot of simulation and guessing is involved. From the first paragraph alone, “However, a good agreement between simulated and observed integrated OLR fluxes may be obtained from the cancellation of opposite-in-sign systematic errors localized in specific spectral ranges”.
They are referring here to a comparison between GCM (models) and actual measurement:, but nothing has been said thus far about how the measurements are made. It seems to be concluded that the measurements are kosher and they are not.
Or I should say, the instruments can only measure what they were designed to see. They are obviously detecting something in the infrared band but the whole of what they are seeing is left up to interpretation.
For example, the AIRS (Atmospheric Infrared Sounder) breaks the IR spectrum into some 2000+ frequency bands. The AIRS telemetry is presumed to read IR intensity accurately in these bands but I know of no infrared devices that can read specifically in narrow bands. More likely, they are taking a broader band of frequencies from an instrument and electronically filtering it into narrower band. If so, that method is fraught with difficulty.
The AIRS device is onboard a satellite since 2002 along with the AMSU unit used to measure temperatures. However, the AMSU unit only has to focus on a relatively narrow band of frequencies in the 60 Ghz range emanating from one gas in the atmosphere, oxygen. That is entirely doable since the O2 spectrum is broken into a few bands based on altitude. Even at that, a good deal of interpretation has to be applied by UAH to get a refined temperature series from the instruments.
The mind boggles at even attempting such an analysis from the jumble of data received by the AIRS IR telemetry. And that’s for a straight instrument reading. What about something as seriously complex as a Michelson interferometer which depends on splitting frequencies into two paths then recombining them to produce interference patterns?
You pass this off as a triviality even though you appear to be ignorant of the processes involved. The Michelson interferometer was never designed to measure a range of frequencies never mind a range as extensive as that found in light and/or IR. It was designed based on one frequency from a coherent source like a laser, that when split, could be delayed so the time between beam arrivals, measured at a common target, could be measured.
Michelson was trying to measure the speed of light on one hand and to prove that the Earth was not moving through an aether as claimed by physicist Dayton Miller. Miller had hypothesized that the speed of light was limited by an aether through which it passed. Einstein claimed that if Miller is right his theory of relativity is wrong.
How such an interferometer can be applied to detect the IR frequencies and their related intensities coming through the atmosphere is not clear. A whole lot of smoke and mirrors has to be involved.
From the Introduction at link above…
“The outgoing longwave radiation (OLR) flux, defined as the radiance emitted at the top of the atmosphere integrated over the solid angle and over the spectral range from 100 to about 3330 cm-1 (3–100 µm), is a key quantity controlling the Earth’s radiation budget, and its accurate representation in general circulation models (GCMs) is crucial to obtain reliable historical and future simulations”.
Note the reference to ‘integrated’, meaning it is calculated, not measured. In a previous post, the so-called surface emission spectrum was overlain with the blackbody spectrum in the same range of frequencies. The emission spectrum was then claimed as a comparison to the calculated and theoretical BB spectrum. Both spectra were in fact calculated, not measured directly.
This produces a major problem. Since there is no such thing as a blackbody, no known BB spectrum exists. Therefore there is nothing with which to compare instrument measurements other than a calculated, sci-fi quantity.
I am not disputing that telemetry like AIRS is measuring ‘something’ wrt to IR, I am objecting only to the inference reached as to the meaning of the data. The telemetry is not seeing a full spectrum of CO2 for example since much of the CO2 spectrum is overlain by the water vapour spectrum.
Also, the AMSU telemetry is measuring oxygen emissions in only 15, or so, channels. AIRS is claiming a similar measurement using over 2000 channels. Based on my considerable direct experience with this in the field of electrons, I don’t see how it is possible. Furthermore, each of those detectors can only receive in a wide band of frequencies therefore each adjacent instrument is overlapping with the one above and the one below.
The frequency bands overlap generously in the AMSU unit as one might expect in an acoustic graphic equalizer. When you adjust the attenuator in one frequency band, it affects the signal in an adjacent octave, or semi-octave. However, the AMSU units use weighting functions that can compensate in part for overlap. And the instrument output compares favourably with telemetry in weather balloons.
In Figure 1 on page 6 of 16 at the link above, one can see the graphic posted here earlier. The description reads…”Spectrum simulated in clear sky conditions…”. Then directly below in Figure 2, they show more CALCULATIONS.
This IR spectroscopy is not the ideal science you seem to think. Numbers are received from the telemetry then loosely interpreted to represent certain theories.
Skeptics’ objections to the data I posted at https://ibb.co/chfy3mmq are based on misunderstandings and incorrect assumptions about spectroscopy, interferometry, and radiative transfer, fields that have been experimentally mature for decades.
The graphs display the infrared emission spectra of the earth and atmosphere measured (not a simulation) by the Infrared Interferometer Spectrometer (IRIS) carried on the Nimbus 4 meteorological satellite, looking down at different locations on Earth: the Sahara Desert, Antarctic Ice Sheet, tropical Western Pacific, and Southern Iraq. The Nimbus 4 mission spanned from April 8, 1970 to September 30, 1980.
The horizontal axes show the spectrum of infrared radiation using both wavenumber and wavelength. The vertical axis shows the intensity of the outgoing radiation.
The dashed lines are the theoretical Planck curves for various temperatures, ranging from 190 K to 330 K, in increments of 10 K. They are used as a quantitative reference to estimate the temperature of the radiating surfaces or atmospheric layers observed by the instrument.
The solid, jagged lines show the actual infrared radiation intensity measured by the instrument.
The figure stands. The physics stands. Further discussion would be redundant.
P.s.: Telemetry is simply the transmission of data. The measurement occurs at the detector where incident spectral radiance produces a physical signal.
Ark, what do you believe those graphs mean? Yeah, you can search for a lot of blah-blah, but what do the graphs mean?
This is my third request for your interpretation, so if you don’t answer I can only assume you don’t really understand the graphs.
“In Figure 1 on page 6 of 16 at the link above, one can see the graphic posted here earlier. The description reads…”Spectrum simulated in clear sky conditions…”. Then directly below in Figure 2, they show more CALCULATIONS.”
More misunderstandings and incorrect assumptions.
YOUR linked Figure 1 in a paper from 2023 is explicitly labeled as a simulated spectrum because its purpose is model evaluation, not instrument description. The authors are testing whether radiative transfer models reproduce observed spectra under controlled (clear-sky) conditions.
You found a simulated figure in a modeling paper; Whoop-de-do!
“This IR spectroscopy is not the ideal science you seem to think. Numbers are received from the telemetry then loosely interpreted to represent certain theories.”
IR spectroscopy is among the most experimentally mature branches of physics. Satellite instruments are not inventing spectra; they are measuring radiance at wavelengths whose molecular origins are independently known and have been repeatedly validated.
My original point stands: If CO2 warming could be estimated from the Ideal Gas Law and heat diffusion equation alone, the outgoing spectrum would be smooth and Planck-like, with no gas-specific features. IR spectroscopy is the only experimental tool that directly measures the mechanism by which CO2 affects Earth’s energy balance.
Okay Ark, you have avoided my question three times. So I’ll put it out there for any of the other cult kids:
What does Ark’s graphic mean?
https://ibb.co/kVPKxgbM
We see this graphic all the time, from the cult. Surely some CO2 cultist can explain its relevance?
If anyone is having difficulty understanding what these graphs are showing, this article should be of help: https://www.extremetech.com/internet/google-search-now-lets-you-upload-images-and-pdfs-for-analysis. Simply save the image to your hard drive and then upload it into Google, and voila!
Ark can’t explain the graphic, as usual.
I’ll have time to help him this weekend.
(Notice none of my regular stalkers is able to explain it either.)
clint…”Now, to this latest issue with infrared emission. You are correct about the charge distribution within some molecules. It is this charge distribution that allows for both the absorp.tion and emission of photons. gordon can’t understand the electron orbital transitions are much higher energy than infrared. Like a true cultist, he’s stuck in his beliefs and unable to learn. He just keeps clogging the blog, rambling nonsense and mentioning Bohr, Clausius, and Pauling, hoping to gain some credibility. (Notice he still hasn’t learned how to spell “Kirchhoff”. He just can’t learn.)”
***
At least I reference Bohr, Clausius, Pauling, et al, all we get from you are uniformed opinions based on your own distorted and grade school view of science. If you want to prove me wrong, you will need to use your understanding of these experts, which is slim to none, and explain why my interpretation of them is wrong.
You are still carrying on with the nonsense that electrons don’t or can’t emit/absorb IR. I have asked you, and Norman, in the past, to explain what else in an atom or molecule can emit or absorb IR. You two seem to think a molecule or an atom has a magic box marked ‘for IR emission and absorption only’.
IR is electromagnetic energy of a lower frequency and a longer wavelength and as such has an electric field orthogonal to a magnetic field. Furthermore it has a distinct frequency/ wavelength. Do you think it coincidence that the frequency and electric/magnetic fields in EM come from electrons, the only particles that have an electric and magnetic field and an orbital frequency?
Norman has opined that EM gets its frequency from vibrations in a molecule but where do the vibrations come from? Only one place, the electron bonding the atoms together. The vibrations are in the electron bonds and are by the interaction of the positively charged nucleus interacting with the negatively-charged electron as it orbits.
Here again is the CO2 molecule…
O=====C=====O
The dashed lines are double electron bonds connecting the O-atoms to the lone C-atom. That is where the vibrations occur, either as longitudinal vibrations along the x-axis or slightly about the x-axis on either end of the C-atom. The only way the vibrations can change is if the electrons in those bonds gain or lose KE.
The proton cannot change its kinetic energy relative to the electron but the electron can wrt the proton by absorbing heat, EM, or electrical energy. As the electron gains and loses KE the bonds vibrates more or less. Also, as it gains KE and drops to a lower orbital, it emits EM with a frequency proportional to its angular frequency.
I have also pointed out to Norman, and he has failed to confirm it, that the hydrogen atom has only one electron and one proton. Yet, it emits and absorbs IR. No magic IR box there, or significant vibration, the only element that can emit and absorb EM is the electron. What are the chances it does that re IR only in hydrogen?
Go on, Norman, check it out.
https://tinyurl.com/4urx2eem
Gordon Robertson
YOU: “You posted a link to water molecules the other day in which the H-end was marked +ve and the O-end -ve. That is incorrect and the author is either stoopid or misinformed. The H-end and the O-ends are both negative but the oxygen atom, having a stronger electronegativity, has negative electron charge for a longer time hence is slightly more negative than the H-end.”
I think the more correct determination of “stoopid” would be you. You just make up countless loads of garbage physics (by the truckload) it makes it nearly impossible to point out all your many flawed ideas.
Where do you get the less negative? The reason hydrogen bonds form is because they are actually positive and are attracted to a negative pole of a polar molecule. Your ridicule of people much smarter than you will ever be is a sad thing.
I will provide you with real science (that you will reject in favor or your own made up nonsense)
Read it and reject it at least you will know you are totally wrong about so much!!
https://phys.libretexts.org/Bookshelves/University_Physics/Physics_(Boundless)/17%3A_Electric_Charge_and_Field/17.1%3A_Overview
Gordon Robertson
I have given you many links to learn about molecular vibration and how they produce IR spectra that can be analyzed based upon this theory.
You make up this false idea (not sure where you get it from, you have not provided a source that confirms this) that a dipole is actually two negative charges one is just less negative. An atom is neutral when the number of electrons is the same as the number of protons. You seem to think that the proton charge has no effect on anything. I really am clueless as to why you believe this nonsense. When an electron is removed the atom becomes positive. It acts like a proton, it will be attracted to a negative charge and repelled by a positive on. It is not less negative, it is positive.
A dipole has actual positive and negative ends which orient in an electric field. This is real world science and not your fantasy made up version that you cling to with all your might.
The bond (produced by bonding electrons which is about the only thing you are correct on) acts like a spring. The nuclei of the molecule move around (protons do have kinetic energy). As the nuclei of a molecule move apart they stretch the bond. It can break with enough energy and the molecule is no more and now you have individual atoms. At room temperature the energy is not enough to break bonds but it is enough kinetic energy that the bond is stretched. As it stretches it has tension like a spring and will pull the nuclei back toward each other again. This creates a frequency of vibration that is determined by the strength of the bond as well as what the masses are of the nuclei. Heavier mass nuclei have lower frequency for same bonding strength.
The dipole exists as a positive and negative charged unit. In its ground vibrational state no IR is emitted. When the dipole interacts with EMR it can gain energy from the EMR which increases the amplitude of the vibration (does not change frequency). The dipole vibrates at a higher energy level than its ground state. It will emit an IR photon and return to its ground vibrational state.
I have given you links. Read and understand what is being said before you tell me I am wrong!
ball4…”where else in an atom can IR be emitted or absorbed
Once again 7:43 am, the whole atom is needed to absorb and emit IR. The tiny electron is too small to absorb the entire photon”.
***
B4 seems to visualize a photon as a narrow beam of EM energy darting through space. The truth is that EM originating at an electron spreads out isotropically from the electron with a very distinct frequency. By the time it arrives at Earth’s surface it makes up a field of EM equivalent to bazzilions of photons acting together. In that case, the wavefront of the EM would dwarf the planet never mind a single electron.
Einstein noted circa 1905, as the basis of his photoelectric effect theory, that electrons emitted from surface reacted only to a specific frequency of light. The intensity did not matter, just the frequency. He made the mistake, albeit an honest mistake, of presuming it was the momentum in a photon that dislodged the electron, but Bohr produced a better theory in 1913.
It was the frequency of EM that excited an electron to jump to a higher KE energy orbital. And, when it returned to the same orbital, it emitted its own quantum of EM, now labelled as a photon.
If the whole atom was responsible, the whole atom would need a frequency to transfer to the newly created photon, but an atom has no such frequency. Only the electron has an angular frequency. Also, it is known that an electron moving in a circuit can produce an electric and a magnetic field.
So, there you have it, a photon of EM has an electric field, a magnetic field, and a frequency, and the electron explains it all.
Smart little critter, it is.
8:37 am: The whole atom mass has angular momentum transferred to the newly created photon so the atom need not have “such frequency”. The electron doesn’t have sufficient momentum so cannot “explain it all”.
Let’s look at the things simple.
First there is solar flux at the top of atmosphere (TOA) ~1.362 W/m2
The So = 1.362 W/m2 is called TOA because it is not influenced from planetary Albedo yet.
It is the solar intensity at earth’s average distance from sun 150.000.000 km (1AU), and therefore it is considered earth’s yearly average solar flux.
Thus, So = 1.362 W/m2 is used in the average surface temperature calculations, the yearly average surface temperature.
Now, when applying the S-B emission law formula, when applying it backwards, when (mistakenly) assuming the entire not reflected solar energy is absorbed in planetary surface as heat… and also assuming there is not any atmosphere involved, but the average albedo is ~0,3 (as it is from existence of clouds)… and that heat to be evenly distributed over the entire globe,
then we shall derive to earth’s effective temperature Te = 255K (-18C).
When comparing with earth’s measured average surface temperature Tmean = 288K, the difference between those two:
Tmean – Te = 288K – 255K = 33C
The difference of 33C is attributed to the role of earth’s atmosphere, the so-called atmospheric greenhouse warming effect.
When the earth’s effective temperature is corrected, because the strong specular reflection is ignored in Albedo, and the Φ = 0,47 is aplied, the earth’s corrected effective temperature will be:
Te.correct = 210K (-63C).
The difference of 33C is already too much of warming caused from atmosphere on average on earth’s surface, it is too much accepting atmosphere warms surface on average 33C.
The corrected difference. though, is much higher:
288K – 210K = 78C.
We cannot attribute the 78C difference to atmospheric warming, no matter what!
–
https://www.cristos-vournas.com
5:24 pm: “specular reflection is ignored in Albedo”
No Christos, the measured satellite views of SW reflected from the Earth system look at patches that include specular reflection angles as you have been previously informed.
Thank you, Ball.
Do satellites also measure Moon’s specular reflection?
because if they do, how can we explain moon’s effective temperature Te = 270,4K when compared to moon’s measured average surface temperature Tmean = 220K?
Why moon’s measured average surface temperature is so much lower than its effective temperature:
Te – Tmean = 270,4K – 220K = 50,4C ???
It is because moon’s specular reflection strong constituent is also neglected.
The moon’s corrected effective temperature is
Te.correct = 224K
which is very much closer to the moon’s average surface temperature
Tmean = 220K.
–
https://www.cristos-vournas.com
1:26 am, yes, Diviner field of view included all SW specular reflection. Your unat Tmean isn’t yet known as there is no lunar thermometer field installed. The lunar Te calculated using Earth’s L&O surface emissivity is too high; should be using the lunar surface emissivity.
..
Here’s a prime case study of the utility of the science of spectroscopy for determining the chemical composition, temperature, and physical conditions of celestial objects that are too distant to sample directly.
Pluto’s atmosphere gas and haze composition from JWST/MIRI spectroscopy: https://www.aanda.org/articles/aa/pdf/2025/04/aa53619-24.pdf
131 years ago today:
https://www.newyorker.com/magazine/2022/11/28/climate-change-from-a-to-z
Also on this day, 57 years ago…
We commemorate the anniversary of Apollo 8’s historic mission in 1968 -the first time humans left Earth’s orbit and circled the Moon. As the crew witnessed Earth rising over the lunar horizon, they changed humanity’s perspective of its place in the cosmos, demonstrating the reach of science, engineering, and human resolve at a pivotal moment in history.
https://youtu.be/_Dga747ar1o
norman…”A dipole has actual positive and negative ends which orient in an electric field. This is real world science and not your fantasy made up version that you cling to with all your might”.
***
Norman…you are a twit. You post a link to chemistry libre on atoms and charges and they contradict you while supporting my argument re bonds and electronegativity. They even use the relative word to describe positives and negatives.
In the article, under …
Dipole Polarization
“On the molecular level, polarization can occur with both dipoles and ions. In polar bonds, electrons are more attracted to one nucleus than to the other. One example of a dipole molecule is water, (H2O), which has a bent shape (the H-O-H angle is 104.45°) and in which the oxygen pulls electron density away from the H atoms, leaving the H relatively positive and the O relatively negative, as shown in”.
from the paragraph…
“…in which the oxygen pulls electron density away from the H atoms, leaving the H relatively positive and the O relatively negative…”.
Exactly what I told you but I used a big word, electronaegativity, to describe the process. It appears this article is aimed at students who are such newbies they cannot grasp such a concept as electronegativity.
The rest of the article is fairly juvenile as well.
https://phys.libretexts.org/Bookshelves/University_Physics/Physics_(Boundless)/17%3A_Electric_Charge_and_Field/17.1%3A_Overview
They don’t touch the reason as to why a positive and negative charge is different and nuclear physics is no different. They talk about quarks and leptons but they might as well be talking about fairies and leprechauns since they have no idea either.
The point to get is this. If you have a pail of electrons it has a pailful of negative charges. If you have an adjacent pail of electrons with one less electron, that pail is said to be less negative or relatively positive wrt the other pail. Both pails have only negative charges…no positive charges…yet one pail is deemed positive wrt the other.
That is an important fundamental understanding you need to get in electronics/electrical theory, the difference between a relative charge and an actual charge. A relative positive charge is NOT a proton. The protons remain in the nucleus and relatively stationary.
When you have electrons moving through a conductor there are only negative charges flowing. Yet, if the electrons and their charges move through a resistance, the end nearest the battery -ve terminal is labeled negative and the other end positive. It is clearly understood by students of electronics that the +ve and -ve labels are relative designations for voltages, not references to negative and positive charges.
In fact the negative and positive labels designate one end of the resistor as having a higher voltage potential than the other end marked positive.
The protons take part in the overall relationship between the nucleus and the orbiting electrons, and contribute to a natural vibration between the two. However, the reference to dipoles and charges outside that realm are up to electrons and the relative charges they can form.
In other words, electron charges are always negative and can never be positive in the same way as a proton. When you see a positive sign in the water molecule it means not as negative as the other end. Not as negative can be, and is, referred to as RELATIVELY positive.
The CO2 cult relies on a number of deceptions to promote their perversions of science. They use such things as the bogus “energy imbalance”, “ice cubes can boil water”, “fluxes simply add/subtract”, “all photons are absorbed”, and so on, and so on, ad infinitum.
Up above one of the cult kids attempted to promote the pathetic graph…
https://ibb.co/kVPKxgbM
…without understanding anything about it.
The reality is the graph only proves how ignorant the cult kids are about the relevant science. The graph does not even display “flux”, it displays “radiance”. “Radiance” is NOT “flux”, just as flux is NOT “energy”. The cult kids can’t understand that, but to make it easy, consider “radiance” to be a simple photon count. So on the graph, at about 18μ there are about 140 photons. And at about 9μ there are about 100 photons. So to the uneducated cult kids, Earth is losing more energy from 18μ photons than from 9μ photons, because they believe all photons are the same. But REAL scientists know 9μ photons have twice the energy of 18μ photons.
Kids these days….
It is spectral radiance, which shows how the emitted flux varies with wavelength. This is exactly what we need to see that GHG like CO2 remove large amounts of outgoing flux in their respective abs,orption wavelength bands.
Flux is the total intensity over all wavelegths, which is not useful for this purpose.
Now let the insults fly, without any scientific rebuttal, as usual.
Comments are turned of in the DOE Report threads, the committee has been disbanded prior to addressing comments, and the whole effort seems been relegated to the dustbin, but I thought I’d point out the publication of a new tidal gauge sea-level rise paper that disputes (with supporting analysis) the claims in the DOE report.
https://agupubs.onlinelibrary.wiley.com/doi/10.1029/2025AV002018
Mark, you’ve got to understand believers are not effective at stopping a belief. If this issue were about science, it would have been over decades ago. It’s about beliefs, NOT science.
Just ask Greta….
Hey Puffman, riddle me this –
https://www.thebulwark.com/p/lauren-chen-trump-administration-scores-visa-for-founder-russian-propaganda-outlet-tenet
What do you mean by “stopping a belief”, and is your unstoppable belief theory the reason why you have kept repeating a very small set of Sky Dragon beliefs under many sock puppets for more than a decade?
See Mark, “It’s about beliefs, NOT science.”
Child Willard proves me right, again.
122 years and 2 days ago, John von Neumann (The Man from the Future) was born, December 28, 1903. The amount of carbon dioxide in the air was 295-297ppm; it is now 428ppm.
Interesting indeed.
“122 years and 2 days ago, John von Neumann (The Man from the Future) was born, December 28, 1903. The amount of carbon dioxide in the air was 295-297ppm; it is now 428ppm.”
“for a general warming of the world by about one degree Fahrenheit.”
A question begs for answer: “The amount of 295-297ppm was 295-297ppm;”
How much the 295-297ppm had warmed the air back then?
How colder the air would have been without those 295-297ppm of carbon dioxide 122 years ago?
–
https://www.cristos-vournas.com
Do you think that El Niño – La Niña events are caused by natural atmospheric forcings (aerosols, vulcanisn eruptions, etc…)?
How do you explain the El Niño – La Niña events persistent periodicity?
–
https://www.cristos-vournas.com
does this work