With John Christy out of the country for a several days and so our global temperature report being delayed, I thought I would update my new U.S.-only surface temperature dataset for April, 2012.
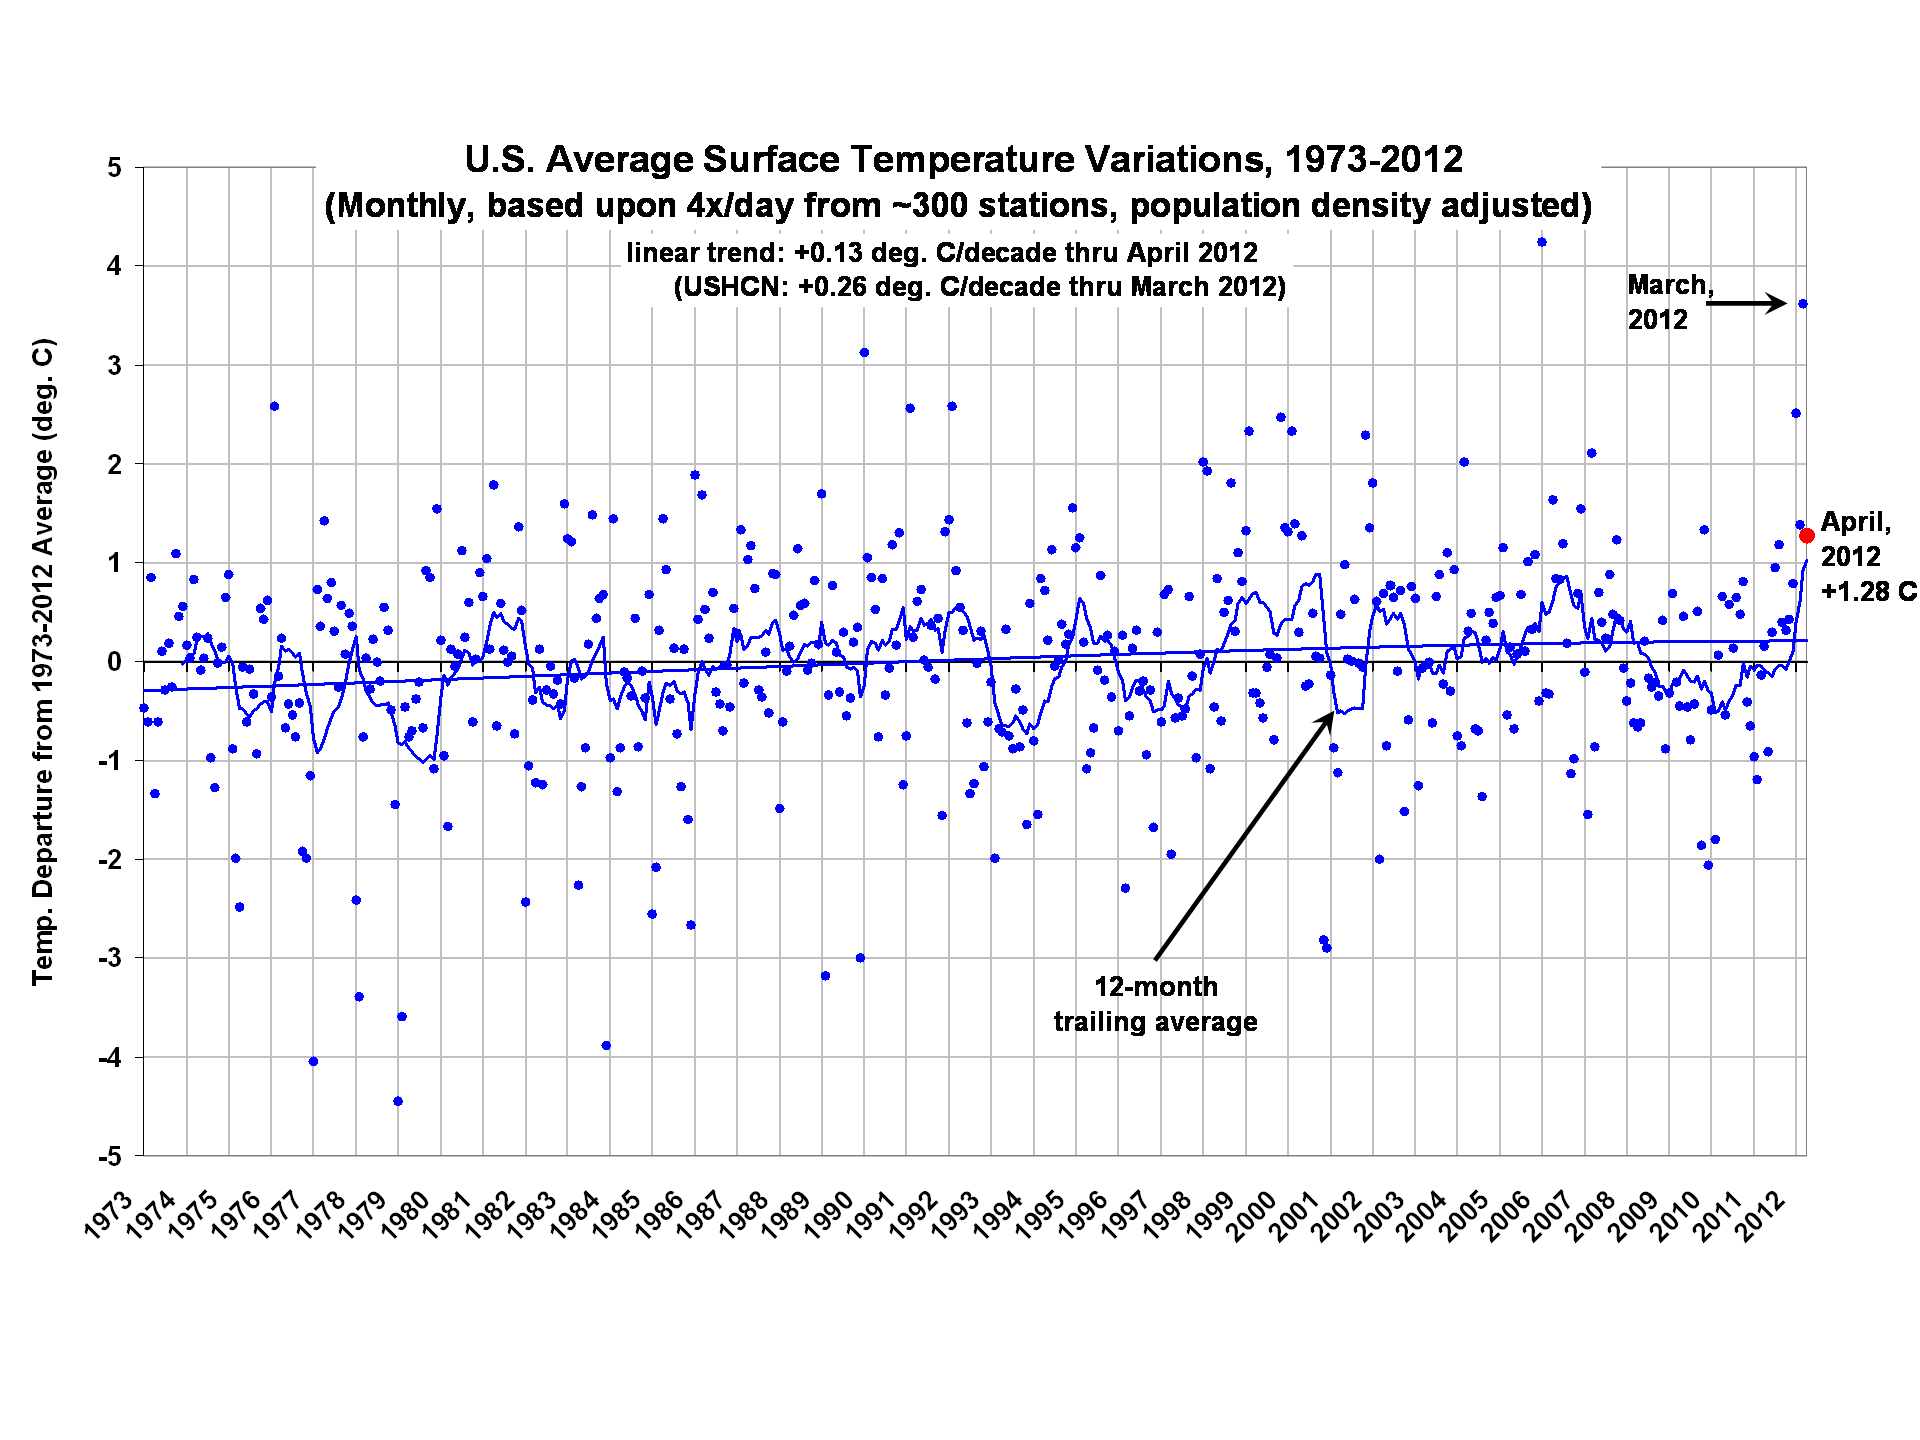
The April, 2012 U.S. temperature anomaly remained above average (+1.28 deg. C), but down considerably from the very warm March anomaly (+3.62 deg. C). That very unusual March warmth was traced to record strong southerly flow, which (as I discussed here) is difficult to blame on “global warming” because it must be matched by an equal amount of anomalously strong northerly flow elsewhere.
A quick recap regarding this new temperature dataset: the area averages for the contiguous U.S. are based upon approximately 300 stations in the NCDC Integrated Surface Hourly (ISH) archive, which is updated daily here. Most of the stations I use are National Weather Service or FAA reporting sites at airports. The stations must have been in continuous operation since 1973 for them to be included.
My computation of a daily average temperature from each station requires 4 observations (at 00, 06, 12, and 18 UTC, which are standard synoptic reporting times), and there must be at least 80% of the days present for a monthly average to be computed for a station. Then there must be 80% of the months available over the 1973-2012 period of record, including all of 1973 and 2011.
I quantified the average increase in station temperature trends with increasing population density, and adjusted all stations based upon that average relationship to a nominal population density of 1 person per sq. km (this involved no extrapolation). Presumably, this is adjusting for the urban heat island (UHI) effect which apparently grows over time (people tend to build more buildings, roads, parking lots, add more AC, etc.)
Here are the resulting monthly temperature departures from the period average (click for large version):

Note that the linear warming trend I get (+0.13 deg. C/decade) is about 50% of that I get from analyzing the USHCN data (+0.26 deg. C/decade).
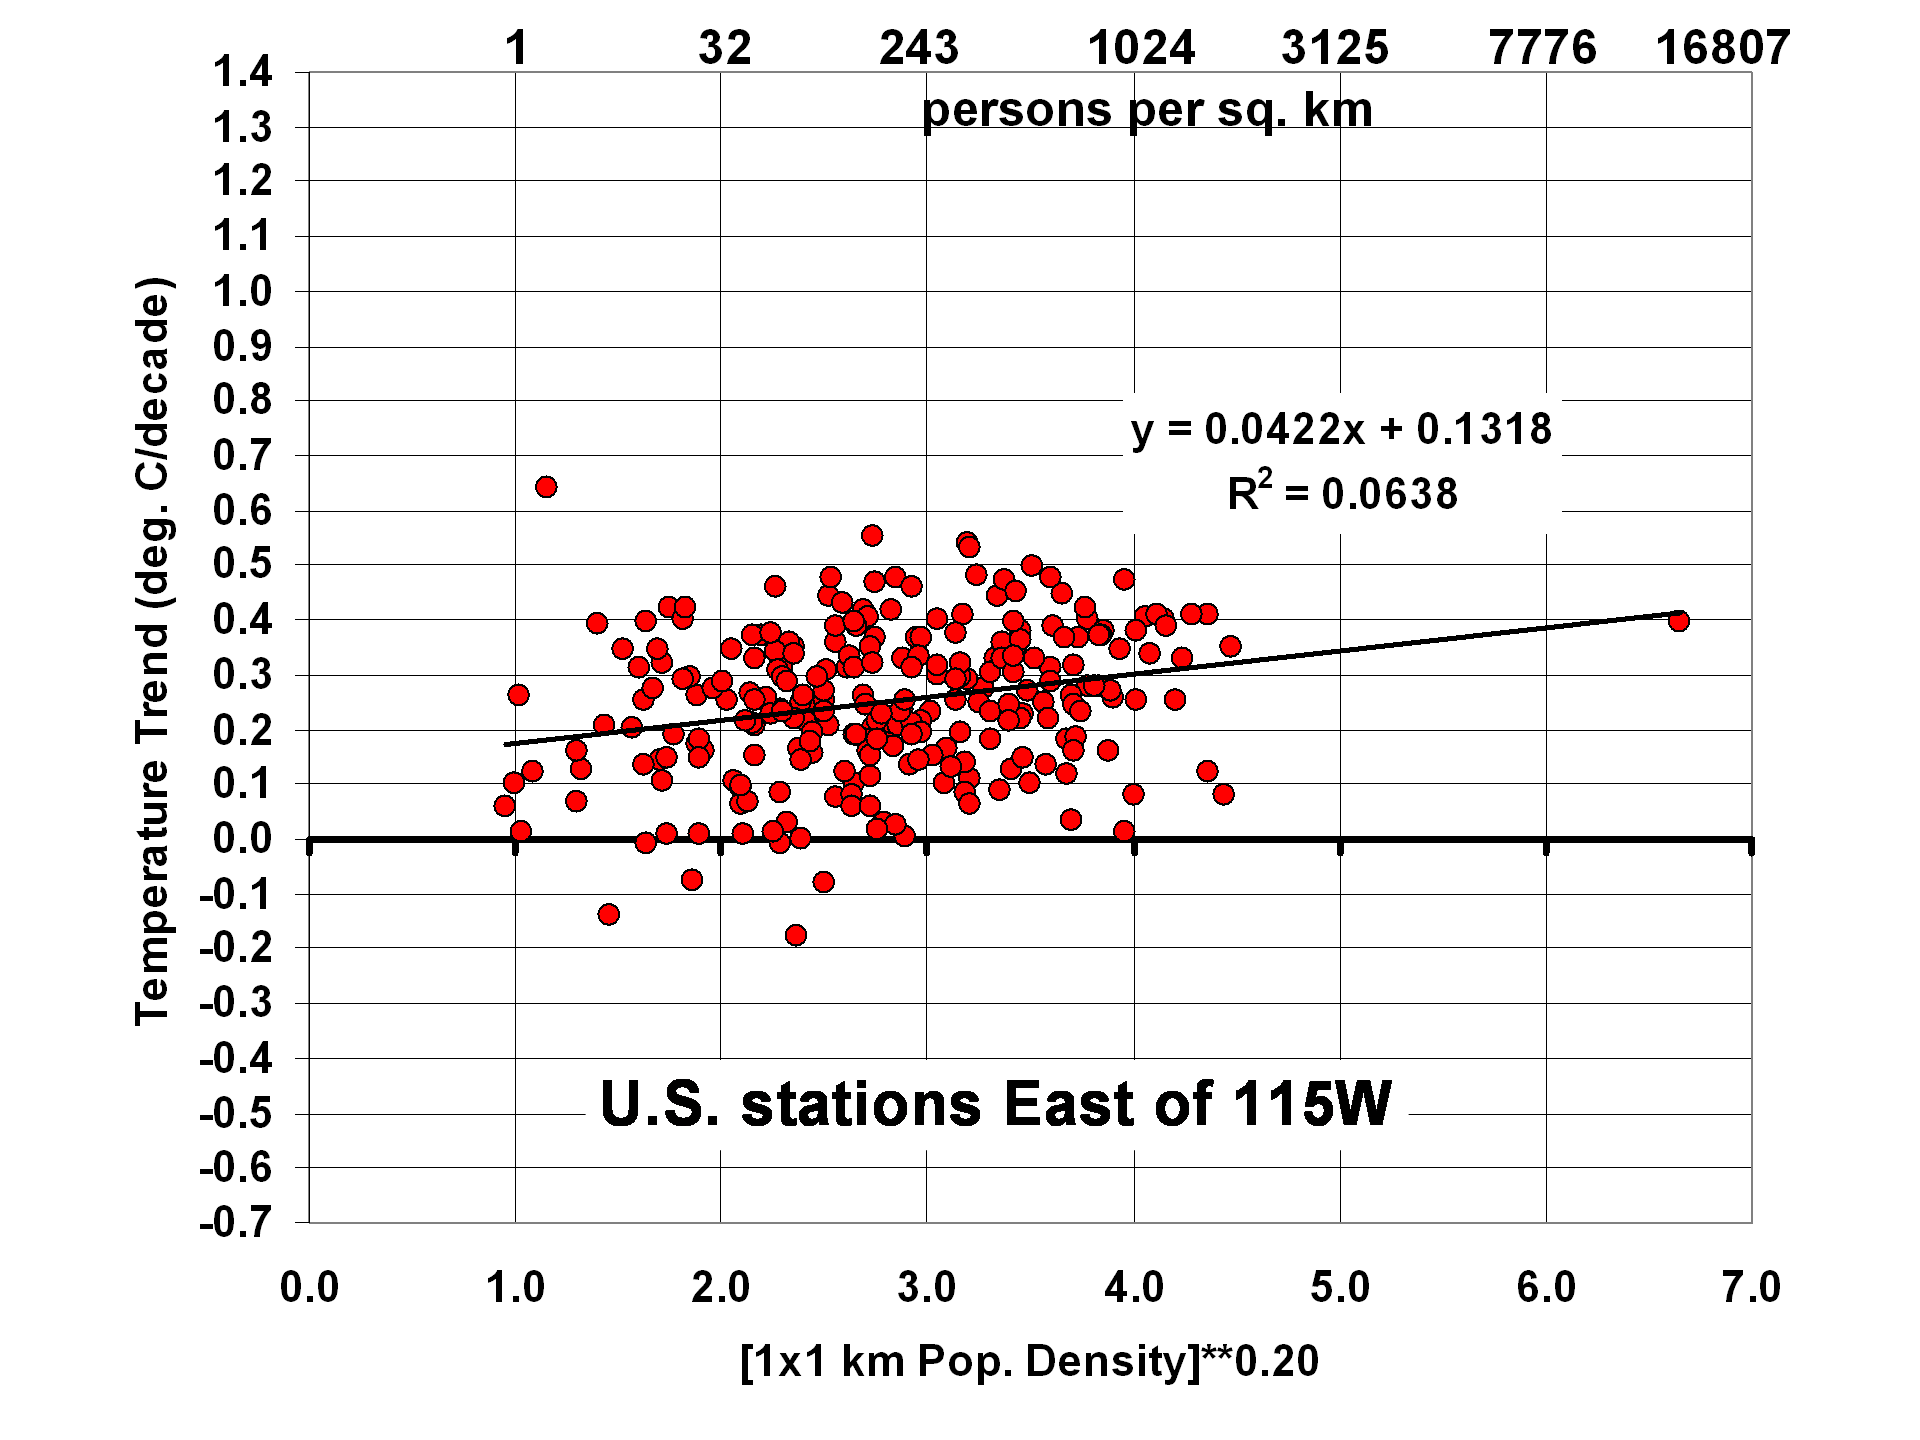
It is also a considerable reduction below what I get if I perform no population density adjustment (+0.22 deg. C/decade). Since that population adjustment is so large, here are the data supporting it (click for large version):

The regression coefficient (.0422) has a standard error of estimate of about +/- 25%, which gives some idea of the level of uncertainty in the UHI adjustment I have made. The population adjustment is based upon the stations east of 115 deg. W longitude, since there did not appear to be a relationship between temperature trend and population west of that. The UHI adjustment is admittedly simple, being based only upon local population density in year 2000, and it might well be that some other method would do a better job of removing the UHI effect.
If you read my previous post on this new dataset, you might be wondering why I am now getting a warmer trend than I did before. When using hourly temperature data, it turns out you have to be careful because of the increase in the number of “special” (off-hour) reports in recent years, which changes the average local time of the observations. Now, I am only using observations taken in the 10 minutes before the top of the hour, which are the routine hourly reports that have been made for many decades. (I actually took some of those observations myself in the 1970s when I worked at a NWS office, so I have some familiarity with the issue.)

 Home/Blog


