
 Home/Blog
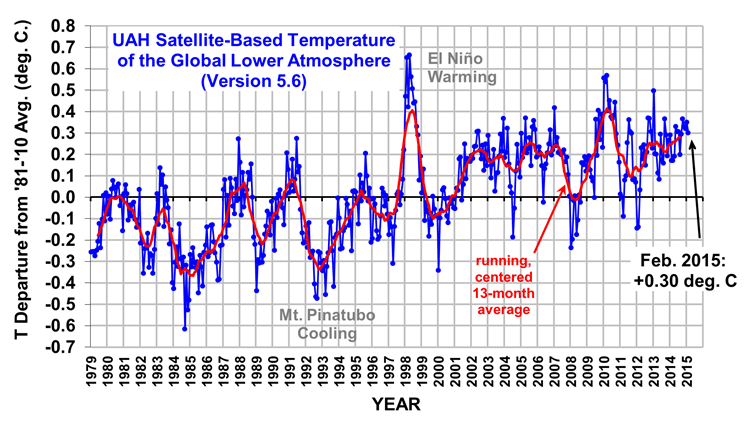
The Version 5.6 global average lower tropospheric temperature (LT) anomaly for February, 2015 is +0.30 deg. C, down a little from the January 2015 value of +0.35 deg. C (click for full size version):
The global, hemispheric, and tropical LT anomalies from the 30-year (1981-2010) average for the last 14 months are:
YR MON GLOBAL NH SH TROPICS
2014 01 +0.291 +0.387 +0.194 -0.029
2014 02 +0.170 +0.320 +0.020 -0.103
2014 03 +0.170 +0.338 +0.002 -0.001
2014 04 +0.190 +0.358 +0.022 +0.092
2014 05 +0.326 +0.325 +0.328 +0.175
2014 06 +0.305 +0.315 +0.295 +0.510
2014 07 +0.304 +0.289 +0.319 +0.451
2014 08 +0.199 +0.244 +0.153 +0.061
2014 09 +0.294 +0.187 +0.401 +0.181
2014 10 +0.365 +0.333 +0.396 +0.189
2014 11 +0.329 +0.354 +0.303 +0.247
2014 12 +0.322 +0.465 +0.178 +0.296
2015 01 +0.351 +0.553 +0.150 +0.126
2015 02 +0.296 +0.434 +0.157 +0.015
Note that the El Nino warmth in the tropics seems to have fizzled, falling about 0.25 deg C in the last few months to near the 1979-2010 average value, which is unusual since February has been the usual time of peak tropospheric warmth in response to previous El Nino events.
The global image for February, 2015 should be available in the next day or so here.
Popular monthly data files (these might take a few days to update):
uahncdc_lt_5.6.txt (Lower Troposphere)
uahncdc_mt_5.6.txt (Mid-Troposphere)
uahncdc_ls_5.6.txt (Lower Stratosphere)


