
 Home/Blog
Yesterday I presented this time series of climate data and asked if anyone could determine any physical causes based upon it’s character:
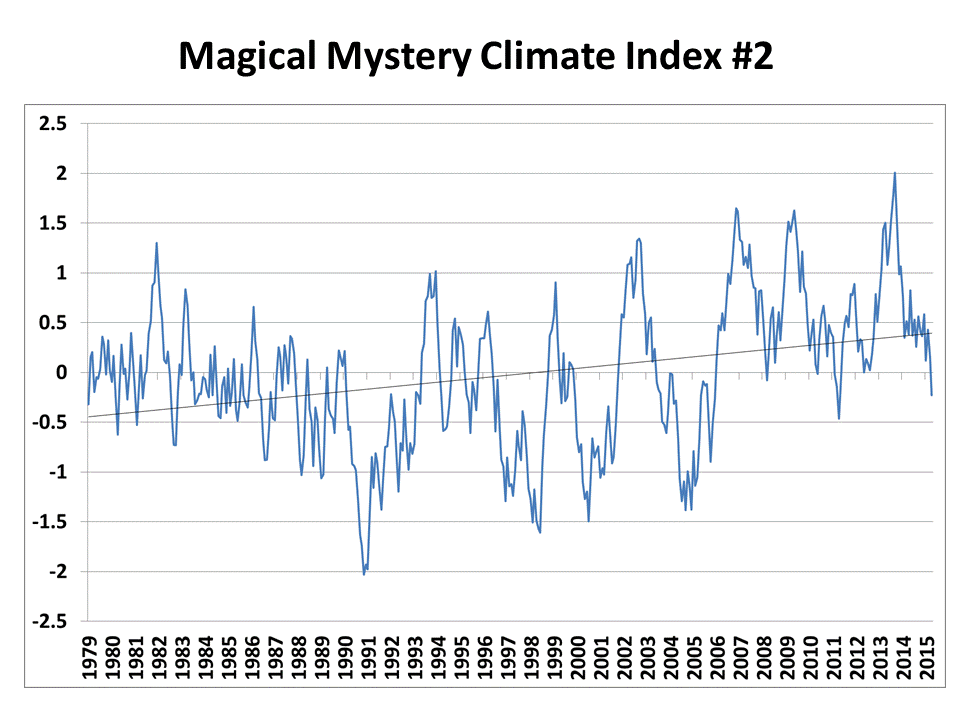
I like the example because it shows realistic variability compared to, say, global average temperature variations.
I created it with a very simple function that actually has some basis in how the real climate system operates. Lance Wallace came closest to the right explanation. Bob Tisdale even gave a prediction of how politicians and environmentalists would have used it to call for energy policy changes. 🙂
But the time series, with its multi-decadal warming trend, was created entirely from a monthly series of random numbers. It’s what I call a “constrained random walk”.
How Does this Relate to the Real Climate System?
If you had random monthly cloud variations over the earth, it would cause a monthly random climate forcing as more or less sunlight was absorbed by the system. That effect is cumulative, since the heat is stored by the land and the ocean. So, every month’s value is just the previous month’s value plus a new random number (I used +/-0.5 as the range of random numbers in Excel). BUT…this would just produce a random walk, which almost always wanders away from the average state over time. This is in contrast to the real climate system, which has net negative radiative feedback (the more it warms, the more infrared energy it loses to space, restoring the system to an average state).
You can mimic this negative feedback by just subtracting off 10% of the previous month’s value from the next month’s value. In other words, instead of each month being the previous month’s value plus a random number (which would produce a random walk), use 0.9 times the previous month’s value instead. This is actually an approximation to the time-dependent energy budget equation in a 1D global energy balance model.
The reason for this example is to show that relatively rapid (monthly) forcing in the form of just random cloud variations can cause low-frequency climate variability…even multi-decadal temperature trends. You don’t need variations in solar activity. The reason why is the climate system’s “memory” — its ability to store energy. Certain preferred time scales of temperature variability tend to show up because of certain characteristics of the system — the depth of the ocean mixed layer, the time it takes the tropical atmosphere to overturn, etc.
This kind of variability is contained, to a lesser or greater extent, in all of the IPCC climate models. The cloud variations aren’t really “random” because they have physical causes, but they can seem random because the causes are myriad and complex. This is also the type of simple climate model forcing we used in our papers demonstrating how cloud feedbacks in the climate system have likely been misinterpreted, because researchers tend to assume cloud variations are caused by temperature variations while ignoring causation in the opposite direction.
Thanks to everyone for offering their ideas. I hope you are beginning to appreciate how some of the structure we see in global temperature variations might simply be just nature flipping a coin.


