
 Home/Blog
The Version 6.0 global average lower tropospheric temperature (LT) anomaly for October, 2017 was +0.63 deg. C, up from the September, 2017 value of +0.54 deg. C (click for full size version):
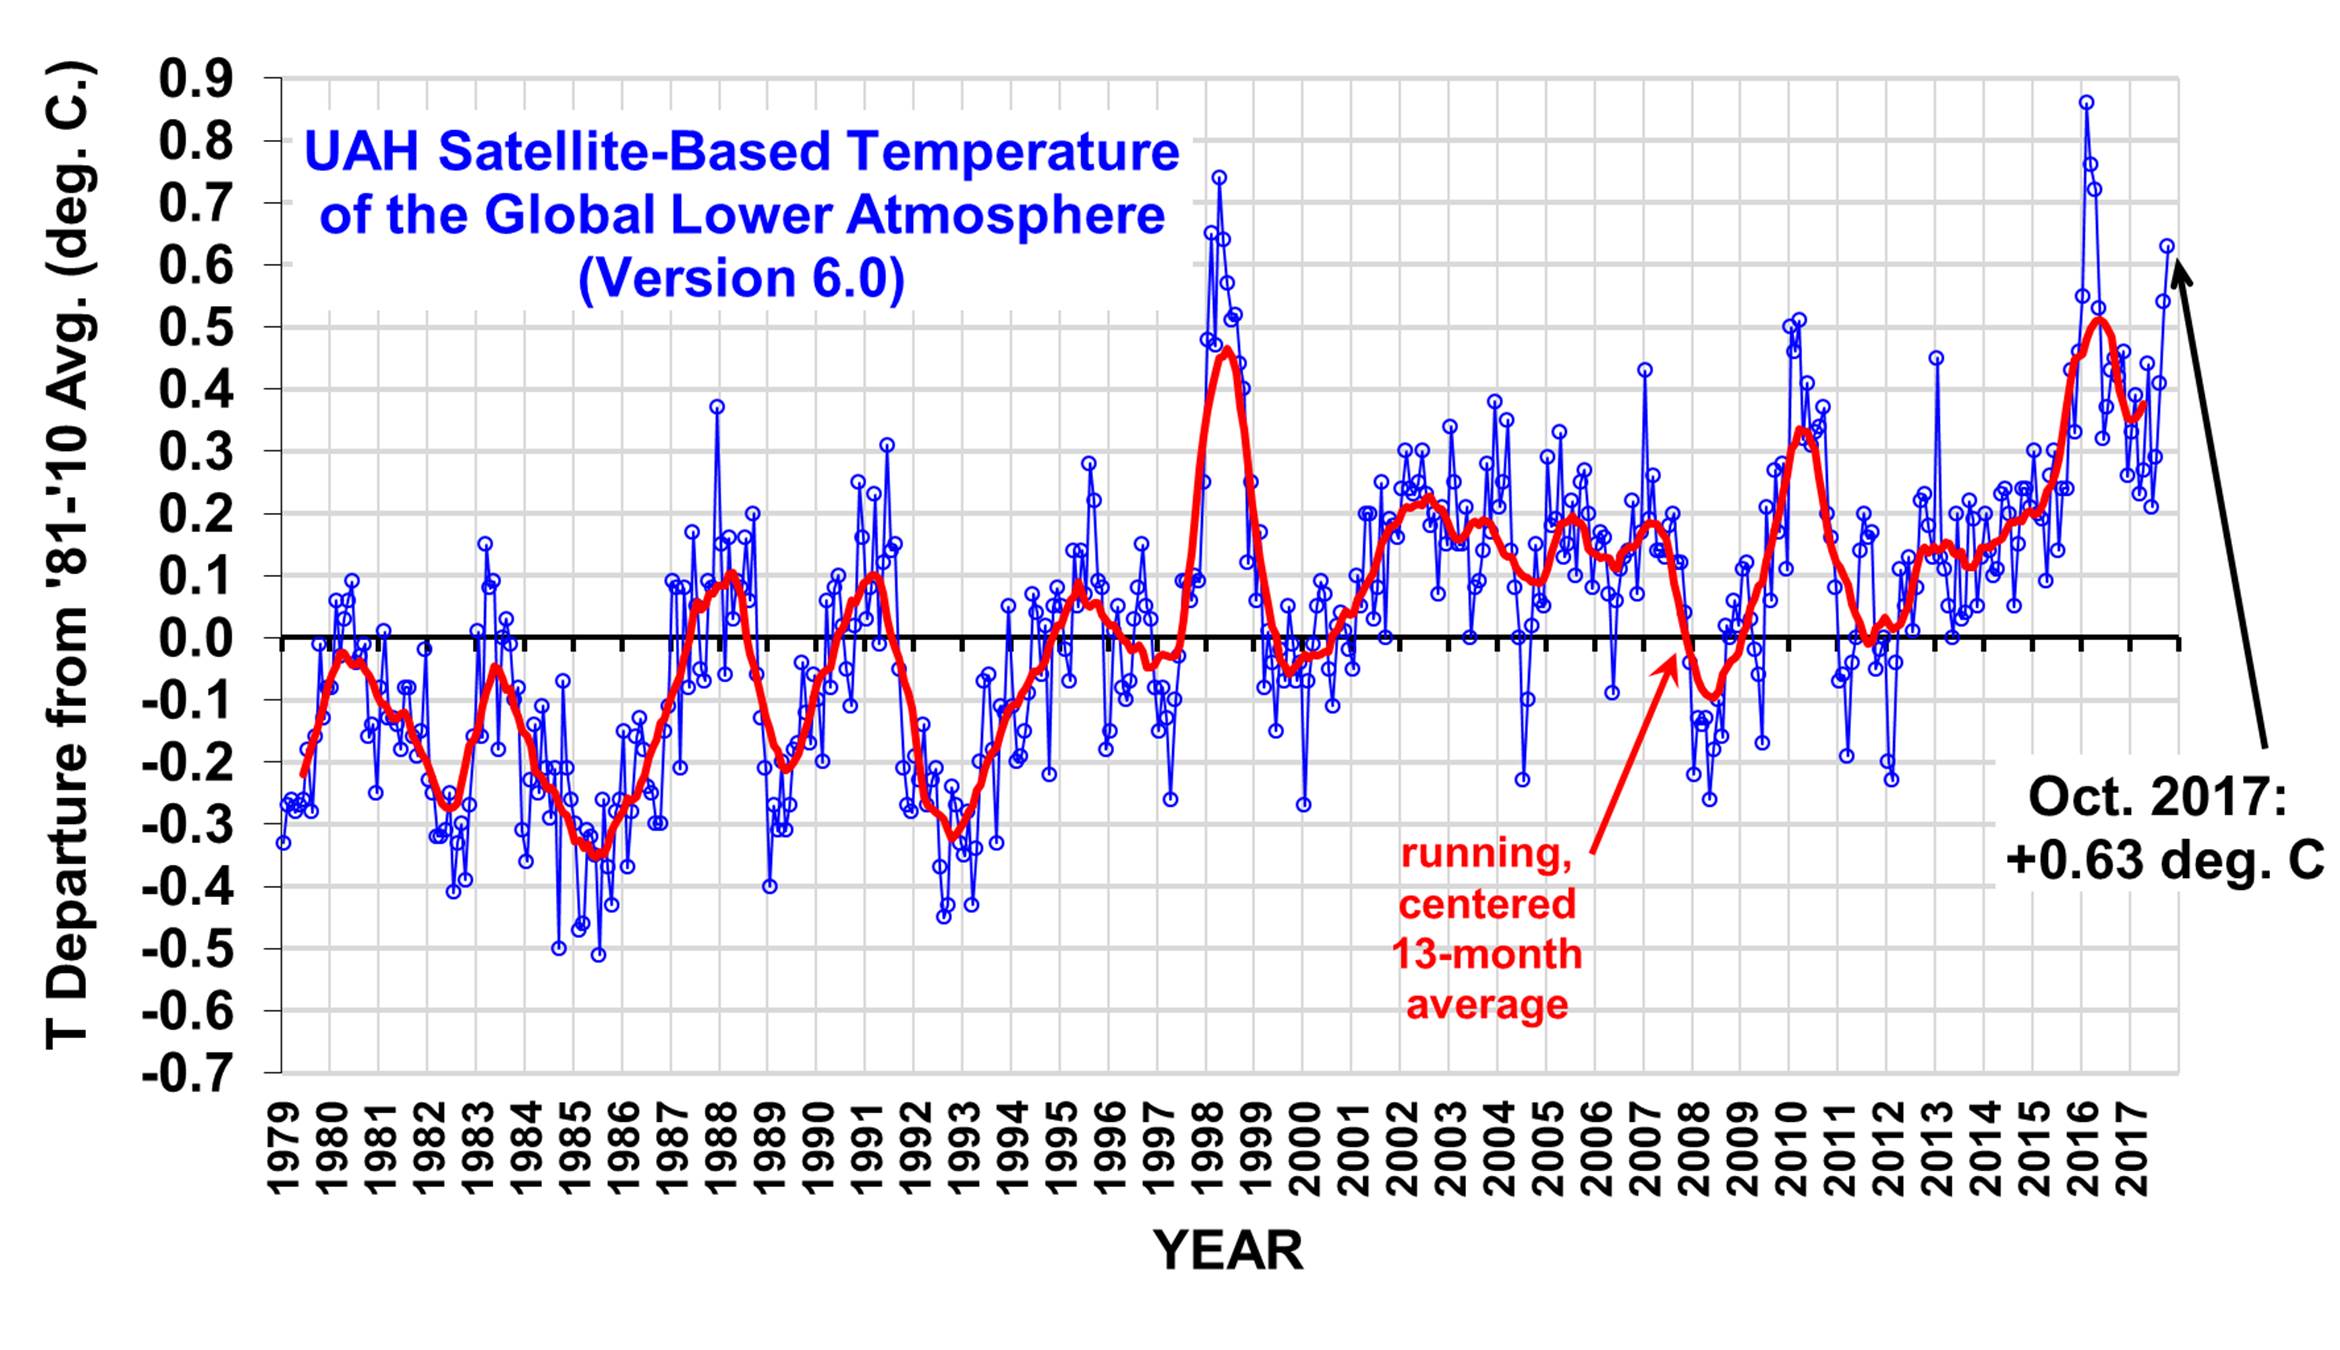
Global area-averaged lower tropospheric temperature anomalies (departures from 30-year calendar monthly means, 1981-2010). The 13-month centered average is meant to give an indication of the lower frequency variations in the data; the choice of 13 months is somewhat arbitrary… an odd number of months allows centered plotting on months with no time lag between the two plotted time series. The inclusion of two of the same calendar months on the ends of the 13 month averaging period causes no issues with interpretation because the seasonal temperature cycle has been removed as has the distinction between calendar months.
The global, hemispheric, and tropical LT anomalies from the 30-year (1981-2010) average for the last 22 months are:
YEAR MO GLOBE NHEM. SHEM. TROPICS
2016 01 +0.55 +0.72 +0.38 +0.85
2016 02 +0.85 +1.18 +0.53 +1.00
2016 03 +0.76 +0.98 +0.54 +1.10
2016 04 +0.72 +0.85 +0.58 +0.93
2016 05 +0.53 +0.61 +0.44 +0.70
2016 06 +0.33 +0.48 +0.17 +0.37
2016 07 +0.37 +0.44 +0.30 +0.47
2016 08 +0.43 +0.54 +0.32 +0.49
2016 09 +0.45 +0.51 +0.39 +0.37
2016 10 +0.42 +0.43 +0.42 +0.47
2016 11 +0.46 +0.43 +0.49 +0.38
2016 12 +0.26 +0.26 +0.27 +0.24
2017 01 +0.32 +0.31 +0.34 +0.10
2017 02 +0.38 +0.57 +0.19 +0.07
2017 03 +0.22 +0.36 +0.09 +0.05
2017 04 +0.27 +0.28 +0.26 +0.21
2017 05 +0.44 +0.39 +0.49 +0.41
2017 06 +0.21 +0.33 +0.10 +0.39
2017 07 +0.29 +0.30 +0.27 +0.51
2017 08 +0.41 +0.40 +0.41 +0.46
2017 09 +0.54 +0.51 +0.57 +0.53
2017 10 +0.63 +0.67 +0.59 +0.47
The linear temperature trend of the global average lower tropospheric temperature anomalies from January 1979 through October 2017 remains at +0.13 C/decade.
Why Are the Satellite and Surface Data Recently Diverging?
John Christy and I are a little surprised that the satellite deep-layer temperature anomaly has been rising for the last several months, given the cool La Nina currently attempting to form in the Pacific Ocean.
Furthermore, the satellite and surface temperatures seem to be recently diverging. For the surface temperatures, I usually track the monthly NCEP CFSv2 Tsfc averages computed by WeatherBell.com to get some idea of how the most recent month is shaping up for global temperatures. The CFSv2 Tsfc anomaly usually gives a rough approximation of what the satellite shows… but sometimes it differs significantly. For October 2017 the difference is now +0.23 deg. C (UAH LT warmer than Tsfc).
The following charts show how these two global temperature measures have compared for every month since 1997 (except that September, 2017 is missing at the WeatherBell.com website):
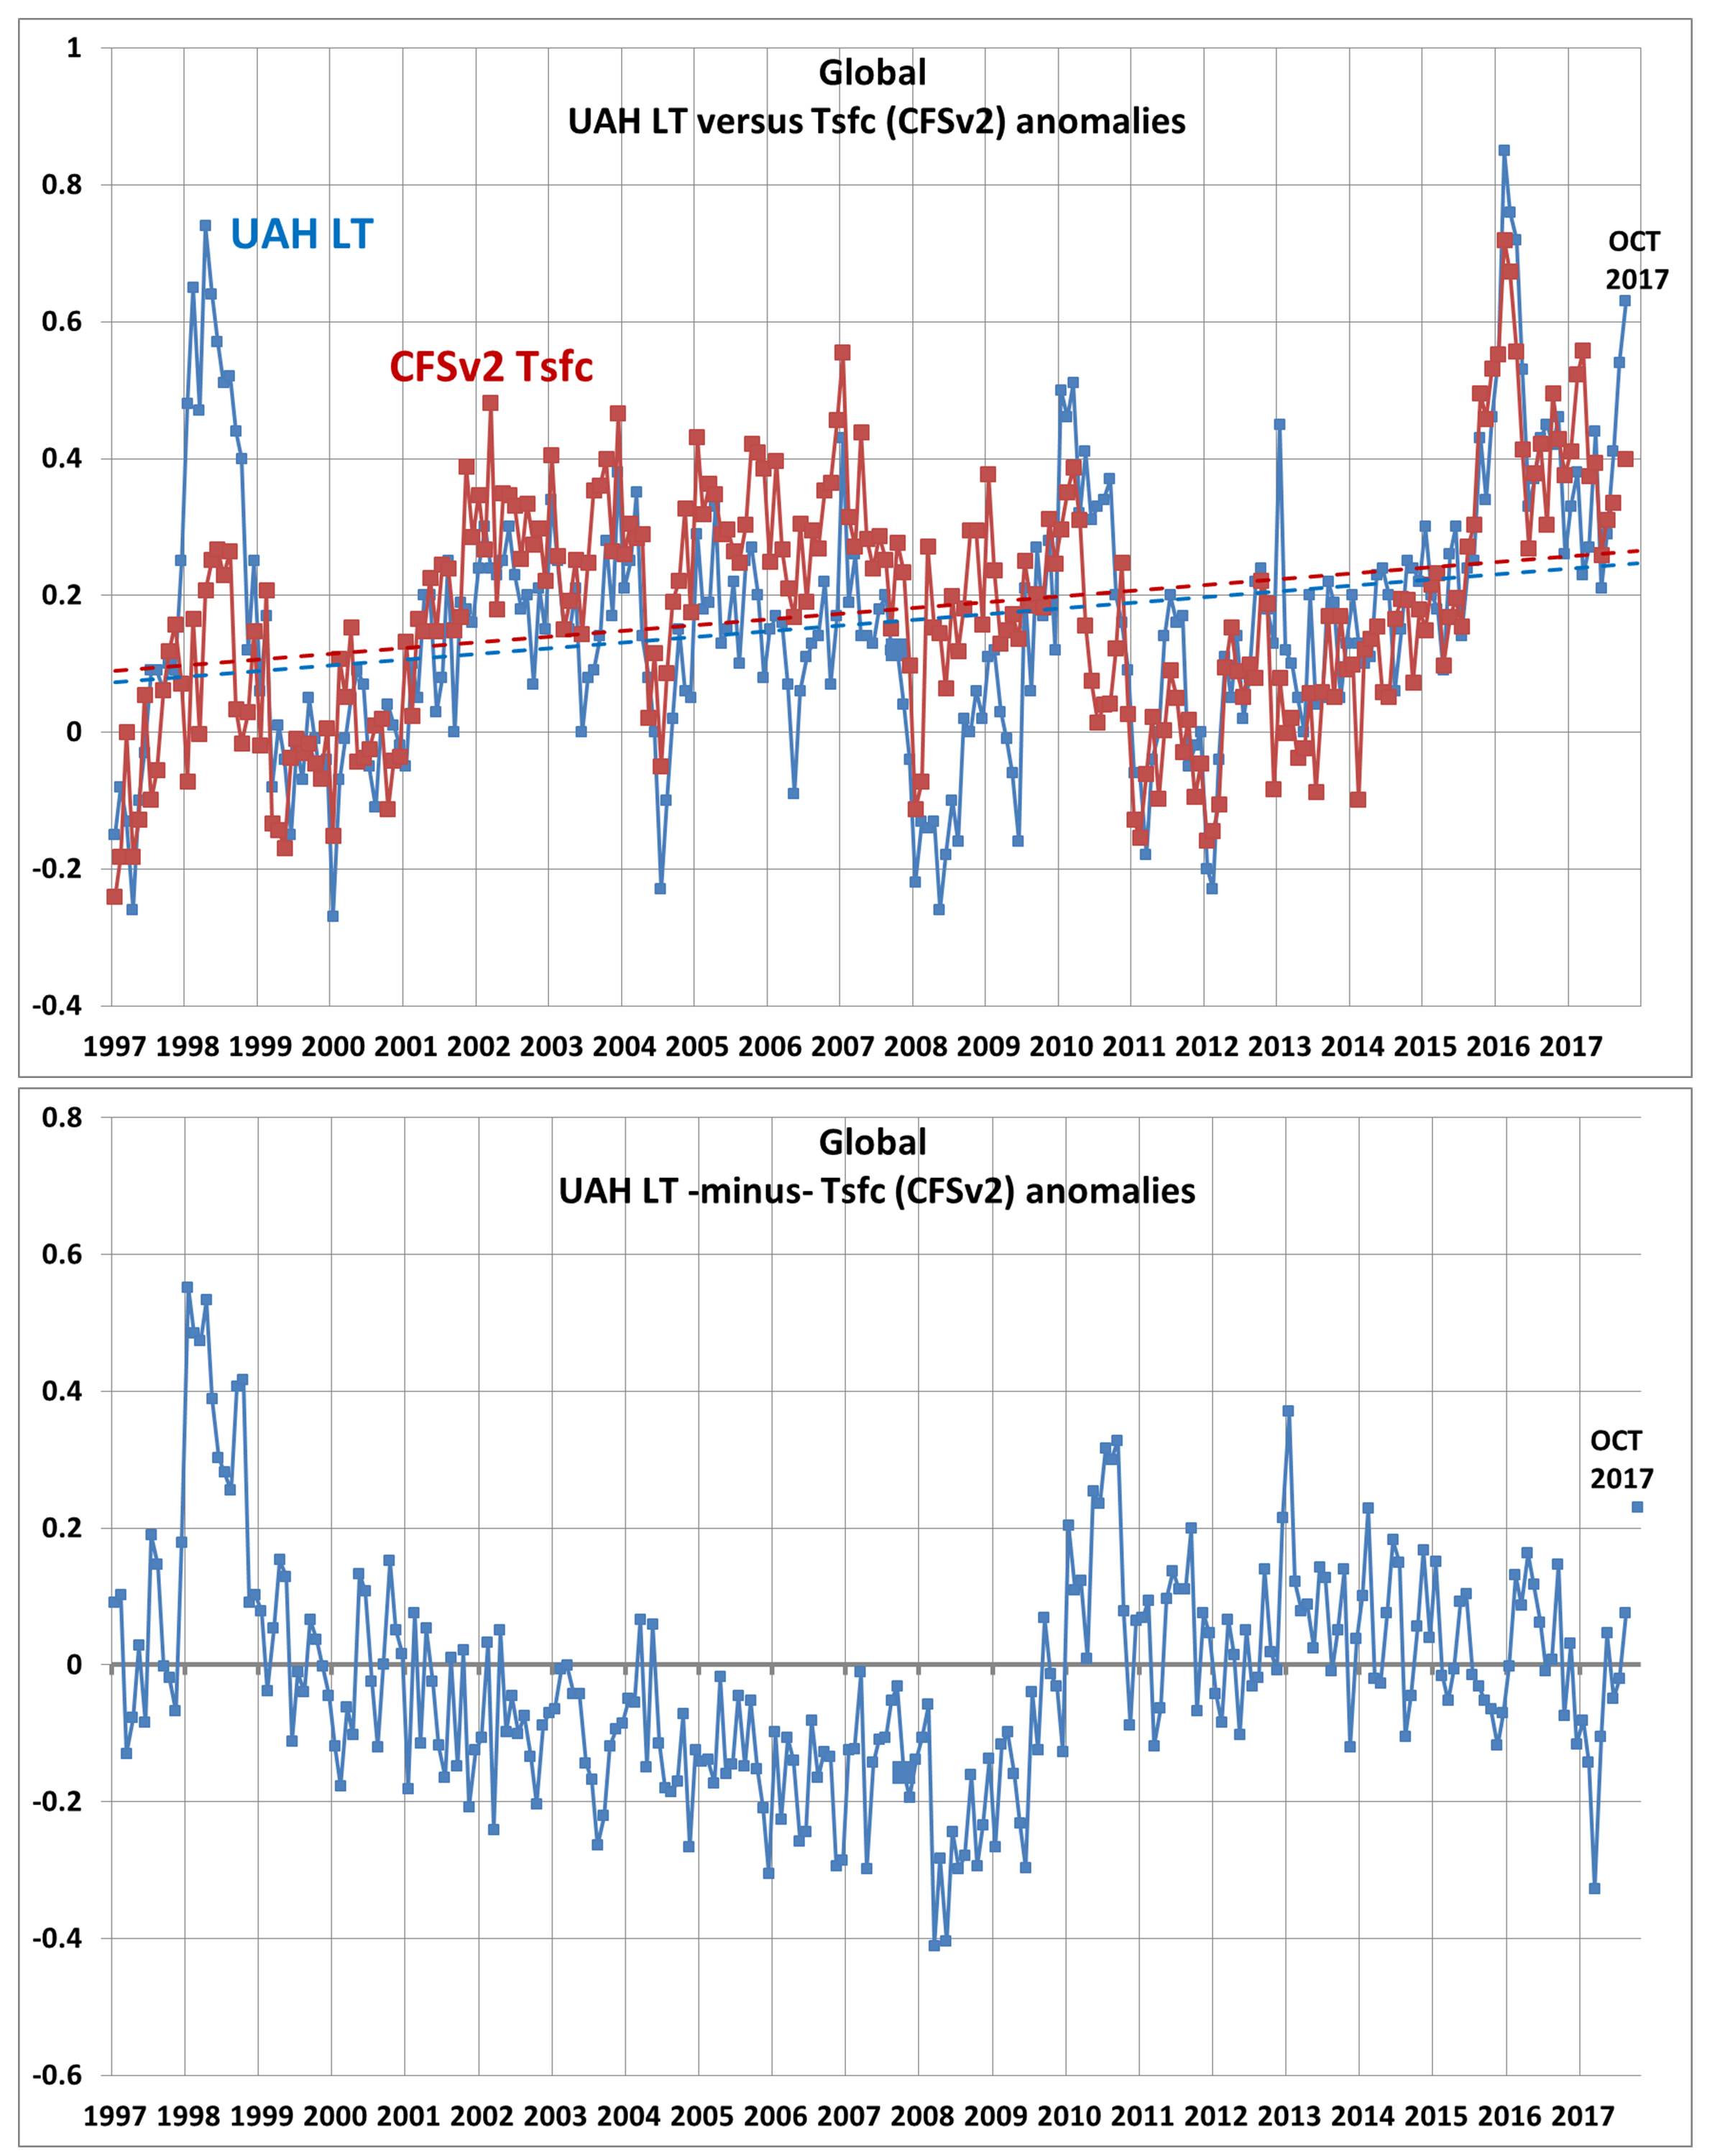
Monthly comparison since 1979 of global average temperature anomalies (relative to the monthly 1981-2010 averages) between UAH LT deep-layer lower tropospheric temperature and the surface temperatures in the CFSv2 reanalysis dataset at WeatherBell.com.
As can be seen, there have been considerably larger departures between the two measures in the past, especially during the 1997-1998 El Nino. Our UAH LT product is currently using 3 satellites (NOAA-18, NOAA-19, and Metop-B) which provide independent monthly global averages, and the disagreement between them is usually very small.
While we can expect individual months to have rather large differences between surface and tropospheric temperature anomalies (due to the time lag involved in excess surface warming to lead to increased convection and tropospheric heating), some of the differences in the above plot are disturbingly large and persistent. The 1997-98 El Nino discrepancy is pretty amazing. As I understand it, the NCEP CFS reanalysis dataset is the result of collaboration between NOAA/NCEP and NCAR, and uses a wide range of data types in a physically consistent fashion. I probably need to bring in one of the dedicated surface-only datasets for further comparison…I don’t recall the HadCRUT4 Tsfc dataset having this large of disagreements with our satellite deep-layer temperatures. Unfortunately, these other datasets usually take a few weeks before they are updated with the most recent month.
…UPDATE…(fixed)…
…the 2nd of the following two plots has been fixed)…
Here’s the comparison between UAH LT and Tsfc from the HadCRUT4 dataset, through September 2017. Note that the difference with the satellite temperatures isn’t as pronounced as with CFSv2 Tsfc data, but the HadCRUT4 data has more of an upward trend:
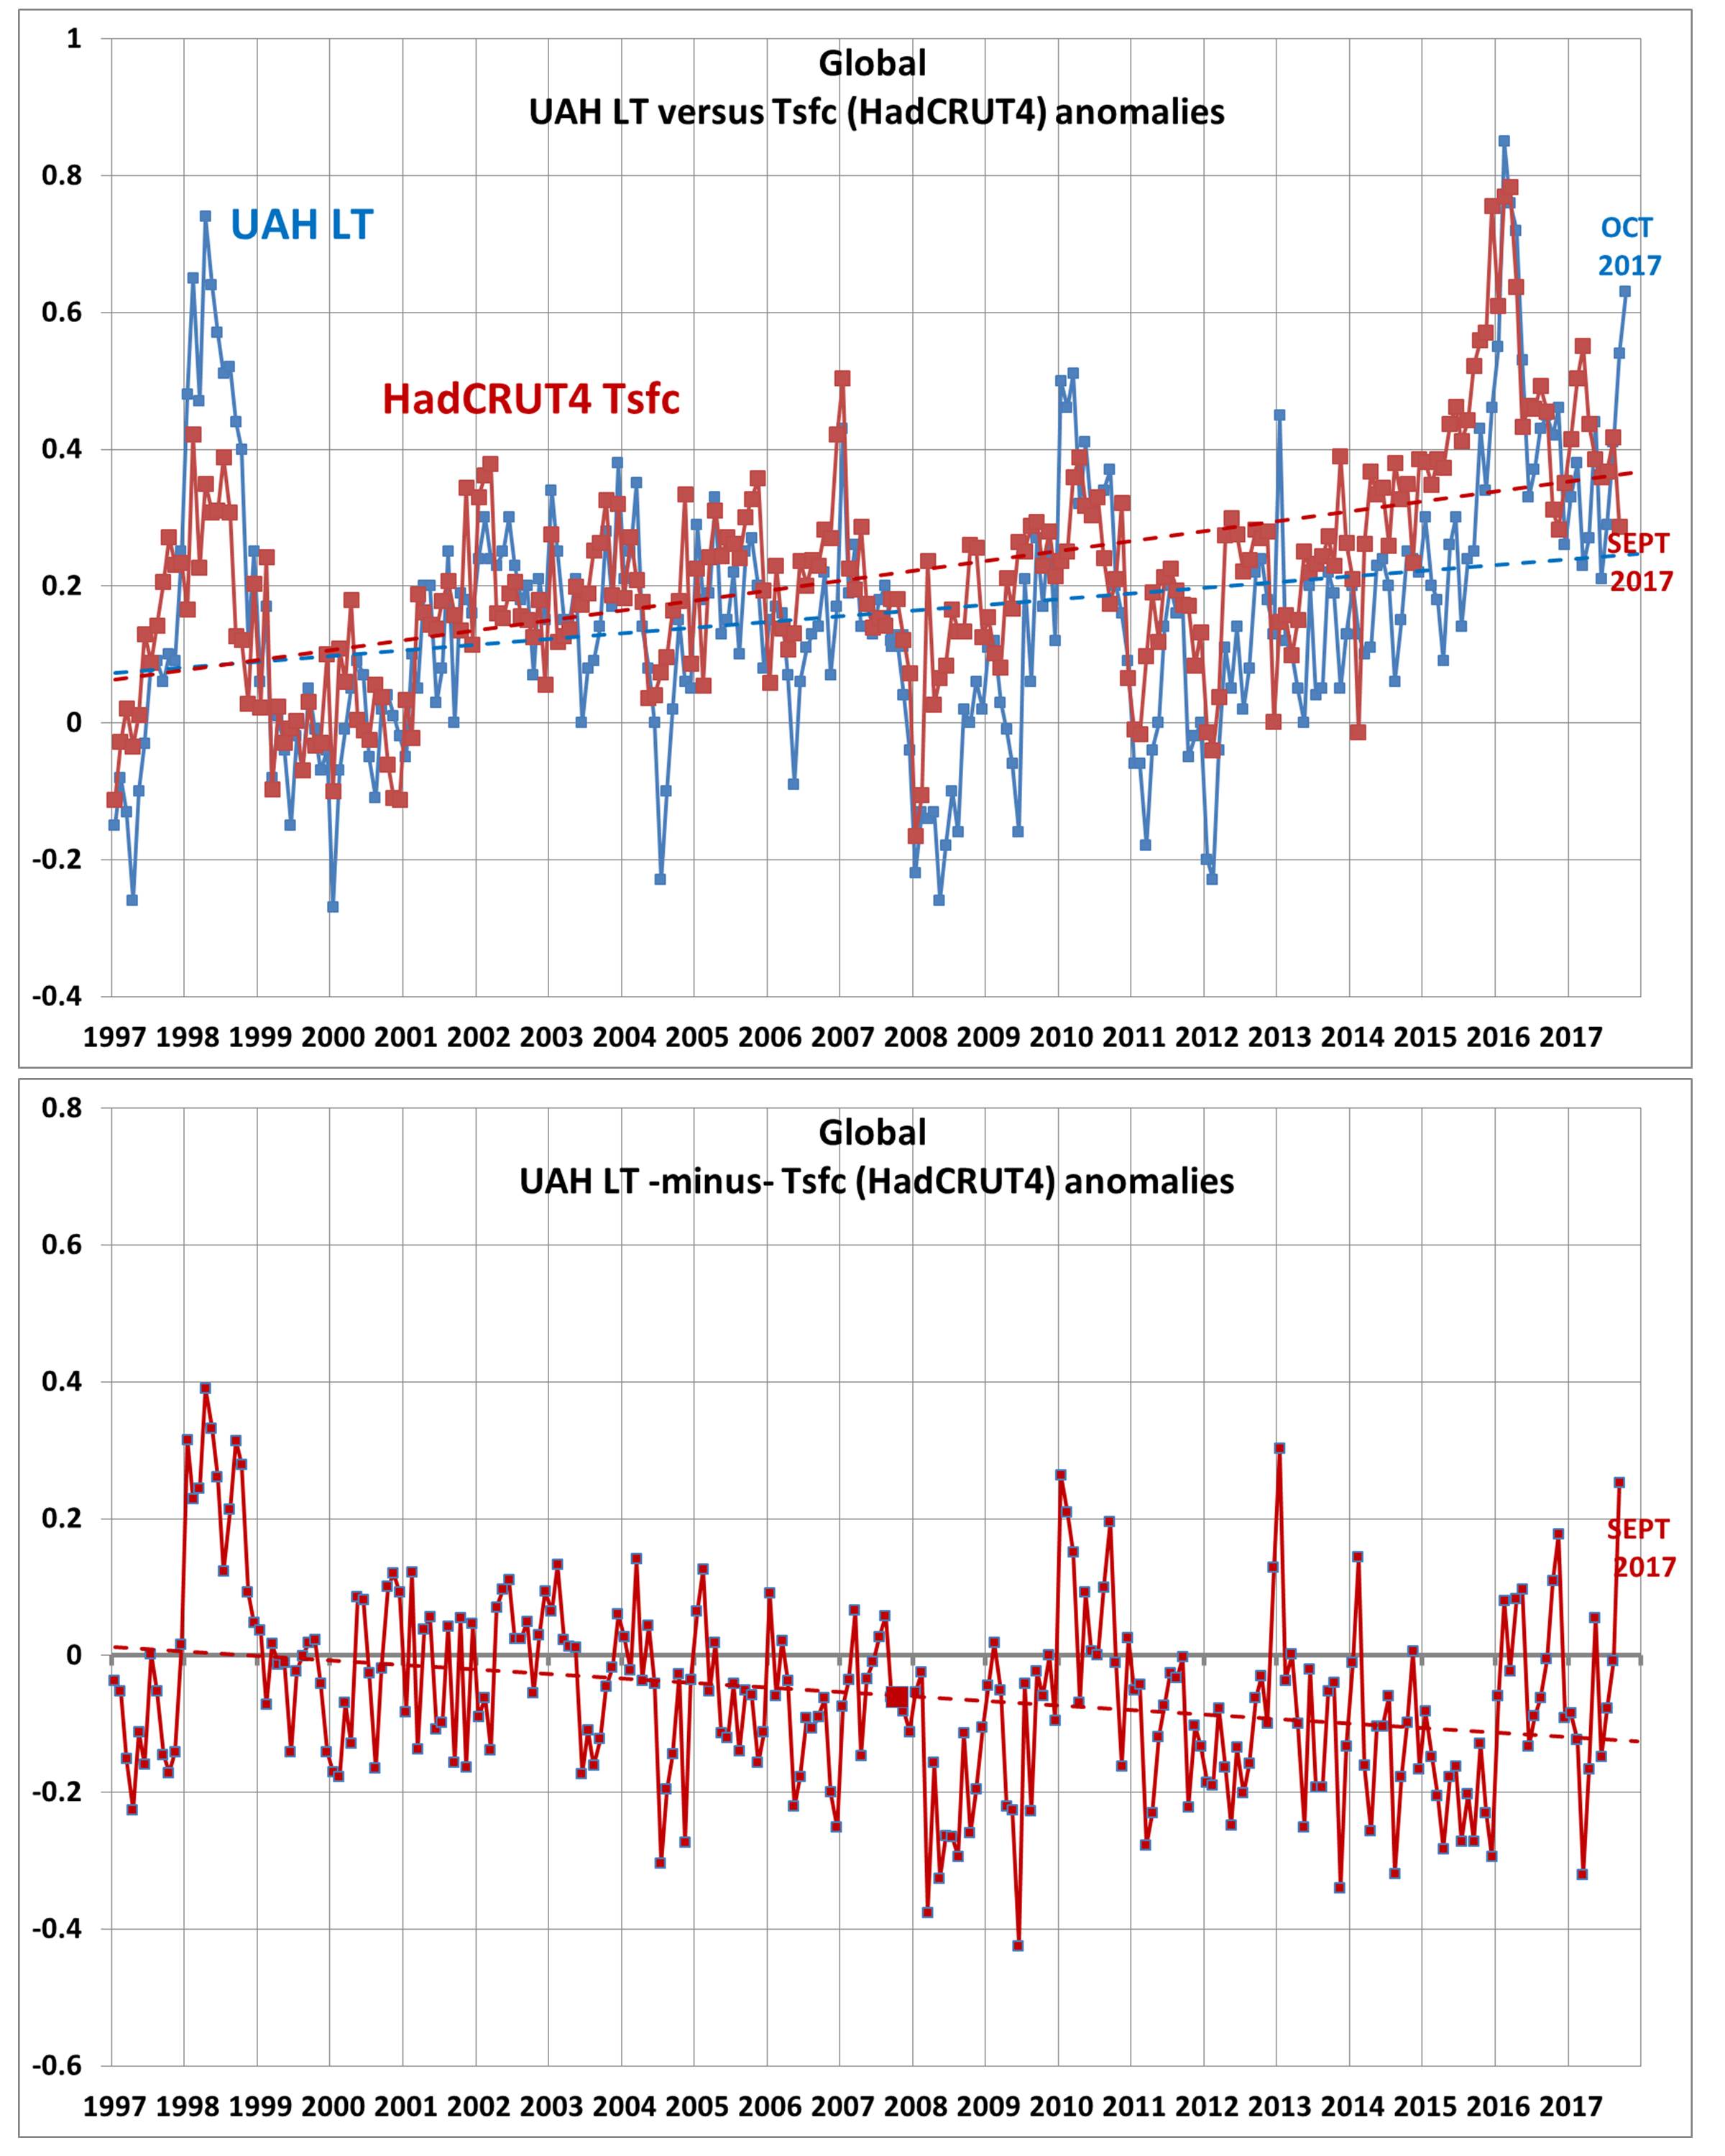
As in the previous figure, but now CFSv2 Tsfc data has been replaced by HadCRUT4 surface data (with the latter having anomalies recalculated relative to the 1981-2010 base period).
The UAH LT global anomaly image for October, 2017 should be available in the next few days here.
The new Version 6 files should also be updated in the coming days, and are located here:
Lower Troposphere: http://vortex.nsstc.uah.edu/data/msu/v6.0/tlt/uahncdc_lt_6.0.txt
Mid-Troposphere: http://vortex.nsstc.uah.edu/data/msu/v6.0/tmt/uahncdc_mt_6.0.txt
Tropopause: http://vortex.nsstc.uah.edu/data/msu/v6.0/ttp/uahncdc_tp_6.0.txt
Lower Stratosphere: http://vortex.nsstc.uah.edu/data/msu/v6.0/tls/uahncdc_ls_6.0.txt


