
 Home/Blog
Every winter I start thinking about the processes that lead to brutally cold air masses over regions far removed from the warming influence of the oceans�Siberia, interior Canada, etc. Temperatures in interior Alaska have been routinely dipping into the -50�s F over the last week or so. Europe has been hard hit by unusually cold weather, and Vladimir Putin decided this would be a good time to cut off natural gas supplies to a number of European countries.
As of this writing (January 9), it looks like the coldest temperatures in the Lower 48 are yet to come, as the coldest airmass over northwest Canada finds its way down into the central and eastern U.S. starting around next Wednesday (January 14) or so. Gee, where is global warming when you really need it?
The ‘scientific consensus’ is that these frigid air masses are the ones that should warm the most with manmade global warming. The reasoning goes that since they contain very little water vapor (Earth�s main greenhouse gas), the warming effect of the extra carbon dioxide should be proportionately greater there.
But what causes these air masses to get so cold in the first place? Well, little or no sunlight is the most direct reason, which means they radiatively cool to outer space without any solar heating to offset that infrared cooling.
But what limits how cold they can get? Why do these temperatures seldom fall below -60 or -70 deg. F….temperatures reached fairly early in the winter, but which then level off? The answer is mostly related to the water vapor content of the air.
There is an interesting issue of causation involved with these cold and dry air masses. Contrary to what some meteorologists think, the air doesn�t become dry because of the cold. If that was the case, the air would become continuously saturated with clouds and fog as it keeps cooling, rather than clear and relatively dry as is observed.
No, rather than being dry because it is cold, the air instead becomes cold because it is dry. And the reason the air is so dry is because it has been slowly sinking from high in the atmosphere, where there is very little water vapor. And why is THAT air so dry? Because precipitation processes have removed the water vapor as relatively warmer and moister air ascends in low pressure areas — snowstorms — which move around the periphery of the high pressure zones that are created by the strong cooling.
So, ultimately, it is precipitation processes in regions remote from these cold high pressure areas that mostly determine how cold surface temperatures will get. And since we have little understanding of how these precipitation processes in the upper atmosphere might change with �global warming�, there is (in my mind) more uncertainty about water vapor feedbacks than the IPCC has led us to believe.
I thought it would be interesting to examine the behavior of the coldest temperatures in the climate models that are tracked by the IPCC. Monthly gridded data are archived at PCMDI for transient CO2 simulations from these models, and we simply took the minimum monthly average temperature anywhere in the Northern Hemisphere for each month in the first 70 years of those simulations. Some of the results are shown in the figure below (note the temperature scaling is relative, not absolute). The red lines are 12-month running averages.
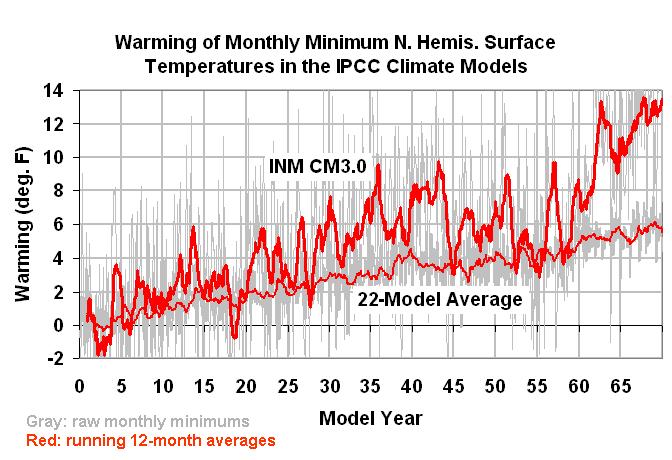
Across those 22 models, the minimum monthly temperatures warmed by an average of 0.43 deg. C per decade (0.77 deg. F per decade), which is somewhat less than double the average global warming rate in those models. Thus, the coldest air masses in the models do warm much faster than the global average temperature does.
Also, the average minimum monthly temperature for the first February across all 22 models was -50 deg. C (-58 deg. F), indicating that the models do indeed create very cold airmasses.
The model with the greatest rate of warming is also shown: the INM CM3.0 model warmed at an average of 0.80 deg. C per decade (1.44 deg. F per decade). The model with the least warming (actually, it had a zero warming trend) was the FGOALS 1.0, which is also the least sensitive of all the IPCC models analyzed by Forster & Taylor (2006 J. Climate).
What does all this mean for the theory of manmade global warming? How fast have these coldest airmasses warmed, compared to the IPCC models? Well, the location in Siberia that is traditionally the coldest, Ojmjakon, hit -60 deg. C (-76 deg. F) twice last month (December, 2008), a temperature that has been reached only one other time in the last 25 years. So, I suspect that global warming isn�t happening nearly fast enough for the folks who live there.


