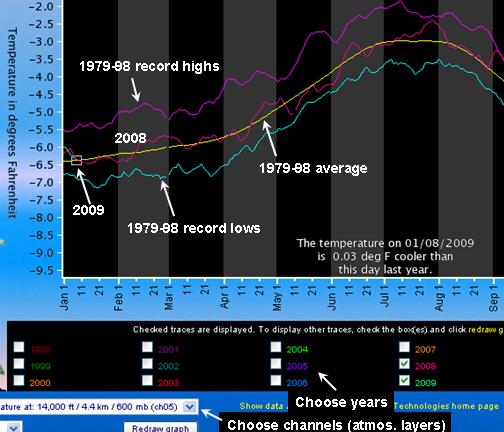
For those who are interested in monitoring how the current month’s global average tropospheric temperature is shaping up, we have a website where you can plot daily global average satellite-based temperatures since August 1998. The data come from the AMSU instrument flying on the NOAA-15 satellite, and the updates are made automatically once a day in the late afternoon; they run about 1-2 days behind real-time.
The following screenshot shows an example I took from the website today.

NASA Discover project website screenshot of tool to monitor daily global-average temperatures measured by the NOAA-15 satellite.
The webpage tool uses Java, which can be kind of slow loading (clearing your browser’s cache first seems to help…e.g., in Firefox use Tools => Clear private data).
Use the drop-down menu to pick “ch5” (AMSU channel 5) which is the channel John Christy and I use to monitor mid-tropospheric temperatures. The fairly large fluctuations seen within individual months are usually due to increases (warming) or decreases (cooling) in tropical rainfall activity, called “intraseasonal oscillations”.
Channel 9 is the channel we use for lower stratospheric temperatures. Channel 13 is in the upper stratosphere, and is kind of interesting since it is expected to cool with increasing atmospheric carbon dioxide concentrations.
The check boxes allow you to choose which years to display. You can also display the daily record highs and lows measured during the first 20 years of our MSU-based record, 1979-1998, but only for AMSU channels 5 (mid-troposphere) and 9 (lower stratosphere).
What we usually watch is how the current month is shaping up compared to the same calendar month in the previous year. For instance, in the screenshot above we see that early January 2009 is running roughly the same as January 2008, which ended up being close to the 1979-98 average.
This web page should be used as only a rough guide, because there are some data adjustments made before we officially post the UAH monthly updated data. (I post a plot of those data here.) The biggest adjustment is the fact that we don’t even use NOAA-15 right now…we are using the AMSU data from NASA’s Aqua satellite in the final UAH product.

 Home/Blog


