The simple climate model I have made publicly available can be used to demonstrate many basic concepts regarding climate change.
Here I will use it to demonstrate that the global warming so commonly blamed on humanity’s greenhouse gas emissions can just as easily be explained as largely natural in origin, most likely due to a natural decrease in global cloud cover.
In general, there are TWO POTENTIAL EXPLANATIONS OF CLIMATE WARMING:
(1) X deg. C warming = anthropogenic CO2 increase + sensitive climate system
(2) X deg. C warming = natural forcing + anthropogenic CO2 increase + insensitive climate system
While I will run the model with an assumed ocean mixing depth of 50 meters of water, the same general effects can be demonstrated with very different depths, say, 10 meters or 500 meters. I have also added some weak natural variability on monthly to yearly time scales to better mimic what happens in the real climate system. You can run the model yourself if you are curious.
While the model is admittedly simple, it does exactly what the most complex computerized climate models must do to simulate global-average warming: (1) conserve energy by increasing temperature in response to an accumulation of energy, and (2) adjust the magnitude of that temperature change through feedbacks (e.g. cloud changes) in the climate system.
CASE 1: Anthropogenic Global Warming in a Sensitive Climate System
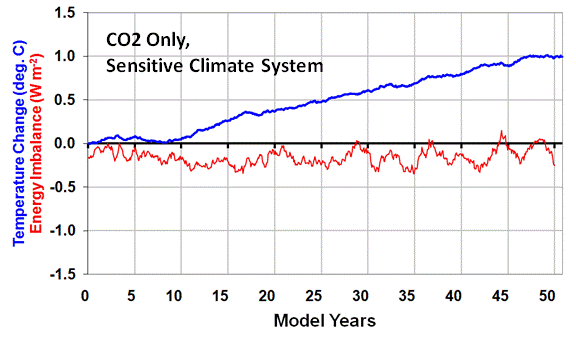
In the first example I run the simple forcing-feedback climate model with gradually increasing carbon dioxide causing an extra forcing of 0.25 Watts per sq. meter every ten years, acting upon a very sensitive climate system. “Sensitive” in this case is a net feedback parameter of 1.0 Watt per sq. meter per deg. C, which would correspond to about 3.8 deg. C of warming from a doubling of atmospheric carbon dioxide (2XCO2). (It is expected that we will reach 2XCO2 later in this century.) This amount of warming is on the high side of what the IPCC projects for the future.
The following plot shows 50 years of resulting warming (blue trace) from the model, as well as the radiative imbalance at the top of the model atmosphere (red trace). In this plot, when the radiative balance is negative it means there is an accumulation of energy in the climate system which will then cause subsequent warming.

These are the two main sources of information used to diagnose the reasons for global climate variability and climate change. In the real climate system, the warming (blue trace) could be measured by either surface thermometers, or from Earth-orbiting satellites. The red trace (radiative imbalance) is what is measured by satellite instruments (e.g. the CERES instruments on the Terra satellite since 2000, and on the Aqua satellite since 2002).
CASE 2: Natural Global Warming in an Insensitive Climate System
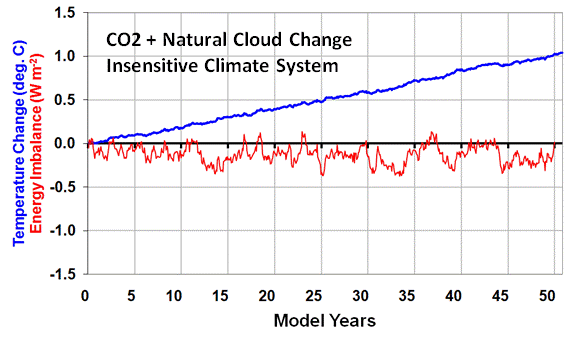
To demonstrate that the same satellite-observed behavior can mostly caused by natural climate change, in the second example I run the simple forcing-feedback climate model with the same amount of CO2 forcing as in CASE 1, but now add to it 1.0 Watt per sq. meter of additional forcing from gradually decreasing cloud cover allowing more sunlight in. This gives a total forcing of 1.25 Watt per sq. meter every ten years.
But now I also change the net feedback to correspond to a very IN-sensitive climate system. “Insensitive” in this case is a net feedback parameter of 6.0 Watts per sq. meter per deg. C, which would correspond to just over 0.5 deg. C of warming from a doubling of atmospheric carbon dioxide (2XCO2). This amount of warming is well below the 1.5 deg. C lower limit the IPCC projects for the future as a result of 2XCO2.

As can be seen in the second plot above, the same rate of warming occurs as in CASE 1, and the radiative imbalance of the Earth remains about the same as in CASE 1 as well.
What this demonstrates is that there is no way to distinguish anthropogenic warming of a sensitive climate system from natural warming within an insensitive climate system, based only upon the two main sources of information we rely on for climate change research: (1) temperature change, and (2) radiative imbalance data collected by satellites.
THE CRITICAL IMPORTANCE OF THIS AMBIGUITY
The reason why this fundamental ambiguity exists is that the radiative imbalance of the Earth as measured by satellites is a combination of forcing AND feedback, and those two processes always act in opposition to one another and can not be easily separated.
For instance, a satellite-measured imbalance of -1 unit can be caused by either -2 units of forcing combined with +1 unit of net feedback, OR by -5 units of forcing combined with +4 units of net feedback. There is no way to know for sure which is happening because cause and effect are intermingled.
After many months of research examining satellite data and the output from 18 of the IPCC climate models, I have found no way to separate this natural “internal radiative forcing” of temperature change from feedback resulting from that temperature change.
So how is it that the “consensus” of climate scientists is that CASE 1 is what is really happening in the climate system? Because when researchers have observed a decrease in cloud cover accompanying warming, they assume that the cloud decrease was CAUSED BY the warming (which would be positive cloud feedback). They do NOT consider the possibility that the cloud decrease was the CAUSE OF the warming.
In other words, they assume causation in only one direction (feedback) is occurring. This then gives the illusion of a sensitive climate system.
In fact, our new research to appear in Journal of Geophysical Research demonstrates that when natural cloud changes cause temperature changes, the presence of negative cloud feedback cannot even be detected. This is because causation in one direction (clouds forcing temperature) almost completely swamps causation in the opposite direction (temperature forcing clouds, which is by definition feedback).
[NOTE: The claims that there are “fingerprints” of anthropogenic warming are not true. The upper-tropospheric “hot spot”; greater warming over land than over the ocean; and greater warming at high latitudes than at low latitudes, are ALL to expected with any source of warming.]
WHEN WILL THEY LEARN?
Based upon my discussions with mainstream climate researchers, I am finding great reluctance on their part to even consider that such a simple error in interpretation could have been made after 20 years of climate research. As a result of this reluctance, most will not listen (or read) long enough to even understand what I am talking about. A few do understand, but they are largely in the “skeptics camp” anyway, and so their opinions are discounted.
When other scientists are asked about our work, they dismiss it without even understanding it. For instance, the last time I testified in congress, Kevin Trenberth countered my testimony with a pronouncement to the effect of “clouds cannot cause climate change“, which is an astoundingly arrogant and uninformed thing for a scientist to say. After all, we find clear evidence of clouds causing year-to-year climate variability in ALL of the IPCC models, so who is to say this cannot occur on decadal — or even centennial — time scales?
CLIMATE CHAOS
I’m often asked, what could cause such cloud changes? Well, we know that there are a myriad of factors other than just temperature that affect cloud formation. The most likely source of long-term cloud changes would be changes in ocean circulation, which can have very long time scales. But then I’m asked, what caused the ocean changes?
Well, what causes chaos? All of this could simply be the characteristics of a nonlinear dynamical “chaotic” climate system. While a few people have objected to my use of the term “chaotic” in this context, I see no reason why the traditional application of chaos theory to small space and time scales (such as in weather) can not be extended to the larger space and time scales involved in climate. Either way, chaos involves complex nonlinear behavior we do not yet understand, very small changes in which can have profound effects on the system later. It seems to me that such behavior can occur on all kinds of space and time scales.
In conclusion…Yes, Virginia, natural climate cycles really can exist.

 Home/Blog


