Millennial Climate Cycles Driven by Random Cloud Variations

June 2nd, 2010 by Roy W. Spencer, Ph. D.

I’ve been having an e-mail discussion with another researcher who publishes on the subject of climate feedbacks, and who remains unconvinced of my ideas regarding the ability of clouds to cause climate change. Since I am using the simple forcing-feedback model as evidence of my claims, I thought I would show some model results for a 1,000 year integration period.

What I want to demonstrate is one of the issues that is almost totally forgotten in the global warming debate: long-term climate changes can be caused by short-term random cloud variations.

The main reason this counter-intuitive mechanism is possible is that the large heat capacity of the ocean retains a memory of past temperature change, and so it experiences a “random-walk” like behavior. It is not a true random walk because the temperature excursions from the average climate state are somewhat constrained by the temperature-dependent emission of infrared radiation to space.

A 1,000 Year Model Run

The temperature variability in this model experiment is entirely driven by a 1,000 year time series of monthly random numbers, which is then smoothed with a 30-year filter to mimic multi-decadal variability in cloud cover.

I’ve run the model with a 700 m deep ocean, and strong negative feeedback (6 Watts per sq. meter of extra loss of energy to space per degree of warming, which is equivalent to only 0.5 deg. C of warming for a doubling of atmospheric CO2. This is what we observed in satellite data for month-to-month global average temperature variations.)

The first plot below shows the resulting global average radiative imbalance, which is a combination of (1) the random cloud forcing and (2) the radiative feedback upon any temperature change from that forcing. Note that the standard deviation of these variations over the 1,000 year model integration is only one-half of one percent of the average rate at which solar energy is absorbed by the Earth, which is about 240 Watts per sq. meter.
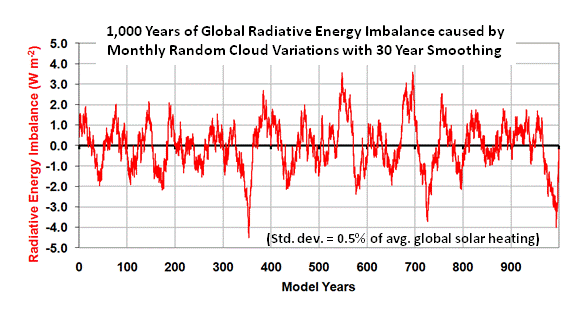
I also computed the average 10-year trends for all 10-year periods contained in the 1,000 year time series shown above, and got about the same value as NASA’s best radiation budget instrument (CERES) has observed from the Terra satellite for the ten-year period 2000 – 2010: about 1 Watt per sq. meter per decade. Thus, we have satellite evidence that the radiative imbalances seen above are not unrealistic.

The second plot shows the resulting temperature changes over the 1,000 year model run. Note that even though the time scale of the forcing is relatively short — 30 year smoothed monthly random numbers — the 700 m ocean layer can experience much longer time scale temperature changes.
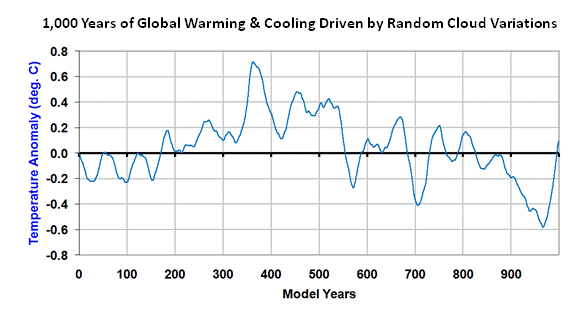
In fact, if we think of this as the real temperature history for the last 1,000 years, we might even imagine a “Medieval Warm Period” 600 years before the end of the integration, with rapid global warming commencing in the last century.

Hmmm…sounds vaguely familiar.

The main point here is that random cloud variations in the climate system can cause climate change. You don’t need a change in solar irradiance, or any other external forcing mechanism.

The above plots also illustrate the danger in comparing things like sunspot activity (and its presumed modulation of cloud cover) to long-term temperature changes. As you can see, the temperature variations in the second plot look nothing like the global energy imbalance variations in the first plot. This is for two reasons: (1) forcing (global radiative imbalance) due to cloud variations is related to the time rate of change of temperature….not to the temperature per se; and (2) the ocean’s “memory” of previous forcing leads to much longer time scale temperature behavior than the short-term cloud forcing might have suggested.

The fact that climate change can be caused by seemingly random, short-term processes has been totally lost in the climate debate. I’m not sure why. Could it be that, if we were to admit the climate system can vary in unpredictable ways, there would be less room for our egos to cause climate change?


43 Responses to “Millennial Climate Cycles Driven by Random Cloud Variations”

Toggle Trackbacks

  1. Basil says:

    “The main reason this counter-intuitive mechanism is possible is that the large heat capacity of the ocean retains a memory of past temperature change, and so it experiences a “random-walk” like behavior.”

    I guess I’m missing something here. “Random-walk” is pretty much the antithesis of “memory” in a time series. Time series can be described in terms of three different states or characteristics: persistence (trending), anti-persistence (reversion toward a mean), and random walk (exhibiting neither persistence nor antipersistence).

    By “memory” I would normally think you are talking about “persistence,” but I’m not sure, and hope you can clarify. In my study of temperature change — using the instrumental record — monthly changes tend to behave like a random walk, but are actually the product of roughly off-setting tendencies toward persistence and anti-persistence. The anti-persistence in temperature change suggests a homeostatic process in which shocks to the system are followed by a reversion toward the mean, or norm, for the system. The persistence in temperature is the effect of clear cyclical tendencies (especially decadal and bidecadal, but also on longer scales). In any given month, these tendencies are interacting and offsetting to create an appearance of a random walk in temperature change.

    It seems to me as if you are saying that with random shocks to the system (in this case from cloud variation) you can generate what appears to be something like a random walk (your second figure). But random walks are deceiving. In other words, they appear to exhibit persistence, but do not in fact do so. So the fact that your second figure appears to exhibit periods of persistence doesn’t translate to a random walk. That it was generated by a model perturbed by random shocks is interesting, and perhaps significant, but if there is truly “memory” in the system, then that is what is generating the “trends” and those persist in spite of the random shocks.

    I’m probably off base here on some things, but I do think the statement I quoted is confusing and potentially misleading.

  2. I suspect this is just semantics. I say “memory” because each subsequent temperature state depends upon the previous states. Similarly, when a person is walking, the location of each subsequent step depends upon all of the locations of the previous steps. I’m afraid I’m not familiar with random walk terminology, but I suspect we have no disagreement.
    -Roy

  3. geo says:

    Well, congrats, Roy, on at least getting a skeptical non-skeptic (err, you know that I mean) to engage on the issue. I hope that person stays with the dialogue long enough to really understand the point you’re making and does his best to poke holes in it from a position of at least grasping what it is he should be trying to pokes holes in!

    That’s healthy debate. Maybe that discussion will even develop to the degree of warranting a published pro/con debate on the matter?

  4. S.P. Gass says:

    This is interesting. Are there any publicly available data sets with monthly global/regional cloud cover metrics?

  5. I think you last paragraph is most telling and reinforces the notion that science is after a very human process. That said, I think your little model illustrates how much we do not know and how willing we as people, even scientifically trained people, seem to ignore that. Something for the social scientists or Popper’s pseudo sciences to explain. The message this geologists takes from the discussion is simply: we need to spend way more time and resources studying the oceans and investigating the interrelationships of all the possible feedback loops. The devil is always in the details and more I look the more details I keep finding. I think we need to revisit the process of using multiple working hypotheses, in small, even isolated fashion, before trying to build up the grand theory of everything.

  6. harrywr2 says:

    “the random cloud forcing”

    Random as always is a word we use to describe a process where the relationship of the underlying variables are unknowns.

    There is a relatively strong correlation between the orbits of Saturn and Jupiter and long term earth whether patterns.

    Saturn and Jupiter align every 20 years 243 degrees from the point of origin. They align every 60 years within 9 degrees of point of origin. This changes the center of gravity of the solar system.

    Most folks are aware that the Chinese calender describes 12 year cycles. The Chinese calender also has a 60 year cycle to it.

    Ancient calenders tend to mimic some naturally occurring phenomena. Such as full moons, position of the sun etc.

    The ancients didn’t do a very good job of determining causality of various phenomena, they did leave us a fairly good road map of the ‘patterns’ of the phenomena.

  7. BenAW says:

    Dr. Spencer

    Read your book and to me this is a much more likely theory than the CO2 theory, with all the tipping points and assumed positve feedbacks. It feels simple and elegant.
    Also gives room to theories like Svensmark’s, working on longer timescales.
    A question: given no feedback or other changes, how long does it take for the atmosphere to warm the much mentioned 1 deg. after a sudden CO2 doubling?
    I understand the heatcapacity of the upper 2 meters or so of the oceans equals that of the atmosphere. Total heat capacity of the oceans is somewhere over 3000 times that of the atmosphere. What timeframes do you estimate for the whole system to stabilise after the sudden doubling of atmospheric CO2?

  8. Bob Mount says:

    I first became sceptical about AGW because it is egocentric based and politically/economically driven.

  9. Bob Mount says:

    Dr Spencer, Am I correct in thinking that temperature is a man-made proxy for heat energy? If so, why do we continue to base “climate” warming on temperature variations (“anomalies”) about a hypothetical, world wide, day and night mean annual temperature? Your satellites measure heat energy changes directly (which is what we are after), so why change them to temperature anomalies before sending the results back to Earth, thereby losing the data we actually need!? Many thanks, Bob.

    • The radiance measued by the satellites is proportional to temperature, and temperature is important because it is the largest single determinant of how fast the Earth loses energy (mostly infrared) to outer space.

  10. Andrew says:

    BenAW-Dr Spencer can offer his own answer, but I would just like to point out that the time it takes for the “equilibrium” response to occur is actually proportional to the sensitivity itself. Unfortunately I don’t remember the mathematics of this precisely, or the value of the response time implied by zero feedback.

    • Anonymous says:

      @Andrew
      Hello Andrew

      I’m curious about the timelag after a CO2 doubling, purely from an energy point of view, so the rest of the paramaters unchanged. I’m beginning to think that when discussing climat, we should be discussing ocean currents etc, not the things happening in the atmosphere. They seem to be just effects of changes in the much more influential oceans.

  11. […] his latest post he shows how his model of the climate system produces almost random walk behaviour; the kind of […]

  12. Joe Born says:

    I failed to replicate that type of behavior in your “Simple Climate Model Spreadsheet v1.0”; to my eyeball, the spectral density of the temperature anomaly was roughly the same, but my peak anomaly (albeit for 300 years rather than 1000) was only about 0.03 deg.

    What parameters did you use? My time step was 30 days, my feedback parameter was 6.0, my water depth was 700 meters, I used 30-year (360-month) straight-average smoothing on the radiative forcing and no smoothing on the non-radiative forcing, my heat-flux coefficients were both 1.5, and CO2 forcing was turned off.

  13. MAK says:

    How does the cloud cover changes affect the satellite temperature monitoring?

    If cloud cover increases, the earth will receive less sunshine and – eventually – the earth should cool (mostly via changes in OHC).

    Now, the with satellite monitoring you must exclude areas covered by clouds (since yoy cannot see through clouds) and essentially you only monitor areas with no significant cloud cover.

    Doesn’t this mean that essentially (with satellite monitoring) you miss all cloud-cover introduced temperature changes in short term? Only long term OHC/SST changes to non-cloud covered areas remains.

    • No, you are thinking of infrared satellite measuremens…we use microwave measurements, at frequencies where most cloud cover is either transparent of emits at the temperature of the air anyway. The cloud contamination is quites small…but not non-existent.

  14. […] Millennial Climate Cycles Driven by Random Cloud Variations « Roy … […]

  15. Steve Fitzpatrick says:

    Dr. Spencer:

    This is an interesting result.

    But I have one doubt. Since ocean evaporation is sensitive to ocean temperature, it seems to me that the assumption of random variation in cloud cover, independent of any potential feed-back effects on cloud cover from changes in ocean surface evaporation, may be a bit of a stretch. Is there not some pretty solid satellite data which indicates significant positive correlation between total rainfall and ocean surface temperature? If rainfall (and presumably overall cloud cover) are influenced by evaporation, I don’t see how one can justify the assumption of totally random cloud cover changes.

    • The model does has term for *variations* in ocean evaporation (cooling) and precipitation (heating) of the troposphere, but they do not matter for this type of model integration. Yes, evaporation and rainfall go up with surface temperature, but ALL changes, no matter the source, must then affect the radiative budget of the Earth for them to matter to global average temperatures. The behavior of the model is consistent with the variations we see in the radiative budget of the Earth from satellites….exactly what CAUSED those variations to be what they are might be interesting for understanding the details, but not for demonstrating that changes in the Earth’s albedo (which is mostly a function of cloud cover) can cause climate change.

  16. Bill V says:

    Like some others, I want to be open to this idea, but don’t quite yet understand all that is presented.
    I feel you know what you are talking about, but there is a disconnect from the writing of your findings and the comprehension level of a lay person such as myself. Don’t take this the wrong way, but if you get to the point of publishing your recent cloud research for the masses (not for peer scientific review), a surrogate writer might be useful.

    Also, one stumbling block I have with the cloud concept is this: through most all my education regarding weather, I was taught that clouds are formed as a result of some condition, not visa versa. The exception of course, rain and cooler daytime temps, but what we are discussing here is warming and not cooling.

    • If I make things too simple, I am criticized for not providing details. If I provide details, I am criticized for making the material too complex. I try to make my posts mostly understandable to the scientifically literate, but they would never pass peer review by themselves because they are so brief and lacking in detail.

      Yes, clouds are always caused by something. The distinction is whether they are caused by a temperature change (which would be, by definition, “feedback”) or by some other process (which then puts them in the category of “radiative forcing”)

      • Anonymous says:

        Right. I understand the balance of writing blogs: the audience is everyone. My comment is more geared towards future “writings to the masses” such as a book targeted towards a specific audience. Also, my cloud comment was not to counter your findings, just a background on why the common person might have a hard time accepting the finding.

        As you may well be aware, its not just about doing the right research and having the correct data. Both sides of this argument must be masters of communication and PR in order to have their findings at least reviewed, if not entirely accepted. Think about recent presidents elected with large margins: was it their ideas, or their ability to communicate their ideas? For better or worse, AGW is not just a discussion among scientists; the voting public also needs to be in on it. I believe you are on to something good that I would love to see put out there more than it is.

  17. […] Millennial Climate Cycles Driven by Random Cloud Variations […]

  18. Nice post!

    Perhaps you may find some relevance with my articles:

    Koutsoyiannis, D., A toy model of climatic variability with scaling behaviour, Journal of Hydrology, 322, 25–48, 2006. (http://www.itia.ntua.gr/en/docinfo/648/)

    Koutsoyiannis, D., A random walk on water, Hydrology and Earth System Sciences, 14, 585–601, 2010. (http://www.itia.ntua.gr/en/docinfo/923/)

    Some differences are that the “dynamics” I use are “toy” conceptualizations and that I do not use any random perturbation on anything at all–but again the long-term fluctuations are reproduced including the emergence of Hurst-Kolmogorov behaviour.

    Regards,

    Demetris

  19. Anders L. says:

    Dr Spencer,
    you wrote
    “The main point here is that random cloud variations in the climate system can cause climate change. You don’t need a change in solar irradiance, or any other external forcing mechanism.”

    But the fact that the climate system exhibits natural internal variations does not preclude that it could be affected by a radical change in the composition of the atmosphere.

    • Anonymous says:

      Of course, it isn’t an either-or proposition, but who says it has to be? Nobody disputes that there would be AN effect of CO2 increases. Why is it that whenever anyone postulates a role for natural variability in causing recent changes, everyone assumes that you mean the variability caused it all and your are saying CO2 et al had no effect? Why go after such a straw man?

  20. Basil says:

    I don’t mean to quibble, but I think there’s a bit more here than just “semantics.” In the main, I’m not disagreeing with your basic argument. But I do think clarity is needed in describing it. I wrote up something a bit longish yesterday, and tried to post it, but it went into the bit bucket. So I’ll “cut to the chase” and respond directly to this bit:

    “Similarly, when a person is walking, the location of each subsequent step depends upon all of the locations of the previous steps.”

    True, but this is not evidence of a “random walk.” A random walk is like a coin toss: the next “step” (toss) is completely independent of all previous “steps.” Imagine a “drunken sailor” who randomly takes a step right or left. If he’s taken 8 steps to the left, the next step is still completely unpredictable. The fact that the previous 8 steps have determined his “location” from which he takes the next step is not evidence of “memory.” There is no memory here. Where there is “memory” we have a basis for predicting the next step, and we do not have that with a “random walk.”

    Which is not to say that in the model/system you are describing, there is not both randomness and memory. But even randomness is not equivalent to a “random walk.” Rather than talk about random walks, I think you need talk of “persistence” and “anti-persistence.” I suspect that the cloud portion of your model is “anti-persistent.” That is, there is some base or mean value to which you subject the cloud variable to random shocks, and the tendency of the system is to revert back to the base or mean value. But that, by itself, is not what is creating the “random walk” (just using the term here accomodatively) you have in your second figure. That comes because there is something ELSE in your model/system that is “persistent” and it is the combination of the two that give rise to the meandering “trends” of your second figure.

    When I look at your first figure, I see “cycles” of ~75 years in the figure. Not knowing anything about your model/system other than what you’ve said in describing it, I might surmise that these “cycles” reflect something about the behavior of the ocean in your model. And that is where the “persistence” or “memory” comes in to play. So if I’m reading your first figure correctly, I would say that the randomness, or anti-persistence, is in the 10 year averages of the monthly variations, and then on top of this is a ~75 year pattern of cyclic variation. Together, these make up the forces giving rise to your second figure.

    In the final analysis, I might take your main point:

    “The fact that climate change can be caused by seemingly random, short-term processes has been totally lost in the climate debate.”

    and reword it to say

    “There has not been enough consideration of how anti-persistent, short term shocks to climate systems, can interact with natural climate variation on decadal timescales to create even longer term patterns of natural climate change.”

    To read up on the role of “antipersistence” I would refer you to:

    http://www.warwickhughes.com/climate/karner.pdf

    http://citeseerx.ist.psu.edu/viewdoc/download?doi=10.1.1.122.2562&rep=rep1&type=pdf

    http://www.uwm.edu/~aatsonis/npg-14-723-2007.pdf

    Incidentally, you are cited in the two Karner papers, but inexplicably (to me) Karner is not cited by the third.

  21. Dan Kirk-Davidoff says:

    Anders makes a good point. In fact, we have independent evidence from the temperature variations in response to the solar cycle, where the forcing is known precisely, that excludes very low climate sensitivity (see Tung and Camp, 2008 and a long list of references therein). While the existence of natural variability in cloud radiative forcing adds noise to estimates of climate sensitivity, there’s no reason to suppose that it biases the estimate in one direction or the other in cases where the forcing is known.

    Also, if you run Dr. Spencer’s model for, say, ten thousand years you can calculate the probability of a warming of 0.6°C in fifty years, as we’ve observed, and the probability of this happening in any given fifty year period is quite small (a percent or so). Thus, if this model is the null hypothesis, we can confidently reject it as an explanation of the present warming. This would not have been true in, say, 1980: the signal has emerged from the noise.

  22. Steve Fitzpatrick says:

    Dr. Spencer,

    Thanks for your reply.

    But I have one further doubt about whether this level of long term variability is a realistic expectation. I understand that the measured short term variability in albedo is consistent with the random variation in albedo that you used in the model, and the 1,000 year integration was done with a 700 meter ocean, which then yields a fairly slow temperature response and fairly long thermal memory. But the real ocean response ought to (I think) consist of a fairly rapid responding (50 – 100 meter?) surface layer, weakly coupled to a very much slower deep layer. Given this type of ocean structure, and assuming that there is a substantial increase in heat loss to space with rising surface temperatures (6 watts per square meter per degree increase), would the real surface temperature response not be very different from what the 1,000 year model with a uniform 700 meter ocean suggests?

  23. Joe Born says:

    Thank you for the your tip on how to get the spreadsheet to show the output your blog post does. (I attempted to submit this as a reply to your reply, but there was no response to my clicking on the “submit” button.)

    Anyway, I infer from the legend in your spreadsheet’s cell F3 (“coeff (0.0 to 2.0)”) that by bumping the coefficient to 30 you’re not using typical real-world values in column F–i.e., in the monthly net-radiation anomaly–and that you’re using that column’s values only as part of a quick-and-dirty way making the spreadsheet you already had give you the variance you postulate in the 30-year average.

    In other words, you aren’t using that model to contend that short-term net-radiation variation of the type you have personally observed will inherently result in the type of long-term temperature variation your blog note (and the better-reasoned historical-temperature-proxy exegeses) show; for this purpose, column F is not part of the model but rather just part of the black box you use to produce the postulated secular variation of column G.

    So you’re making the following modest point. Let’s assume, you say, that–for whatever reason–there is a watt or two per square meter of standard deviation in the thirty-year average net radiation the sea surface experiences. If you then generate a random sequence of monthly net-radiation values (column G) that behaves this way (and–harmlessly–has much less month-to-month variation than is typical), and if you assume that the net energy flow thus assumed goes into (and comes out of) a volume of water equal to that of the oceans’ top 700 meters, then that water’s spatial-average temperature will exhibit behavior of the type your graph shows, your point being that such behavior not unlike what we think we know about the last 1000 years. And this is so even if by additionally providing 6 W/m-K of negative feedback (column M) you damp the water-temperature variation in which the column-G net radiation would otherwise result.

    As I understand it, then: for the purpose of your note, the model is no more complicated than that (the CO2 forcing of its column C is a constant zero, and the non-radiative forcing of its column J has no autocorrelation), and you intend to make no further point than that.

  24. Andrew says:

    Dan Kirk-Davidoff-“Thus, if this model is the null hypothesis, we can confidently reject it as an explanation of the present warming. This would not have been true in, say, 1980: the signal has emerged from the noise.”

    This is like saying, the warming is almost certainly not entirely due to random cloud variations, so none of it can be due to such variations. This does not follow.

    Additionally, if Camp and Tung’s recent paper is like their earlier one, it is not clear at all that they have isolated the signal of solar cycle temperature changes from other factors-their signal was twice as large as several other studies have found, and the forcing associated with the solar cycle is not “known precisely”, if there are indirect effects instead of just TSI which is measured.

  25. OK, gang, I’ve just posted an analysis of the solar cycle data…I get a VERY different result than Tung & Camp:

    http://www.drroyspencer.com/2010/06/low-climate-sensitivity-estimated-from-the-11-year-cycle-in-total-solar-irradiance/

  26. kwik says:

    Dr. Spencer; I’m curious about one thing; Can the oceans store heat for, say, 60 years, and then release it? It seems to me the warmest water must be in the upper layers, and is therefore, it seems, radiated back into the athmosphere with months or so?

    At one point we say it is salinity that makes the water currents descend. And that it is unphysical that warmer water can descend. On the other hand, if enourmos amounts of water is e.g. +4 degrees instead of +3.5 degrees that would represent quite a lot of energy difference, when it rise to the surface again?

  27. kwik says:

    Oh, yes, just to mention it; I understand that this 4 degrees water cannot radiate this heat immediately when it rise again, put the sun would then heat it up again. Its just that it is “pre-heated” 0.5 degrees? Why I mention it? Well, where should the energy otherwise be stored for decades? I read somewhere that some of these currents takes a long time to travel from A to B.

  28. Anonymous says:

    Thanks, Roy for a nice example of how it is possible to have a simple model which displays similar behaviour to observed result by varying the amount of cloud cover – no CO2 required.

    My thought is that climate is the history of past seasons/weather events and is driven by deterministic chaos rather than a random walk. The whole concept of climate ‘forcing’ is not useful when trying to understand how and why climate oscillates. I think the internal/external mechanisms needs to be treated as an integrated dynamic system if real progress is to be made.

  29. (This I submitted a couple of days ago but did not appear–trying a second time)

    Nice post!

    Perhaps you may find some relevance with my articles:

    Koutsoyiannis, D., A toy model of climatic variability with scaling behaviour, Journal of Hydrology, 322, 25–48, 2006. (http://www.itia.ntua.gr/en/docinfo/648/)

    Koutsoyiannis, D., A random walk on water, Hydrology and Earth System Sciences, 14, 585–601, 2010. (http://www.itia.ntua.gr/en/docinfo/923/)

    Some differences are that the “dynamics” I use are “toy” conceptualizations and that I do not use any random perturbation on anything at all–but again the long-term fluctuations are reproduced including the emergence of Hurst-Kolmogorov behaviour.

    Regards,

    Demetris

  30. oracle2world says:

    Not to sound too flippant amongst the scientific analyses … I like warm weather.

  31. […] Millennial Climate Cycles Driven by Random Cloud Variations « Roy Spencer, Ph. D. […]

Leave a Reply