May 2010 UAH Global Temperature Update: +0.53 deg. C.

June 4th, 2010 by Roy W. Spencer, Ph. D.


YR MON GLOBE NH SH TROPICS
2009 1 0.251 0.472 0.030 -0.068
2009 2 0.247 0.564 -0.071 -0.045
2009 3 0.191 0.324 0.058 -0.159
2009 4 0.162 0.316 0.008 0.012
2009 5 0.140 0.161 0.119 -0.059
2009 6 0.043 -0.017 0.103 0.110
2009 7 0.429 0.189 0.668 0.506
2009 8 0.242 0.235 0.248 0.406
2009 9 0.505 0.597 0.413 0.594
2009 10 0.362 0.332 0.393 0.383
2009 11 0.498 0.453 0.543 0.479
2009 12 0.284 0.358 0.211 0.506
2010 1 0.648 0.860 0.436 0.681
2010 2 0.603 0.720 0.486 0.791
2010 3 0.653 0.850 0.455 0.726
2010 4 0.501 0.799 0.203 0.633
2010 5 0.534 0.775 0.293 0.710
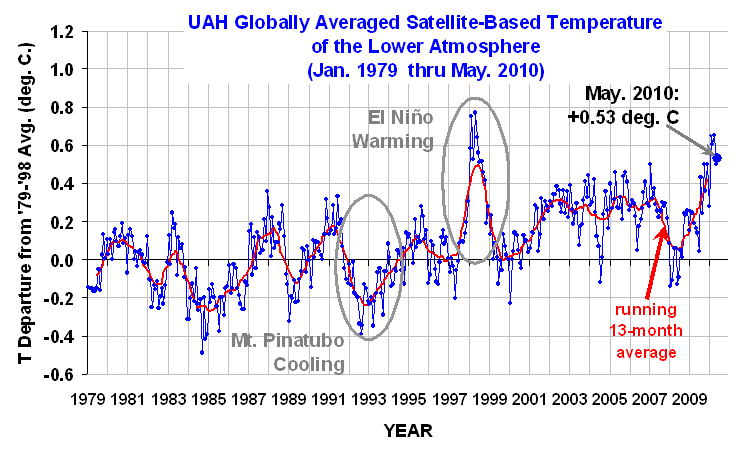
UAH_LT_1979_thru_May_10

The global-average lower tropospheric temperature remains warm: +0.53 deg. C for May, 2010. The linear trend since 1979 is now +0.14 deg. C per decade.Tropics picked up a bit, but SSTs indicate El Nino has ended and we may be headed to La Nina. NOAA issued a La Nina Watch yesterday.

In the race for the hottest calendar year, 1998 still leads with the daily average for 1 Jan to 31 May being +0.65 C in 1998 compared with +0.59 C for 2010. (Note that these are not considered significantly different.) As of 31 May 2010, there have been 151 days in the year. From our calibrated daily data, we find that 1998 was warmer than 2010 on 96 of them.

As a reminder, three months ago we changed to Version 5.3 of our dataset, which accounts for the mismatch between the average seasonal cycle produced by the older MSU and the newer AMSU instruments. This affects the value of the individual monthly departures, but does not affect the year to year variations, and thus the overall trend remains the same as in Version 5.2. ALSO…we have added the NOAA-18 AMSU to the data processing in v5.3, which provides data since June of 2005. The local observation time of NOAA-18 (now close to 2 p.m., ascending node) is similar to that of NASA’s Aqua satellite (about 1:30 p.m.). The temperature anomalies listed above have changed somewhat as a result of adding NOAA-18.

[NOTE: These satellite measurements are not calibrated to surface thermometer data in any way, but instead use on-board redundant precision platinum resistance thermometers (PRTs) carried on the satellite radiometers. The PRT’s are individually calibrated in a laboratory before being installed in the instruments.]


16 Responses to “May 2010 UAH Global Temperature Update: +0.53 deg. C.”

Toggle Trackbacks

  1. […] May UAH Global Temperature – holding steady Posted on June 4, 2010 by Anthony Watts May 2010 UAH Global Temperature Update: +0.53 deg. C. […]

  2. […] June, 2010 (11:31) | Data Comparisons Written by: lucia Roy Spencer posted the UAH anomany for May, 2010: 0.530 C. The visitor with the closest prediction was Robert […]

  3. Charles Wilson says:

    As, IF the big jumps in individual years like 2007 are from El Ninos, 2007″s Ice Loss at minimum was 4000 km3 so 1.8/1.1 (the ONI ratings) implies -6545 km3 …. problem is: last years’ total was 5800 (Piomas) and 2007 October-November (the last Satellite data from Icesat) was 6000 km3.

    That mean a COMPLETE melt-off — except for the land-fast Ice that is 30-feet thick, no doubt: what it means is it will melt off EARLY — early enough for the 24-hour days near the pole to overheat the basin, stop the currents …

    Me, I’d kind of like to figure out if it WILL happen, before I get 300-mph winds destroying Civilization.

    I really look at 3 data Sources:

    1. UaH’s (lt) temps’ N. Polar OCEAN breakout.
    … & that is always late. Can you Speed it?

    2. The Cloudiness … BUT it apparently will be reported in Journal articles AFTER the upcoming Minimum (2007 was Both warm, had winds pushing ice out of the basin AND had 16% less Clouds — since #3 is not verified, it could have NOTHING to do with that year’s El Nino & so the BIG melt off WON’T happen).

    3. Thickness measures: Piomas was at least crudely using Airplane MEASUREMENTS for thickness until Cryosat’s lauch — and we just found Cryosat’s “Quick-Look” feature — has been made SECRET ! — so that ‘scholarly priority of Publication can be preserved — it’ll be published next year.

    Can you light a fire under these people ?
    As part of the “Old NASA bunch” can’t you get an indication of how thickness — and therefore Ice Volume — is going?

    I’d hate to falsely Predict DOOMSDAY.
    I’d hate more to FAIL to predict DOOMSDAY — or Predict it & not be listened to — because Data is being HIDDEN. It’d really Kill me. I mean: really.

  4. S.P. Gass says:

    My work-in-progress model predicted +.296 C for May. I predict June will be a bit warmer before July cools off a wee bit.

    Dr. Spencer (and/or commentators), do you have a “favorite” data set for global temperatures pre-1979 that you recommend? For improving my model, I’m not sure whether I should be using the Global Land-Ocean Temperature Index or the Global Surface Air Temperature Anomaly (meteorological station data) from GISS.

    Thanks and have a great weekend.

  5. […] Tack vare Dr Roy Spencer kan vi nu se temperaturutvecklingen till och med maj 2010. […]

  6. […] May 2010 UAH Global Temperature Update: +0.53 deg. C.   […]

  7. Chad says:

    No warming since ’98, eh?

    But there has been wild, out-of-control warming since ’97 and ’99!

    Two out of three, I win!

    Moral of the story: never get into a cherry-picking contest with someone who owns an orchard.

    Have a nice day!

  8. […] May 2010 UAH Global Temperature Update: +0.53 deg. C. Roy Spencer, Ph. D. The global-average lower tropospheric temperature remains warm: +0.53 deg. C for May, 2010. The […]

  9. […] the warm anomalies persist (e.g. see and see; Fig 7),  the coming months are key to determining which of the two hypotheses with […]

  10. […] May 2010 UAH Global Temperature Update: +0.53 deg. C. Roy Spencer, Ph. D. The global-average lower tropospheric temperature remains warm: +0.53 deg. C for May, 2010. The linear trend since 1979 is now +0.14 deg. C per decade.Tropics picked up a bit, but SSTs indicate El Nino has ended and we may be headed to La Nina. NOAA issued a La Nina Watch yesterday. In the race for the hottest calendar year, 1998 still leads with the daily average for 1 Jan to 31 May being +0.65 C in 1998 compared with +0.59 C for 2010. (Note that these are not considered significantly different.) As of 31 May 2010, there have been 151 days in the year. From our calibrated daily data, we find that 1998 was warmer than 2010 on 96 of them. […]

  11. […] May 2010 UAH Global Temperature Update: +0.53 deg. C. « Roy … […]

  12. kevoka says:

    Dr Spencer,
    Somewhere, (and for teh life of me I cannot find it again) I read that you do not use the surface channel readings from the ASMU due to problems with emissivity issues. Could you be so kind as to direct me to me to it, or provide the answer here?

  13. kevoka says:

    Sorry, meant AMSU, and “the life”.

  14. […] this is the fellow that Limpbaugh considers to by his climatologist. May 2010 UAH Global Temperature Update: +0.53 deg. C. Roy Spencer, Ph. D. The global-average lower tropospheric temperature remains warm: +0.53 deg. C for May, 2010. The […]

  15. […] May 2010 UAH Global Temperature Update: +0.53 deg. C. Roy Spencer, Ph. D. The global-average lower tropospheric temperature remains warm: +0.53 deg. C for May, 2010. The linear trend since 1979 is now +0.14 deg. C per decade.Tropics picked up a bit, but SSTs indicate El Nino has ended and we may be headed to La Nina. NOAA issued a La Nina Watch yesterday. In the race for the hottest calendar year, 1998 still leads with the daily average for 1 Jan to 31 May being +0.65 C in 1998 compared with +0.59 C for 2010. (Note that these are not considered significantly different.) As of 31 May 2010, there have been 151 days in the year. From our calibrated daily data, we find that 1998 was warmer than 2010 on 96 of them. […]

Leave a Reply