Misinterpreting Natural Climate Change as Manmade

May 31st, 2010 by Roy W. Spencer, Ph. D.

The simple climate model I have made publicly available can be used to demonstrate many basic concepts regarding climate change.

Here I will use it to demonstrate that the global warming so commonly blamed on humanity’s greenhouse gas emissions can just as easily be explained as largely natural in origin, most likely due to a natural decrease in global cloud cover.

In general, there are TWO POTENTIAL EXPLANATIONS OF CLIMATE WARMING:
(1) X deg. C warming = anthropogenic CO2 increase + sensitive climate system
(2) X deg. C warming = natural forcing + anthropogenic CO2 increase + insensitive climate system

While I will run the model with an assumed ocean mixing depth of 50 meters of water, the same general effects can be demonstrated with very different depths, say, 10 meters or 500 meters. I have also added some weak natural variability on monthly to yearly time scales to better mimic what happens in the real climate system. You can run the model yourself if you are curious.

While the model is admittedly simple, it does exactly what the most complex computerized climate models must do to simulate global-average warming: (1) conserve energy by increasing temperature in response to an accumulation of energy, and (2) adjust the magnitude of that temperature change through feedbacks (e.g. cloud changes) in the climate system.

CASE 1: Anthropogenic Global Warming in a Sensitive Climate System
In the first example I run the simple forcing-feedback climate model with gradually increasing carbon dioxide causing an extra forcing of 0.25 Watts per sq. meter every ten years, acting upon a very sensitive climate system. “Sensitive” in this case is a net feedback parameter of 1.0 Watt per sq. meter per deg. C, which would correspond to about 3.8 deg. C of warming from a doubling of atmospheric carbon dioxide (2XCO2). (It is expected that we will reach 2XCO2 later in this century.) This amount of warming is on the high side of what the IPCC projects for the future.

The following plot shows 50 years of resulting warming (blue trace) from the model, as well as the radiative imbalance at the top of the model atmosphere (red trace). In this plot, when the radiative balance is negative it means there is an accumulation of energy in the climate system which will then cause subsequent warming.
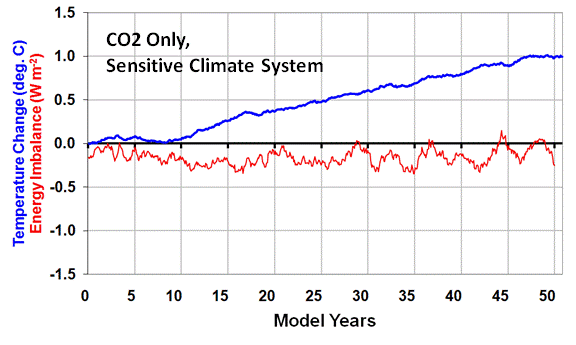
These are the two main sources of information used to diagnose the reasons for global climate variability and climate change. In the real climate system, the warming (blue trace) could be measured by either surface thermometers, or from Earth-orbiting satellites. The red trace (radiative imbalance) is what is measured by satellite instruments (e.g. the CERES instruments on the Terra satellite since 2000, and on the Aqua satellite since 2002).

CASE 2: Natural Global Warming in an Insensitive Climate System
To demonstrate that the same satellite-observed behavior can mostly caused by natural climate change, in the second example I run the simple forcing-feedback climate model with the same amount of CO2 forcing as in CASE 1, but now add to it 1.0 Watt per sq. meter of additional forcing from gradually decreasing cloud cover allowing more sunlight in. This gives a total forcing of 1.25 Watt per sq. meter every ten years.

But now I also change the net feedback to correspond to a very IN-sensitive climate system. “Insensitive” in this case is a net feedback parameter of 6.0 Watts per sq. meter per deg. C, which would correspond to just over 0.5 deg. C of warming from a doubling of atmospheric carbon dioxide (2XCO2). This amount of warming is well below the 1.5 deg. C lower limit the IPCC projects for the future as a result of 2XCO2.
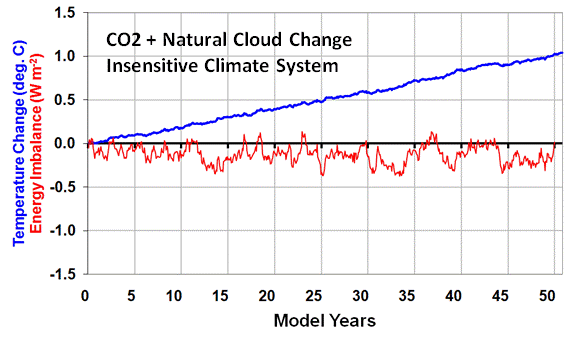
As can be seen in the second plot above, the same rate of warming occurs as in CASE 1, and the radiative imbalance of the Earth remains about the same as in CASE 1 as well.

What this demonstrates is that there is no way to distinguish anthropogenic warming of a sensitive climate system from natural warming within an insensitive climate system, based only upon the two main sources of information we rely on for climate change research: (1) temperature change, and (2) radiative imbalance data collected by satellites.

THE CRITICAL IMPORTANCE OF THIS AMBIGUITY
The reason why this fundamental ambiguity exists is that the radiative imbalance of the Earth as measured by satellites is a combination of forcing AND feedback, and those two processes always act in opposition to one another and can not be easily separated.

For instance, a satellite-measured imbalance of -1 unit can be caused by either -2 units of forcing combined with +1 unit of net feedback, OR by -5 units of forcing combined with +4 units of net feedback. There is no way to know for sure which is happening because cause and effect are intermingled.

After many months of research examining satellite data and the output from 18 of the IPCC climate models, I have found no way to separate this natural “internal radiative forcing” of temperature change from feedback resulting from that temperature change.

So how is it that the “consensus” of climate scientists is that CASE 1 is what is really happening in the climate system? Because when researchers have observed a decrease in cloud cover accompanying warming, they assume that the cloud decrease was CAUSED BY the warming (which would be positive cloud feedback). They do NOT consider the possibility that the cloud decrease was the CAUSE OF the warming.

In other words, they assume causation in only one direction (feedback) is occurring. This then gives the illusion of a sensitive climate system.

In fact, our new research to appear in Journal of Geophysical Research demonstrates that when natural cloud changes cause temperature changes, the presence of negative cloud feedback cannot even be detected. This is because causation in one direction (clouds forcing temperature) almost completely swamps causation in the opposite direction (temperature forcing clouds, which is by definition feedback).

[NOTE: The claims that there are “fingerprints” of anthropogenic warming are not true. The upper-tropospheric “hot spot”; greater warming over land than over the ocean; and greater warming at high latitudes than at low latitudes, are ALL to expected with any source of warming.]

WHEN WILL THEY LEARN?
Based upon my discussions with mainstream climate researchers, I am finding great reluctance on their part to even consider that such a simple error in interpretation could have been made after 20 years of climate research. As a result of this reluctance, most will not listen (or read) long enough to even understand what I am talking about. A few do understand, but they are largely in the “skeptics camp” anyway, and so their opinions are discounted.

When other scientists are asked about our work, they dismiss it without even understanding it. For instance, the last time I testified in congress, Kevin Trenberth countered my testimony with a pronouncement to the effect of “clouds cannot cause climate change“, which is an astoundingly arrogant and uninformed thing for a scientist to say. After all, we find clear evidence of clouds causing year-to-year climate variability in ALL of the IPCC models, so who is to say this cannot occur on decadal — or even centennial — time scales?

CLIMATE CHAOS
I’m often asked, what could cause such cloud changes? Well, we know that there are a myriad of factors other than just temperature that affect cloud formation. The most likely source of long-term cloud changes would be changes in ocean circulation, which can have very long time scales. But then I’m asked, what caused the ocean changes?

Well, what causes chaos? All of this could simply be the characteristics of a nonlinear dynamical “chaotic” climate system. While a few people have objected to my use of the term “chaotic” in this context, I see no reason why the traditional application of chaos theory to small space and time scales (such as in weather) can not be extended to the larger space and time scales involved in climate. Either way, chaos involves complex nonlinear behavior we do not yet understand, very small changes in which can have profound effects on the system later. It seems to me that such behavior can occur on all kinds of space and time scales.

In conclusion…Yes, Virginia, natural climate cycles really can exist.


52 Responses to “Misinterpreting Natural Climate Change as Manmade”

Toggle Trackbacks

  1. Peter Hartley says:

    In the context of your other recent work, including your book, I do not understand this statement:

    “After many months of research examining satellite data and the output from 18 of the IPCC climate models, I have found no way to separate this natural “internal radiative forcing” of temperature change from feedback resulting from that temperature change.”

    I thought your analysis of spirals versus straight line patterns in phase diagram representation of the data did allow yuo to separately identify these two interpretations.

    • As stated above, I have found no way to determine feedback in response to internal RADIATIVE forcing of temperature change (e.g. from cloud fluctuations). But feedbacks CAN be diagnosed in response to NON-radiative forcing, such as variations in the convective flux of heat from the ocean to the atmosphere…IF there is not substantial internal radiative forcing to obscure it. The reasons why are detailed here.

  2. […] Misinterpreting Natural Climate Change &#1072&#1109 Manmade « Roy Spencer … […]

  3. […] Misinterpreting Natural Climate Change as Manmade « Roy Spencer … […]

  4. Jones says:

    “The claims that there are “fingerprints” of anthropogenic warming are not true.”

    What about temperature decrease in the stratosphere? It was told to be the “fingerprint for C02 induced warming” in my university’s climate change course.

    • ) I didn’t include stratospheric cooling as a fingerprint of global warming because, well, it’s cooling. The cooling of the stratosphere in response to more CO2 is more certain since there are no clouds and moist convection there to complicate matters. In the troposphere (where weather occurs), these processes can provide a strong negative feedback upon warming from more CO2. But they can also provide a mechanism for climate change simply through chaotic changes in cloud cover.

  5. Jones says:

    Uups! This was addressed already. My bad.

  6. […] Misinterpreting Natural Climate Change as Manmade « Roy Spencer … […]

  7. […] Misinterpreting Natural Climate Change as Manmade « Roy Spencer … […]

  8. […] Misinterpreting Natural Climate Change as Manmade « Roy Spencer … […]

  9. […] Misinterpreting Natural Climate Change as Manmade « Roy Spencer … […]

  10. […] Misinterpreting Natural Climate Change as Manmade « Roy Spencer … […]

  11. […] Misinterpreting Natural Climate Change as Manmade « Roy Spencer, Ph. D. […]

  12. […] Misinterpreting Natural Climate Change as Manmade « Roy Spencer, Ph. D. […]

  13. […] I ett nytt inlägg på sin blogg demonstrerar Roy Spencer hur den påstått antropogena uppvärmningen kan ha helt naturliga orsaker. Framför allt handlar det om en minskning av molntäcket. […]

  14. […] Misinterpreting Natural Climate Change as Manmade « Roy Spencer, Ph. D. […]

  15. […] Misinterpreting Natural Climate Change &#1072&#1109 Manmade « Roy Spencer … […]

  16. […] Misinterpreting Natural Climate Change as Manmade « Roy Spencer, Ph. D. […]

  17. […] Misinterpreting Natural Climate Change as Manmade « Roy Spencer … […]

  18. […] about the atmosphere and global warming than they ever will so i think his opinions are valid. Misinterpreting Natural Climate Change as Manmade Roy Spencer, Ph. D. __________________ Except For Ending Slavery, Fascism, Nazism and Communism, WAR has Never Solved […]

  19. […] Misinterpreting Natural Climate Change as Manmade « Roy Spencer … […]

  20. […] Misinterpreting Natural Climate Change as Manmade « Roy Spencer … […]

  21. […] Misinterpreting Natural Climate Change as Manmade « Roy Spencer … […]

  22. […] Misinterpreting Natural Climate Change &#1072&#1109 Manmade « Roy Spencer … […]

  23. […] Misinterpreting Natural Climate Change as Manmade « Roy Spencer … […]

  24. […] Misinterpreting Natural Climate Change as Manmade « Roy Spencer … […]

  25. […] Misinterpreting Natural Climate Change as Manmade « Roy Spencer … […]

  26. […] Misinterpreting Natural Climate Change as Manmade « Roy Spencer, Ph. D. […]

  27. Richard Baldwin says:

    This is a more sensible explanation/projection of future climate change than the tipping point proposition of anthroprogenic global warming models. A 6C temperature rise would increase the vapour pressure of water by ~40% and it seems unlikely that this increase would result in decreased cloud cover! This temperature change would also increase long wave radiation by T to the power 4. I can’t see how the climate can be anything other than insensitive.

  28. […] Misinterpreting Natural Climate Change as Manmade « Roy Spencer … […]

  29. […] Misinterpreting Natural Climate Change as Manmade « Roy Spencer … […]

  30. Philip says:

    Dr. Spencer: Your Case 2 run assumes a 1 W/m^2 increase in forcing per decade from gradually decreasing cloud cover, which amounts to 10 W/m^2 over the course of a century. Is it possible to estimate the % change in cloud cover that would be required to cause such a forcing? Might the forcing be caused by a decrease in low cloud and a simultaneous increase in thin high cloud? Is there an upper bound on the amount of forcing that can reasonably be caused by changing cloud cover? Thank you very much.

    • If we assume that about 70 Watts per sq. meter is the global average reflected sunlight off clouds, then a 1 Watt per sq. meter increase in absorbed sunlight could be caused by about a 2% decrease in cloud cover (or decrease in cloud reflectivity). The relationship is not 1:1 because even if cloud cover decreases, a portion of the extra sunlight that reaches the surface will be reflected off the surface anyway…just not as much.

  31. Geoff Larsen says:

    Dr Spencer thanks for opening up your blog for comments. I look forward to the publishing of your paper in the Journal of Geophysical Research.

    Yes, I played around a few weeks ago with your downloaded model like you have done here. This is a nice teaching aid to show the concepts you have espoused. A few questions: –

    1. Regarding your theory that the instances of feedback stripes are correlated with non radiative processes associated with convective heating and cooling over oceans during short term periods where variations in cloud cover are small or non- existent. Do you think it is currently possible, by the collection and analysis of data, to show this correlation? What are the barriers to this? What avenues of research would you suggest?

    2. If this theory is correct is there any reason to believe that unmeasurable, short term feedbacks from “internal” forcing, associated with variation in cloud cover, would be any different, i.e. approx. 6 Watts/sq m./C? And long term (30 years) variations in cloud cover?

    3. Given this, is there any reason to expect that the feedback arising from short term CO2 build up (e.g. 1 year) would also be different? And long term CO2? Isn’t this just the incremental addition of yearly changes?

  32. Matto says:

    “I’m often asked, what could cause such cloud changes? Well, we know that there are a myriad of factors other than just temperature that affect cloud formation.”

    Cosmic Rays? Any opinion on the so-called “CLOUD” project?
    http://en.wikipedia.org/wiki/CLOUD

  33. 1. Yes, in fact it was the existence of “feedback stripes” in the satellite data that led us to use a simple forcing-feedback model to explain them, evidence of which is in the new JGR paper.

    2 & 3. What you bring up is still a major uncertainty: to what extent do the feedbacks on month-to-month time scales apply to longer term climate change? This is not yet known.

  34. Andrew says:

    If we knew the feedback, and the temperature changes, then it would be possible to seperate out the forcing from the radiation data, correct?

    So, what about the idea of estimating the sensitivity, and thus the feedback, but trying to determine the response time of the system? This generally seems to yield fairly low values, but different approaches seem to vary. Lindzen and Giannitsis (1998) found that the response to volcanic eruptions appeared to linger for a very short time, implying a short response time. Schwartz’s revised estimates are much higher, but still towards the lower end of the “consensus” range.

    Also, why have “official” estimates of sensitivity stayed exactly the same for over thirty years? The Charney report (1979) gives the exact same bounds as the IPCC AR4 (2007). Not only has the mean not changed, the uncertainty hasn’t narrowed, which is more remarkable IMAO. Is it because small uncertainty in feedback translates to large uncertainty in sensitivity if you assume the feedback is positive?

    • Good questions!

      I don’t like using the temperature response time as a metric because it is a function of both (1) climate sensitivity (which we don’t know), and (2) the rate at which heat is mixed into the deeper ocean, which is not well known. An error in the assumption for one then translates into an error in the estimation of the other.

      I think the reason why climate sensitivity is no more certain today than 30 years ago is addressed somewhat by our new JGR paper: (1) people have not accounted for internal radiative forcing when estimating feedback, and (2) even if they wanted to, it’s not obvious how to do that!

      All I am reasonable certain of is that climate sensetivity has been overestimated….by just how much, though, is not at all certain.

  35. Andrew says:

    Oh, another thing, in my post here:

    http://devoidofnulls.wordpress.com/2010/05/26/timescales-special-cases-limitations-etc/

    it occurs to me that the idea of feedbacks dependent upon temperature change in a simple, linear manner is erroneous. Considering the case of shutting off the sun, you’d find that shortwave feedbacks cease to matter at all, and the long wave feedback must be strongly positive, because eventually all the water vapor must freeze out of the air, and even colder still CO2 would, and the greenhouse effect would cease to operate, cooling the earth down faster. So the feedback is dependent not just on the temperature change, but the absolute temperature, in the case of the longwave, and the incoming sunlight in the case of the shortwave. Still, within certain bounds of the surface temperature and solar constant, the linearity assumption is probably a good approximation.

  36. Dr. Spencer,

    Regarding the stratosphere, you say that “it´s cooling”. However, looking at your and Dr. Christy´s MSU records for the lower stratosphere, I can´t see any noticeable warming since the mid-90s. Should it not have continued to cool under an increasing GHGs scenario?

    Best regards,

    Mikel

  37. Andrew says:

    Mikel Mariñelarena-The primary cause of the stratospheric cooling in the layer being measured there is ozone depletion, which plateaued in about 1995, coincident with the slow/stop of the stratospheric cooling. The contribution from CO2 is relatively small.

  38. Ooops, typo in my previous post. “noticeable warming” should read “noticeable change”. Andrew, Dr. Spencer: if MSUs don´t measure the temperature of the appropiate stratospheric layers, where else could I find evidence of the stratospheric cooling trend?

    Thanks,

    Mikel

    • I have not followed the stratospheric cooling issue in detail…Andrew is correct that it’s a combination of ozone depletion and CO2 increase…plus, there was a recent paper that stratospheric water vapor has changed, too, which will behave the same way since it is also a greenhouse gas.

      So, I don’t really know whether anyone has figured out whether the stratosphere has cooled as much as expected from more CO2.

  39. Jack says:

    Dr. Spencer,

    I’ve been a fan of yours for awhile now. Thank you for allowing me to thank you for all the work you have done on behalf of climate change science.

    Truly appreciate your honesty,
    Jack

  40. Wagathon says:

    Hello Dr. Spencer:

    Would you be so kind as to amplify on your note, i.e.,

    [NOTE: The claims that there are “fingerprints” of anthropogenic warming are not true. The upper-tropospheric “hot spot”; greater warming over land than over the ocean; and greater warming at high latitudes than at low latitudes, are ALL to expected with any source of warming.]

    Thanks,
    MW

  41. Bob Paglee says:

    Thanks for all your fine studies, Dr. Roy. Please keep fighting in search of the truth.

    Bob

  42. KG says:

    The link to the XLS file to “run the model yourself” is broken

Leave a Reply to Jones