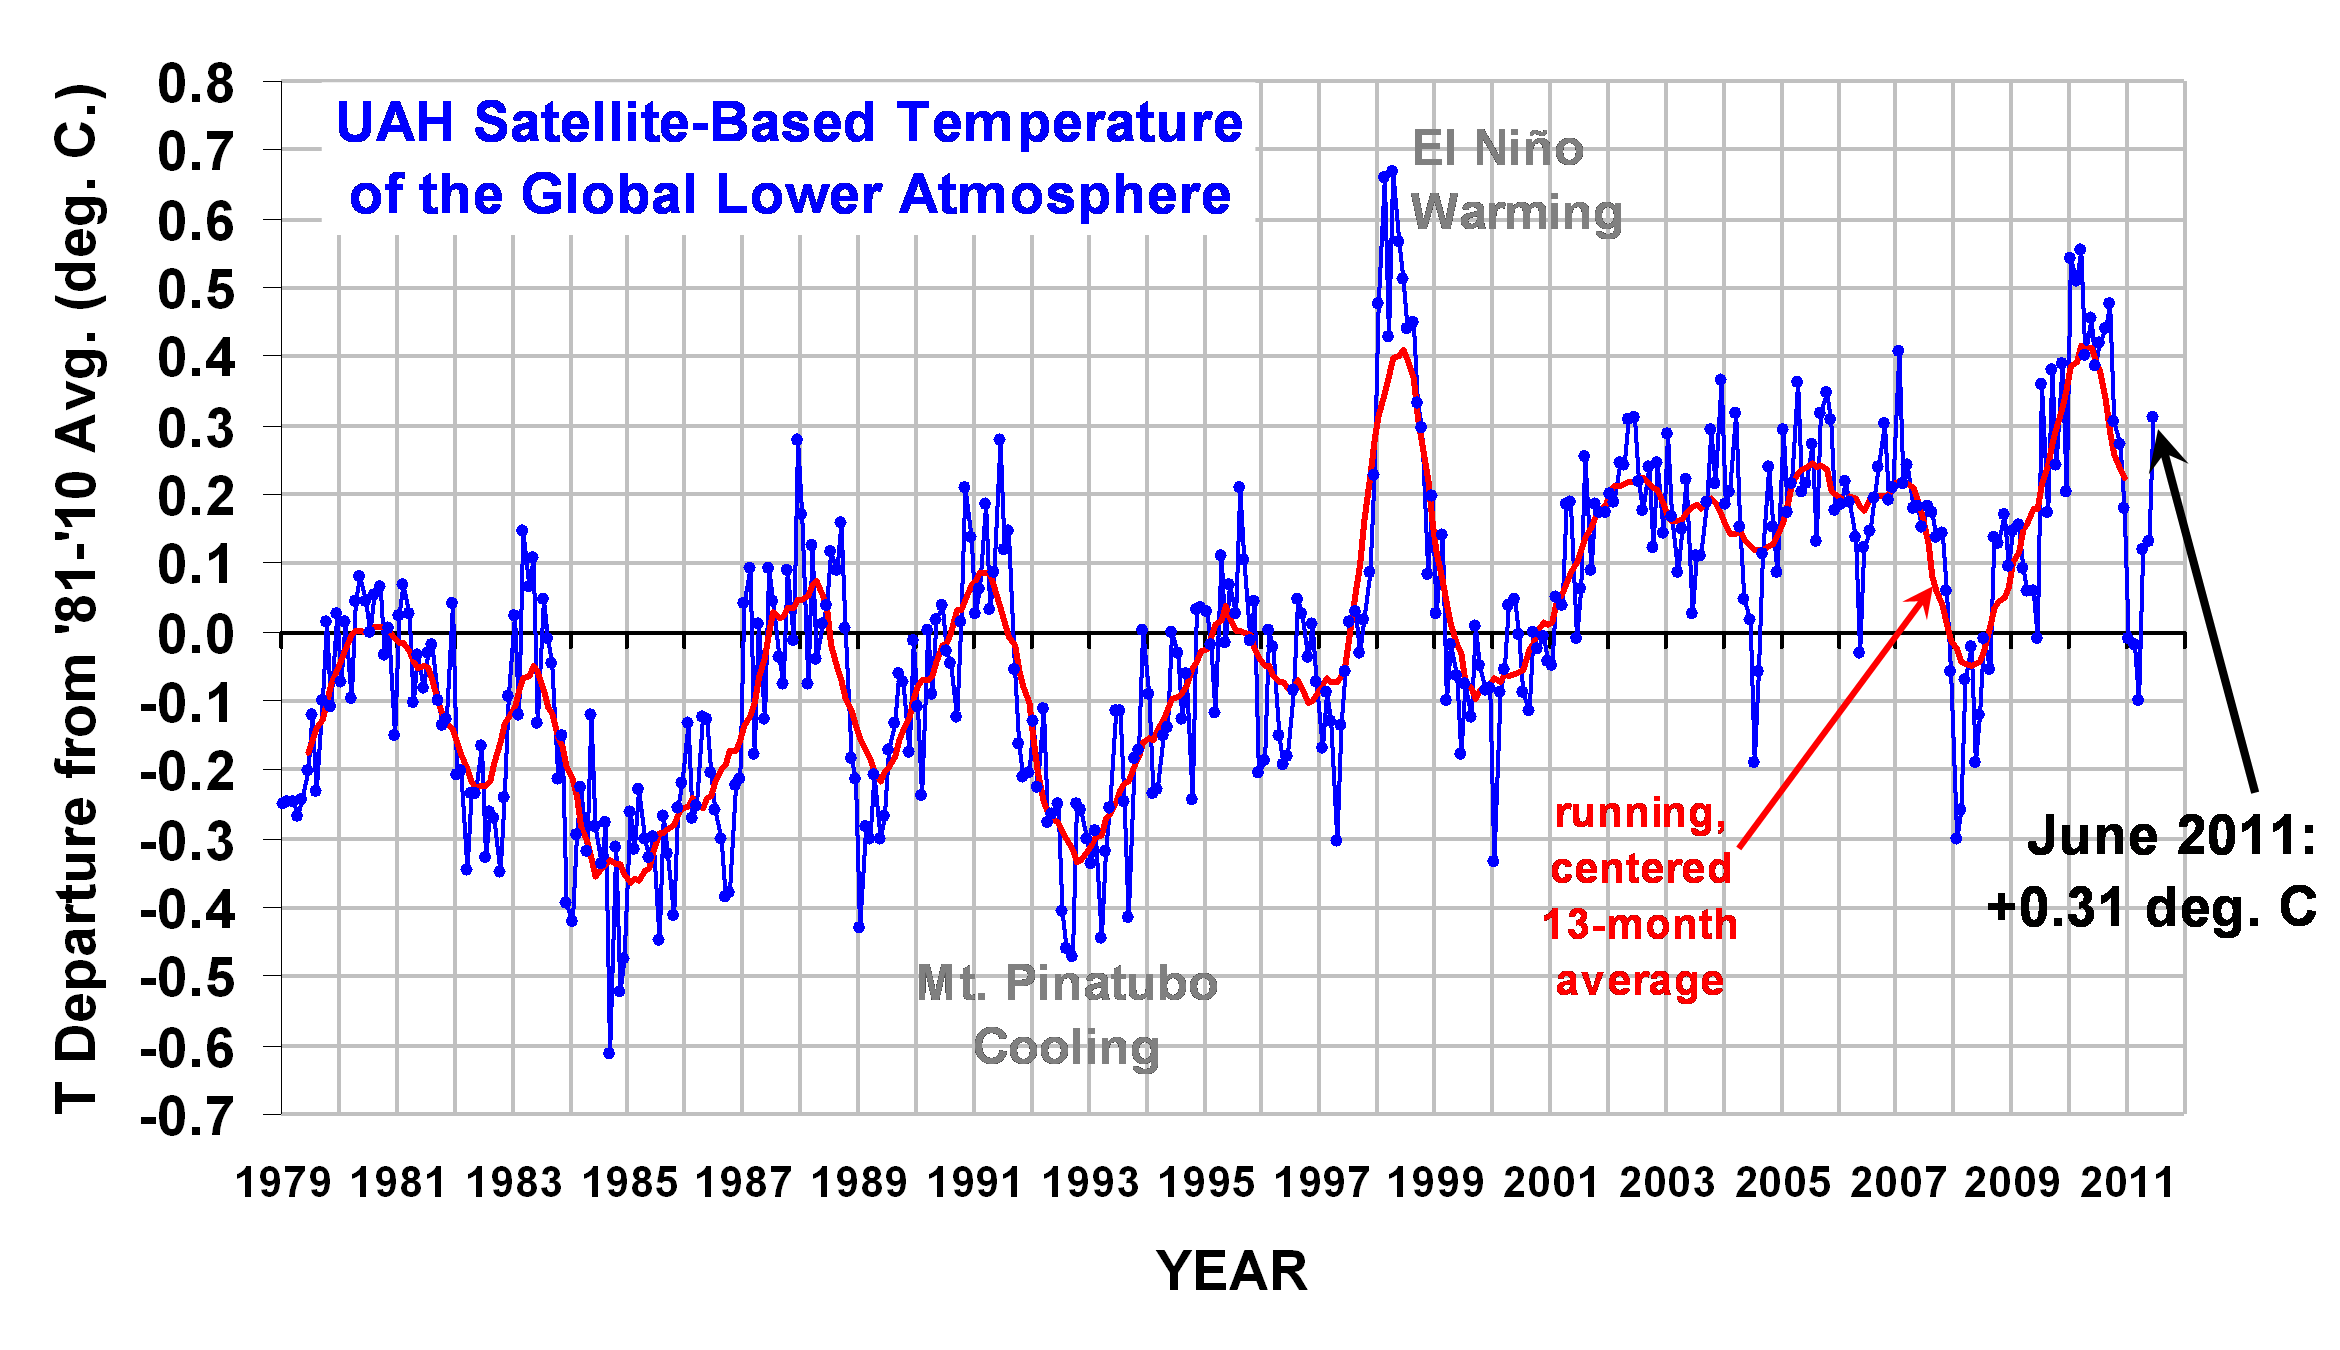
UAH Global Temperature Update for June, 2011: +0.31 deg. C

July 7th, 2011 by Roy W. Spencer, Ph. D.

Post-La Nina Warming Continues
The global average lower tropospheric temperature anomaly for June, 2011 increased to +0.31 deg. C (click on the image for a LARGE version):

The Northern Hemisphere, Southern Hemisphere, and and Tropics all experienced temperature anomaly increases in June:

YR MON GLOBAL NH SH TROPICS
2011 1 -0.010 -0.055 +0.036 -0.372
2011 2 -0.020 -0.042 +0.002 -0.348
2011 3 -0.101 -0.073 -0.128 -0.342
2011 4 +0.117 +0.195 +0.039 -0.229
2011 5 +0.133 +0.145 +0.121 -0.043
2011 6 +0.314 +0.377 +0.251 +0.235

I would like to remind everyone that month-to-month changes in global-average tropospheric temperature have a large influence from fluctuations in the average rate of heat transfer from the ocean to the atmosphere. In other words, they are not of radiative origin (e.g. not from greenhouse gases). El Nino/La Nina is probably the most dramatic example of this kind of activity, but there are also “intraseasonal oscillations” in the ocean-atmosphere energy exchanges occurring on an irregular basis, too.

YEARLY temperature averages probably provide a better indication of the existence of radiative forcings on the climate system (whether warming or cooling). Nevertheless, we must remember that even DECADAL time scale (or longer) changes in the ocean circulation could also be involved, which can cause long-term climate change independent of any kind of greenhouse gas (or cosmic ray-induced) radiative forcing. (That last sentence has not been approved by the IPCC…but I don’t really care.)


18 Responses to “UAH Global Temperature Update for June, 2011: +0.31 deg. C”

Toggle Trackbacks

  1. First I want to say mainstream solar scientist finally admitted, they were wrong about future solar activity today.
    This in contrast to the likes of Piers Corbyn,David Archibald ,Geoffrey Sharp ,to name a few, that have been calling for a prolong solar minimum since 2006 or 2007, and believe strongly in global cooling as a result.

    PREMISE

    The prolong solar minimum causes earth’s AO circulation to become more negative, then it would be otherwise ,due to ozone distribution and concentration changes in the atmosphere as a result in solar UV light changes. This in turn, causes more clouds, and precipitation, and snow cover in the N.H., causing earth’s overall albedo to eventually increase ,and thus lower overall temperatures in the N.H. and redistribute the temperatures.

    The decline in solar irradiance itself , probably only causes minor temperature changes in a given period of time, say on the order of .3 to .4 degrees Fahrenheit.

    Albedo changes in contrast ,can cause a large change in temperature. In fact a 1% change in albedo, causes the temperature to increase or decrease by 2F.

    QUESTIONS:

    1. Does a -AO increase earth’s albedo? If so by how much?

    2. Is a more -AO ,associated with a prolong solar minimum? Past history answers this second question with a yes.

    NOTES:

    1. CO2 has a .1F to maybe a .2F per decade increase in temperature ,without any positive feedbacks. Based in large part, on Beer’s Law.

    Past history suggest no positive feedbacks have materialized as a result of an increase in CO2.

    2. Earth without clouds would have an albedo of 15% in contrast to 31%. Earth’s albedo without clouds and snow cover would probably be about 10%.

    Earth’s average cloud cover is about 59%. This means each 1% change in cloud cover, equates to a .3% change in earth’s albedo.

    3. With the sun setting the tables, by how much will an increase in cloud cover,precipitation,snow cover,SO2 ,via a more negative AO/NAO,increase of cosmic rays,a more positive SOI,a cold PDO/AMO,an increase in volcanic activity, increase earth’s albedo?

    4. Volcanic activity, thru an increase in SO2 causes more incoming sunlight to be reflected back into space,lowering earth’s temperature. Same principle as albedo.
    Does an increase in volcanic activity , equate to a prolong solar minimum with spurts of activity from time to time? Past history suggest it does.

    SUMMARY

    In summary,a prolong solar minimum provides evidence that it can have an effect on earth’s albedo, thru causing more clouds,greater snow cover,increase in SO2, and greater precipitation, due to the items that control the climate mentioned in NOTE 3, phasing into a cold mode, which results in the above. Degree of magnitude and the duration of the phase in being very important, to the evenual result.

    Finally this decade based on this discussion , I believe will be one of low solar activity,with that result being colder temperatures and an increase in geological activity. This is going to be a decade to remember!

  2. SOURCES FOR SOLAR/CLIMATE/ALBEDO RELATIONSHIPS/ PART TWO

    Source 1 – Solar Radiation On Earth- Shows temperature changes for each percentage change of albedo,when plugged into a temperature/albedo/solar brightness interchange ,provided at the site. Very cool.

    Source 1B- Another source gives a change of .5c for each 1.5% change in earth’s albedo. Less
    but still very significant.

    Source 2- A solar (irradiance) trigger for millennial scale abrupt changes in the southwest
    monsoon. By Matthe J. Higginson and others.
    It explains how solar irradiance can modulate the SOI index,which in turn can
    influence the intensity of the Asian, winter/summer monsoon. TBO .

    Source 3 – Paper by the good Dr. Mann, on the evidence of a mostly -AO during the
    Maunder Minimum.

    Source 4- Rhodes Fairbridge, and the idea that the solar system regulates earth’s
    climatic system.

    PART TWO
    EARTH’S MAGNETIC FIELD /OCEAN HEAT CONTENT

    Earth’s magnetic field is weakening and the N. magnetic field is moving fast at 40 miles per
    year. This will allow for more cosmic rays to enter earth’s atmosphere,especially near the
    equator ,which could result in more clouds especially in the lower latitudes. This could have
    a big impact on earth’s albedo due to the fact an increase in clouds in lower latitudes in contrast to higher latitudes will have a much bigger impact on earth’s albedo ,due to the lack of snow/ice cover in the lower latitudes.

    A weakening of earth’s magnetic field /prolong solar minimum seem to equate to rapid past cooling events. Moon is also modulationg the solar wind.
    What happens when spurts of activity occur within a prolong solar minimum with a very weak earth magnetic field? I say it aids in increase geological activity as the impacts from charged particles from the sun are greater due to earth’s reduced magnetic field. Result is a bigger jolt to earth.

    Ocean heat content seems to be following the strength of solar activity. Strong sun to 2005, ocean heat content up, lower solar activity since 2005, ocean heat content coming down.

    SUMMARY/CONCLUSIONS

    Any one that is focused on internal forces on earth as a cause of climate change ,and geological activity is 100% WRONG. It is EXTERNALLY driven,which in turn effects the internal
    drivers on earth, that influence the climate/geological activity.
    The data I have presented makes a very strong case for global cooling this decade and beyond.

    NOTE 1- Milankovich cycles (tilt of earth,precession ,and orbital parameters) aid to climate change when in play making it even more dramatic.

    NOTE2- Distance of the sun from the earth can vary up to 1% as the sun orbits about it’s
    Berycentre. Not to mention it’s regular orbit of winter perihelion and summer aphelion.

    SOURCE

    Robert Felix -Magnetic reversals and their implications to earth’s climate.

    ICEAGE.COM WEB-SITE.

  3. SOURCES :Possible correlation between solar and volcanic activity in a long term scale. JAROSLAV STRESTIK

    Sun wakes volcanoes up,Jupiter makes them sleep. ANTON YEN SEEV

    Sun’s activity linked to largest Earthquakes and Volcanic Eruptions -JOHN CASEY

  4. lui says:

    You are right and know what you think.
    This blog is great, great photography and attitude. you would like it.
    https://youngprotester.wordpress.com/
    Young revolution.

  5. Wagathon says:

    Global warming is not caused by too much CO2; it is caused by too little Ice Age.

  6. Roy: thanks as always for your dedication and hard work in producing the monthly anomalies for us.

    “Nevertheless, we must remember that even DECADAL time scale (or longer) changes in the ocean circulation could also be involved, which can cause long-term climate change independent of any kind of greenhouse gas (or cosmic ray-induced) radiative forcing. ”

    I think the multidecadal changes on ocean circulation will eventually be understodd to be a function of varying solar activity and the concomitant effects it has on albedo. Not only by mechanisms such as the proposed Svensmark effect, but also by the changes to upper atmosphere humidity which I have discovered correlate with solar variation.

  7. Tilo Reber says:

    Roy,

    I’m having trouble figuring out why the temperature trend for UAH and RSS are now diverging.

    I had charted UAH, RSS, and HadCrut3 from 1998 through 2009 – twelve years. I did this in Jan of 2010. At that time the slop of RSS was -0.048C per decade. The slope of UAH was -0.024C per decade, and the slope of HadCrut3 was -0.0012 per decade.

    Lately I plotted the same data set from 1998 to the present. Now, the slope of RSS is -0.036C per decade. The slope of UAH is +0.048C per decade. And the slope of HadCrut3 is +0.0024C per decade.

    So, over a period of 17 months the slope of HadCrut3 changed very little – about +0.0036C per decade. The slope of RSS also changed very little – about +0.012C per decade. But the slope of UAH changed quite a bit over that 17 months – about +0.072C per decade. So the UAH positive change in slope is about 20 times that of HadCrut3 and 6 times that of RSS.

    I understand that UAH went to a new baseline since my earlier data set, but that should not change the slope of the temperature trend. Do you know why RSS and UAH are now diverging so strongly?

    Thanks
    Tilo

  8. kuhnkat says:

    Tilo,

    wouldn’t the change to the Aqua satellite that does not have the drift with respect to path and time of equator crossing cause a small divergence?? I believe adjusting for this drift has always been an issue as RSS and UAH handled it differently.

  9. Paul K2 says:

    Pretty impressive warming in June for the tail end of a La Nina.

    June 2011 comes in only behind the big El Nino year June 1998, the moderate El Nino year 2010, and within a whisker of tying June 2002 in the list of hottest Junes in the database. What will happen to the UAH anomalies in the next big El Nino? Fortunately, it appears we won’t get an El Nino next winter, so we may escape the pain for another year.

    One by one, the nails are being driven into the coffin lid of the lukewarmers.

    • Scott says:

      So the UAH and RSS trends are ~0.14 C/decade. For 32 years, that’s about 0.45 C of warming. During that time, CO2 concentrations increased from ~334 to ~390, right? By my calculation, that implies a climate sensitivity of 2 C/doubling, which is at the low end of the IPCC range (which is 2-4.5 C/doubling, right?).

      Also, IIRC, if one compensates for the eruptions of El Chicon and Mt Pinatubo (now both in the first half of the data series), the trend drops to ~0.1 C/decade, implying a climate sensitivity of ~1.4 C/doubling.

      So how does one month’s relatively high value put a nail in the lukewarmers’ coffin? Don’t the above value line up well with their viewpoints? I think there may be differences with transient vs. equilibrium sensitivities, but I fail to see how this month is so bad for the lukewarmers. Full-blown skeptics might be another story though. 😉

      Please let me know if I’m missing something.

      -Scott

  10. Ray says:

    My earlier estimate of the UAH anomaly for June, of about 0.2c, turned out to be far too low. It was based on the formula y = 0.9109x +0.0689, derived from the previous AQUA CH5 and UAH anomalies for 2003-2010.
    In fact, the final CH5 anomaly was 0.159, so the final UAH estimate based on the above formula was 0.214, so the actual figure was 0.1 degrees higher than that.
    This is most unusual, and the previous highest difference between the figure predicted by the formula and the actual was 0.058, for June 2009.
    This follows a similar pattern of higher than estimated UAH figures using a similar technique for April (+0.085) and May (+0.091), although estimates for earlier in the year were closer. In most cases this year, an estimate based on the PEAK CH5 anomaly, rather than the monthly average, would have produced more accurate results.
    Has anyone any suggestions for why there have recently been such large discrepancies between UAH estimates based on AQUA CH5 anomalies and the actual UAH figure?
    It doesn’t seem to be related to actual sizes of the anomalies, since the estimate for June 2010 would have been very accurate, based on the above formula.

    • Scott says:

      Ray,

      First first guess would be that other altitudes are giving a considerably different result than Ch5, and because the anomaly isn’t purely based on Ch5’s altitude, the result is different than expected.

      But I’m a complete layman. Roy would obviously be able to provide a much better answer.

      -Scott

  11. Ray says:

    Scott,
    Thanks, I suppose that must be part of the answer.
    I can’t expect a figure from a single altitude to replicate the whole UAH perfectly.
    Now can you tell me how you can reply to other posts?
    When I try, I get an error message asking me to enter my name and e-mail, but they are already there.

    • Scott says:

      Hi Roy,

      I’ve had that same problem in the past. I don’t know what caused it or what is different now. I’m using a Mac with Safari right now. It’s possible that I used my Windows XP machine with Internet Explorer when I had that problem in the past…but there’s also a 50% chance that it was this same Mac with Safari as well. :-\

      Sorry to not be of any help,

      -Scott

  12. Ray says:

    Scott, thanks.
    I am currently using W7 and IE8, so I may try a different browser and see if it makes any difference.

  13. Dragontide says:

    7th warmest June on record according to NOAA

    June 2011 was the 316th consecutive month that the world temperature has been above average.

    The January thru June period was the 11th warmest on record.

    Is 2011 going to break the top ten? That would be incredible, considering the The strong La-Nina we just had. (ENSO is currently neutral)

    Data obtained from NOAA’s “State of the Climate” report.

  14. Daniel says:

    Dr Spencer,

    If GCM models underestimate OLR radiations from Atmosphere to space, would this contribute to explaining Dr Trenberth’s famous ‘missing heat’ ?

Leave a Reply