UAH Global Temperature Update for May 2012: +0.29°C

June 4th, 2012 by Roy W. Spencer, Ph. D.

The global average lower tropospheric temperature anomaly for May 2012 (+0.29 °C) changed little from April (+0.30 °C), with some warming to near-average temperatures in the tropics being balanced by a little cooling in the Southern Hemisphere (click on the image for the full-size version):
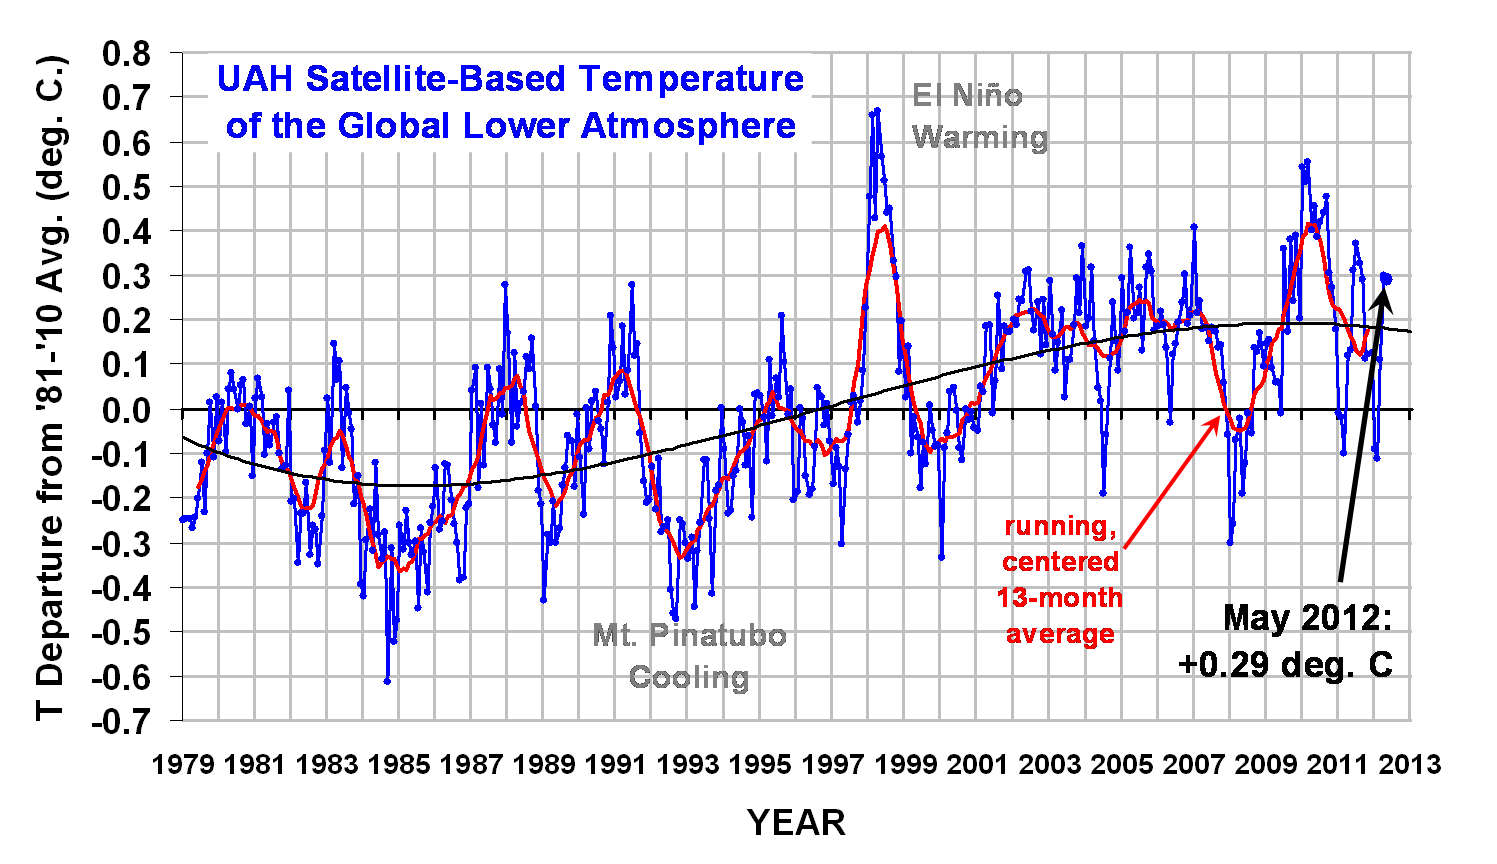
The 4th order polynomial fit to the data (courtesy of Excel) is for entertainment purposes only, and should not be construed as having any predictive value whatsoever.

Here are the monthly stats:

YR MON GLOBAL NH SH TROPICS
2011 01 -0.010 -0.055 +0.036 -0.372
2011 02 -0.020 -0.042 +0.002 -0.348
2011 03 -0.101 -0.073 -0.128 -0.342
2011 04 +0.117 +0.195 +0.039 -0.229
2011 05 +0.133 +0.145 +0.121 -0.043
2011 06 +0.315 +0.379 +0.250 +0.233
2011 07 +0.374 +0.344 +0.404 +0.204
2011 08 +0.327 +0.321 +0.332 +0.155
2011 09 +0.289 +0.304 +0.274 +0.178
2011 10 +0.116 +0.169 +0.062 -0.054
2011 11 +0.123 +0.075 +0.170 +0.024
2011 12 +0.126 +0.197 +0.055 +0.041
2012 1 -0.089 -0.058 -0.120 -0.137
2012 2 -0.111 -0.014 -0.209 -0.276
2012 3 +0.111 +0.129 +0.094 -0.106
2012 4 +0.299 +0.413 +0.185 -0.117
2012 5 +0.289 +0.439 +0.139 +0.033

As a reminder, the most common reason for large month-to-month swings in global average temperature is small fluctuations in the rate of convective overturning of the troposphere, discussed here.


86 Responses to “UAH Global Temperature Update for May 2012: +0.29°C”

Toggle Trackbacks

  1. Edim says:

    Hello Dr. Spencer, what’s your take on the ENSO development in 2012 and 2013? On the cool side?

  2. The data keeps supporting the fact, that the predictions made by the global warming models just are not happening. Temperatures are failing to rise.

    The sun is in a prolong minimum state, and the effects from this prolong solar minimum will be impacting the climate more and more as this decade proceeds, through indirect and direct effects.

    Direct effects will be from a slight decrease in the solar irradiance itself, while the indirect effects will be atmospheric circulation changes(a more -AO) ,greater volcanic activity, an increase in cosmic rays(more clouds),PDO maintaning a cold phase with the Atlantic to follow. La Nina’s will be much more common going forward.

    Earth’s own magnetic field will also aid in making any solar activity that should arise ,have that much of a greater impact.

    Dr. Spencer ,with many others are not appreciating the fact, that this is the FIRST time, since the 1790-1840 period (DALTON MINIMUM)that the sun is now in a state to impact the climate,by cooling it. Prior to this, the sun was in a state ,that was promoting a warming of the climate.

    In order for this to be fully realized the sun is going to have to maintain values which are close to typical solar minimum values,during the typical 11 year sunspot cycle. This process began in Oct.2005 and should contiune to 2040 or so. The sun, anotherwords till 2040 or so should have readings for the most part around typical solar minimum readings. (ex. solar flux readings around 75)

    The next sunspot cycle ,number 25 will be weaker then this one, which is extremely weak.

    The temperature trend is no better then even for the last several years. I expect that temp. trend to trend down,likely starting late this year. I expect temperatures to be 0 to -.20C below normal by the end of this year.

    The set up for a cooling of the climate is in place and has been in place since late 2005. Everything I can think of is pointing to colder conditions going forward.

    For much more detail ,one should visit the LAYMAN SUNSPOT SITE, which will explain my position in great detail, and will show the theories and reasons behind what I have said. One would have to scroll through the daily reports to come across the various articles ,that explain ,how this may all come about.

    I say past history supports my argument of sun/climate connection.

    I will leave it like that for now.

  3. Dr. Spencer’s argument about small temperature changes, through the convective /latent heat process I agree with.

    The question is, will this process be effected going forward, by changes in the overall atmospheric circulation due to the low solar activity. I say yes, it will.

  4. With the UAH anomaly for May at 0.289, the average for the first five months of the year is (-0.089 -0.111 + 0.111 + 0.299 + 0.289)/5 = 0.0998. If the average stayed this way for the rest of the year, its ranking would be 12th. This compares with the anomaly in 2011 at 0.153 to rank it 9th for that year. (1998 was the warmest at 0.428.)

  5. Harold Pierce Jr says:

    ATTN: Roy

    Can’t you use a constant width font for data tables?

    Your table looks sloppy, and some readers might concluded your a sloppy scientist.

    As they say, “The mark of a professional is close attention to details.” And I add, “They don’t make mistakes”.

    BTW, I don’t buy your claim that the PPRT in the satellite can measure temp to +/- 0.01 deg.

    The manufactor makes these claims, but don’t tell you that this calibration is carried in special room or chamber under very carefully controlled conditions and great effort is undertaken to block anything and everything that might cause erroneous readings, e.g., from stray electical and magnetic fields from electrical systems and from even the human body.

    The satellite orbits the earth on a curved path and passes thu the earth’s magnetic field. This can lead to induced emf’s in the metals and circuity.

    • Jim says:

      Harold,

      You wrote “…some readers might concluded your a sloppy scientist”. Speaking of sloppy. Perhaps “some readers might conclude you’re a sloppy scientist”?

  6. Ray says:

    Harold Pierce Jr says:
    “The satellite orbits the earth on a curved path and passes thu the earth’s magnetic field.”
    I am sure that Dr. Spencer is grateful for that piece of information!

  7. David Appell says:

    This can lead to induced emf’s in the metals and circuity.

    Is there any precedent for this being a problem in sensors? I’d guess that scientists and engineers have been noodling this since Sputnik….

  8. amblin says:

    “I expect temperatures to be 0 to -.20C below normal by the end of this year.”

    I expect the temperatures to go even higher by the end of the year. +0.3C used to be El Nino conditions. +0.3C now at ENSO netural. Higher by the end of the year in El Nino conditions.

  9. James says:

    Werner, do you have to correct for the number of days in the month when computing the yearly anomaly or can you just average each month?

    I tried to correct for the number of days, and I came up with a year-to-date anomaly of +0.10126. January’s anomaly was -0.089, multiplied by 31 days, this is -2.759. February’s anomaly was -0.111, multiplied by 29 days, this is -3.219. March’s anomaly was +0.111, multiplied by 31 days, this is +3.441. April’s anomaly was +0.299, multiplied by 30 days, this is +8.970. May’s anomaly was +0.289, multiplied by 31 days, this is +8.959. The total year-to-date cumulative daily surplus was 15.392. This divided by 152 days, yields a year-to-date anomaly of +0.10126C.

    I’m not sure if Dr. Spencer uses this technique or just averages when computing the annual total. Although the differences should never amount to more than 0.01C in any case.

  10. “Werner, do you have to correct for the number of days in the month when computing the yearly anomaly or can you just average each month?”

    At this point, I just averaged the five months as if they were equal. I know this is not quite correct, but good enough for a temporary value that changes every day. But even if we use my value of 0.0998 or your more accurate value of +0.10126, it does not change the temporary ranking of 12th since 2004 was in 11th place at 0.108 and 1991 was 12th at 0.027.

  11. Harold Pierce Jr says:

    FYI: I am analytical and organic chemist with about 40 years experience with instruments. B.Sc(Hon), UI-UC, 1967; Ph.D., UC Irvine, 1973; 30 years teaching and research at Simon Fraser Univ in Burnaby, BC.

    Google: Harold D. Pierce, Jr.

    Now pay attention everbody.

    It is extremely difficult to measure temperature to 0.1 deg with good accuracy and precision. The special thermometers used in weather stations are designed to measure temperature to 0.1 deg C. However, these must be checked frequently to determine if they have not gone out of calibration.

    Since temperatures are measured to 0.1 deg, all computed values have to be rounded back this value. Yet I often see various computed numbers reported to 0.01 and even 0.001 deg.

    This is just nuts. The really scary thing is that many believe the values have validity and are important. Well, these types numbers of don’t mean anything.

    • James says:

      Harold, wouldn’t the error be less the more stations that are used? If the error in any given station is 0.1C, the error in 1000 stations should effectively be 0, provided that the errors in the individual stations are normally distributed around 0. If the errors are normally distributed, a large enough sample should effectively contain no error. I’m not sure if this analysis is correct, as I’ve never taken a statistics course. But this seems intuitive to me. Am I wrong?

    • John says:

      Harold,

      Good Point. It should be remembered global satellite temperature data may have conversion error/precision issues as well since apparently neither the UAH nor the RSS satellite monitors measure temperature directly anyways.

  12. Brian D says:

    My 0.22-0.26 guess was a little low for the month. Well, better luck next time.

  13. David Appell says:

    Direct effects will be from a slight decrease in the solar irradiance itself

    To first-order, dT/T = (1/4)(dS/S), where T is surface temperature and S is solar irradiance.

    Since 1900, S has increased from an annual average of about 1360.6 W/m2 to 1361.2 W/m2:
    http://lasp.colorado.edu/sorce/tsi_data/TSI_TIM_Reconstruction.txt

    With T=287 K, that gives dT < 0.1 K.

    So how much do you expect S to change, and what dT will that provide? I don't see how it can be much at all.

    while the indirect effects will be…greater volcanic activity

    Interesting. On what basis are you predicting greater volcanic activity?

    • John says:

      Hi David,

      The attached web-site you provided apparently boasts solar irradiance information as far back as the 1600’s. If so, how was the information obtained? Who made such measurements at that time? Perhaps, I misread your post, please let me know.
      Thanks.

  14. David Appell says:

    …an increase in cosmic rays(more clouds)

    Also interesting. On what basis are you predicting more cosmic rays?

    And why do you consider the Svensmark hypothesis proven? This is what the CERN CLOUD scientists wrote in their August 2011 press briefing:

    “This result leaves open the possibility that cosmic rays could also influence climate. However, it is premature to conclude that cosmic rays have a significant influence on climate until the additional nucleating vapours have been identified, their ion enhancement measured, and the ultimate effects on clouds have been confirmed.”

  15. David Appell says:

    Harold Pierce Jr says:
    Since temperatures are measured to 0.1 deg, all computed values have to be rounded back this value. Yet I often see various computed numbers reported to 0.01 and even 0.001 deg.

    This is just nuts.

    Harold: OK, you have my attention.

    But have you looked into the UAH methodology, into their papers over the last 20 years, and found where they might be going astray, in your opinion?

    It’s one thing to make blanket statements that sound informed and reasonable. But my impression is that the UAH and RSS teams have done an enormous amount of probably-maddening work over that time to get their adjustments right.

    So I would be interested to know if you have done this (write here, or write me via http://www.davidappell.com).

  16. 2012 in perspective so far

    With the UAH anomaly for May at 0.289, the average for the first five months of the year is (-0.089 -0.111 + 0.111 + 0.299 + 0.289)/5 = 0.0998. If the average stayed this way for the rest of the year, its ranking would be 12th. This compares with the anomaly in 2011 at 0.153 to rank it 9th for that year. (1998 was the warmest at 0.428.)

    With the RSS anomaly for April at 0.333, the average for the first third of the year is (-0.058 -0.12 + 0.074 + 0.333)/4 = 0.05725. If the average stayed this way for the rest of the year, its ranking would be 21st. This compares with the anomaly in 2011 at 0.147 to rank it 12th for that year. (1998 was the warmest at 0.55.)

    With the GISS anomaly for April at 0.56, the average for the first third of the year is (0.34 + 0.39 + 0.46 + 0.56)/4 = 0.4375. If the average stayed this way for the rest of the year, its ranking would be 13th. This compares with the anomaly in 2011 at 0.514 to rank it 9th for that year. (2010 was the warmest at 0.63.)

    With the Hadcrut3 anomaly for March at 0.305, the average for the first three months of the year is 0.239. If the average stayed this way for the rest of the year, its ranking would be 18th. This compares with the anomaly in 2011 at 0.34 to rank it 12th for that year. (1998 was the warmest at 0.548.)

    With the sea surface anomaly for March at 0.242, the average for the first three months of the year is 0.225. If the average stayed this way for the rest of the year, its ranking would be 14th. This compares with the anomaly in 2011 at 0.273 to rank it 12th for that year. (1998 was the warmest at 0.451.)

    So on all five of the above data sets, for their latest anomaly average, the 2012 average is colder than their 2011 average value.

    On all data sets, the different times for a slope that is flat for all practical purposes range from 10 years and 8 months to 15 years and 6 months. Following is the longest period of time (above 10 years) where each of the data sets is more or less flat. (For any positive slope, the exponent is no larger than 10^-5, except UAH which was 0.00103655 per year or 0.10/century, so while it is not significant, it could be questioned whether it can be considered to be flat.)

    1. RSS: since November 1996 or 15 years, 6 months (goes to April)
    2. HadCrut3: since January 1997 or 15 years, 3 months (goes to March)
    3. GISS: since March 2001 or 11 years, 2 months (goes to April)
    4. UAH: since October 2001 or 10 years, 8 months (goes to May)
    5. Combination of the above 4: since October 2000 or 11 years, 6 months (goes to March)
    6. Sea surface temperatures: since January 1997 or 15 years, 3 months (goes to March)
    7. Hadcrut4: since December 2000 or 11 years, 5 months (goes to April using GISS. See below.)

    See the graph below to show it all for #1 to #6.

    http://www.woodfortrees.org/plot/hadcrut3gl/from:1997/trend/plot/gistemp/from:2001.16/trend/plot/rss/from:1996.83/trend/plot/wti/from:2000.75/trend/plot/hadsst2gl/from:1997/trend/plot/uah/from:2001.75/trend

    For #7: Hadcrut4 only goes to December 2010 so what I did was get the slope of GISS from December 2000 to the end of December 2010. Then I got the slope of GISS from December 2000 to the present. The DIFFERENCE in slope was that the slope was 0.005 lower for the total period. The positive slope for Hadcrut4 was 0.004 from December 2000. So IF Hadcrut4 were totally up to date, and IF it then were to trend like GISS, I conclude it would show no slope for at least 11 years and 5 months going back to December 2000. (By the way, doing the same thing with Hadcrut3 gives the same end result, but GISS comes out much sooner each month.) See:

    http://www.woodfortrees.org/plot/hadcrut4gl/from:2000/to/plot/hadcrut4gl/from:2000.9/trend/plot/gistemp/from:2000/plot/gistemp/from:2000.9/to:2011/trend/plot/gistemp/from:2000.9/trend

  17. David Appell says:

    Werner: Beware of substituting spreadsheets for thinking.

  18. Ray says:

    Werner, I think that the flaw in your argument is the assumption that average temperatures for the remainder of the year will remain the same as those for the first 3-5 months.
    We do not yet have May anomalies for RSS, HadCRUT3 or GISS, but given the UAH anomaly figure, they are likely to be only slightly lower than those for April.
    Your figures for HadCRUT3 only go to March, but we already have the April figure, which was 0.48c, and the May figure is likely to be at least 0.4c, making the average to May about 0.32c.
    Since it seems unlikely that temperatures for the remainder of the year will fall again to those experienced in January & February, a more realistic approach might be to assume that anomalies for the remainder of the year will be similar to those in March to May.

  19. Ray says:

    Sorry, the correct figure for the April HadCRUT3 anomaly should have been 0.482c, not that 0.002c makes much difference, and it will probably be revised this month anyway.
    I should add that I think such excercises at this point in the year are a bit of a waste of time. Let’s wait until at least November before guessing the final outcome!

  20. tm says:

    I’m waiting for consensus among the cranks.

  21. Thank you for your comments David and Ray. I am under no illusions that things will stay this way until the end of the year. I know they will not. I am just giving the facts as they are now, something like getting first period results of a hockey game in progress at the present time. As for the April Hadcrut3 value, I am aware of it, but it is not showing up here: http://www.cru.uea.ac.uk/cru/data/temperature/hadcrut3gl.txt
    So it is not on WFT yet. Also, the hadsst2 only goes to March so far. Should the Hadcrut3 value average 0.32 after the May numbers, it would still be cooler than the 0.34 average for 2011, so we will have to wait and see.

    “a more realistic approach might be to assume that anomalies for the remainder of the year will be similar to those in March to May”

    I agree. And should this be the case, we will not set any new record on any data set.

    “I should add that I think such exercises at this point in the year are a bit of a waste of time.”

    Perhaps, but I am a retired physics teacher having a bit of fun with new “toys” like WFT. (I went through university with a slide rule.)

    • Tinman says:

      Werner,

      I am glad you are enjoying your new tools. I don’t have
      to wait for WFT and can do regression myself. I can plot
      the linear regression index as a function of start date and see just how much you are cherry picking your regression intervals. I could send you my code if you want. It runs on Matlab or a free version like Octave.

      If one does multiple regression with the ENSO ONI index, time, and temperature, the results are much more satisfying than a linear regression based only on time and temperature since the major oscillation in the temperature signal is ENSO. Using a 6 month lag on ENSO, the regression is very highly correlated (except when there is a major eruption). The coefficient from time is also very close to the current 30 year linear trend and does not vary so much in time. I know you ignore all advice to do something more statistically significant than linear regression on hand picked intervals, but since we have ENSO prediction from NOAA which are pretty reliable 6 to 9 months out, one can easily get a good prediction of what the rest of your “hockey game” will look like.

      The “bad” news for you is that the ENSO models are showing El Nino developing this Fall. It is not certain how strong it will be, but even a weak El Nino will seriously hamper your ability to find your “flat” regression estimates by cherry picking start dates. The recent double dip La Nina following up on a longish El Nino period allows you to find your flat lines, but once the La Nina moves away from the end of the observation period, it affects the slope of a regression line less. For example, if we get an El Nino similar to 2010, the 10 year simple regression coefficient will be back over .1/Decade and the best cherry picking possible will be a small dip down to about 0.06.

  22. mike maguire says:

    Werner,
    Appreciate you having fun and being opened minded.
    Here’s a great link to provide additional insight regarding one of the most powerful influences on global temps(on a scale of months to a couple of years).

    If one were attempting to predict delta T the rest of this year, expectations for ENSO conditions would be most relevant since we know that La Nina’s cause global temps to go down and El Nino’s-up.

    “ENSO Cycle: Recent Evolution, Current Status and Predictions”

    http://www.cpc.ncep.noaa.gov/products/analysis_monitoring/lanina/enso_evolution-status-fcsts-web.pdf

    Models are somewhat reliable predicting this value several months out. At this time, there is a split between a forecast for neutral and that of weak El Nino status.
    Both have just over a 40% probability.

    The probability of another weak La Nina is just over 10%.

    We are currently neutral with values having come from a La Nina(cooling earlier this year).

    My interpretation is that though we have a 40% chance of an El Nino by this Autumn(equal to the neutral probability), the edge goes to El Nino because the forecast shows an increasing trend in that direction the next several months.

    So, odds would slightly favor(low confidence) the Jun-Dec period for global temps receiving a small warming contribution vs May from the ENSO and with high confidence that it will contribute warming vs conditions during the Jan-May period.

    This evaluation is based only on what we know with certainty about ENSO’s effect on global temps.

  23. Robbie says:

    Nice surprise. Not warmer, but more of the same with April.
    Good news so far.
    It could mean climate gets lower and lower sensitive to CO2 increase month by month (year by year) as predicted by the IPCC.

  24. Robbie says:

    Correction: Not as predicted by the IPCC, but IPCC predicted a great sensitivity to CO2 increase. It’s good that the temperature lags that prediction so far, but I am still skeptical.
    The Sun has become less active. I am still hoping for a dramatic cooling to Eighties level, but I don’t think that will ever come.

    • bobgnote says:

      Temperature rise is likely accelerating, note recent trends, to hot years, 1998, 2005, 2010, and now, 2012. Also note the upswing, in warming, since 1950.

      When CO2 went toward 400 ppm, instead of heading down, at the usual Holocene maximum, of 280 ppm, we were likely locked in, to a rise of CO2, all the way to 900-1000 ppm, with out-gassing of CO2, CH4, and water vapor all accumulating, at about 10x PETM levels, to force warming, which will happen faster, than in the PETM extinction.

      Without radical re-greening, little can be done, to forestall Mass Extinction Event 6, already underway.

  25. The SUN ,has only been in this state since OCT. 2005,lag times are substancial, but the stage is being set.

    PAST HISTORY- plot major volcanic eruptions versus solar activity ,one will find almost all of them are asscioated around solar minimums.

    Look at the atmospheric circulation during prolong solar minimums, it is much more meridional in character.

    Look at the PDO phase versus solar activity, cosmic rays versus solar activity ,and you will see there is a connection.

    The sun drives the climate, I think everyone agrees on that, therefore any change in the sun from the amounts of UV light it emits, to the solar irradiance intensity, to the solar wind it generates (the charged particles), must have an impact on the earth’s atmosphere. They interact with the atmosphere, and that must lead to a climate impact ,in some way.

    I don’t see how solar/atmospheric interactions, can’t result in an effect on the climate of the earth. It does not make sense that it would not have an effect,since the sun drives the whole system to begin with.

  26. Ray says:

    Werner, you can usually get the HadCRUT data files from the following UKMO website, before they are available on the CRU site:
    http://www.metoffice.gov.uk/hadobs/index.html
    It can be a bit convoluted, but if you follow the following instructions, you should be able to download, the HadSST2 figures, for example:
    1. Click on HadSST2, under Marine Datasets
    2. Click on Various diagnostics, near the bottom left of the page.
    3. Click on Mean of the northern and southern hemisphere averages.
    4. Scroll down to the monthly series and click on “data file”.
    The file can sometimes be a bit slow and sometimes the page or file doesn’t load, so just keep clicking.

  27. Thank you for your replies Tinman, Mike and Ray. My computer skills are rather weak. I was able to do what Ray suggested, but in the last step, my computer does not seem to have the program to allow me to see the latest monthly temperature. I will just be content to wait for WFT to have the information on file. By the way, the way I knew what the April Hadcrut3 anomaly would be was to go to http://www.climate4you.com/GlobalTemperatures.htm#HadCRUT3%20TempDiagram
    As far as me “cherry picking your regression intervals”, I was just finding the longest time the slope was 0 on the different data sets. And then claiming these along the lines of the MET office saying there has been no warming for 15 years, nothing more and nothing less. I am not claiming any statistical significance to these numbers, but just keeping up with Jones and the MET office in this regard. My statistics is also rather rusty so I will leave that for others who know what they are talking about. My intention was not to make any predictions, but to just say what the ‘score’ is at this point in time. It may well happen that if we have a long and strong El Nino that there will be no flat period above 10 years in a years time on any data set.

  28. Ray says:

    Werner,
    Do you mean that you are seeing the file but not the row with the latest anomaly figure?
    If so, that sometimes happens to me, i.e. my computer (Internet Explorer) seems to refuse to load the latest file. I think it is something to do with the cache. Sometimes it will load the latest NH & SH file but not the file with the global figure. I often have to click the refresh button several times before it suddenly loads the file with the latest figure.
    No doubt someone with greater computer knowledge than myself will explain this.
    I do sometimes refer to the climate4you website but often that does not have the latest HadCRUT3 figure because the MO have been getting later and later with publication.
    I think they still use a runner with a cleft stick to transfer the data.

  29. David Appell says:

    alvatore del prete says:
    Look at the PDO phase versus solar activity, cosmic rays versus solar activity ,and you will see there is a connection.

    Some links to data and graphs would help support your case.

    Sure, cosmic rays are correlated to solar activity, but other than that there has been no trend in them for at least 60 years (as you would seem to need if the Svensmark hypothesis is to explain any warming):

    http://www.realclimate.org/index.php/archives/2011/08/the-cerncloud-results-are-surprisingly-interesting/

    Is Gavin Schmidt wrong on that?

  30. “Ray says:
    June 5, 2012 at 4:42 PM”

    I tried explorer this time and it worked! Thank you very much! Even though I cannot graph it, at least I can update the other parts. Here they are:

    With the Hadcrut3 anomaly for April at 0.482, the average for the first four months of the year is 0.2995. If the average stayed this way for the rest of the year, its ranking would be 14th. This compares with the anomaly in 2011 at 0.34 to rank it 12th for that year. (1998 was the warmest at 0.548.)

    With the sea surface anomaly for April at 0.292, the average for the first four months of the year is 0.242. If the average stayed this way for the rest of the year, its ranking would be 14th. This compares with the anomaly in 2011 at 0.273 to rank it 12th for that year. (1998 was the warmest at 0.451.)

    On a personal note, over two years ago, I was at a conference and the speaker before me said the first two months of 2010 were the warmest ever. But I had recalled reading from Lubos Motl that the 2010 January and February were only the second warmest, which I mentioned when it was my turn to talk. He has all rankings for about the last 30 years for various data sets if you are interested. See http://motls.blogspot.ca/
    Then type UAH under search for example. Interim rankings may not be everyone’s cup of tea, but I like tracking and sharing them.

  31. Alan Smith says:

    I just happened to plot the data above for jan 2011 to may 2012. While the average of the NH and SH is very close to the tabulated Global temperatures I was surprised to find the NH and SH data close to in phase rather than 6 months out of phase. What am I missing?

  32. “Alan Smith says:
    June 6, 2012 at 1:42 AM
    What am I missing?”

    You are plotting anomalies and not temperatures. So while January is much hotter in the southern hemisphere than in the northern hemisphere, you are plotting how this January in the southern hemisphere compares with all other Januarys in the southern hemisphere over the last 34 years.

  33. Ray says:

    Werner,
    I’m glad that you got the file eventually!
    Thanks for the link, but I must admit that I find that website a bit unstructured and chaotic.
    Maybe it’s just a question of getting used to it.

  34. amblin says:

    “The SUN ,has only been in this state since OCT. 2005,lag times are substancial, but the stage is being set.”

    The time lag for the cooling after Pinatubo, which caused a drop in incoming sunlight, was almost immediate.

    “I don’t see how solar/atmospheric interactions, can’t result in an effect on the climate of the earth. It does not make sense that it would not have an effect,since the sun drives the whole system to begin with.”

    Maybe it is having an effect already. Perhaps the solar minimum has caused significant cooling but it’s being countered by an equal warming force.

  35. David Appell says:

    John says (June 6, 2012 at 1:48 PM):
    The attached web-site you provided apparently boasts solar irradiance information as far back as the 1600’s. If so, how was the information obtained? Who made such measurements at that time?

    John, the first line of that data file gives the reference paper.

    • John says:

      David,

      You wrote:

      “John, the first line of that data file gives the reference paper.”

      The first few lines of the claimed “data file” states:

      “TSI Reconstruction from Wang, Lean, Sheeley (ApJ, 2005)
      ; Offset -4.8741 W/m^2 to match SORCE/TIM absolute value
      ; from Kopp & Lean (GRL, 2011)
      ; Extended using SORCE/TIM annual averages from 2003 onward
      ; Computed by Greg Kopp using TIM V.12 on Thu Jan 19 15:07:56 2012”

      The rest of the attachment consists simply of two columns. One column apparently consists of years the other of solar irradiance numbers supposedly correlated to the years adjacent to them. No evidence was provided either by you or the website establishing any factual basis for these numbers at all. How were they derived? Who derived them and when? In fact, to call the website a “data file” seems optimistic. From what appears on the website, their exists no scientific basis for these numbers at all.

      The only explanation that comes to mind for the apparent lack of relevant information contained on your attached web-link may be that my Mac book computer browser somehow lacks compatibility with the website and their exists a great deal of data and source information I’m not receiving. Perhaps you have you can provide it.

      Thanks.

  36. sillyfilly says:

    Don’t worry everybody, the world is COOLING, COOLing, cooling?

    http://www.woodfortrees.org/plot/uah/plot/uah/trend/plot/uah/from:1999/trend

    • Jim says:

      This post and many others miss the point of the discussion. That is, the world has been warming and cooling for millennia. It seems silly to be catty about whether today’s trend is warmer or cooler since that only defines where on the curve we are. And since we don’t know what the curve looks like beyond today, where we are is truly not predictive.

      What needs to be answered is if there is irrefutable evidence of a new player in the forces which cause the changes. If there is irrefutable evidence of a new player, can we mere mortals actually modify its effect? (Proof of this concept is necessary as well.) Thus far, there are no credible answers to either of these questions.

      First though, we must contend with the existential question which should override all the above. Which of we god-like humans has decided that the climate of the 20th – 21st Century AD is the ideal climate for the planet? I would propose that until we know the answer to this last question, most of the other questions constitute “tinkering”.

  37. David Appell says:

    John (June 6, 2012 at 11:48 PM):

    As I wrote, the first line of the data file gives the reference paper: Wang, Lean, Sheeley (ApJ, 2005).

    Have you read it?

  38. David Appell says:

    Jim says:
    What needs to be answered is if there is irrefutable evidence of a new player in the forces which cause the changes. If there is irrefutable evidence of a new player, can we mere mortals actually modify its effect?

    Are you kidding??

    • Jim says:

      Since you (climate commenters) can’t agree on what constitutes normal forcings, I don’t see how you can identify a new player nor the effect of a human intervention – good or bad. Instead of a non-answer like “Are you kidding??”, it would be nice to see the irrefutable evidence to support any position.

      Am I safe in assuming you have concluded that the current climate is the best possible for planet Earth? If that is true (again, some evidence would be nice), we all need to put on our super-hero capes and get to work. But for now, a little less condescension and a little more fact would be nice.

  39. Cornelius says:

    Dr. Spencer,

    Why did you switch from a 3rd order polynomial fit to a 4th order polynomial fit?

    Thanks for your work on this website.

    • Tinman says:

      I think the fit is still a cubic polynomial.
      When I do a quartic fit, the curve looks
      different. In fact, the slope is positive at
      then end, which is not entertaining.

      Moreover, the slope at the right end is positive
      for a linear, quadratic, or quartic fit.
      Which I think answers the question why Roy chose
      a cubic fit.

  40. David Appell says:

    Jim (June 7, 2012 at 3:47 PM)
    Since you (climate commenters) can’t agree on what constitutes normal forcings, I don’t see how you can identify a new player nor the effect of a human intervention – good or bad.

    The most significant forcings are well known; see, for example, the IPCC 4AR WG1 Ch2 FAQ2.1 Fig2
    http://www.ipcc.ch/publications_and_data/ar4/wg1/en/faq-2-1.html

    Am I safe in assuming you have concluded that the current climate is the best possible for planet Earth?

    What do you mean by “best?” Best for whom, and best in what way?

    I don’t know what “best” means. I suppose that humans could probably live in a wide range of climates, given enough time to learn to build the necessary civilization there.

    But living through relatively rapid climate *change* is another matter. That has been problematic in the past, and given the finely tuned system on which so many of us now depend, it could well be problematic in the future. Isn’t that the most relevant question?

  41. Gras Albert says:

    David Appell

    Pre-industrial (PI) CO2ppm was approx 280, by 1960 it had risen to 315, by 1997 360 and currently it stands at 395.

    CO2 increase PI-2012 = 395-280 = 115
    CO2 increase 1997-2012 = 395-360 = 35

    In the last 15 years CO2 has increased by 35ppm, as % of total increase since PI levels

    %CO2 increase PI-2012 = 35/115*100 = 30.4%

    as % of increase since 1997

    %CO2 increase 1997-2012 = 35/360*100 = 9.7%

    The increase in atmospheric CO2 since 1997 is almost 10% of the then total and is more than 30% of the total added since pre-industrial times and yet, according to the mean of HadCrut3, GissTemp, RSS and UAH there has been no statistically significant rise in global mean temperature over the period.

    In the light of this measured data please explain again how climate sensitivity to CO2 forcing is net positive?

  42. David Appell says:

    Gras: Actually GISS does show statistically significant warming since the beginning of 1998: 0.11 +/- 0.07 C/decade (95% C.L.).

    No, the others don’t. Of course, the science doesn’t say that surface temperature increases monotonically with atmospheric CO2 levels — there are many other short-term factors that can cause fluctuations of 0.2-0.3 C, especially ENSOs. And there are aerosols to consider (esp from China), a slight decrease in solar irradiance, etc.

    Foster and Rahmstorf (Env Res Lett 2011) found that when these short-term noises are regressed out there is an underlying trend of 0.14-0.18 C/decade.

    And the oceans are a far better indicator of warming than the 2-dimensional surface. (Strictly speaking, a 2-d surface can’t contain any heat anyway.) The vast majority of the energy imbalance goes into the ocean (its heat capacity is 1000 times the atmosphere’s), and they have been warming steadily for decades:

    http://www.nodc.noaa.gov/OC5/3M_HEAT_CONTENT/

    and, tellingly, sea-level rise is recovering from the recent back-to-back La Ninas and is resuming its past trend:

    http://sealevel.colorado.edu/content/2011rel4-global-mean-sea-level-time-series-seasonal-signals-retained

    http://www.aviso.oceanobs.com/en/news/ocean-indicators/mean-sea-level/index.html

    In short, there is nothing unusual or unexpected about a 10-15 year haitus in surface temperatures in a GHG-warming world. It’s happened recently before this, and it will happen again.

  43. harrywr2 says:

    Gras Albert

    The increase in atmospheric CO2 since 1997 is almost 10% of the then total and is more than 30% of the total added since pre-industrial times and yet

    The direct impact of CO2 according to the laws of physics is logarithmic.

    I.E. 1 PPM to 2 PPM has the same impact as 256PPM to 512PPM….1.2C per doubling.

    If you do all the complicated math then the direct CO2 impact of going from 280 ppm to 380 ppm should be about 0.8C. Going from 380 to 560 ppm adds another 0.4C

    How much water vapor changes and into what form(humidity, low clouds, high clouds,stratospheric water vapor) as a result of a small change in temperature due to changes in CO2 is the main question.

  44. Gras Albert says:

    I see I failed to be clear, I wrote ‘the mean’ of the four datasets, I meant the statistical mean of HADCRUT3VGL, GISSTEMP, RSS and UAH, offset by their baseline differences.

    So I repeat, the mean of the four datasets shows no statistically significant warming while CO2 in the atmosphere has risen significantly.

    The modern warm period, 1970-2000, saw a very similar warming trend as that between 1915-1945, from observations it could be argued that there is nothing unusual or unexpected about an elevated 30 year warming trend in a world which has been warming for 300 years!

    Multiple recent papers including Levitus 2012

    http://www.agu.org/pubs/crossref/pip/2012GL051106.shtml

    confirm that sea level and OHC are NOT rising at a rate which supports net positive climate sensitivity

    If one accepts the IPCC radiative forcing values of anthropogenic radiative forcings of +1.6 (+0.6 to +2.4) Watts per meter squared and/or the solar radiative forcing of +0.12 (+0.06 to +0.30) Watts per meter squared as correct, what the Levitus et al data shows is that the global radiative feedback is negative and this necessarily would include the water vapor, sea ice etc radiative feedbacks. That is global radiative feedback < global radiative forcing!

    I await your answer to my question, please explain again how climate sensitivity to CO2 forcing is net positive when observed CO2 rise of 10% has produced no observed warming?

  45. David Appell says:

    By the way, Gras, the forcing due to CO2 goes as its logarithm, to first order — not linear with its value.

    http://www.esrl.noaa.gov/gmd/aggi/

    So calculating simple percent changes is misleading.

  46. David Appell says:

    Gras Albert wrote:
    I see I failed to be clear, I wrote ‘the mean’ of the four datasets, I meant the statistical mean of HADCRUT3VGL, GISSTEMP, RSS and UAH, offset by their baseline differences.

    Gras, you can’t average these together, since they do not all measure the same things.

    In particular, GISS and HadCRUT measure surface temperature (and, before HadCRUT4, they differed on how they handled the Arctic region). RSS and UAH measure the lower troposphere (and other, higher regions too).

    Averaging them together, even if you adjust the baselines, gives a meaningless number.

  47. David Appell says:

    Gras: If you’re going to quote Roger Pielke Sr., don’t you think you should cite him as your source, instead of passing those words off as your own?

    http://pielkeclimatesci.wordpress.com/2012/04/26/comment-on-levitus-data-on-ocean-forcing-confirms-skeptics-falsifies-ipcc-at-niche-modeling/

    • Gras Albert says:

      Exemplary observation skills, one would hope that as I placed the quote in italics, to differentiate it from my text, it would be obvious… a bit like this comment on Levitus

      The paper by Levitus et al. uses the array of ARGO floats, and other historic ocean measurements, to determine the change in the heat content of the ocean from 0 to 2000m, and so derive the actual net radiative forcing that has caused it to warm over the last 50 years.

      To compare these figures, say the continuous top-of-atmosphere forcing is 1Wm-2, a figure given by Meehl and Hansen and consistent with the IPCC estimates. The forcing of the ocean from a TOA forcing of 1Wm-2 is a lower 0.6m-2 due to losses, estimated by Hansen.

      The best, recent measurements of the forcing 0f 0.3Wm-2 are half these IPCC estimates. The anthropogenic component of the forcing is even less, as a large part of the 0.3Wm-2 in the last 60 years is due to increased solar insolation during the Grand Solar Maximum.

      This mild forcing is right in the ballpark that skeptic scientists such as Lindzen, Spencer, Loehle and Idso (and myself) have been consistently saying is all that is justified by the evidence. It appears that Levitus et al. confirms the skeptics, and the IPCC has been falsified.

      but just to make sure I’ve added the cite

      http://landshape.org/enm/levitus-data-on-ocean-forcing-confirms-skeptics-falsifies-ipcc/

      You have avoided answering my question for a second time by use of hand waving, I remain disappointed but unsurprised. Please explain how climate sensitivity to CO2 forcing is net positive when observed CO2 rise of 10% has produced no observed warming?

      With reference to your objection to the use of multiple independent datasets which are intended to measure an almost identical parameter to derive a trend with less error

      Averaging them together, even if you adjust the baselines, gives a meaningless number.

      And paleo studies which attempt to derive trends by combining datasets from multiple proxies which measure almost anything but the actual parameter (e.g. tree rings, coral, etc) don’t?

  48. David Appell says:

    Also, Gras, note that the Levitus et al 2012 numbers are for the top 2000 meters of the ocean.

    Thus it excludes the bottom half of the ocean, as well as energy that has gone into warming land, melting ice, and warming the atmosphere.

    Off the top of my head I don’t know what those latter numbers amount to (and for the deep ocean I don’t think anyone does), but at first glance it doesn’t seem fair of Roger Pielke Sr, or you, to equate 0-2000 m ocean warming with global average radiative imbalance. Does it?

    Scientists admit their models have deficiencies:

    “Climate sensitivity, the eventual global temperature change per unit forcing, is known with good accuracy from Earth’s paleoclimate history. However, two fundamental uncertainties limit our ability to predict global temperature change on decadal time scales.

    “First, although climate forcing by human-made greenhouse gases (GHGs) is known accurately, climate forcing caused by changing human-made aerosols is practically unmeasured. Aerosols are fine particles suspended in the air, such as dust, sulfates, and black soot…. Aerosol climate forcing is complex, because aerosols both reflect solar radiation to space (a cooling effect) and absorb solar radiation (a warming effect). In addition, atmospheric aerosols can alter cloud cover and cloud properties. Therefore, precise composition-specific measurements of aerosols and their effects on clouds are needed to assess the aerosol role in climate change.

    “Second, the rate at which Earth’s surface temperature approaches a new equilibrium in response to a climate forcing depends on how efficiently heat perturbations are mixed into the deeper ocean. Ocean mixing is complex and not necessarily simulated well by climate models. Empirical data on ocean heat uptake are improving rapidly, but still suffer limitations.”

    — James Hansen et al, “Earth’s Energy Imbalance and Implications,” Atmos. Chem. Phys., 11, 13421–13449, (2011), http://www.atmos-chem-phys.net/11/13421/2011/acp-11-13421-2011.pdf

  49. Jim says:

    David Appell,

    Thank you for your reply to my post 07 June @1547. You make my point precisely. The link you referenced is well known to me. It is the explanation of the current status from the AGW point of view. The problem is that AGW is not the Null Hypothesis. While it has many zealous proponents and some scientific value, it is still an alternate hypothesis to the Null, that is, that there is a Natural cycle which adequately explains all observed “changes”.

    Irrefutable evidence is that which is statistically significantly different from any other position. Most of the confidence intervals of AGW overlap with non-AGW explanations. And many AGW models don’t predict observed data. A start, but not proof.

    You reply to “best” also makes my point. No one knows. So why do we need to “fix” today’s problem when we can’t say it is better than an alternative and when we haven’t shown it is aberrant? If the goal is to preserve the planet as it is today regardless of the natural cycle, say so. That kind of honesty is respectable.

    Your quote of 08 June @ 1204 completes the circular argument. An AGW zealot providing a definition which is not proven fact for a circumstance which is not proven fact. AGW may be real, but given the significant factual objections to AGW tenets, there is still a long road to travel.

    Informed discourse. Keep it up. But opinion is still opinion, facts are still facts, and the scientific method is still valuable.

    • mike maguire says:

      Jim, here’s some evidence that I’ve been using the past few years that clearly suggests the atmospheric environment, during the period of greatest warming(1980’s-90’s) resulted in massive benefits.

      “Between 1982 and 1999, 25 percent of the Earth’s vegetated area experienced increasing plant productivity—a total increase of about 6 percent,”

      http://earthobservatory.nasa.gov/Features/GlobalGarden/

      This supports your point.

      2 sides battle each other over whether the CO2 increases from man are causing the warming…………….while, crop yields, world food production and plant growth explodes thanks in part to rising CO2.

      http://www.co2science.org/data/plant_growth/dry/dry_subject.php

      I trade commodities effected by global weather patterns for a living. The empirical data, taking into account technological advancements sure suggests our crops love today’s environment.

      If we had a choice and the power(we don’t) mine would be the atmosphere with the higher CO2.

  50. David Appell says:

    Jim at June 8, 2012 at 1:52 PM:

    Climate models don’t “predict” anything. They project based on assumed scenarios.

    Natural factors do not explain recently observed warming. See the IPCC 4AR WG1 TS4.1 Fig TS.22
    http://www.ipcc.ch/publications_and_data/ar4/wg1/en/tssts-4-1.html

    Notice that the confidence interval bands do not overlap after about 1975.

    Even “natural cycles” have causes — what cycles are you referring to, and what are their causes?

    The vast majority of climate scientists agree that the scientific case for AGW has been made, on the basis of observations agreeing with scientific hypotheses (and not agreeing other hypotheses), and not as “opinion.”

  51. David Appell says:

    mike maguire (June 8, 2012 at 2:42 PM):

    Crop yields are increasing for many reasons, enhanced CO2 being one of them, but warming itself is causing decreases in yields. See:

    “Global scale climate–crop yield relationships and the impacts of recent warming,” David B Lobell and Christopher B Field, Environ. Res. Lett. 2 (2007) 014002 (7pp)
    http://www.mendeley.com/research/global-scale-climate-crop-yield-relationships-and-the-impacts-of-recent-warming/

    There is no a priori reason to expect that the benefit of enhanced CO2 and the damage of warming will continue to balance into the future. AGW’s effect on plants is very complicated, with many factors in play besides CO2, such as temperature, precipitation, diseases, the nutritional value of plants grown at higher CO2 levels, and more. Scientists are working to sort all these factors out, and it’s extremely simplistic to simply conclude ‘more CO2 is better.’

    The empirical data, taking into account technological advancements sure suggests our crops love today’s environment.

    Except the world can’t be structured as simply whatever is best for plants. AGW has many, many effects, many of them undesirable to animal and ecosystem health. There’s a reason people don’t live inside greenhouses.

    • mike maguire says:

      David,
      Thanks for the link. I really can understand why people think the way they do because of research like this.
      Sounds convincing to anyone, even most much smarter than me.

      However, I know a thing or 3 about agriculture and agronomy, so let me point out some fatal flaws in this study.

      1. There were no real world measurements that could discern between actual yields and what yields would have been with less CO2 and/or less heat. The yield losses they found were based purely on a computer model, programmed to use temperatures and crop data, along with what the computer was told would happen if temps got hotter. Not what did happen but what was programmed in. I could have told you with 100% certainty before the data collecting commences,that an increase in temperatures like we did see in the 80’s and 90’s and the conditions of a project like this will always show yield loss.

      2. They credit advances in technology for the increasing yields and then estimate how much was lost from increasing temps that would have added even more yield. So how do they know what the increase in technology by itself yielded?
      They clearly don’t because of their lack of understanding or at least incorporating in changes in hybrids/genetics that allow these crops to do much better today under temps as much as 5 degrees warmer than what the crops of the 1980’s would have done. Crops have been bred to withstand higher temps. It’s absolutely not properly represented in their model.

      3. They also fail to incorporate that increases in CO2, have the most benefits with respect to root mass. A more developed root system allows a plant to access more nutrients and also do better in droughts as it taps more soil moisture.

      4. Here again is a link that doesn’t use a scientists model, built with programs that represent his preconceived notions. This is just a pure measure of the basic changes in vegetation/plant productivity. The time frame was exactly during the years of greatest global warming. It completely contradicts the study you provided.
      http://earthobservatory.nasa.gov/Features/GlobalGarden/

      5. There is so much research and so many papers out there that are biased and flawed. It makes me sick to see science corrupted by elements that are in conflict with finding the truth.
      http://www.plosmedicine.org/article/info:doi/10.1371/journal.pmed.0020124

      6.”the world can’t be structured as simply whatever is best for plants” I admit that we need to look at the overall picture but why is it that the massive crowd which insists that CO2 is pollution is no longer able to embrace the same irrefutable science they we were all taught about photosynthesis in high school biology?
      This last fact is what turned me into a skeptic over 10 years ago. When you catch somebody in a lie(not telling the truth about CO2) you start investigating the rest of their position.

      David, you know of course that every animal eats plants or eats something that ate plants.

      Certainly then, plants, being the most critical in the food chain ought to get huge weighting.

      7. Since you mentioned greenhouses with regards to plants.
      Ask any major greenhouse grower why they would use carbon dioxide enrichment generators to more than double the atmospheric CO2 in the growing environment.

      I’d be willing to bet every one of them knows a great deal more about the effects of the environment on growing plants than scientists doing research with computer models to show how CO2 induced global warming is taking away from crop yields.

  52. David Appell says:

    Gras Albert says:
    Exemplary observation skills, one would hope that as I placed the quote in italics, to differentiate it from my text, it would be obvious

    It wasn’t. For all anyone knows it was something you wrote that you wanted to emphasize.

    Please explain how climate sensitivity to CO2 forcing is net positive when observed CO2 rise of 10% has produced no observed warming?

    I already answered this above on June 8 9:38 am.

    And paleo studies which attempt to derive trends by combining datasets from multiple proxies which measure almost anything but the actual parameter (e.g. tree rings, coral, etc) don’t?

    No, because the proxies are all proxies of the same thing: surface temperature.

  53. David Appell says:

    mike maguire wrote:
    The yield losses they found were based purely on a computer model, programmed to use temperatures and crop data, along with what the computer was told would happen if temps got hotter.

    No, they did not. They used multiple linear regression on historical data.

    There were no assumptions about future temperatures, or, indeed, any projections into the future.

    • mike maguire says:

      “There were no assumptions about future temperatures, or, indeed, any projections into the future”

      Calm down David. I never thought or stated anything about the future. My statements pertain only to this study and during the time frames of the data collected.

  54. David Appell says:

    Mike Maguire wrote:
    2. They credit advances in technology for the increasing yields and then estimate how much was lost from increasing temps that would have added even more yield. So how do they know what the increase in technology by itself yielded?
    They clearly don’t because of their lack of understanding or at least incorporating in changes in hybrids/genetics that allow these crops to do much better today under temps as much as 5 degrees warmer than what the crops of the 1980’s would have done. Crops have been bred to withstand higher temps.

    They write about all of this, so I’m wondering how closely you read their paper.

    “The use of first differences minimizes the influence of slowly changing factors such as crop management.”

    “This analysis also assumes that year-to-year management changes were either uncorrelated with climate, or were themselves caused by climate [12], and thus did not bias the interpretation of the climate’s influence on yields…”

    “In theory, farmers would adapt cropping systems
    as climate changes, thus minimizing or possibly reversing
    the adverse effects of warming [14–16]. Our estimates of
    climate impacts can therefore be viewed as an upper bound
    on the impacts of recent trends…. In addition,
    adaptation is expected to lag several years behind climate
    trends, because of the difficulty of distinguishing climate
    trends from natural variability and the disaggregated nature of farmer decisions.”

    • mike maguire says:

      “In theory, farmers would adapt cropping systems
      as climate changes, thus minimizing or possibly reversing
      the adverse effects of warming [14–16]. Our estimates of
      climate impacts can therefore be viewed as an upper bound
      on the impacts of recent trends…. In addition,
      adaptation is expected to lag several years behind climate
      trends, because of the difficulty of distinguishing climate
      trends from natural variability and the disaggregated nature of farmer decisions.”

      My point again. The statement starts with “In theory”

      How many farmers do they regularly communicate with to make this a valid theory?

      This is exactly what I do for a living. I give advice to many producers and am in touch with what they “might do” under countless circumstances.

      I’m a bit agitated that the author of this paper pretends to be an authority regarding agronomy/agriculture but then, that’s the nature of our scientists in today’s world.

      “In addition,
      adaptation is expected to lag several years behind climate
      trends”

      They attribute all the huge crop yield increases in their research(from recent years) to technology………..which is before the “climate trends” they refer to but then say that adaptation is expected to lag several years behind climate trends.

      It’s a contradiction.

      • mike maguire says:

        I don’t want to veer into politics but the fact is that US governmental policies regarding ethanol/energy have a much greater influence on producer/farmers decisions and the demand/supply fundamentals(in the long run) than climate change has or could ever have………by several orders of magnitude.

  55. David Appell says:

    Mike Maquire wrote:
    They also fail to incorporate that increases in CO2, have the most benefits with respect to root mass. A more developed root system allows a plant to access more nutrients and also do better in droughts as it taps more soil moisture.

    No, their methodology doesn’t go into that level of detail (what methods do? I’d honestly be interested to know) — it doesn’t consider nutrition at all.

    Nor do they say that climate change explains *all* changes in global yields — they estimate they explain ~30% of it. Really, Mike, read the paper.

    • mike maguire says:

      “Mike Maquire wrote:
      They also fail to incorporate that increases in CO2, have the most benefits with respect to root mass. A more developed root system allows a plant to access more nutrients and also do better in droughts as it taps more soil moisture.

      No, their methodology doesn’t go into that level of detail (what methods do? I’d honestly be interested to know) — it doesn’t consider nutrition at all.”

      David,
      That’s exactly what I’m saying!!!

  56. David Appell says:

    Mike, nice try with the PLOS paper, but that paper mostly pertains to medical research and in the social sciences. And, of course, it can be turned around and used against any research you cite as well. It’s a copout.

    All Lobell and Field did was take existing data — assuming, of course, it was accurate, as all researchers do, even you and I — organize it, and apply linear regression to it. It’s not that complicated. There were no “models” involved, in the usual way that word is used in climate science.

    Certainly then, plants, being the most critical in the food chain ought to get huge weighting.

    Come on, that’s an extremely simplistic statement.

    There is no evidence that the plants are suffering from a lack of CO2. And enhanced CO2 doesn’t just make crops grow “better,” but also weeds, grasses, etc. that compete with crops.

    And there are so many other factors involved that you can’t simply separate out CO2 and ignore other factors. What good is 1000 ppm CO2 if temperatures are 5 C (say) higher, weather is erratic so that added rainfall washes out your fields or droughts wither the crops, if you have to move your wheat operation to Canada or Siberia (if you can), or your customers are busy building dikes to keep the ocean out of their living room?

    There is just so much going on with CO2-driven AGW that doing mostly what’s best for plants is, IMO, laughable. They are one consideration in a huge, complicated picture.

    • mike maguire says:

      “What good is 1000 ppm CO2 if temperatures are 5 C (say) higher”

      Who thinks we might get to 1000 ppm?

      This is why i suggest we stay in the real world, look at how it is really responding. Use theories and computer projections but with a grain of salt and with less weighting than real world empirical date.

      We know photosynthesis science with certainty. It’s not a theory.

      We can project all sorts of hypothetical/speculative situations like, “insects will be more damaging to crops because mild Winters will allow more to survive”(while ignoring that producers/farmers can control insects)
      or that heat/drought is bad for crops(while ignoring that increasing CO2, imparts greater drought tolerance and genetics imparts greater heat and drought tolerance).

      Separate speculation and unproven theories from proven science and the real world.

      Your term “laughable” describing my opinion that plant science should get a huge weighting regarding this topic is enough to know this is probably futile.

      That’s fine. I read your source and will also read any other sources you provide and gladly take them “seriously” along with sincere comments regarding my thoughts.

    • mike maguire says:

      “enhanced CO2 doesn’t just make crops grow “better,” but also weeds, grasses, etc. that compete with crops”

      Another myth perpetrated by biased scientists that don’t understand farming.

      David,
      Let’s have you do a reality check. I’m not sure where you live but assuming your area grows corn and soybeans, take a trip into the country and walk some corn and soybean fields. Come back and tell me about these weeds you referred to above.

      You won’t be able to. There are almost none. You see, todays farming is very effective at weed and insect management.
      Strategies include spraying, no till, close row spacing and GMO crops to name a few.

      “What good is 1000 ppm CO2 if temperatures are 5 C (say) higher”

      Read this article and you’ll understand where I’m coming from:

      http://buythetruth.wordpress.com/2009/06/13/photosynthesis-and-co2-enrichment/

      “at higher levels of CO2, C3 plants can maintain efficient photosynthesis rates at considerably higher temperatures than today’s conditions – their optimal temperatures for photosynthesis increase”

  57. David Appell says:

    Mike maguire says:
    June 9, 2012 at 4:02 PM
    I never thought or stated anything about the future. My statements pertain only to this study and during the time frames of the data collected.

    Yes, you did.

    You wrote, “The yield losses they found were based purely on a computer model, programmed to use temperatures and crop data, along with what the computer was told would happen if temps got hotter. Not what did happen but what was programmed in.

    (My emphasis in bold.)

    Please at least be consistent in what you’re saying.

    • mike maguire says:

      David,
      You misunderstand me. Maybe it’s my fault for not being more clear but as I elaborated, all my statements were directed at this study and only during the time of the data collection.

      Rather than pursue this with attacks on verbiage and/or inconsistencies. Let me do this a different way.
      The research states:

      “For wheat, maize and barley, there is a clearly negative response of global yields to increased temperatures. Based on these sensitivities and observed climate trends, we estimate that warming since 1981 has resulted in annual combined losses of these three crops representing roughly 40Mt or $5 billion per year, as of 2002. While these impacts are small relative to the technological yield gains over the same period, the results demonstrate already occurring negative impacts of climate trends on crop yields at the global scale”

      So this study found negative impacts on crops from climate change, right?
      The changes in temps took away from yields. This is why you used it as a source.

      My points, supported by real world and satellite vegetation data that looked at the entire globe(massive areas not effected by technology-the effects of technology are impossible to assign values in crop yields) during this same frame that shows big positive impacts from climate change.

      My last link is a clue regarding a part of what they missed. It has everything to do with the known science of photosynthesis.

      If they had tried to estimate the big increases in CO2 atmospheric fertilization that are irrefutable….then subtracted an amount from the effect of heat on yields(heat fill in corn for instance is legit and does take away from yield-see below) and their results were in line with real world satellite vegetation data, then the study is realistic.

      Their results and conclusion don’t show that crops and plants are doing better because of climate change, even after accounting for the losses from higher temps(assuming they are all from climate change)
      This is not the truth.

      There’s not alot out there about heat fill and corn but you may find this interesting.

      After the last 2 (hot) growing seasons in the US, many got a good education on it. Clearly, this is an example of persistently high temps, especially at night, during a key developmental stage of corn that causes sometimes significant yield losses.

      After pollination, corn plants have a period of time before maturation that is based on GDD(growing degree days).
      The more heat, the faster these GDD’s accumulate and the more rapidly the plant matures.
      During this key time frame, photosynthate demands from the plant are focused on developing (filling) the kernels.

      When GDD’s accumulate much too fast, it gives the plant less time to fill kernels completely.

      An analogy would be if you were blowing up an air mattress.
      If you were taking 1 breath every 4 seconds and given 400 seconds, that would provide 100 breaths of air to inflate vs 1 breath every 3 seconds but time was up after 250 seconds which would only produce 83 breaths and a less inflated air mattress.

      Heat fill is fairly common in the Southern US. In 2010/11 growing seasons it effected areas farther north than usual.
      Heat fill is phenomena that occurs even with sufficient moisture present(which was the case in 2010).

      In the Northern Cornbelt, historically, faster and more GDD’s before Autumn and cool/cold weather correlate to higher yields not lower.
      It’s not heat fill but a race to maturity that is the most critical to win.

      During the 2009 US growing season, it was unusually cool. Corn yields were quite high but not enough GDD’s accumulated for much of the Upper Midwest corn to fully mature. There were losses from being too cool. Losses from heat fill in recent years, have far exceeded losses from corn not reaching maturity.

      This explanation applies only to corn. Soybeans tolerate much more heat and develop, differently, responding greatly to day length also.

  58. David Appell says:

    Mike Maguire says:
    June 9, 2012 at 4:43 PM
    My point again. The statement starts with “In theory”

    Wow, you are really twisting their words. Their phrase is a common one that simply means “It’s possible that….”

    How many farmers do they regularly communicate with to make this a valid theory?

    The point of their article is to analyze the data, which is independent of what farmers will tell you. They readily acknowledge their study’s limitations in their paper, which is clear now that you haven’t read

    I’m a bit agitated that the author of this paper pretends to be an authority regarding agronomy/agriculture but then, that’s the nature of our scientists in today’s world.

    I’m a bit agitated that you haven’t read their paper and don’t understand the basics of what they’re doing, which is simply to try to distill out some of the basic causative factors in recent yield trends. You do understand linear regression, right?

    They attribute all the huge crop yield increases in their research(from recent years) to technology………..which is before the “climate trends” they refer to but then say that adaptation is expected to lag several years behind climate trends.

    Here again you show you haven’t read the paper. In their conclusion they write about yield increases from CO2 enhancement, which is independent of technology.

    Thus they certainly do not attribute all yield increases to technology.

    How could farmers possibly adapt to a trend before it has started??

  59. David Appell says:

    mike maguire says:
    June 10, 2012 at 2:25 PM
    todays farming is very effective at weed and insect management.
    Strategies include spraying, no till, close row spacing and GMO crops to name a few.

    Yes, and they will have to work harder at it in the future if CO2 levels increase, because that increase aids all plant growth, not just crop growth.

    And not all farmers have access to these methods and technology, especially in poorer regions of the world. Not everyone does industrial agriculture.

    Also, because farming does adequate insect management at present is no guarantee it will be able to do it in the future. Warming temperatures and changing patterns of precipitation offer the possibility of insect domains shifting and/or expanding, which of course considerable uncertainty for farming.

    • R. Steedman says:

      This argument over CO2 levels is missing the mark. The big danger to agriculture in a warming world is drought (and flood). Ask the farmers in Texas how much the increased CO2 helped their crops last year. If it is too wet or too dry, farmers suffer. As the climate patterns shift, so will the location of optimal growing regions. This will cause massive disruptions in agriculture.

      My cousin farms about 800 acres of corn and wheat. It would take only two consecutive years of drought or flooded crops to bankrupt him. How do you suggest he prepare for shifting growing zones? Should he sell the family farm (3rd generation) and buy one in Canada?

      The argument that a warmer world or one with more CO2 might be better than the one we have now forgets a crucial point. We can’t just magically move things around the planet. Maybe Saudi Arabia will become a wonderful place to grow rice in 50 years, but that doesn’t help the folks in southern Asia if the monsoons fail.

      The same goes for the tired argument that the climate has changed before. Yes, when changes occur over long time spans, nature has had time to adjust. This time the changes are rapid. We will adjust, but it won’t be pretty.

    • mike maguire says:

      “because farming does adequate insect management at present is no guarantee it will be able to do it in the future”

      The trend of technological advances and better farming methods makes it very likely that the future will produce even more effective means.

      Using the data from your link on how crops responded to temperatures from the past, would be like taking data from all sorts of comprehensive studies on cell phones from the last 20 years.

      It would tell us alot about the past, when the technology was growing and how far we’ve come but what good is it now to apply to today’s real world? And going forward=what good is it X2.

      It would be mostly obsolete.

      Farming today is so incredibly different and more effective than it was when most of that data was collected.

      Corn and Soybean plants don’t even have the same genetics.
      You can grow a corn plant on half as much rain today as you did 20+ years ago.

      • R. Steedman says:

        But you can’t grow a corn plant on no rain. Nor wheat, beans, rice, cotton, etc.

        Nor does corn do well when underwater.

        That is the problem.

  60. The change will be down in the temperatures for the globe going forward not up.

    And your correct when it happens it wil be rapid.

    The setup is in place for colder temperatures going forward, from SOLAR ACTIVITY , to the PDO.

    Just to be brief, but I am very confident that the temperature trend will be lower.

  61. After the JUNE climate data is posted ,I will send a more detailed message to explain my position on the global temperature outlook going forward, and why the SETUP, is in place for lower temperatures going forward.

    I would bet all my climatic knowledge ,that I will be correct on this issue.

  62. Chris Biscan says:

    Looks like June at channel 5 is going to finish about .150C above 2011. But still below 2010 and 1998. But going to be third. unless the surface land temperatures are warm enough to make up for the ocean temps 2010 had.

Leave a Reply