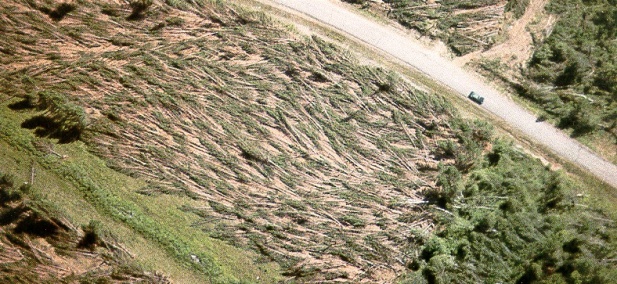
35 Years Ago Today: Global Cooling Caused Severe Wind Damage

July 4th, 2012 by Roy W. Spencer, Ph. D.


The recent thunderstorm wind event which caused widespread wind damage from Ohio to the mid-Atlantic coast has, rather predictably, led to claims that global warming is the root cause.

Known as a “derecho“, these events are indeed uncommon, but have always been around: the term was originally coined in 1888 in a study of thunderstorm wind damage which occurred in 1877.

In fact, one of the most famous events occurred when global temperatures reached a minimum, back in the 1970’s. Known simply as “The Storm”, it occurred 35 years ago today, on July 4, 1977. There were widespread blowdowns of trees (see the photo, above). Even though the event occurred over relatively unpopulated areas in Minnesota, Wisconsin, and Michigan, the highest recorded wind speed was an astonishing 115 mph, officially recorded with an airport anemometer.

Compare that to the derecho event of last week, which occurred over heavily populated areas: the highest measured wind speed in the extensive list of reports at the Storms Prediction Center was only 92 mph, and even that was on a home weather station, and so is unofficial.

So, why all the fuss over last weeks storm? Because it didn’t hit flyover country. Tens of millions of people were affected, and millions went without power.

Of course, those affected included many journalists, so it is only natural that they would speculate (and seek out experts to speculate) about the sinister causes of such an event.

Surely the silliest comment I saw came from Bill Nye, “The Science Guy”, who stated: “…We had a 30-degree temperature drop in Maryland and Virginia this weekend, in just – in a half-hour. These are consistent with climate models.”

First of all, such temperature drops occur routinely with the passage of mid-latitude thunderstorms. Secondly, climate models predict no such thing anyway. If “The Science Guy” gets it this wrong, how can I trust him on anything else?


20 Responses to “35 Years Ago Today: Global Cooling Caused Severe Wind Damage”

Toggle Trackbacks

  1. Andrew says:

    “Consistent with” meaning “the models don’t say this won’t happen” of course, whether they are even capable of saying whether won’t happen depends on their time resolution in this case, right?

    I suspect climate models time resolution is hours, not not minutes…

  2. Sean2829 says:

    I had to laugh at that as well. How does a climate model in a 250 mile square grid cell resolve a 25 mile wide weather front?

  3. There is the matter that increase of “greenhouse gases” is a secondary cause of extratropical windstorms, by
    increasing convection, which increases transport of strong upper-troposphere winds to ground level.

    However, that is secondary. The primary cause of
    extratropical windstorms, including even large long-track tornadoes and derechos, is *horizontal* temperature gradient. With vertical temperature gradient and no
    horizontal temperature gradient, thunderstorms are more
    like those near the equator – able to produce heavy rainfall and lightning, but not major tornadoes or other major destructive winds (when in usual-case not developing into oceanic tropical cyclones).

    Global warming warms the Arctic more than it warms the tropics. This is in the models, and it is in the surface-
    instrument and satellite records.

    So, don’t blame global warming for the recent derecho,
    or the April 2011 tornado outbreak in Alabama. Blame those
    events on “normal American weather”.

    “Normal American weather” is to behave well just enough to
    get Americans thinking that there is such a thing as “normal American weather”. And, to throw every sort of curveball and screwball that weather ever did worldwide in the entire history of this planet, and maybe invent a few more.

    As for modern journalists – too many of them are youngsters who have not been around long enough to know
    about hurricanes Hazel and Agnes going “loco” inland, the 1973 tornado outbreak, or how USA’s tornadoes have a slight trend of being worse before the huge 1973 outbreak than after. Blame age discrimination and business models rather than global warming for journalists hyping-up recent crazy American weather, as if (*not!*) in the past few years American weather is getting crazier.

    • Doug Lampert says:

      Remember how after Katrina global warming was going to cause more severe huricans to hit the CONUS more often?

      I do remember that. It was all over the news in 2005-2006 that the 2005 huricans weren’t just an aberation, that’s how global warming would make the weather be in the future.

      Of course there hasn’t been a category 3 or higher to make landfall on the US mainland since 2005, that’s a record, but it’s not news.

      In fact it seems we’re back to where we were prior to Katrina, that huricanes AREN’T caused by global warming, now it’s some sort of generic “severe weather”.

      I’ll be mildly impressed with such claims when they come up with a reasonably objective measure to compare for how much severe weather there is in a year. Calculate a historical baseline for that measure, and anounce the measure and the expected increase PRIOR to the big storm or drought or flood or whatever it is next year.

      I’m not holding my breath.

  4. Chuck Wiese says:

    Roy: Bill Nye the “science guy” has no credibility in my book, either. Anthony Watts tried to duplicate his “experiment” concerning CO2 vs. regular air, by which a liter of air and CO2 are heated under IR lamps. Nye claimed the CO2 jar heats “faster and warms further” than regular air because of the IR absorption properties of CO2. Watt’s failed attempted duplication of the claim falsified it and it is even worse because the “climate 101” video faked the CO2 temperature response using video deception. This video is available on the WUWT main paged under climate FAIL files. Your readers shoud see it if they have not already. And we know why it failed and so should Nye, but he apparently doesn’t understand science like he claims. CO2 has a lower specific heat of .844 KJKg-1K-1 vs. air at ~ 1 KJKg-1K-1, so you would expect the heating rate of CO2 to be slightly higher but this is not so when you consider the molecular weights. CO2’s is 53% ( 44gmol-1/28.8gmol-1 ) higher than dry air so the air will actualy heat faster with the same volume than CO2 will which is precisely what Watt’s replication shows near the end, and about equal heating on the way up. And it ought to be apparent to most that IR radiation does not penetrate a glass jar, and the emitting frequency of the jar is not at CO2’s wavelength. The heating of the gases in both jars was due solely to thermal conduction, yet Nye claimed this was due to infrared emission from the heating lamps!

    The record high temperatures were caued by nothing more than a stagnating high pressure system that coupled with the summer solstice sun angles and length of day, and the position of that system pumped in a lot of surface/low level moisture from the Gulf of Mexico loading up the lower troposphere with sensible and latent heat energy, ie. higher equivalent potential temperatures. It takes only a small fuse ( weak cold front ) to light that thermodynamic bomb that can produce the derecho storms, and you’re right, it is nothing new.

    We can contrast the heat in the east and south with the record cold temperatures experienced this spring and last month as well here in the Northwest. June 2012 was 2.7 degF below normal for Portand, Oregon with a near record 4.10 inches of rain. Near record late snow melts are occuring here in the mountains as well at Steven’s Pass in the Washington cascades. The persistent cold low pressure trough in the west has produced the stagnating blocking pattern of high pressure in the east that brought summer sun angle heat accumulation and the derecho storms. This has nothing to do with CO2 and the claims of Nye and other science illiterates.

    Chuck Wiese
    Meteorologist

  5. Jim Macdonald, Meteorologist says:

    In addition to less horizontal temperature contrast with any global warming, there is also less vertical contrast due to a hot spot aloft predicted by the climate models. How can they say that global warming leads to more storms due to instability? It doesn’t compute. If the hot spot isn’t there, the climate models are erroneous.

  6. Alan D McIntire says:

    In reply to Jim MacDonald: That “hot spot” argument is unclear to me. I realize there’s a greenhouse effect, and that atmospheric radiation would drop as one goes higher in the atmosphere, reaching zero at the fictitions “TOP” of the atmosphere. If a new layer of CO2 was INSTANTANEOUSLY dropped into the upper atmosphere, there would be a slight delay as radiation into the new layer built up until the new “TOP” of the atmosphere was radiating at the “OLD” 255K or whatever level-in that case there would be atemporary hot spot.

    In the real world, we’re not suddenly dropping a new layer CO2 instantaneously into the atmosphere. The buildup is gradual, giving the atmosphere plenty of time to adjust. The “TOP” of the atmosphere should continue to radiate at roughly the “OLD” 255 K continuously- I don’t wee where a hot spot comes in.

  7. Andrew says:

    Alan D McIntire-255 K should correspond to the temperature 1 optical depth into the atmosphere, rather than the “top”, I think. At any rate, increased CO2 should raise the height at which the optical depth measured from space reaches 1, whether slowly or gradually. Since temperature decreases with height, the new “characteristic emission level” is colder, emits less radiation, and an imbalance between incoming sunlight and outgoing infrared results. So the temperature at the new emission level has to warm. The “Hotspot” is only indirectly related to this: it comes from assuming that the lapse rate should converge to the moist adiabat (this is how models constrain the relationship between emission level warming and surface change, which is otherwise ambiguous) the consequence of which is that warming aloft in the tropics is enhanced.

  8. Chuck Wiese says:

    Andrew: While what you say is true, 15 um absorption has a very high absorption coefficient. All ground radiation there ( Q branch ) is into gas phase within 100 meters of the surface.

    Although the temperature decreases with height, thus reducing TOA emission, density falls off rapidly as well changing the absorption coefficients. There is a flux divergence of the ascending energy and when using the MODTRAN model, it seems to start around 4 Km of height. This has a cooling effect in the middle and upper troposphere as the absorption/emission ratios change with respect to surface energy.

    I believe ( as do scientists like Ferenc Miskolczi ) that this divergence plays a key role in CO2’s true effects on the earth’s radiation budget. If increasing CO2 increases the divergence of 15 micron energy with height, then I cannot see how CO2 can cause an energy imbalance with respect to the ground emission to space. Increasing mid and upper tropospheric cooling from increasing CO2 will reduce the saturation vapor pressure of water, thus lowering the effective emission height of water vapor or increase cloud emission. The effect will cause a negative feedback in the radiation emission with respect to CO2 and virtually little or no change across the integrated IR spectrum.

    The contribution of atmospheric CO2 to the earth’s greenhouse effect has never been determined except theoretically, which excluded water vapor and clouds. I believe that in the case of climate modeling, the relationships are incorrect and severely flawed, mainly because people like Andy Lacis and others that constructed the codes ignored the founding work and made their own assumptions.

    The only time that I can see that the Hansen/Lacis assumptions would work is in a planetary atmosphere where there is no water vapor or hydrological cycle. Hansen clearly had too much Venus on his brain. The founding work demonstrated theoretically that water vapor in and of itself creates its own hydrological cycle with cumulonimbus towers shooting through 8 Km of height. There was no CO2 included in the calculations that led to this theoretical condition causing an auto convective overturn.

  9. Alan D McIntire says:

    See

    https://www.google.com/search?q=radiation+transmitted+by+the+atmosphere&hl=en&prmd=imvns&tbm=isch&tbo=u&source=univ&sa=X&ei=-172T72wB8PZqgGa0pGLCQ&sqi=2&ved=0CF0QsAQ&biw=1600&bih=700

    CO2 does not radiate like a blackbody. Note that as temperatures get lower, CO2 radiates a relatively higher PERCENTAGE of net radiation at that temperature.

    Also, a charactistic radiation level doesn’t make much sense.
    A detector at the “Top” of the atmosphere would detect 255 watts. Using a “characteristic” level does not make much shnse. integrate e^-x to get 1- e^-x. setting the “top” of the atmopshere as level zero, zero percent of the radiation should be coming from the top of the atmosphere.

    1- 0.368 = 0.632 of the radiation would be coming from “1 atmosphere” depth or less, 0.865 should come from 2 atmospheres deep or less, etc. In fact, the number of ” atmospheres depends on radiation frequency. More CO2 will have the effect of raising the height of the “average” radiation level from some small fraction of the average height of the atmosphere to another small fraction.

    The temperature will drop with height both before and after warming by additional CO2. Assuming a 1C increase in average temps after a doubling of CO2, the “after” “effective” radiation height will be much less than the
    * 1 C* /(6.5 C/Kilometer average lapse rate for earth)
    = 0.154 kilometers.

    I think of the “hot spot” as something detectable- a significant temperature increase over time at a certain atmospheric pressure or height. With the slow CO2 buildup we’re experiencing, I don’t see how such a “hot spot” would be detectable.

  10. Paul says:

    The tropospheric hot spot over the tropics has been observed. See this article which shows the presence of a large warming trend in the lower stratosphere in the tropics using radio occultation measurements.

    http://www.atmos-meas-tech-discuss.net/4/2127/2011/amtd-4-2127-2011-print.pdf

  11. Andrew says:

    Alan D McIntire-“I think of the “hot spot” as something detectable- a significant temperature increase over time at a certain atmospheric pressure or height. With the slow CO2 buildup we’re experiencing, I don’t see how such a “hot spot” would be detectable.”

    Alan- the models for the most part show a sufficiently strong “hotspot” that we should be able to detect it. So far not much luck there, apart from the use of clever “tricks” to make it magically appear.

    ” The temperature will drop with height both before and after warming by additional CO2. Assuming a 1C increase in average temps after a doubling of CO2, the “after” “effective” radiation height will be much less than the
    * 1 C* /(6.5 C/Kilometer average lapse rate for earth)
    = 0.154 kilometers.”

    You should hardly be surprised that when you used a constant “average lapse rate” (a linear approximation, too!) you fail to calculate any deviation in temperature change with height. The models converge toward the moist adiabat and generally this leads to the warming aloft in the tropics being greater than at the surface. If we believe the MSU and/or radiosonde data and also the surface data, the models appear to get this assumption wrong. Of course, it could be that the model problem is in the boundary layer, in which case the fact that models can match the surface temperature trend okay is spurious.

  12. GLOBAL WARMING MODELS ARE USELESS

    The hot spot in the tropics is no where to be found. There is no sign of it. First blunder.

    The atmospheric circulation has been tending toward a more negative AO. Second blunder.

    Extremes in climate have increased since 2009 due to a more -AO, the models predicted LESS EXTREMES, due to a more +AO prediction(by the models) ,associated with their so called global warming. Third big blunder.

    Stratosphere if anything is warming, or at least warming more near the poles compared to lower latitudes. Fourth big blunder for the models, which predicted stratospheric cooling especially near the poles.

    Models were thinking more El Ninos associated with a warm PDO, wrong again. Fifth big blunder.

    Long wave radiation being emitted by earth to space no change, esssentially since 1979. Sixth big blunder.

    There are so many more, but as one can see from the above the models BASIC atmospheric forecast in regards to circulation and temperature patterns is not even close to being correct.

    The models will forever, NEVER be able to give an accurate climate forecast, because the data they are fed to begin with is not accurate, not complete ,and not comprehensive enough.

    In addition there are to many feedbacks ,and thresholds from these feedbacks, that the models can’t even begin to imagine ,or I should say account for.

    Also the state of the climate to begin with has to be accurately accounted for.

    It is time to start using our brains again when it comes to the climate, and looking at past history.

    It starts and it ends with solar changes, and all the secondary effects associated with the solar changes. This wil be proven before this decade ends, due to the significant solar change that took place in Oct.of 2005, which will exert more and more influence over the climate as this decade goes on, and the present weak solar max of sunspot cycle 24 passes by. At which time ,the worst of this prolong solar minimum will be upon us, which should last until 2030 or longer.

    Temperatures have been steady now, for at least the past 10 years or so, that is about to end. The globe will be in a cooling trend.

    SOLAR CHANGE WHAT DOES THIS MEAN

    1. LESS UV LIGHT ,LESS OZONE, CHANGES ATMOSPHERIC CIRCULATION ,MORE -AO. MORE CLOUDS, PRECIP,SNOW COVER, HIGHER ALBEDO. RESULT COLDER.

    2. WEAKER SOLAR WIND, MORE COSMIC RAYS MORE CLOUDS.RESULT COLDER.

    3. SOLAR MINIMUM EQUATES TO MORE VOLCANIC ACTIVITY. MORE SO2 ,WARMER STRATOSPHERE. RESULT COLDER.

    4. SOLAR MINIMUM EQUATES TO COLD PDO ,MORE LA NINAS. RESULT COLDER.

    5. AMO WILL ALSO BE IN COLD PHASE. RESULT COLDER.

    6. SOLAR IRRADIANCE CHANGES BY MORE THEN .1 ESPECIALLY DURING PROLONG SOLAR MINIMUMS. (.6 IS A COMMON ESTIMATE) RESULT COLDER.

    7. IONOSPHERE,THERMOSPHERE, MESOSPHERE, IN ADDITION TO THE LOWER LEVELS OF THE ATMOPSHERE ALL SHOW SIGNIFICANT CHANGES ASSOCIATED WITH SOLAR ACTIVITY CHANGES. RESULT IS CLIMATE CHANGE.

    Those are just some of the changes ,the sun exerts on our climate, and if the positive feedbacks from these reach a certain degree of magnitude /duration of time they might be able to over come the inherent negative feedbacks in our climatic system and bring the climate to some sort of a threshold or a series of thresholds, each time resulting in a drop in the temperature to another range,. It coud be as small as maybe just -.2c ,or much larger depending on how this evloves.

    Further, last century’s solar activity is not the kind of solar activity that is going to change the climate. Last century’s solar activity simply maintained our climate in the same regime it went to after the DALTON MINIMUM ended, in 1850 or so. The solar activity last century was a steady rhythmic 11 year sunspot cycle ,against a strong background of high solar activity. (will not change the climate)

    All the variations in the climate since 1850- present have all been in the same climatic regime. Some warm periods ,some cold periods ,due to AO,PDO, etc etc, but all in the same regime. This is going to change this decade.

    THE SUN IS THE SOURCE THAT DRIVES THE CLIMATIC SYSTEM /OCEANIC SYSTEMS OF EARTH TO BEGIN WITH ,THEREFORE ANY CHANGE IN THE SUN IF LARGE ENOUGH, HAS TO HAVE AN EFFECT ON THOSE SYSTEMS, SINCE IT IS THE SOURCE THAT DRIVES THOSE SYSTEMS TO BEGIN WITH.

    Since 1850 ,versus 1790-1850, the solar changes between those two time periods brought us out of the DALTON MINIMUM, to what we have now.

    This however is about to end due to the SIGNIFICANT SOLAR CHANGE ,that took place Oct. 2005 ,in my opinion.

    Time wil tell, as they say.

    • Thank you so much for your exclamation of this betty complex subject….I have always admired people who can keep all these complicated formulas straight in their head….I can tell all gore has never had anyone explain this subject to him in the straight forward way you just did for all of us….thank you…I am going to relist all of this onFb for the disbelievers to read…if they will…they tend to make comments on subject not content of the article…from your statements it sounds like our food supply will be compromised a will our ability too stay warm if we keep our national resources off limits and close down our power plants that produce electricity…..it must be very frustrating for you and the other scientists who understand that global warming is a theory based on junk science…thank you for your time…all of you for explaining this complicated subject!

  13. Chuck Wiese says:

    Alan McIntire: The integral of the Beer/Lambert form which is 1-e^-x is really just the emerging Planck emission coefficient for the Planck function,B that represents re-radiated absorbed energy.. And x is not the number of atmospheres emitting the radiation. x is ku, where k is the absorption coefficient and u the optical depth. There can be many combinations of ku that equal ~5 where the transmission of the absorption falls to near zero value, but that is only for non re-radiated energy. In the integral which you provided, the Planck function must be multiplied by it to account for re-radiated energy, and that, then, is a function of atmospheric temperature AT the specific wavenumber under consideration.

    As an atmosphere becomes more opticaly thick, the respective wavenumber emits more energy at higher temperature ( shorter optical path ) and there is less re-radiated energy to the outer layers near space. As they radiate more of their local energy and less re-radiated energy from below, emission exceeds absorption and the layers cool. That is an elevation of effective emisssion height that would cause imbalance with respect to surface energy. But level “zero” cannot be the top of the atmosphere in your example. It must be the surface, which makes this equation and the respective atmospheric Planck emission zero with respect to the ATMOSPHERE. And in that case,all the energy to space is emitted from the earth’s surface. At ~5 “level” the emission to space is from the sum of optical depth that radiates all of the local and lastly re-radiated energy that is not re-absorbed before reaching space. TOA molecules will always have some kinetic energy, so the emission will never fall to zero.

    But like I said upthread, the re-radiated divergence and atmospheric cooling are what concern me over the Hansen/Lacis claims. This process would have to change the spectrally integrated OLR in a direction opposite of what increasing CO2 would do because of the effect on the saturation vapor pressure of water therefore greatly or completely negating any effects from CO2.

    And the “hot spot” would certainly be detectable if the models were correct ( which they are not.) The process that causes this would have been moist convection. At higher tropospheric height, the latent heat adds more energy to a parcel with respect to the environmental temperature. That is not a linear response such as in the temperature lapse rate example you gave. If the process was occuring, it would most certainly emerge and become evident in the radiosonde record.

  14. Chuck Wiese says:

    @Salvatore: Nice write-up on the solar magnetic. I agree with most of your statements except that in the last warm phase or positive PDO cycle, El Ninio’s were more frequent and intense compared to the previous cold or negative phase that ran from 1946-1977.

    I think that was the primary reason that there was some global warming.

  15. mike maguire says:

    Roy,
    You’d already graduated at the University of Michigan when this impressive derecho event hit Ann Arbor in July 1980, 32 years ago.

    It was my last year at U of M and I was at the downtown Ann Arbor YMCA weight room on 5th Avenue

    Memories include the dark, pea green sky during this early morning storm. A drive east along I-94 to visit my folks
    in Detroit the next day was shocking.

    Many thousands of trees completely flattened for much of the 35 mile drive.

    http://www.crh.noaa.gov/dtx/stories/1980derecho.php

  16. You could be right. Only time will tell. I think before this decade is out ,we will have a much better idea of how things will stand.

  17. JinOH says:

    I live N.E. of Columbus, Ohio & yes – this event did suck big time. No running water (I have a well) was the worse part. Funny thing is, 2 weeks ago, we had lows in the mid 40’s. Go figger – Mother Nature is a fickle beast.

Leave a Reply