Decreased Surface Wind as a Contributor to Warming

February 5th, 2013 by Roy W. Spencer, Ph. D.

I recently discussed the possibility that waste heat from our energy use could be contributing to the observed increase in surface air temperatures, since it potentially rivals the size of the radiative forcing expected from increasing CO2, at least where people live (and put thermometers).

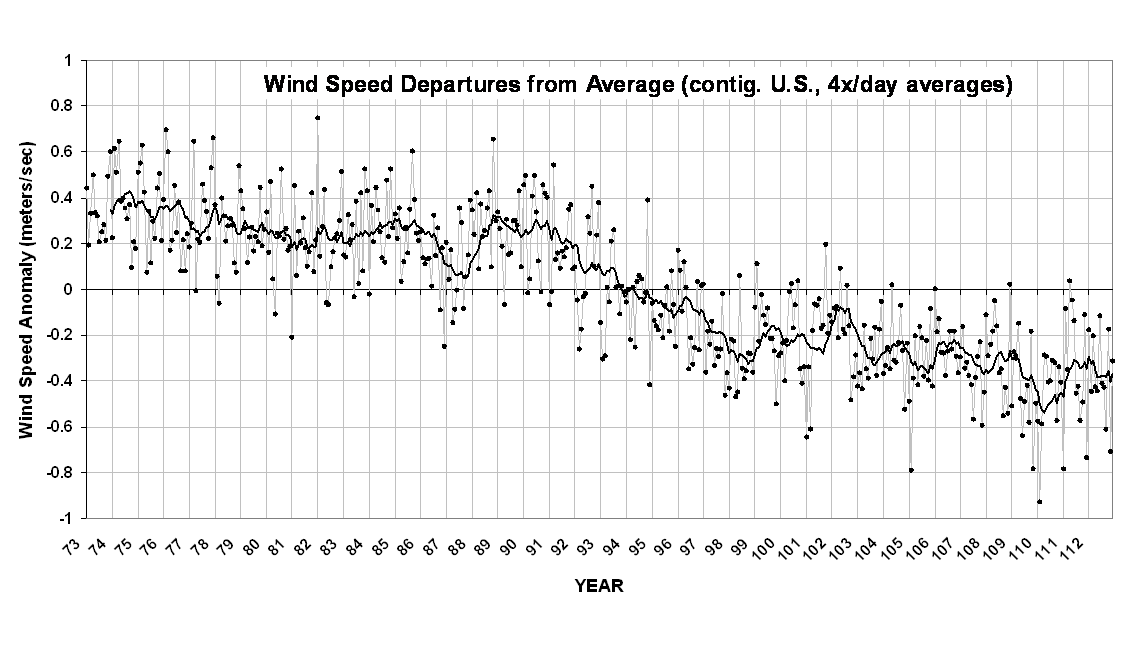
Now I’d like to discuss another possibility, related to something which I’ve noted in the surface weather data over the U.S.: a decrease in average surface wind speed. Over the last 40 years, there has been an observed decrease in near-surface wind speeds of about 0.7 meters per second, which is about 1.5 mph, which is shown in the following plot based upon my analysis of raw hourly ISH data downloaded from NCDC (dots are monthly, solid line is trailing 12-month average; click for large version):

Now, there are 3 basic ways in which land surface temperatures can warm: (1) an increase in absorbed sunlight; (2) a decrease in the rate at which the surface loses infrared (IR) energy, and (3) a decrease in convective heat loss from the surface.

That convective heat loss is made up of both dry and moist convective air currents. For example, dry convection would dominate over the desert; moist convection dominates over the ocean. Together, it is estimated that surface convective heat loss over the Earth averages around 100 Watts per sq. meter….much higher in the tropics, lower toward the poles.

Now, it is well known that convective heat loss is roughly proportional to surface wind speed. A wind decrease of 1.5 mph since the 1970s would represent about a 10% reduction in convective heat loss, which is about 10 W/m2 (all back-of-the-envelope, mind you, taking into account that there is still convective heat loss even when the wind goes to zero on a sunny day…it’s complicated).

Now, the 10 W/m2 is about 10 times larger than the estimate remaining radiative imbalance from increasing CO2. In other words, in some sense, it’s ten times easier to blame increasing U.S. temperatures on decreasing wind speed than on increasing CO2.

Of course, there are a number of caveats, not the least of which, Is the observed decrease in wind speed real?

Globally, more frequent El Nino’s in recent decades also decrease wind speeds over the ocean, which leads to a reduction in convective heat transport. But, the higher ocean surface temperatures (primarily from reduced upwelling of cold water) tend to counteract this by evaporating more water into the lower atmosphere, which can fuel stronger convection. So, there are competing influences which make the problem more difficult to analyze over the ocean.

But all other things being equal, a decrease in wind speed leads to decreased convective heat loss, which then leads to higher higher surface temperatures.

So, what then limits the value of those higher surface temperatures? Well, at 25 deg. C, an increase of 1 deg. C leads to an increase in infrared radiative loss by 6 W/m2. So, if decreased winds were to cause surface warming, the surface produces an extra boost in IR cooling which then limits the temperature rise. A change in one portion of the energy budget tends to result in changes in other components of the energy budget.

I don’t have a strong opinion regarding how much decreased surface winds (or waste heat production) have contributed to U.S warming in recent decades. Maybe a little, maybe most of it. We just don’t know.

But I do have a strong opinion about scientists who have a tendency to interpret every change they see in nature as some sort of response to increasing CO2.

NOTE: I anticipate someone is going to make a comment to the effect that convection will always stay the same in order to maintain the tropospheric temperature lapse rate. This is not true. Every day that it is sunny over land, the lapse rate in the lowest 100 meters of the atmosphere is strongly super-adiabatic. This is because convective air currents cannot transport heat from the solar-heated surface to the free atmosphere as fast as it is being generated; the process is rather slow and inefficient, and the strength of turbulent mixing by the wind does make a difference. And the hotter the surface gets under low wind conditions, the more energy the surface then loses instantaneously through infrared radiation, rather than through convection. Many field experiments in the last 50+ years have made observations of the dependence of convective heat loss on wind speed.


194 Responses to “Decreased Surface Wind as a Contributor to Warming”

Toggle Trackbacks

  1. Swift says:

    reduced wind speed will also reduce the evaporation rate, thus reduce the amount of energy the surface loses as latent heat.

  2. pochas says:

    “I anticipate someone is going to make a comment to the effect that convection will always stay the same in order to maintain the tropospheric temperature lapse rate. This is not true. Every day that it is sunny over land, the lapse rate in the lowest 100 meters of the atmosphere is strongly super-adiabatic.”

    This is the acceleration zone for the convective towers, the region where convection gets organized and in motion. Above the 100 meters temperatures follow the lapse rate all the way up until buoyant forces disappear or the top of the troposphere, whichever comes first. A superadiabatic region near the surface is to be expected and not a reason to discard the lapse rate as the primary factor controlling surface temperature. In fact, its existence in such a localized region is support for the theory.

  3. CoRev says:

    Dr Spencer, is there a new paper out or about to come out? If, so could you give us a link, please?

  4. RW says:

    Roy,

    Out of curiosity, what is the estimate of gross convective energy transport from the surface to the atmosphere? The 100 W/m^2 is quantifying the net loss, but I’ve always been curious how much actually leaves the surface and suspect it’s a huge number.

  5. Ronald says:

    Dr. Spencer
    Lack of wind increases daytime warming, but also nighttime cooling. Did you account for this?

  6. Doug Cotton says:

    Roy

    Where’s your basic physics? Yes, as you say “Now, it is well known that convective heat loss is roughly proportional to surface wind speed”

    But it is also well known by physicists, if not by climatologists, that evaporation increases with a wider temperature gap between the water surface an the colliding air molecules, and so does conduction (diffusion) also accelerate when that gap widens. So, if the surface stays a bit warmer, then conduction (diffusion) and evaporation will send more energy back into the atmosphere. The evaporation sends “latent heat” to higher altitudes, and the conduction (diffusion) starts a higher rate of convection than would otherwise have occurred from the surface upwards.

  7. Brad says:

    Doug Cotton. Oh boy.

  8. Doug Cotton says:

    pochas

    Yes indeed. The thermal gradient (AKA lapse rate) and the incident insolation level sets the base thermal plot which then determines the surface temperature, and continues through the crust and mantle, initially at a steeper rate (because specific heat of rock etc is lower) but eventually at a very low rate approaching zero in the deep inner mantle because specific heat increases as the cube of temperature. This “supports” the core temperature, which effectively receives its energy from the Sun!

    Then daily input of solar energy forms a “mound” of extra energy which is dispersed partly into the outer crust, and partly into the lowest 100m or so of the atmosphere. Hence the steep thermal gradient there. However, this mound of energy is released during the night, having been mostly temporary. In summer in any particular location, it may build up from one day to the next, but the reverse happens in winter.

    The very fact that the initial steep thermal gradient then settles down to the normal effective gradient demonstrates the base thermal profile in the atmosphere, as does the fact that the surface does not keep cooling at a fast rate later at night.

  9. Doug Cotton says:

    Before too many “laugh” at the concept of the Sun supporting the core temperature, let me explain that this is a direct consequence of the Second Law of Thermodynamics. Exactly the same process which supplies the necessary thermal energy to the surface of Venus (even though it is hotter than the atmosphere which absorbs the incident Solar radiation) also functions in Earth’s atmosphere and, wait for it, in the crust and mantle. Some of that extra energy from the Sun which penetrates the surface, or moves down by warm currents to the floor of the ocean and thence into the crust beneath, actually ends up on its way up the thermal plane towards the core.

    The Second Law says thermodynamic equilibrium (not thermal equilibrium) will evolve, and this means we must also consider gravitational potential energy. The Second Law requires thermodynamic equilibrium in a state of maximum accessible entropy. When such equilibrium evolves, we then have a kind of thermal plane which is sloping, but is in an isentropic state, not an isothermal state.

    Now, if we add extra thermal energy (kinetic energy) at any level, we upset the equilibrium. This is then resolved by that extra energy spreading out in all directions, some of it going up the thermal plane towards hotter regions. This is how it gets to the surface of Venus, and it must also be the way it gets to the Earth’s core, using energy originally from the Sun. Hence the long-standing unanswered question about core heat has an answer in this mechanism, as does the temperature of the Venus surface which could never have been due to any “runaway greenhouse effect” as is so often claimed.

  10. Doug Cotton says:

    Roy

    I actually agree with you when you say “convection will always stay the same in order to maintain the tropospheric temperature lapse rate. This is not true.”

    The thermal gradient is established primarily, not by convection, but by adiabatic diffusion of kinetic energy, in order to reach the thermodynamic equilibrium state of maximum accessible entropy, as is required by the Second Law of Thermodynamics.

    It does not require convection. Convection is caused by a surplus of energy in any particular location, and that energy then flows in any direction it can over the sloping thermal plane which evolves by adiabatic diffusion of kinetic energy.

    That’s how energy spreads even upwards in the atmosphere of Venus to get to the surface. It also spreads upwards sometimes in parts of Earth’s atmosphere, and certainly in the outer crust to provide energy in the mantle for volcanoes, but not for outward terrestrial heat flow through the rocks, because that’s a figment of incorrect imagination that forgot about the thermal gradient being a result of gravity, not outward heat flow in the inner crust.

  11. crandles says:

    Change in wind speed could be an effect of changes in location and direction of jet stream. Jennifer Francis has been working on that and seems to be finding effects from retreating sea ice.

    So are you sure the drop in wind speed isn’t a consequence of global warming?

    If sea ice retreat was the cause I would expect to see more effect in last 10 years than previously which the graph doesn’t show. So maybe that link is unlikely. Still there might be other global warming cause of the wind speed drop?

  12. Doug Cotton says:

    Roy

    Slower winds can be the result of cooler temperatures. For example, if (relatively) cooler temperatures in the tropics lead to slower convection rates, then the Trade Winds coming in to fill the gap left by convection will be slower. Likewise, the winds “squeezed out” towards the poles under the ceiling of the tropopause will also be slower.

    But what can be just as important is where the winds come from – that is, from hot inland areas or from cooler ocean regions. I’m sure I’m not saying anything you don’t know here, of course. But I’m just pointing out that more information would be needed, and, as I said in my first post, other transfer mechanisms could accelerate.

    In general, even if surface cooling is slowed a bit more than normal the surface is still supported by the base temperature which follows a plot whose gradient is determined by gravity, specific heat and intra-atmospheric radiation (mostly between layers of water vapour) and an overall level set by insolation levels and related parameters such as albedo. So it might just mean that some late afternoon temperature readings are slightly higher, but not those the next morning after temperatures had all night to get back around the base temperature. That base temperature will vary between summer and winter, by the way, because the whole thermal profile in a particular hemisphere will rise and fall between parallel positions. It may do so a bit between day and night, or during long periods of warmer or cooler temperatures. So it’s not as though we should expect every night of the year to cool to the same temperature.

    In a nutshell, yes, all these natural parameters, including cloud cover, cloud altitude and wind speed are natural processes which somehow seem to follow several superimposed natural cycles over which mankind has no control.

    Water vapour sets a lower gradient and thus lower surface temperature. Carbon dioxide also participates in intra-atmospheric radiation (like water vapour) and has a minuscule cooling effect as a result.

    It’s all done with sunshine and gravity.

  13. Doug Cotton says:

    The processes at the surface/atmosphere interface need to be better understood. It is not sufficient to lump them under one heading “convective cooling” Roy. For a start, convection does not occur at all between a gas and either a solid or a liquid.

    When water evaporates the water itself cools and the water vapour “leap frogs” those first 100 metres and it takes so called “latent heat” up into the clouds where it may not be released until days later when the vapour condenses back to water, hail or whatever.

    Now the water surface (as well as land surfaces) also transfer heat to the immediate atmosphere by molecular collision processes which can be called conduction or diffusion when gases are involved.

    Then, and only then, when warmer air already exists in the atmosphere just above the boundary, does convection start. It is not convection which creates the thermal gradient. That happens very slowly by adiabatic diffusion at the molecular level with no apparent air movement. Convection is caused by an additional source of warmer air which then turns the diffusion into adiabatic convection whereby air flows (at about 0.05 KPH) over the thermal plane established by diffusion. Convection can repair “damage to the plane, by smoothing humps and filling in troughs.

    Radiation can only transfer heat from warmer to cooler regions. That is why the wet rate is lower, because water vapour sends heat to cooler water vapour above. Heat exits the atmosphere in random walk steps between radiating molecules, but only those steps which go from warmer to cooler molecules transfer heat.

    The thermal gradient has to evolve in order to satisfy the thermodynamic equilibrium conditions of maximum entropy. You can’t argue that an isothermal gradient is a thermodynamic equilibrium state. All this has beenpublished in a peer-reviewed journal paper back in 2003 which no one has successively rebutted, least of all Anthony Watts or his cohorts. http://ruby.fgcu.edu/courses/twimberley/EnviroPhilo/FunctionOfMass.pdf

    Wind is another thing altogether, and completely dominates convection temporarily in that local region. But wind is a weather event and averages out over the whole globe over a full year.

  14. steveta_uk says:

    Could there be an effect on wind speed analogous to UHI? By which I mean, a larger proportion of weather stations are in build-up areas where buildings are interfering with wind movements at low levels where many measurements are made.

    Also, what about all those wind farms using up the wind? Perhaps not quite so significant, I accept.

  15. Norman says:

    Roy Spencer writes “But I do have a strong opinion about scientists who have a tendency to interpret every change they see in nature as some sort of response to increasing CO2.”

    The thing is that your theory about wind and energy distribution would fit right in line with the views of Skeptical Science or RealClimate. The question you need to ask is what is causing the wind speed to diminish.

    The standard line on the climate change alarm blogs is that the disproportionate heating of the poles vs the tropics is causing the jet stream to slow down (would also cause the westerlies in the US to slow, less energy gradient to move air). Their case is that CO2 is a major player in warming the poles (via the backradition hypothesis that Doug Cotton strongly opposes and I am siding with him on this issue), since the poles are very dry. In the tropics water vapor far out does carbon dioxide effect so increase in CO2 has a much smaller role there. This creates an uneven increase in temps and ends in lowering the energy gradient that moves wind. So in effect if wind speed decrease is responsible for warming the US then those groups have strong argument to attribute this to the current global warming.

  16. Steven Mosher says:

    ‘I recently discussed the possibility that waste heat from our energy use could be contributing to the observed increase in surface air temperatures, since it potentially rivals the size of the radiative forcing expected from increasing CO2, at least where people live (and put thermometers).

    Global Gridded data for that exists. you might want to recheck your figures.

  17. F. Maxwell says:

    One thing I have noticed from Dr. Spencer’s blog is a dramatic uptick over the last few months in the number of repetitive posts by Doug Cotton. Although this has been seen before on other blogs, the recent spike is more severe and creates an immediate hazard to other readers. The January figure was so high, I had to recheck the number to be sure, but it is correct. It could just be a temporary spike due to a massive release of hot air from Australia. Or more worrying, it could be a “new normal” that everyone will all have to adapt to in the coming decades. Let’s hope for the former and not the latter.

    Some physicists friends of mine were initially quite excited by the possibility that if the exponential growth in both frequency and length of the Cotton posts were to continue, the rate of change of length of the monthly comments page here would soon become superluminal, hence posing another challenge to Einstein’s theories. But it has been pointed out that the absence of information being propagated negates any contradiction.

    • Norman says:

      F. Maxwell

      If you would like a reduction in Doug Cotton posts could you get your physicists friends to refute the concept he presents? It is a logical based argument. Temperature is a measure of the mean Kinetic Energy of molecules in a region. It does not measure potential energy. Also it does not measure all forms of energy within a gas. Water stores energy in its bonds that do not effect the average kinetic energy. Air at the saturation level for water vapor will hold a lot more energy than dry air at the same temperature. Temperature only measures some of the energy a system contains.

      I would like your friends to explain how molecules at higher levels of a gravitational field would be moving the same velocity as those at the bottom levels and yet posses equal energy levels. What does happen to the potential energy that molecules obtained moving up a gravitional field?

      I think Doug will slow down the posts if anyone would stop, think and come up with really valid reasons to disprove the thermal gradient that would develop in a gravitational field.

  18. John says:

    18 comments. So far 6 are Mr. Cotton’s.

  19. Doug Cotton says:

    Well, it seems all F.Maxwell has to argue against the content of Hans Jelbring’s peer-reviewed journal article (published 2003 and never successfully rebutted) is that the length of my comments about this ground-breaking, greenhouse-smashing valid physics based on the Second Law of Thermodynamics. When you dare to argue the physics, then we’ll see what you’re made of. I can explain how the energy gets into the Venus surface, and how the temperature of the Earth’s core is supported and held fairly constant.

    You can do neither with valid physics, and nor can Roy.

    * http://ruby.fgcu.edu/courses/twimberley/EnviroPhilo/FunctionOfMass.pdf

  20. J Williams says:

    My cat can get an article accepted in Energy and the Environment.

  21. Massimo PORZIO says:

    @J Williams
    “My cat can get an article accepted in Energy and the Environment.”
    I would like to read that article soon. I love cats.

  22. Doug Cotton says:

    J Williams can watch for my article Who are the “Peers” who Review? soon to appear on the Principia Scientifc International website. Anyway, here’s a longer comment, which maybe your “physicists” could respond to, rather than just count the words therein.

    Roy can watch for the article after that (currently being reviewed) which will refer to his “misunderstood misunderstanding” about his claimed isothermal atmosphere, which he failed to acknowledge, despite saying “I’ll be happy to post corrections/additions to the above list as warranted.”

    The article raises the question “Does a thermal gradient develop autonomously in a gravitational field, or do isothermal conditions prevail?” and I quote, This is the big question. In fact, I call it the $100 billion dollar question, because that is the type of money which will be given to developing countries each year, not for humanitarian aid, but for carbon dioxide aid, which would be totally useless if a thermal gradient does in fact occur autonomously.

    Referring to the Second Law of Thermodynamics, I wrote that it requires “the greatest entropy amongst the states accessible to the system” and it is effectively saying that is as far as we can go within the restrictions imposed by our isolated system.

    After detailed discussion of how potential energy (PE) converts to kinetic energy (KE) I wrote, If we have a perfectly insulated cylinder of nitrogen (where we will assume no external energy can be added, and no internal energy removed) then the state of “greatest entropy” is clearly that in which the sum of (PE+KE) is the same in all regions within our cylinder. This conclusion is confirmed by considering what would happen if there were a region in which (PE+KE) were greater than in another region. If this were the case, then the region with more energy could “do work” as it transferred energy to the other region …Hence our final equilibrium state in the vertical cylinder of non-radiating nitrogen has the same entropy in all regions, and we call it an isentropic state. But such a state in a gravitational field must then have less KE where it has more PE at the top, and more KE where it has less PE at the bottom. Thus it is not isothermal, but instead is cooler at the top and warmer at the bottom with a thermal gradient equal to -g/Cp … This is called the “dry adiabatic lapse rate” though it does not require any “lapsing” as is assumed to happen with warm air rising by convection. If there were a maximum amount of water vapour, we would observe the “wet” or “moist” rate, which is about two thirds of the dry rate. The reduction is due partly to the release of energy during phase change, but probably mostly because water vapour transfers heat by radiating it to cooler molecules at higher altitudes in the troposphere, thus having an opposite effect to that of diffusion.

    So, on the topic of this thread, water vapour lowers the absolute value of the gradient (to the “wet adiabatic lapse rate”) and so, at radiative equilibrium, the surface temperature is lower. Less evaporation (if slower winds do in fact cause such) could thus have a warming effect, but a warmer surface (in the tropics for example) would create faster convection, and thus compensating faster winds coming in to replace the upward moving air.

  23. Doug Cotton says:

    Yes John and not a single one of those comments containing any valid objection to my main point, just three other comments in favour of what I say ..

    I appreciate the support from Pochas
    http://www.drroyspencer.com/2013/02/decreased-surface-wind-as-a-contributor-to-warming/#comment-69494

    and from Norman
    http://www.drroyspencer.com/2013/02/decreased-surface-wind-as-a-contributor-to-warming/#comment-69538
    http://www.drroyspencer.com/2013/02/decreased-surface-wind-as-a-contributor-to-warming/#comment-69546

  24. RW says:

    Am I the only one who thinks Doug may be putting us all on?

  25. Entropic man says:

    By inspection, the downward trend in windspeed started in the late 1980s. What else changed around that time?

    The last few years have shown reduced rainfall in the southwestern US, accompanied by increased rainfall in Canada and above average temperatures in the US. Could these and the reduced winds tie together into a northward shift of the climatic zones in which the US once sat?

  26. tonyM says:

    RW:
    “Am I the only one who thinks Doug may be putting us all on?”

    ————-
    No you are not alone. Most of us dismiss his lack of respect for empirical evidence and illogical argument of a crusader for what it is – unscientific.

    I have clearly pointed it out. His answer is he either doesn’t have to respond to the challenge or go take it up with Jelbring as it is not his paper or some deficient explanation which clearly shows a lack of understanding of the chemistry of water when it comes to oceans where the lapse rate is the direct opposite to his hypothesis.

    It rivals Al Gore and some of Hansen and Mann; just opposite teams.

    The likes of WUWT and others have banned him from commenting as they see it giving skeptics a bad name.

    My comments are coming from a skeptic of CAGW who accepts (subject to checks by experimental physicists) the isentropic tendency of the atmosphere on the basis of experiment and argument.

    What he fails to understand is that his arguments do not refute the GHE nor does he acknowledge that equilibrium tendency of the 2nd L of T says nothing of the speed in that tendency. The two can quite happily co-exist. He is simply in denial of this and the the flaws in his argument that he has debunked the GHE effect “1st school of thought.”

  27. Brendon says:

    After reading all comments above I have come to the conclusion that Doug has a problem.

    Regarding Roys idea, 3 things:
    1. Global wind is doing what?
    2. Physics/modelling to support idea?
    3. Published?

  28. Doug Cotton says:

    TonyM

    I have written an article referring to WUWT, SkS and SoD tactics (soon to be published) and I can and have rebutted WUWT on several matters, especially the attempted rebuttal of the gravity gradient with a wire outside the cylinder. That just displays a complete lack of understanding on their part as to how a gradient develops in solids as well. If you had two pipes of water at different slopes, then joined them top and bottom, do you think you would suddenly get perpetual circulation of water? Hardly! Yet that in essence is what Watts claimed. He knows I can rebut his conjectures, and PSI is a threat to his financial interest in his website and valuable domain name.

    You are not looking at any “lapse” process in the oceans. You are seeing the effect of solar radiation warming the top layers, and warmer water then moving downwards by convection and currents. The physics of water tells us that it starts to expand again when it gets colder than 4 deg.C. Hence it is not possible to form ice on the floor of the ocean, because the water merely expands and thus cold water rises and warmer water descends. All such currents completely over-ride the fairly slow process of conduction (diffusion) which, in any event would only create a gradient of about 3C/Km because the specific heat of water is higher than that of air. Experiments have shown that a gradient does occur in a sealed cylinder of water. In fact, it is you who is ignoring over 800 experiments that confirm the thermal gradient, to say nothing of all the experiments that confirm the Second Law of Thermodynamics.

    Where’s your physics? All you present is hand-waving examples which you think disprove what I and Hans Jelbring, and many others are now saying. See the thread on wind here on Roy’s site, for example. Or don’t you dare face the other two commenters who support what I’m saying there?

    And where do you think is there a published rebuttal of Jelbring’s journal paper in some other journal perhaps?

    Where is your personal explanation as to how sufficient energy gets into the Venus surface, or the Earth’s core?

    What two can happily co-exist? The planets have had billions of years for diffusion to set up underlying thermal planes. How do you think the atmosphere near the Venus poles got just as warm as elsewhere on that planet?

    It seems you want your cake and eat it. Your physicists are agreeing that isentropic conditions prevail. That means (PE+KE) is homogeneous and, when in a gravitational field, that means more KE where PE is less, and vice versa. So you’re sitting there basically agreeing with what I’m saying. Yet, Roy is not agreeing in his Point (6) where he claims the atmosphere would be isothermal without WV and GHG. This is the very starting point for the GHE conjecture that WV and CO2 then raised the temperature 33 degrees. They did no such thing. Gravity raised it more, and water vapour reduced it about a third. You explain a GHE that starts with an autonomous thermal gradient already there because of gravity!

    I can explain how the gravity gradient supports the temperature of Earth’s core – a long term mystery of science which it solves. Likewise the Venus surface temperatures, which are certainly not explainable with any back radiation.

    Let’s see your physics, TonyM. Or don’t you know much? What is your personal level of academic qualification in physics? Get your friendly physicists to name themselves (not anonymously like you) and argue openly with me right here!

  29. F. Maxwell says:

    From Wikipedia:

    Common characteristics of cranks

    The second book of the mathematician and popular author Martin Gardner was a study of crank beliefs, Fads and Fallacies in the Name of Science. More recently, the mathematician Underwood Dudley has written a series of books on mathematical cranks, including The Trisectors, Mathematical Cranks, and Numerology: Or, What Pythagoras Wrought. And in a 1992 UseNet post, the mathematician John Baez humorously proposed a checklist, the Crackpot index, intended to diagnose cranky beliefs regarding contemporary physics.[2]

    According to these authors, virtually universal characteristics of cranks include:
    1. Cranks overestimate their own knowledge and ability, and underestimate that of acknowledged experts.
    2. Cranks insist that their alleged discoveries are urgently important.
    3. Cranks rarely, if ever, acknowledge any error, no matter how trivial.
    4. Cranks love to talk about their own beliefs, often in inappropriate social situations, but they tend to be bad listeners, being uninterested in anyone else’s experience or opinions.

    Some cranks lack academic achievement, in which case they typically assert that academic training in the subject of their crank belief is not only unnecessary for discovering the truth, but actively harmful because they believe it poisons the minds by teaching falsehoods. Others greatly exaggerate their personal achievements, and may insist that some achievement (real or alleged) in some entirely unrelated area of human endeavor implies that their cranky opinion should be taken seriously.

    Some cranks claim vast knowledge of any relevant literature, while others claim that familiarity with previous work is entirely unnecessary; regardless, cranks inevitably reveal that whether or not they believe themselves to be knowledgeable concerning relevant matters of fact, mainstream opinion, or previous work, they are not in fact well-informed concerning the topic of their belief.

    In addition, many cranks:
    1. seriously misunderstand the mainstream opinion to which they believe that they are objecting,
    2. stress that they have been working out their ideas for many decades, and claim that this fact alone entails that their belief cannot be dismissed as resting upon some simple error,
    3. compare themselves with Galileo or Copernicus , implying that the mere unpopularity of some belief is in itself evidence of plausibility,
    4. claim that their ideas are being suppressed, typically by secret intelligence organizations, mainstream science, powerful business interests, or other groups which, they allege, are terrified by the possibility of their revolutionary insights becoming widely known,
    5. appear to regard themselves as persons of unique historical importance.

    Cranks who contradict some mainstream opinion in some highly technical field, such as mathematics or physics, frequently:
    1. exhibit a marked lack of technical ability,
    2. misunderstand or fail to use standard notation and terminology,
    3. ignore fine distinctions which are essential to correctly understand mainstream belief.

    That is, cranks tend to ignore any previous insights which have been proven by experience to facilitate discussion and analysis of the topic of their cranky claims; indeed, they often assert that these innovations obscure rather than clarify the situation.[3]

    In addition, cranky scientific theories do not in fact qualify as theories as this term is commonly understood within science. For example, crank theories in physics typically fail to result in testable predictions, which makes them unfalsifiable and hence unscientific. Or the crank may present their ideas in such a confused, not even wrong manner that it is impossible to determine what they are actually claiming.

    Perhaps surprisingly, many cranks may appear quite normal when they are not passionately expounding their cranky belief, and they may even be successful in careers unrelated to their cranky beliefs

  30. Dr No says:

    Doug is useful in one respect. He provides an endless source of what we define as “howlers”. Debunking these provides us with another means for teaching students the basics of atmospheric dynamics and physics.

    I am, however, amazed at his perseverance at turning any topic of conversation into a lecture.

    For example, if I were to say to him: “Nice weather today?”, I bet Doug would respond with: “But not on Venus”

    Or, me: “Did you enjoy the game last night?”
    Doug: “The ball in flight was unduly affected by centrifugal forces and the lapse rate”

    Or, me: “Do you have a recipe for vegetarian lasagne?”
    Doug: “That type of food is only for hippies, left wingers, Al Gore and those dishonest members of the IPCC !”

  31. Doug Cotton says:

    And when are either of you going to come up with your own conjecture as to how the required energy gets into the surface of Venus? No links to other people’s thoughts, which I have probably studied better than yourselves anyway – just your own explanation based on valid physics (as mine is) which would also apply to other planets. including Earth.

    Then, Dr No was asked on another thread to use whatever data he could verify to explain how the troposphere above the Equator is around 50% higher than it is in middle latitudes, due entirely, as he claimed, to thermal expansion.

    So Dr No has two questions which he keeps avoiding like the plague with numerous delay tactics, and others like Maxwell, and the anonymous TonyM and RW also have the question about Venus, which I suggest they should attempt to answer, if only to demonstrate to Roy and all the silent readers that (perhaps) they know some physics, and are thus qualified to comment on the physics of the atmosphere. But they’ll have to dot their I’s and cross their T’s to be cogent in any argument.

  32. Doug Cotton says:

    And let me remind you, Dr No, that you won’t pull the wool over my eyes by comparing temperatures at the same altitudes, thus ignoring the colder temperatures in the extra 6Km at the top of the troposphere above the Equator. The whole troposphere at the Equator and above middle latitudes is to be considered, because it all expands or contracts thermally in order to end up with a tropopause height of about 11Km in middle latitudes and 17Km above the Equator. At least, that’s how you “explain” it – all due to thermal expansion. You can’t ignore those extra 6Km above the Equator. As in a comment on the other thread, my figures are as below, but I will accept variations within reason. So just do your thermal expansion computations and show why figures something like these can, as you claimed, explain the higher tropopause purely on the basis of thermal expansion …

    Temperature at Surface | Tropopause | Mid-point

    The Equator . . . . . 30C | -75C | -22.5C

    Middle latitudes. . . 15C | -55C | -20C

  33. Dr No says:

    Why stop at the tropopause? Why not go to the top of the THERMOSPHERE ??

    “…which extends up to near 375 miles (600 km) above the earth. …The gases of the thermosphere are increasingly thinner than in the mesosphere. As such, incoming high energy ultraviolet and x-ray radiation from the sun, absorbed by the molecules in this layer, causes a large temperature increase.

    Because of this absorption, the temperature increases with height and can reach as high as 3,600°F (2,000°C) near the top of this layer; ..”

    Using your (incorrect) method, the average temperature of the atmosphere must be nearly 1000 deg !!!

  34. Doug Cotton says:

    I’m quite aware of what happens above the tropopause. But if thermal expansion is not significant in the troposphere, then you’d be stretched to prove it significant in the stratosphere and mesosphere. And that’s good enough for consideration of the region in which the ideal gas laws would apply. They become irrelevant in the thin thermosphere which, by the way, would not feel “hot” if you jumped out of a spacecraft up there. Now stop procrastinating and answer the question.

  35. Doug Cotton says:

    PS You are quite welcome to integrate over the full height of the troposphere. You don’t have to use my average figures. As I said, you can use whatever data you wish and whatever method that is valid. My figures are just there to give readers a hint that the weighted mean temperatures would also be similar, since there is a reasonably linear thermal plot in the troposphere. It’s blatantly obvious that you are not going to be able to explain the difference of about 50% in height, even with a difference of perhaps 10% in weighted mean temperatures. If you procrastinate any more with red herrings I think we can all assume you give up.

  36. Doug Cotton says:

    F Maxwell:

    Just like your namesake in the 19th century, you are seriously mistaken if you think that there is no propensity for an autonomous thermal gradient to evolve in a gravitational field. You and other “cranks” like James Hansen and Michael Mann, latched onto this false conjecture that temperatures could be isothermal and, just like the “cranks” you write about, your “crank theories in physics typically fail to result in testable predictions.” In sharp contrast, the gravity gradient explains surface temperatures on the six planets with significant atmospheres, as well as explaining the way in which Earth’s core temperature is maintained. It could even be used to predict core temperatures in those other planets, which maybe future technology will verify one day.

  37. tonyM says:

    Doug my remarks were directed to RW just to assure him that we are not all asleep.

    You would do us all a favour if:
    1) you studied the phase diagrams of water
    2) try to understand the chemistry and physics of “impurities” in a substance
    3) try not to be illogical in suggesting that warm water will cool colder water – but not sufficiently to cool it to ice because of density at the bottom of oceans.
    4) Go and learn more about entropy; it says nothing about how long it will take.
    5) while you are at it go learn more about lapse rates and convection. A lapse rate does not independently set the surface T

    For those of us more practical, my points are that at extreme pressure the freeze point of water is reduced (look at ice skaters), salts in water also reduce freeze T (look at brine LIQUID at much lower T than 0C). The freeze and density plots of salt water at depth are different to pure water at 1 atm pressure. Crikey we are talking of over 1000 atm at depths.

    None of us could ever have thought that warmer water from the bulk of the surface of the oceans could ever create ice by mixing with colder water at depths – except Doug. Quite irrelevant!

    We are talking about the surface T PLUS say 33deg C at the extreme depths according to the lapse rate of water. It has had billions of years to do so. It just is not there. That is the empirical evidence. Anyone like to refute it?

    Circulation and convection from the top, that Doug talks about, would help it warm to that level. What has ice got to do with this? The lapse rate instead goes the other way. It is far, far colder at depths.

    Such depths do exist around Japan. We now need be are reminded that any magma flowing at those depths around Japan is due to the heat being transmitted from the cold ocean T into the earth (yeh well that seems to be the new physics).

    As for your ad hominems and clutching at authority argument or supporters it is simple:
    let them rebut what I have said with logic as you certainly have not been capable.

    The GHE does not rest on whether the tendency is to isothermal or isentropic. It does not even rest on what T it would be without an atmosphere. Quite immaterial. WE don’t have such conditions but for a start we would have much less albedo. By Doug’s own admission in the flawed argument of trying to falsify the “1st school of thought” he indirectly confirms the GHE.

    This is coming to you from a skeptic of CAGW! And no, I don’t have a battery of scientists backing me. If most PSI really back your paper- then sadly it does not say too much in their favour. My argument with you has been very open. Why do they not tear it to bits if they can continue to agree totally with your paper?

  38. tonyM says:

    Correction:
    It does not even rest on what T it would be without GHGs. Quite immaterial.

  39. Doug Cotton says:

    You’re no skeptic, Mr Anonymous TonyM: You still believe in the physically impossible greenhouse effect. I suppose you would also “explain” that’s how about 10W/m^2 of insolation reaching the Venus surface heats it to 730K.

    Still waiting for your alternative explanation of how the required energy gets into the surface of Venus.

    The oceans are not perfectly still waters without any Sun shining in at the top. Have you ever seen calculations as to how far radiation penetrates the oceans, and how its intensity falls off the further it penetrates. Hence the temperature falls very rapidly from around 20C right down to 4C all in relatively shallow water near the top. This has nothing to do with any diffusion process and it completely over-rides the diffusion which is a VERY slow process.

    And how well does your greenhouse conjecture calculate the core temperature of Venus – somewhere between 5800 and 7000K I estimate from the gravity gradient.

    You’ve not provided any proof from physics that the Second Law of Thermodynamics can in fact be violated in order to accommodate your most unphysical conjecture about 33 degrees of warming from some imaginary surface temperature in some imaginary isothermal state by some imaginary process involving radiation from a cooler atmosphere heating a warmer surface.

    Don’t forget to explain the Venus surface and core temperatures, as I can.

  40. Doug Cotton says:

    It seems I have to spell out the detail as you are obviously not able to work it out for yourself from the “hints” I gave you before to try to make you think for yourself, Tony anonymous.

    All that is relevant regarding the oceans is the region below that which is warmed above 4C by penetrating solar radiation.

    This region (at least 80% of total typical depths) displays a gradual decline from 4C down to about 2C at the deeper end.

    In the atmosphere it gets less dense in the troposphere as you go up and temperatures get cooler.

    Got that? Temperatures get cooler as air expands going up.

    But, below 4C, water expands going down. So temperatures get cooler going down.

    I thought you could have worked out that was what I was implying when I advised you of this most unusual, unique characteristic of water, which has its maximum density at 4C. Didn’t you know that? You could have looked up good old Wiki: http://en.wikipedia.org/wiki/Properties_of_water

    Hence, in the majority of the ocean depth, there is warm water falling by convection – just the opposite of the atmosphere because this water (below 4C) gets less dense as you go down – the opposite of air in the tropopause. So the gravity gradient changes from negative above 4C to positive below 4C. But above 4C it is eclipsed by penetrating solar radiation warming the water you swim in.

    The water would get colder still (below 2C) but for the fact that there is a continual supply of warmer water from above. In general, the currents and convection flows thus generated over-ride what would happen by diffusion in totally still water.

  41. Brad says:

    42 comments, this makes 43, and 17 are Mr. Cotton’s.

  42. Albedo is the key to temperature control for Earth

    The rapid response of temperature to night and day and the rapid response of temperature to winter and summer does explain what we need to know. Earth temperature is never very much out of balance. Daytime temperature does peak in the afternoon. There is a two or three hour lag for temperature to catch up with whatever out of balance that exists. Then there is the longer imbalance with seasons. The hottest day is not on the longest day. Every winter it does snow and snow extent increases. Every summer ice melts and snow extent decreases. This difference in albedo does explain the lag, most of the lag. Some lag is in how long it takes to cool and warm water. If you look at a major warming period and a major cooling period and pick the point on each where the temperature is the same, then you have picked the point where albedo is the same. There is no major imbalance of temperature that is causing the increase or the major decrease. There is no major imbalance that is causing ice volume increase on one and is causing ice volume decrease on the other one when the temperature is the same. That would defy the laws of simple physics.
    Ice is retreating and causing warming on one and Ice is advancing and causing cooling on the other.
    Ewing and Donn were absolutely correct when they proposed this theory in the 1950’s.

  43. tonyM says:

    Doug Cotton:
    You are in great need of help; scientists do not argue as you do.

    You are of the idee fixee genre; science by diktat. Join the Al Gores and Michael Manns of this world. I note Al Gore refuses to answer questions about his beliefs. At least he does not attribute wild hypotheses to others. You simply answer with inanities by dissembling, evading, conflating and obfuscating; in plain language you are squirming.

    Just stick to trying to understand your own hypothesis rather that deciding hypotheses for me or others. You have a poor understanding of logic and by your answers clearly demonstrate a lack of fundamental understanding of physics and chemistry where it is appropriate.

    Did you look up the phase diagrams for water as I asked? Obviously not. Do you still adhere to your fallacious belief about salty water turning to ice at 1000 atm and 0C? Obviously you do. Do you still believe that the base of the oceans can’t be frozen by the warm waters at the surface because ice density is lower than the density of water at 4 deg C (your view)? Tap..tap…irrespective, warm water could not freeze colder water whether it is at the bottom or at the top!!!

    You referred me to Wiki. Only a fool could not grasp its meaning! It is what I asked you to try and grasp. And it doesn’t even cover the extreme depths/pressures. From Wiki:

    “However, the salt content of oceans lowers the freezing point by about 2 °C and lowers the temperature of the density maximum of water to the freezing point. This is why, in ocean water, the downward convection of colder water is not blocked by an expansion of water as it becomes colder near the freezing point. The oceans’ cold water near the freezing point continues to sink.”

    Did this just go over your head? Do you want another go at changing your poor grasp of physics with some more condescending nonsense answer?

    Do you still hold to your lapse rate hypothesis for sea water when after billions of years the deep oceans are coolest at the bottom? The lapse rate according to you is what dictates the T at the bottom.

    This bottom T should be easily calculated if one knows a T at the surface according to your hypothesis. Why does it not work in the oceans?

    Go re-read your litany of nonsense answers and comments that we have had to endure.

    You have by your own argument in your paper indirectly confirmed the existence of a GHE.

    You have also confirmed by your own explanations that you have not got a clue about oceans and why your hypothesis fails there. You claimed it holds for water. This debunks your own hypothesis.

  44. Doug needs to be ignored, which is what I am doing.

    Dr. Spencer this a great article ,agree on all the points you bring up.

  45. Entropic man says:

    salvatore del prete

    Loking at Judith Curry’s site recently, I was sruck by her post on etiquette when writing comments. Three points in particular struck a chord, and I intend to follow them as far as possible in future.

    Stay on topic.

    Do not insult others.

    Do not feed the troll.

  46. Dr No says:

    Back on topic. Some points from Roy’s post:
    (1) Roy agrees that US surface temperatures have increased.
    (so we can now dismiss the silly arguments over the representativeness of the observing network)

    (2) If the analysis is correct, then the real question is what could cause such a large scale significant trend? The effect of enhanced greenhouse gases cannot be ruled out given that its effects are global and are just as likely to affect pressure patterns and winds as any other factor.

    (3) Linking the wind speed changes to El Nino events is unsupported. The graph shows little correspondence between with these events. For example, we have just experienced one of the largest La Nina events on record (2010-2011) yet the wind speed was weakest.

  47. Doug Cotton says:

    Herman I would say most of the lag “is in how long it takes to cool and warm water”

    There is no physical reason at all that implies that the Sun cannot keep on warming water when the Sun passes its zenith. It is still sending radiation which is of course from a far hotter source. The water only stops warming when it gets to the temperature which matches that for the incident radiation as that radiation is declining in the early afternoon.

    There are no grounds for assuming that the water warms fast enough on a hot summer morning to keep up with the increasing level of Solar radiation. That’s why the sand gets hotter first – it’s all to do with relative specific heats. In the case of oceans, radiation penetrates the upper level of the ocean, warming it from about 4C to about 20C. The vast majority of the ocean is between about 2C and 4C.

    In summer, the days are longer and the insolation stronger, so the ocean and land surfaces don’t cool as much at night as they warm during the day. Hence there is a build up of energy stored from one day to the next. The reverse happens as winter approaches. .

  48. Doug Cotton says:

    Anonymous Tony: It is well known that the freezing point of salt water is below 0C. When did I say otherwise?

    If there is far warmer water above (as there is in the warm surface layer of an ocean – all above 4C) then heat will travel downwards by adiabatic convection and diffusion processes which are so slow that they cannot be detected as “currents” but which have acted over the life of the Earth, over-riding the gravity induced gradient which is only around 3C/Km in absolute magnitude.

    It is not correct to say the bottom temperature should be able to be calculated from the 20C temperature at the surface, because the gravity gradient is obviously over-ridden by the gradient due to declining radiation.

    You are completely ignoring the rapid temperature decline which is due to the absorption of Solar radiation as it penetrates deeper. Look at any ocean temperature plot and it is nothing like linear. There is a very distinct warm layer with a steep gradient from 20C at the surface down to 4C at the level where direct radiation becomes ineffective. I have already explained this in an earlier comment. Why do you ignore such explanation, without offering any valid counter argument about the warm surface layer? And you have the hide to talk about how scientists should argue.

  49. Doug Cotton says:

    Entropic Yes – that’s why I don’t feed the trolls who continue to promulgate the greatest fraudulent hoax of all time – namely that water vapour has a warming effect when it is well known that it leads to a less steep thermal gradient, and thus lower surface temperature.

    The hoax will cost lives in developing countries and seriously affect the economies of the developed.

  50. Dr No says:

    Doug,following your logic,
    if we added a lot more water vapour to the atmosphere the world would get cooler
    or
    if we somehow dried out the atmosphere, the world would get much warmer

    How does that make sense when the most humid regions around the world are the hottest and the driest regions (e.g. Antarctica) are the coldest?

  51. Doug Cotton says:

    Just to clarify, radiation levels adjust automatically so as to be in balance in so far as net radiative flux at TOA. Measurements of net radiative balance do not disprove this basic fact of physics. Such measurements rarely show a difference of more than 0.5% – and even that could be just error in measurement.

    Hence, the overall level of the plot of temperature against altitude in the troposphere will adjust up and down in parallel positions. The gradient is determined by (a) the acceleration due to gravity (b) the mean specific heat and, when water vapour and radiating molecules are added, (c) by intra-atmospheric radiation, which transfers heat always from warmer layers to cooler ones, which are generally above in the troposphere. Hence this radiation has a propensity to reduce the slope. It is well known that the wet adiabatic lapse rate is only about two thirds that of the dry one.

    But, for radiative balance, the area under the corresponding plot of outward radiative intensity has to remain constant. Hence that plot, and so also the plot of temperature against altitude must both rotate (swivel) around some intermediate point between the surface and the tropopause.

    Hence, when the gradient (AKA lapse rate) is less steep, the equilibrium surface temperature will be cooler. We see this in moist Equatorial areas where, for example, Singapore daily maximums never go above about 33C. But in dry tropical deserts, when the sun is also directly overhead in summer, we can get maximums in the mid 40’s.

    Water vapour cools. Thus there is no positive feedback upon which the IPCC stakes their claim that any carbon dioxide warming will be magnified. But carbon dioxide also reduces the gradient by a minuscule amount, due to (c) above, maybe reducing surface temperatures by about 0.1C.

    Now let’s see how the trolls respond without a word of valid physics.

  52. Doug Cotton says:

    To all::

    Dr No’s misunderstanding of the process I have been describing is glaringly obvious. The mean level of the plot does not represent the level at every latitude, summer or winter. Did I not make it abundantly clear in my paper and various comments (such as in the first paragraph above) that incident radiation levels have to be balanced by outward levels. So the insolation levels obviously vary in different locations and in different seasons, thus altering the whole level of the thermal plot.

    How on Earth could he have missed such an obvious point that the whole level of the plot rises and falls in parallel, even between day and night? My point in comparing Singapore and tropical deserts was that each can have the Sun directly overhead twice a year, and so insolation levels could be similar on such days in clear conditions. But then extra water vapour appears to limit maximum temperatures. I would suggest that an analysis of moist regions versus dry regions, all in the tropics on clear days with the Sun at its Zenith would be very interesting.

    Maybe Roy could take on this project?

    You’ve still got those two questions to answer, Dr No, you know.

  53. F. Maxwell says:

    Mr Cotton:

    Among the many ridiculous things you repeat ad nauseum, my favorite is that nobody can explain the temperature on Venus except you.

    Let’s investigate this one, OK?

    * JB Pollack, OB Toon, R Boese – Journal of Geophysical Research, 1980 (that would be 33 years ago).

    They compare a radiative-convective model with the data from the (then recent) data sent back from Pioneer. Note the excellent agreement of their model up through 90 kilometers shown in Fig. 2. In the abstract, they state, “We find that the observed surface temperature and lapse rate structure of the lower atmosphere can be reproduced quite closely with a greehouse model that contains the water vapor abundance reported by the Venera spectrophotmeter experiment.”

    So, Doug Cotton. It appears you are wrong about nobody being able to explain the temperature on Venus.

    If you want something a bit more recent, then read
    “The Recent Evolution of Climate on Venus”, Mark A. Bullock, David H. Grinspoon, Icarus, Volume 150, Issue 1, March 2001, Pages 19–37.

    They run a climate model of Venus and compare the temperature profile up to about 80 km in fig. 2 to
    observations from Magellan spacecraft. The model predicts the temperature very well. They even can model the gaps in the spectrum in the outgoing radiation from Venus corresponding to CO2, H2O, SO2, and OCS, which are caused by (gasp!) the enormous greenhouse effect on Venus (see fig. 3).

    So Doug, you should read these papers, and then read the papers that they cite, and then read the papers that cite them. You might learn something.

    Oh, and you could also admit that you are wrong when you say that nobody can predict the temperature on Venus except you. Scientists have been doing this for over 30 years.

  54. Doug Cotton says:

    No Mr Maxwell. They make the same old huge mistake of imagining Solar radiation absorbed by the surface can then be magnified (perhaps over a thousand times) by radiation going backwards and forwards between the surface and the atmosphere. Only about 10W/m^2 gets into the surface directly from the Sun. How about you read the references in my paper, such as http://ruby.fgcu.edu/courses/twimberley/EnviroPhilo/FunctionOfMass.pdf

    You are wasting my time, because you refuse to read and understand what I have been saying, along with quite a few others.

  55. Dr No says:

    Doug, why does it get so cold over dry deserts at night?
    Why is it that proximity to water means mid overnight minimum temperatures compared to inland?

    Please explain how this fits with your idea that more water vapour cools the surface, and less water vapour heats the surface.

  56. Doug Cotton says:

    For islands and coastal cities you will get breezes and winds bringing in air which is about at sea surface temperatures due to diffusion processes at the interface. Regarding the data I suggested that Roy might look into, it would be best to select calm days. You can’t make a valid comparison unless you have several measurements over at least a 24 hour period. It’s pointless saying deserts are cold at night. They are in fact not so cold on calm nights after the calm, cloudless, mid summer days I have been talking about. The required data has not been analysed, so it is not scientific just talking about hot days and cold nights without any actual data.

    I am discussing the physics which, on a world-wide annual mean basis shows that the thermal gradient is less in moist regions, not so much due to the release of latent heat, but due to intra-atmospheric radiation in which water vapour plays the major role, and carbon dioxide contributes a minuscule amount compared with all the water vapour.

    My guess would be that doubling carbon dioxide would lead to a cooling of about 0.1 degree. You can’t disprove the general concept of an autonomous thermal gradient, because any attempt to do so would be assuming a violation of the thermodynamic equilibrium, which the Second Law of Thermodynamics says will evolve.

    If you don’t get your physics right to start with, your models are totally wrong. Roy needs to realise the significance of the fact that there would not have been an isothermal atmosphere initially. After all, what small percentage of water vapour would be required to make the plot suddenly get “propped up” by that 33 degrees? Physics doesn’t work that way. The thermal gradient was always there, and all oxygen and nitrogen molecules can absorb some incident Solar radiation, just as they do in the thermosphere.

  57. Dr No says:

    You still dont get it.
    The gradient is always there when you have a well mixed gas. I think we agree on this point.

    The key point you fail to address is that it is anchored to a point at some height within the atmosphere.
    The location of that point is crucial.
    It depends on the radiative properties of the atmosphere, meaning the amount of co2 and water vapour.
    The more of these gases, the higher this point.
    This point is high for Venus, hence the hot surface temperatures.
    It is somewhere about 5 to 6km above the surface for Earth, hence our warm surface temperatures.
    It is zero on the moon, so the temperatures there are close to those of outer space.

    This is how it works. The location of the hinge point is the key – not changes in the gradient.

  58. F. Maxwell says:

    OK, let’s recap:

    Doug Cotton: Only my theory can predict the temperature on Venus

    F. Maxwell: Actually, the standard theories of atmospheric convection and radiation fits the observations of Venus from probes and satellites over the last 30 years remarkably well, not only at the surface, but up to 90 km, including a marked gradient shift around 60 km.

    Doug Cotton: But they are wrong, and I am right! Read my paper.

    —————————————

    Doug, I have read your “papers”, and as you see I have read a whole lot of other real papers, in real journals, by real scientists who use real observations and quantitative physical models. You will have to forgive me for not
    siding with you.

    F.M.

    P.S. From wikipedia (one of your favorite sources)

    3. Cranks rarely, if ever, acknowledge any error, no matter how trivial.

  59. Doug Cotton says:

    You have no valid reason for saying “The more of these gases, the higher this point.” Are you also forgetting the T^4 relationship?

    You can’t take short cuts with me. You have to explain the physics.

    And, seeing that you can’t explain any valid physics relating to those two questions, I’m not answering your questions until you do. You are still assuming thermal expansion, and yet I have shown you that is inapplicable, and you had no response to that.

  60. Doug Cotton says:

    If they have a good brain in their head, and their cogitations agree with valid physics, they are more “real” than the likes of James Hansen and Michael Mann.

    I don’t respond to “appeals to authority” such as to Maxwell’s wishy washy dismissal of Loschmidt’s gravity gradient.

  61. Doug Cotton says:

    If you can’t understand my comment above, then maybe you will understand a more detailed explanation in an expanded version of my PROM paper which I’m working on. As I’m busy with that now, I’ll just have to ask you to wait.

    However, I do think it’s clearly explained here though …
    http://www.drroyspencer.com/2013/02/decreased-surface-wind-as-a-contributor-to-warming/#comment-69620

  62. Doug Cotton says:

    The question about Venus is not to do with the fact that the lapse rate from the surface to the tropopause agrees with observations. We all know it does.

    But radiation back and forth between the surface and the atmosphere does not magnify the original direct insolation energy (about 10W/m^2) over a thousand times.

    Radiation from a less hot atmosphere on Venus cannot transfer thermal energy to the hotter surface, as all the incorrect papers seem to think it can, thus generating free energy.

    How does the required energy get into the surface of Venus?

    The answer is not in any paper which claims a runaway greenhouse effect does it. Standard physics tells us it can’t. I have explained it, as well as the process which keeps planetary cores hot. When you understand what I am saying (whether or not you believe it) then you may be ready to discuss the physics. Until then you are all just wasting my time.

  63. Doug Cotton says:

    “The gradient is always there when you have a well mixed gas. I think we agree on this point.” No we don’t. I never said anything had to be “well mixed” now did I? Pure nitrogen would do. What is there to mix in that case?

    It is somewhere about 5 to 6km above the surface for Earth No it’s probably not. Where are your computations? It may be between 3Km and 4Km when you allow for the T^4 relationship.

    The plot of radiative intensity is a curve, anyway, because of the T^4 relationship. You keep ignoring this. We are not talking about some average temperature, or some altitude at which radiation at that temperature happens to correspond with the required amount.

    You have to calculate when and where total outward radiation from the surface and all altitudes equals inward radiation. And radiation has to be calculated (and integrated over the curve) using SBL with its T to the fourth power relationship.

  64. F. Maxwell says:

    I am done wasting your time, Doug.

    If you can find time away from ruining Dr. Spencer’s blog
    with posts, let me suggest one more thing to read.
    Since you apparently have already read (and dismissed)
    every paper ever written on atmospheric physics, I
    recommend the book “When Prophecy Fails”. Even
    though it is not about math or physics, it
    is still one of my favorite books from my
    undergraduate days.

  65. Doug Cotton says:

    I’ve said it many times, but it seems I need to once more. The area under the plot of outward radiative flux has to be kept constant as the gradient alters between dry and wet rates, the latter being less steep. Simple geometry then shows us that the surface end lowers and the tropopause end rises. There is no net thermal expansion of any great significance, because some regions cool and others warm.

  66. Doug Cotton says:

    “When Prophecy Fails” – yes like IPCC prophesy. My prophesy of future temperatures (with slight cooling till 2027) was archived on my website in August 2011 and hasn’t failed yet. Sure there will be slight warming in 2013, but cooling will follow from mid 2014 though 2015 and then, in a general trend towards 2027. Long-term 500 year cooling starts 50 to 200 years from now.

  67. Dr No says:

    Doug, you keep mentioning the T to the fourth power relationship. That only applies to pure black bodies, such as the surface of the Earth.
    The gases and the atmosphere are NOT black bodies, therefore you are wrong again.

    You have not explained why it gets so much colder above a dry inland region at night compared to a comparable oceanic or coastal location.
    According to your logic, the humid regions should be colder and the drier regions warmer. Try telling that to the Siberians in the middle of winter when their weather is dominated by anticyclonic conditions and calm, clear nights.
    According to you, they should be comfortably warm.

    Dont try and and dodge this simple question by querying the data. You know your claim is preposterous.

  68. steveta_uk says:

    3. Cranks rarely, if ever, acknowledge any error, no matter how trivial.

    OK, let’s try this one.

    According to Doug “That’s why the sand gets hotter first – it’s all to do with relative specific heats.”

    So the relative specific heats between sand and sea explain why the sand gets hotter first.

    It has nothing to do with water being transparent, whereas sand it largely opaque.

    It has nothing to do with water being able to convect, whereas convection currents in sand are less often observed.

    It has nothing to do with water being able to lose heat by evaporation, whereas dry sand tends not to evaporate readily at beach temperatures.

    Ignore all this – because that’s all based on no-doubt discredited physics beleived by scientists. The real scientists, of whom there are only a few; those few who really understand thermodynamics, they all know that it’s all to do with relative specific heats.

    The man’s a genius – no question really.

  69. Doug Cotton says:

    steveta_uk The one thing you forgot, as most climatologists do, is conduction. Of course heat transfers among sand molecules which heat the air molecules between them and the air molecules then heat other sand molecules. I have spoken numerous times about radiation penetrating water and thus creating a warm layer at the top of the ocean. There is also a warm layer in the very outer crust – for example some small way into the rocks, sand and soil. But the specific heat of salt water is about four times that of sand.

    My “logic” does not say anything in particular about the climate in any area. If radiation levels, or cloud cover vary then that’s no problems as temperatures will adjust accordingly. My “logic” talks about world wide climate. Without water vapour you’d have no clouds to shade you, and far less radiation clearing the heat out of the atmosphere. Your way out in saying t^4 doesn’t apply, just because we need to multiply by emissivity. Since the surface has higher emissivity than gases, that’s another reason why the pivoting altitude may be between 3Km and 4Km. That reduces the sensitivity to water vapour, but it is still negative sensitivity and you can’t prove otherwise.

  70. Doug Cotton says:

    No Dr No That only applies to pure black bodies, such as the surface of the Earth.

    Incorrect.

    See the para in bold above as that was meant to be addressed to you. You’re way out in saying t^4 doesn’t apply.

  71. MikeN says:

    There is global gridded data from waste heat? I think you misunderstood the comment. Where people live, the waste heat produced is pretty substantial.

  72. MikeN says:

    Now let’s chart the wind speed vs windmill deployment.

    It is clearly the windmill producers that are causing global warming, and civilizational collapse. They and the solar energy producers are interfering with the natural order and stealing energy intended for the ecosystem. The only way to prevent this oncoming collapse of the planet’s ecosystem, which includes sea level rise, ocean acidification, melting of the ice sheets, drought, hurricanes, floods, deforestation, and war, is to change the energy mix towards getting our energy from below the ground, far away from the ecosystem, and tapping the energy of billion year old decayed matter.

  73. steveta_uk says:

    “Now let’s chart the wind speed vs windmill deployment”

    Ah, I see it all now – the sun and wind energy are being collected in remote locations, thus stealing the nation of it’s wind speed, and shipping that energy via the grid into the cities, and thus the enhanced UHI effect that Roy has discussed is the same problem as the missing wind effect!

  74. Dr No says:

    I repeat, you have not explained why it gets so much colder above a dry inland region AT NIGHT compared to a comparable oceanic or coastal location.
    Tell us what you think takes place.

    It has nothing to do with lapse rates and therefore your logic fails completely.

  75. Doug Cotton says:

    Dr No

    This will have to be your last physics lesson from me. I’m busy expanding my paper in a revised version due out in a week or so, as well as an article entitled “Roy Spencer’s Misunderstood Misunderstanding” which will be read by tens of thousands.

    Tell us what you think takes place.

    The Sun goes down so it gets colder in both areas. But diffusion and horizontal convection from the warmer ocean keeps the coastal areas not so cold. That’s why Singapore, as a low lying island, has its climate significantly modified by such heat transfers back and forth between the atmosphere just above the ocean, where that atmosphere has its temperature controlled by diffusion between it and the ocean surface.

    I repeat, you have not explained how the required energy gets into the surface of Venus.

    Nor have you admitted your error in assuming thermal expansion is the main reason for a higher tropopause above the Equator compared with the height at middle latitudes.

  76. Doug Cotton says:

    (continued)

    Radiation can only transfer heat from warmer regions to cooler regions. Above the tropics in calm conditions the thermal gradient is a fairly uniform 6.5C/Km throughout the 17Km high tropopause.

    So all heat transfer by radiation is upwards to cooler regions. Energy makes its way out of the atmosphere more quickly when water vapour is in abundance, because the radiation process is more effective when there are more radiating molecules.

    Hence radiated energy makes its way upwards at the speed of light in a random path between (mostly) water vapour molecules. Whenever it heads back down to lower layers of water molecules or the warmer surface, it cannot transfer heat and it merely gets immediately re-emitted in a “pseudo scattering” process described in my March 2012 paper on Radiated Energy on the Principia Scientific International website.

    So the maximum daytime temperatures are cooler when moisture is present than they would otherwise be if there were no water vapour and energy is thus trapped in a slow moving non-radiative process involving convection.

  77. Norman says:

    I have been reading the many posts of Doug Cotton Vs. the Rest.

    My thinking is that the whole issue could be resolved with some actual science (that is experimentation like any good scientist would do).

    It is similar to the days of Galileo. It was assumed (via common sense) that heavier objects fell faster in a gravity field. Galileo did what any good scientist would do. He actually tested the idea on top of the Leaning Tower of Pisa. He dropped different weights and observed the outcome.

    All I read are thought experiments and math equations for the most basic premise of Greenhouse theory. A colder object (atmosphere) is able to transmit heat to a warmer object (Earth’s surface). Roy Spencer presents a thought experiment on the topic concluding a colder object can warm a warmer object. The folks at PSI totally disagree with this view. Why is it always thought experiments? Why not a real test. I am sure any University physics professor could easily get funding for this most important research.

    This is the best way to settle an issue, with actual experimentation. I do not know why a series of such tests have not been performed. Roy Spencer has a nice suggestion with having a heated object enclosed in a cooled sphere with an evacuated atmopshere (vacuum) so only radition effects are present. In one test the heated object is alone, next test is to put another object in the sphere with the heated item. Roy believes the other object will transmit radiant energy to the warmer one and increase its temperature. Doug Cotton would believe the energy cannot be absorbed and will just scatter. Who is correct? That is what experiments are for. When will such experiments be run?

  78. tonyM says:

    Doug is a character and says many things. But this is one the daddy of them all – which he has repeated. As he has repeated it, clearly it is not an error on his part but what he genuinely believes. Paraphrasing, he says that warm water on the top of oceans is convected/diffused down and OFFSETS the slow gravity induced lapse rate.

    Really! Go read! The lapse rate from his own hypothesis IS supposed to send the temperature in the SAME direction as his stated convective/induced warmth. That is the hypothetical lapse rate is supposed to INCREASE the T as one descends in the oceans to the base (like Venus increases as one goes down to the surface say). So they would reinforce each other: + plus + = bigger +

    A + B = C, both real positive numbers so that “C” is greater than either.

    Only Doug could make “C” turn into a zero or in reality a negative as the empirical lapse rate turns out to be in the opposite direction (i.e. actual C is -ve) after billions of years. Thus the bottom of depths of oceans is close to zero whereas his lapse rate conjecture predicts around 45C+ avg – much like the increase in T on Venus TOA to surface direction. Don’t you know about Venus yet?

    But then, only Doug could make a two headed coin come up tails to support his argument.

    Doug, reminds me of a schoolteacher. If one repeated a mistake he would haul the offender in front of the class, grip him by the ear and say:
    “You’re a goose, son, a goose! What are you son? A goose son, a GOOSE!”
    as his face went scarlet and the rest of the class sniggered.

    So Doug in his paper has now succeeded indirectly in confirming the existence of a GHE and also now falsifies his own hypothesis of gravity induced lapse rate – certainly for salty water.

    But there is a positive side to all this which I will cover in a separate comment.

  79. tonyM says:

    A friend of mine and I went through this and parts of other threads. There were a lot of thoughts – opinions – thrust and counter thrust. All well and good in Science. Often quite healthy.

    But we could not stop laughing! Try reading this thread with a bit of an open or loose mind. Hilarity abounds. Of course there can only be one main character – you guessed it, Doug Cotton! He dominates. I don’t say that derogatorily – sincerely.

    This could make the basis for a script in science comedy. Unique! Science comedy is rare. Not sure of the comedy genre but comedy it is. Not sure who could play Doug – inimitable!

    Dr Spencer you may be the copyright owner of some valuable material here – good luck! Doug could make millions too; he only has to continue writing.

  80. Dr No says:

    tonyM,
    I agree. Doug is a treasure, but I cannot imagine who would play him in a comedy. The Sheldon Cooper character (from Big Bang Theory) comes to mind – except Sheldon knows what he is talking about!

  81. Doug Cotton says:

    Re experiments

    Over 800 experiments have been done since 2002. See Ref [13] in my paper “Planetary Surface Temperatures” on Principia Scientific International website / PROM menu

    TonyM Your statement “The lapse rate from his own hypothesis IS supposed to send the temperature in the SAME direction as his stated convective/induced warmth” proves that you have absolutely no understanding of what I have discussed about extra energy spreading out in all directions over the sloping thermal plane, with Solar energy even supporting the temperatures in the mantle and core. See what I mean! You have no idea! Better wait for the expanded version of the paper which is designed to explain it all in simpler language that you might follow better. The original version was for those who know advanced physics.

    Of course the rest of your comments are irrelevant because you don’t get off Square One with your understanding of the new paradigm.

    Yes, I join with RW in laughing at your comment. And Dr No puts himself in the same boat as yourself – except I never even expected him to understand.

  82. tonyM says:

    Doug must have a whole pocketful of double headed coins which at will come up tails.

    Here it is from Doug earlier…
    “If there is far warmer water above (as there is in the warm surface layer of an ocean – all above 4C) then heat will travel downwards by adiabatic convection and diffusion processes which are so slow that they cannot be detected as “currents” but which have acted over the life of the Earth, over-riding the gravity induced gradient which is only around 3C/Km in absolute magnitude.”

    Now he is replies that I don’t understand that “downwards” is not really downwards but is any other direction but downwards.

    Sort of “up” is upside down and down is downside up – more of the magic mushrooms and Alice in Wonderland stuff!

    So yet again it turns out to be tails!!

    Master of magic; clown of science. Think of Venus, son, think of Venus; how do you explain it?

    We are now promised double tailed coins flipping to heads in some new comedy sketch in progress. Alice is alive and well.

  83. Paul says:

    If earth’s temperature is just an expression of the amount of energy in the atmosphere and we are discussing and arguing over how much energy the sun provides earth and what happens to the energy whether it is retained or lost then I’ve always thought we should include in our discussion how energy is used.

    Any discussion on how energy is used should include total life on earth. If life on earth increases we are storing more energy in life forms, whether human, animal, amoeba, plant life…whatever.

  84. Doug Cotton says:

    No it’s not “just an expression of the amount of energy in the atmosphere.” You can’t prove that.

  85. steveta_uk says:

    So all heat transfer by radiation is upwards to cooler regions.</blockquote
    Doug, you probably won't believe this, but nobody would disagree with this.

    Your confused idea that "back radiation" involves heat transfer from cooler to warmer regions is simply that, a confused idea.

    Back-radiation is just radiation – it is not heat. Heat is only transferred from warmer to cooler objects. Nobody disagrees with this. Back-radiation is radiation, it is not heat. Radiation can transfer energy between any two objects whatever their temperatures, but cannot transfer heat from cold to hot. Nobody thinks it can.

    Energy makes its way out of the atmosphere more quickly when water vapour is in abundance, because the radiation process is more effective when there are more radiating molecules.

    Now here we have simply hand-waving conjecture. Just stating it doesn’t make it true.

    Simple empirical evidence would appear to contradict this, for example the way deserts lose heat rapidaly at night, despite very low water vapour in the regions.

    However, simple empirical evidence such as this can be wrong, so needs to be reinforced with a physical explanation. And the fact that dry air is more transparent to IR would appear to provide such an explanation. So when you content the opposite, you need to provide some detail, not just a statement that the radiation process is more effective.

    This seems to be analgous to claiming that you can see further in fog than in clear air, because the water droplets in the fog can capture and retransmit the photons more effectively than dry air. The ‘capture’ part is true, so despite dispersal, shouldn’t a foggy day be brighter than a clear one?

  86. Doug Cotton says:

    steveta quite correctly says “Radiation can transfer energy between any two objects whatever their temperatures, but cannot transfer heat from cold to hot” which is exactly what I wrote in my peer-reviewed paper published in March 2012 about Radiated Energy – see the publications menu on the Principia Scientific International (PSI) website.

    “Simple empirical evidence “ confirms it – the more moist the atmosphere, the more the dry adiabatic lapse rate approaches the wet adiabatic lapse rate, partly because of release of latent heat, but mostly because of the propensity of intra-atmospheric radiation to create isothermal temperatures as opposed to the propensity of gravity to create isentropic equilibrium.

    The net effect is a reduction in the -g/Cp gradient by about a third due to this radiation, and this is observed on all planets with significant atmospheres, including Venus which has over 96% carbon dioxide doing the radiating rather than water. The reduction even happens in the outer crust where the net gradient measured in boreholes is about 25 to 30C/Km rather then the g/Cp value of about 40C/Km, so we have plenty of empirical evidence.

    1t’s not physics to make am assertive statement like “the fact that dry air is more transparent to IR would appear to provide such an explanation.” You can’t prove that with any valid physical explanation. The thermal gradient for dry air is well known to be steeper than for moist air, such as in the tropics. If the gradient had not been reduced to 6.5C/Km (from the dry gradient of 9.8C/Km) in the 17Km high troposphere then, for a tropopause temperature of, say -100C the surface temperature would be 66.6C. And that’s using a value -100C which about as cold as the mesopause. You can make it -120C if you like, and the surface would be 46.6C – take your pick if you still don’t think water vapour reduces the gradient. Remember Dr No mistakenly thought it was -60C.

    I really don’t care if you don’t like my explanation of why water vapour does reduce the thermal gradient (AKA lapse rate) for the fact is, as is well known by climatologists, the wet rate is about two-thirds of the theoretical dry rate.

    Hence, however you think the gradient becomes less steep with water vapour, when a new equilibrium is established so that energy in = energy out, then the whole plot of temperature against altitude has to be lower at the surface end and higher at the tropopause. This is because the area under the related plot of outward radiative intensity against altitude has to remain constant so that outward radiation (derived by integrating that function from the surface to the tropopause) has to remain constant.

    If you think you can prove me wrong, then you need to pinpoint the step in the above proof that you think is wrong and then explain why it is wrong using valid physics. Not one the very experienced scientists in our core group at PSI has been able to demonstrate any such error, so be the first to do so, because many of them are watching silently, I assure you. If you prove me wrong, and they agree with you, then my new paper will be rejected – no doubt about it.

  87. Norman says:

    steveta_uk says

    “Simple empirical evidence would appear to contradict this, for example the way deserts lose heat rapidaly at night, despite very low water vapour in the regions.”

    There is explanation as to why deserts lose heat so rapidly other than the low moisture greenhouse backradiation hypothesis.

    It is based upon the enthalpy of the air itself.

    Here is a calculator link to play with if interested.

    http://www.humidity-calculator.com/index.php

    Humid air (80% R.H. for this example typical of a jungle) at 30C (1 atmosphere pressure) stores 85.6 joules of energy per gram of air.

    Desert air (10% R.H. for this example) at 45C only has 60.7 joules of energy per gram.

    Using this Steffan-Boltzmann calculator

    http://www.endmemo.com/physics/radenergy.php

    You find (emmisitivity of 1 for both cases just to keep them the same) that the 45C air will radiate energy at the rate of 580.9 Watts/m^2 and the 30C air will radiate at 478.9 Watts/m^2. The hot desert air is radiating energy at a higher rate but has less energy so it will cool much more quickly than the moist air.

    If you go to night conditions (I used 25C for the humid air and 15C for the dessert) the humid air still has 65.9 joules/gram energy (more than the desert air at 45C). It is radiating at the rate of 418 Watts/m^2 at 25C.

    The desert air at 15C only has 17.7 joules/gram and is radiating at 177 Watts/m^2.

    You can see that the difference in the energy content of the air can explain why humid air cools slower than dry air and you don’t even have to bring in backradiation to explain it.

  88. Doug Cotton says:

    (continued)

    Dry deserts only “cool down” faster because they warm up faster to higher maximum temperatures. That is, the range of temperatures is greater than in moist areas. If you compare likes with likes, somewhere near Alice Springs (almost on the tropic of Capricorn) in the middle of summer (when the Sun passes through its Zenith) on a cloudless day you would often observe a maximum of about 38C to 44C. But go to a moist area in the tropics under similar conditions, for example Singapore, and the maximum will be 31 or 32C and the minimum will be 25 or 26C just about every day of the year. If you don’t think Singapore is a good example, find a moist region more inland on a main continent. Water vapour limits daytime maximum temperatures because it radiates away the heat much more efficiently at the speed of light than dry air transfers heat by convection at about 0.05 Km/hour. That’s the physics which leads to the well known fact that the moist adiabatic lapse rate is less steep than the dry one. And you have agreed that the heat only transfers from hot to cold, so we can ignore all downward passes of radiation which, as you say, don’t transfer heat.

  89. Doug Cotton says:

    Just a bit of quick research – the first inland city I picked with some trees around (as seen on maps.google) was Kadoma in Zimbabwe, It’s about 16.5 deg.South so within the tropics (which go to about 23 deg) , and here’s some temperature data with mean maximums and minimums, and also rainfall. It’s obvious that the air above would be more moist than above a dry desert, and here’s the cooler temperature data that I expected …

    http://worldweather.wmo.int/130/c00952.htm

    Compare the hottest months in Kadoma with December and January at Alice Springs where rainfall is much less …

    http://worldweather.wmo.int/185/c00323.htm

    Both the minimums and maximums are lower in the moist region, and, as I have been saying, it’s because water vapour causes a less steep gradient, and thus a lower surface temperature when the same amount of outward radiation is sent to space to balance incident Solar radiation.

    Do your own research and try to prove me wrong with similar empirical data on that website. I’m genuinely interested and will now have a section in my paper which compares a few such cities.

  90. Doug Cotton says:

    And Alice Springs has an altitude about 0.5Km higher, so it ought to be about 4 degrees cooler, but is instead significantly warmer. So water vapour makes Kadoma roughly 10 degrees cooler than it would have been if it had been in a dry climate at the same altitude as Alice Springs. Both cities are well inland away from the influence of oceans.

    Roy – this should suggest a research project for you!

  91. Dr No says:

    Doug- did it never occur to you that the existence of rain and clouds affects monthly average temperatures?

    Stop avoiding the question – everybody knows that
    on a calm, CLEAR night, that minimum temperatures are much lower for DRY regions (e.g. deserts) compared to MOIST regions (such as coasts and islands).

    Monthly averages are irrelevant.

    Admit you are wrong.

  92. Doug Cotton says:

    I thought that “everyone knows” water vapour is supposed to make the surface warmer, despite the rain and clouds. That’s how the effect of carbon dioxide gets multiplied / sarc

    Stop avoiding the two questions I asked you weeks ago.

    Produce your evidence that minimum temperatures are “much lower for DRY regions” and remember, we are talking about mean temperatures for annual climate, or at least the climate averaged over a hot month – not what only happens on a clear day or night. The number of clear days will be less in wet areas. We need averages. Where’s the evidence for your “everyone knows” assertive statements? I need it quickly, because I’m adding to my revised paper an analysis of quite a few inland (by 100Km or more) cities with latitude between 15 and 24 degrees South in Africa, Australia and South America and then comparing the wettest 25% with the driest 25% of the cities selected. I’ll be using the hottest month out of January, February or March for each city. I will restrict them to altitudes less than 1200 metres so that the adjustments for altitude are not too great. I’ll use a lapse rate of 6.5C/Km in the wet regions and 8.5C/Km in the dry regions. Then I would estimate that the adjusted temperatures for the median of 600m altitude should be within about half a degree of what they would be if the thermal gradient were inaccurate by up to 0.8C/Km, because 0.8 x 6 = 0.48.

    So how does that sound? If you’re quick you can nominate some cities or towns in those regions, but I will also ensure no city is within 1 degree of latitude or longitude of any other city in the sample.

    So, let’s see what the data shows. I have no more information than you at this point as I haven’t started yet, except for those two places. Name some places that meet the above criteria and you will see them included in my published paper. I don’t want to be accused of cherry picking, so anyone is welcome to make suggestions.

  93. Doug Cotton says:

    typo: “.. should be within about half a degree of what they would be if the thermal gradient were inaccurate by up to 0.8C/Km, because 0.8 x 0.6 = 0.48” (Here 0.6 represents 0.6Km which would be the greatest variation from the median altitude of 600m for cities between 0 and 1200m altitude.)

    typo: “.. should be within about half a degree of what they would be if the thermal gradient were inaccurate by up to 0.8C/Km, because 0.8 x 0.6 = 0.48” (Here 0.6 represents 0.6Km which would be the greatest variation from the median altitude of 600m for cities between 0 and 1200m altitude.)

    Use the linked website in my 7.12am comment and only select towns or cities which have both temperature and rainfall information. It’s usually easy to find the altitude by searching “altitude (city name).”

    Then supply the city name, continent (AF, AU or SA) followed by data for the hottest month out of January, February or March, in the format: mean max temp, mean minimum temp, altitude. I’ll do the calculations from there and include your choices in the published data. May I suggest a limit of five cities per respondent.

    )

  94. Doug Cotton says:

    PS Sorry about duplication of first paragraph. It’s hot here in Sydney this Sunday afternoon, and I’m a bit hot under the collar – literally I mean.

  95. Dr No says:

    Doug, before you waste your time – remember the issue here is the role of radiative effects versus your “lapse rate effect”.
    You cannot use monthly/daily values because these reflect what happens when the sun is shining. i.e. you are mixing up processes.

    You need to focus on what happens at night, in the absence of clouds, when only a FEW key processes are happening.
    Radiative cooling will lower the surface temperature more when the overlying atmosphere is dry, compared to when it is moist,
    NOT the other way round. Everybody knows this.

    Boys and girls, take a thermometer and hygrometer outside one clear, calm evening, and record what happens during the night. Then repeat this on another few nights. Note the differences in the cooling rates and the differences in humidity.

  96. Doug Cotton says:

    Of course I am considering mean maximum and minimum daily temperatures. I think we can assume minimums are usually at night. I’ve already recorded both for several cities, and each will then be adjusted for altitude. There is no indication so far of dry areas having lower minimums at night than humid areas.

    Radiative cooling does a third of the job, and non-radiative cooling does two-thirds, as per NASA net energy budget diagram that’s been on my website for nearly two years – and is in my revised paper. It shows radiated energy absorbed by atmosphere 15%, and non-radiative 30% (being 7% conduction/convection and 23% evaporation/latent heat transport.)

    But, the cooling slows as it approaches the “supported ” surface temperature which is determined by the thermal gradient and Solar intensity.

    The “base” thermal plot runs more or less continuously upwards from the tropopause, through the surface, and then through the crust and mantle. Rapid fluid motion in the liquid core then over-rides it and possibly generates some additional heat by various processes, including friction with the inner surface of the solid mantle.

    Yes, but stay up all night, as Prof Nasif Nahle did for data in his paper, and as I have done, and you’ll find, especially on a calm mid winter night, that there is evidence of a base supporting temperature, and the rate of cooling slows as temperatures approach that in the early hours of the morning before sunrise.

  97. Doug Cotton says:

    But I’m not staying up all night tonight. It’s after 1.00am, but just briefly my study of 15 qualifying cities does in fact show those with moist atmospheres being a little cooler, mostly in the maximums, but a degree or so in the minimums as well. You would be hard pressed to prove a significant and opposite warming effect with a bigger sample. The study will be in an Appendix for my enlarged and revised paper “Planetary Core and Surface Temperatures.”

  98. Dr No says:

    I repeat – You are wasting your time. Maximum temperatures are affected by the presence of clouds which reduce the amount of solar radiation. That is not the process at issue.
    In the absence of clouds, on a still night, the surface temperature will decrease more over a dry inland region than over a moist coastal or island region.

    Admit you are wrong and stop dodging the question.

  99. Hank Roberts says:

    “no concrete testable predictions”?

  100. Doug Cotton says:

    (1) The atmosphere acts like a dam wall due to the gravity effect.

    (2) Sunshine in the daytime is like extra rain falling in the mountains in the catchment area.

    (3) Creeks from the catchment area are like radiation transferring energy to the dam waters and then over the edge of the dam wall.

    (4) But two thirds of the water gets to the reservoir via slow underground seepage and thence over the wall, this representing evaporation, conduction (diffusion) and subsequent convection.

    (5) Weather condition, like clouds and high humidity, cause variations in how long it takes for the rain of the day to seep into the dam. But weather is not world-wide climate.

    (6) The dam is continually overflowing, but if excess water comes down in a storm, as in a hot spell (or a hot year like 2010) it just overflows more quickly, as in the cooler years 2011 and 2012.

    (7) So the level of the top of the dam wall represents the base temperature, whilst extra water in the hills represents a temporary build up during the day, and also from day to day mostly in summer.

    (8) Nothing is going to alter the height of the dam except long-term events, namely natural climate cycles, because it takes a huge amount of energy to raise the whole thermal plot which runs more or less continuously upwards from the tropopause to the Earth’s core.

    And that’s how it is. And it works the same way on Venus and other planets.

  101. Doug Cotton says:

    Dr No

    As I said in this comment above, my study shows that cities with moist atmospheres have slightly lower minimum temperatures than those with dry atmospheres. I asked you to submit evidence of your claim that the opposite is the case.

    Empirical evidence speaks louder than waving hands.

    Admit you are wrong on this, Dr No, just as you were about thermal expansion being the reason for the tropopause being over 50% higher at the Equator than at middle latitudes, even though the mean temperatures were less than 1% different.

    Admit you are wrong with your greenhouse explanation of how sufficient energy gets into the surface of Venus.

    Study carefully, and this time try to understand, Dr No, my 8 points above. Understand, Dr No, rather than just echoing No, no, no, no, no … .

  102. Dr No says:

    This talk about sunshine falling as rain sounds more like poetry than science!

    I like how you invoke the temperature of the Earth’s core as a climate determinant.

    Wait – I should have said science fiction rather than poetry!

  103. Dr No says:

    Dew Point:
    Dew Point is the temperature to which air must be cooled, at constant barometric pressure, for water vapor to condense into water, called dew (i.e. 100% relative humidity).

    You can also use dew point to predict the minimum overnight temperature.

    Provided no new fronts are expected overnight and the afternoon Relative Humidity >= 50%, the afternoon’s dew point gives you an idea of what minimum temperature to expect overnight, since the air cannot get colder than the dew point anytime.

    Examples:
    RH Dew Point
    Denver, CO 15% 40°F
    Seattle, WA 65% 53°F
    Miami, FL 77% 76°F
    Phoenix, AZ 14% 44°F
    St. Louis, MO 38% 60°F

    http://donsnotes.com/reference/temperature-index.html

    Plot these and admit you are wrong.

  104. tonyM says:

    Dr. No,

    I am afraid you will make little progress with Doug. He is a true denialist. No, not of global warming but of anything which contradicts him.

    I suggest Doug go figure out how a guy drowned crossing a river whose average depth was six inches.

    Perhaps Doug should participate in an experiment with me. We go to Singapore or Phils. I will discard all my clothes – just keep shorts and singlet to avoid arrest and spend the night in the open. We note the T max.

    He then agrees to come with me on a day of my choosing to the Namib Desert and Alice Springs when the day T max is comparable to Sing/Phils. Doug has to spend the night in shorts and singlet there in the open.

    Let him then tell us that humid T min is about the same!

    I note Doug is into a new field; dam construction. Good luck!

  105. Doug Cotton says:

    All of us at Principia Scientific International are sceptics of any radiative greenhouse effect, because there is no valid physics which supports it, and no empirical data which shows that water vapour causes warmer surface temperatures in real places on this real planet. In fact the data shows the opposite as in the study I have done and copied the results below.

    “I like how you invoke the temperature of the Earth’s core as a climate determinant.” No I don’t. Once again you display no understanding of the mechanism.

    Why choose one day, or use the dew point when we have available 30-year mean measured temperatures? I reject cities within 100Km of oceans or large water masses. Also, temperatures have to be adjusted to equivalents at a median altitude, as I did for 600m.

    Results for 15 cities between latitude 15 and 24 degrees South, and altitude 0 to 1200m grouped by precipitation levels (also calculated over 30 years) were as below, but a detailed description of the study including all the data will follow in the revised and expanded paper.

    Means of adjusted Daily Maximum and Daily Minimum
    Wet (01-05): 30.8, 20.1
    Medium (06-10): 33.0, 21.2
    Dry (11-15): 35.7, 21.9

    There’s no evidence of dry deserts having colder nights than wet regions.

    There’s no evidence of water vapour causing higher surface temperatures, as is a fundamental conjecture for any validity in the greenhouse conjecture. Everything fits with my hypothesis, whilst the GH conjecture “predicts” the opposite.

    Go and do a bigger study if you like – maybe Roy could. But you would be hard pressed to prove the opposite if you included the 15 cities which I chose purely on the basis of coordinates and altitude, without rejecting any that were selected being subsequently rejected.

    You’ll need cities in mostly sparse natural regions, well away from the oceans (so nothing much around the Equator, or the seas and lakes in Europe, or the densely populated areas of the US) and away from large lakes and coastal regions where ocean temperatures have an influence. And you should keep to altitudes that are not too high, because of possible errors in adjusting by assumed thermal gradients.

    Now you are all clutching at straws, endeavouring to protect your vested interests in maintaining the greatest fraudulent hoax the world have ever seen – a hoax which will cost thousands of lives and bring financial hardship upon many families, as the carbon tax is already doing in Australia. Think about people other than yourselves one day, won’t you?

  106. Norman says:

    tonyM and Dr No,

    You both may want to be careful in your attacks on Doug Cotton. Rather than make assumptions go out and check things out on your own. You are making this assumption that dry areas are colder at night than moist ones at similar latitudes. You could end up with the egg on your faces. I did a quick search.

    Phoenix, Arizona latitude: 33 26 North
    Montgomery, Alabama latitude: 32 22 North

    I selected the several year average for both regions. In the links it is for July but you can click on any month to see other comparisons.

    http://www.accuweather.com/en/us/montgomery-al/36104/month/326706?monyr=7/01/2013

    http://www.accuweather.com/en/us/phoenix-az/85003/month/346935?monyr=7/01/2013

    The night time average in Phoenix in July runs about 10 F warmer than Montgomery and it would be most comfortable in shorts at night, maybe preferable. I do not think you two are on the right path in your posts. Rather than attack use the opportunity to research and learn. It is a far more valuable venture than ridiculing someone with an idea.

  107. tonyM says:

    Norman:

    Thanks for your comments and apologies if mine in any way offend you. I don’t mind if I am proved wrong as it is part of learning. I take your point about negativity but this is a long running saga with Doug that perhaps you are not aware. I could give a synopsis but leave it for now – except to say he self contradicts and refuses to acknowledge it or is evasive.

    I must admit I do not follow your Arizona / Alabama comparison as I can’t find any info re humidity levels. The issue is not simply about the same latitude but whether higher humidity causes higher Tmin for a similar Tmax of the day (with minimum wind/new fronts etc or as close to like for like comparison as possible). Broad averages can be quite meaningless for this purpose.

    My own experience suggests it is so; the data I have suggests the same.

    Dr Christy makes the same observations. “If there is anything I’ve learned in Alabama, it is that humidity can make summer nights very warm,” said Christy, a Fresno, Calif., native who has lived in Alabama since 1987. This is Dr. John Christy, director of the Earth System Science Center at The University of Alabama in Huntsville (UAH). See WUWT.

    He is referring to Alabama which your data shows to be cooler than Phoenix.

    With high humidity there is also the propensity to have more cloud at night which itself influences the Tmin without albedo coming into play (no sun at night!)

    Melbourne overnight ironically is regularly warmer in mid winter than Perth even though it has had colder day T and is further south in latitude but with lower lapse rate (more moisture) (both are main cities in Australia). Perth regularly has very clear skies in winter with lower humidity. I have lived in both places.

  108. Doug Cotton says:

    Thanks Norman.

    Both Melbourne and Perth are by the sea shore and TonyM shall surely see that the sea sure plays a large part in controlling their temperatures, as it does in Singapore.

    Data from: http://worldweather.wmo.int/185/c00301.htm

    30 year mean in January – Daily Max, Daily Min, Precipitation ..

    Melbourne; 26.3C, 15.6C, 45.1mm
    Perth: 30.8C, 17.8C, 17.8mm

    So Perth is hotter and drier in January (summer)

    30 year mean in July – Daily Max, Daily Min, Precipitation ..

    Melbourne; 14.2C, 7.1C, 44.7mm
    Perth: 18.3C, 7.7C 153.1mm

    So Melbourne is not warmer than Perth on Winter nights, as I well know having lived there for one winter – that was enough. Perth would be warmer still if it had less rain than it does in winter.

    Norman warned you that you’ll get egg on your face, tonyM.

    As I said, I’ve done more than just a quick search for two cities, or a hand-waving statement about Alabama or wherever. (The human body always feels hot and sticky in humid conditions, even if the temperature is not very high.)

    As I said, tonyM and the others are clutching at straws now. They have not suggested a single city between 15 and 24 degrees South, >100Km from the coast and at less than 1200m altitude – let alone done a study like mine.

    I’ve spent a solid day or more of my own time studying and analysing 15 cities, adjusting their 30 year mean maximum and minimum temperatures in order to compensate for differences in altitude, and come up with a mean “wet” minimum of 20.1 compared with a “dry” minimum of 21.9 as shown in my last comment, but ignored by the anonymous TonyM.

    It’s in their ball park now to produce statistically significant real world data, adjusted for altitude, and, like mine, based on inland measurements when the Sun it close to its Zenith directly overhead, as happens only in the tropics.

    How much more study like mine could have been done with the funds that have been splurged on the GH conjecture? Maybe Mann and Hansen secretly peaked at real temperatures but found they didn’t support their case one iota, a bit like the MWP which needed a hockey stick to beat it out of existence.

  109. Doug Cotton says:

    Month, Minimum C, Maximum C, rainfall (mm), number of rain days

    Perth

    Jun 8.4 19.3 134.7 15.4
    Jul 7.7 18.3 153.1 17.6
    Aug 8.0 18.8 134.9 16.5

    Melbourne

    Jun 7.9 14.8 46.5 13.5
    Jul 7.1 14.2 44.7 14.4
    Aug 7.8 15.7 50.5 15.3

    The last figure on the right is the mean number of rain days,

    What was it you said about Perth having more clear winter days than Melbourne and Melbourne having more rain in winter, tonyM?

  110. Doug Cotton says:

    Min C, Max C, Precipitation (mm)

    Phoenix (altitude 340m)
    Jul 27.2 41.1 21.1

    Montgomery (altitude 67m)
    Jul 21.9 32.8 131.8

    And Montgomery would be 2C cooler still if it were at the same altitude as Phoenix.

    It’s the same story the world over – you’ll get some exceptions if you cherry pick two cities, but take a mean over dozens of cities and you’ll see that water vapour cools.

    The fact that water vapour has negative feedback and thus cools completely demolishes the greenhouse conjecture because they assumed WV did most of that 33 degrees of warming, and also that it magnifies any warming effect of carbon dioxide. In fact they both cool, though CO2 probably only by about 0.1 degree.

  111. tonyM says:

    Doug you again go on with superfluous jabbering without addressing the issue. No one would suggest that Melbourne on average is warmer then Perth so you are simply arguing with yourself. Melbourne is nearly six degrees further south and closer to the South Pole than Perth for a start.

    Clearly you have little experience here or you would not chase red herrings.

    It is because Melbourne is supposed to be colder than Perth that I highlighted some anomalies. There are nights where the Tmin in Perth is LOWER than Melbourne despite the actual Perth Tmax being HIGHER for that day in winter. Got that? On the ONE day – or rather overnight! This is not rare and is NOT an average!!!

    Got it now?

    Do any of your comments SHOW this is NOT the case? Rhetorical Q ok!!! As they don’t, kindly stop ranting and get back to addressing my point if you so wish!

    Such information will not show up in broad statistics that you rely on. In addition average precipitation can be a poor measure of humidity on a day. Melbourne has more rainy days and a lot more drizzle yet has lower rainfall than Perth.

    In case you had not noticed Doug you are the only one imposing the conditions of proximity to water. Once you do that then all Australian State capital cities are excluded. As over 70% of the earth surface is water it is artificial nonsense to be excluding its effects. It is central to our climate.

    I gave you my conditions of like for like comparison; you obviously are not so inclined to take up the challenge!

    As for your suggestion that Dr Christy is hand-waving about Alabama I suggest that perhaps you should compare your credentials in Climatology with his rather rather than assume he is simply feeling the difference with his finger.

    Your broad brush averages are in fact more like finger tasting and testing which could never discern why a guy drowned when crossing the river whose average depth was six inches. There is no sense of deviations in your data. Quite meaningless numbers!

    Was it Disraeli saying “there are lies, damned lies and statistics?”

  112. tonyM says:

    Addendum:
    I forgot to add:
    It definitely does NOT rain on those colder nights in Perth!!
    In fact perfectly clear nights..K!

  113. Dr No says:

    tonyM, do not expect a rational answer from Doug.

    He has spent a whole day – yes! a whole day studying this problem. Never mind the fact that scientists have been looking at these problems for most of their working lives, Doug has spent a WHOLE DAY!! That must mean that he is at least a billion times more insightful than any climate scientist – living or dead. A truly wonderous man.
    Be ready to step back out of harm’s way when his brilliance causes him to finally explode.

  114. Doug Cotton says:

    All I am interested in doing is showing Roy how the greenhouse conjecture is seriously flawed on many fronts.

    If you are not interested in learning that, then don’t get involved in trying to convince me with anecdotal “evidence” that you picked up by living in these places. I spent a year living in Melbourne and have spent weeks in Perth and other places in Western Australia – even driven there from Sydney, as well as driving to Alice Springs and Uluru – twice. But such visits tell me nothing about climate.

    You want to exclude the effect of water do you? Then why is the maximum in Singapore never more than 32 deg.C on any day of the year, whilst Sydney often has hotter days, up to 45.8 deg.C in January this year?

    No, I suggest Dr Christy should compare his knowledge and understanding of the advanced physics required for understanding the mechanisms which render the greenhouse conjecture totally invalid. I’m happy to go through any of it with him, any time. That applies for Roy also.

    I have explained such, but I realise not many will be able to understand, though I’m sure more could if they have the intelligence and the perseverance to persist in efforts to understand what several of us at Principia Scientific International are saying.

    Anyway, I have a paper and article to focus on now for publication on the PSI website, where articles are sometimes read by well over 20,000 visitors.

  115. Doug Cotton says:

    And I suppose Dr No, like tonyM, also doesn’t think that being near the ocean affects (moderates) a city’s climate.

    Try Newcastle on the NSW coast, and Singleton just 82.5Km away ..

    Newcastle
    Jan 19.1 25.5 91.4 11.1
    Feb 19.3 25.4 105.6 11.1
    Mar 18.2 24.7 121.9 12.2

    Singleton
    Jan 17.6 30.6 94.3 11
    Feb 17.7 29.6 88.9 10
    Mar 16.0 28.1 72.7 11

  116. Dr No says:

    I have already told you at least twice. Forget daytime temperatures and monthly averages. The issue is the effect of moisture on surface temperatures independent of solar radiation and clouds. Think… night time, think…calm conditions… think ….no clouds, think….how much cooling occurs when the air is moist compared to when it is dry. Everybody knows it is cooler when the air is drier. I have given you compelling evidence. Admit you are wrong.

  117. Doug Cotton says:

    No Dr No:

    The issue is climate, which is an annual mean of all daytime and night-time temperatures. No Dr No, everyone doesn’t agree on any such hand waving statements about it being warmer at night where the air is moist. Real world data for minimum nightly temperatures shows moisture leads to less steep thermal gradients and mean daily maximum and nightly minimum surface temperatures, as are recorded for climate analysis.

    You have no valid published study, or work of your own, to support your “I know this so everyone knows” complacent, assertive statement.

    I may well have only spent a day on a bit of calculation, but I have spent thousands of hours studying what climatologists have written, as well as physicists. How much time do you think has been invested by how many people in gathering and calculating mean daily maximums and nightly minimums all over the world in order to obtain the 30 year figures I used? Someone must think it valuable information to have and to use for research such as my little bit. Of all the money spent on GH research, how much has been spent looking at actual real world data?

    I would say that one whole day is probably about the time taken by the likes of James Hansen, Michael Mann or whoever, in dreaming up the most simplistic, invalid and non-physical concept of a radiative greenhouse effect, to replace the original old conjecture of atmospheric “trapping” of “heat” which was supposed to block the surface cooling by non-radiative processes. When this was proved incorrect, they had to find a replacement “concept” namely back radiation – full of little photons that bombard the surface like hand grenades, exploding “heat” into such surface and warming the whole planet 33 degrees – when the redistribution of kinetic energy by gravity had already done so billions of years earlier.

    If your concepts can’t also explain how the required energy gets into the surface of Venus, then your concepts are wrong, because physics is universal.

    Go back to my 8 point summary and try to understand the role of how the atmosphere slows the rate of cooling of the surface, both day and night, until the water gets down to the level of the dam wall.

    http://www.drroyspencer.com/2013/02/decreased-surface-wind-as-a-contributor-to-warming/#comment-69729

  118. tonyM says:

    Doug Cotton:
    You say earlier – which I missed:
    “What was it you said about Perth having more clear winter days than Melbourne and Melbourne having more rain in winter, tonyM? “

    Ok Doug, now show me and others where I have said:
    1. Perth having MORE clear days than Melbourne
    2. Melbourne having more rain in WINTER

    Come on Doug, I’m now calling your bluff. Let’s see your credentials of how truthful you are.
    You will apologise if you cant find such statements won’t you? Thanks.

    Now I will advise you – pure observation! In winter Melbourne does develop a cloud cover for periods much like London. Perth doesn’t. That is a factor for those anomalies..

    Melbourne is more humid than Perth – average annual and winter!

    On average Melbourne is more cloudy – annual and winter

    Why don’t you do a proper analysis like that. The actual measures are available as you know on the BOM site. Yet you chose not to quote them.. tut tut.

    http://www.bom.gov.au/

  119. Norman says:

    Dr. No and tonyM

    From Dr. No “Everybody knows it is cooler when the air is drier.” The perception of temperature is what everyone notices. Dry air allows the skin to evaporate moisture cooling its surface, high humid air greatly restricts evaporation so the skin stays warmer.

    tonyM

    I have a link to Montgomery Alabama relative humidity and it is very high in July (especially at night) R.H. goes down during the day as the air warms, it can hold more relative moisture.

    http://www.sercc.com/climateinfo/historical/avgrh.html

    Here is a Heat Index chart. Humid air feels much warmer and dry air actually feels cooler than the actual measured temp of the air.

    http://en.wikipedia.org/wiki/Heat_index

    Doug is talking about he long term climate of an area not specific temperatures for a day. Weather is effected by many things. Air moving in from a colder region to a warmer (or visa versa) changing the average. The average is really important to see any long term effects. I think Doug’s research is good. He has a theory and is now testing it. Can’t fault him for that.

    Seems the two of you are obsessed to get him to admit he is wrong about something, but you totally ignore his major points. Seems like this is a waste of time for scientific minded people. Better to challenge him with your own research and prove him wrong with empirical data.

  120. Dr No says:

    Norman, I disagree. Central to everything Doug writes about is his insistence that the presences of water vapour (and co2) in the atmosphere acts to cool surface temperatures. Having stated this, it is incumbent for him to provide evidence that this effect is real. A simple test is to consider what happens in the case studies we are arguing about. For Doug’s benefit, and for at least the third time, this test is quite specific: overnight minimum temperatures (that removes the effect of solar heating), calm conditions (that removes the effect of sensible and latent heating), clear conditions (that removes the radiative effects of liquid water), and either moist air or dry air.
    According to Doug, dry air should result in warmer surface temperatures compared to moist air.
    I have provided some easily obtained examples demonstrating he is wrong. (These relate to actual measured temperatures, not perceived temperatures which is a red herring).
    Doug does not acknowledge this evidence, and insists on collecting his own data but, as I have pointed out, is wasting his time collecting average temperatures that do not relate to the process under discussion.

    Essentially, Doug imagines he is scientifically literate but does not understand the first thing about scientific methodology.

  121. Doug Cotton says:

    Thanks Norman, though I’m not hopeful of them heeding you. Each of these anonymous GH advocates obviously has a vested interest in maintaining the hoax. I have challenged each in the past to declare their full names and any occupational link with climatology which may give them an incentive to maintain the status quo. Hiding behind anonymous names and not declaring financial interests whilst trying to influence scientific thinking is every bit as dishonest as the actions of those who continue to propagate the greenhouse hoax with their pseudo physics that cannot stand the test of empirical reality. They demand that I “admit” things like my inferences from their statements which are deliberately phrased to mislead readers into making such inferences, whilst, at the same time Dr “Everyone Knows” No has never yet admitted his error about the troposphere expanding purely because of thermal expansion.

    Neither of them, nor anyone else on any of several climate blogs, has ever presented a valid alternative explanation as to how the required energy gets into the Venus surface by any other way than my hypothesis of heat creep, which will be explained in more detail in my revised paper. The same process supports planetary core temperatures, as will also be explained in the paper.

    First determine if you have a student, before you try to teach. We don’t have students here, Norman, except (hopefully) Roy himself.

    To Roy and silent readers: Watch for my revised and enlarged paper “Planetary Core and Surface Temperatures” which will present a cogent hypothesis with a unified concept explaining a method of determining both core and surface temperatures for all planets. It will appear on the Principia Scientific International website in the PROM menu, replacing the existing paper, probably within a week. There is growing consensus for my hypothesis among senior PSI scientists. Unless Roy himself has questions here, any further discussion may be posted in the forum at PSI where a new thread will be opened as soon as the paper appears.


  122. Dr No says:

    Another of Doug’s contentions is that the spin of the earth somehow causes the troposphere height to be higher at the equator than at the poles.
    If this effect were real, we should expect less atmospheric mass at the poles compared to the equator – since (according to Doug, more molecules have been flung into space).
    The fact is the mean sea level pressure at the north pole is about the same as that at the equator. That means the mass of atmosphere is about the same at both locations.

    n.b. I have no interest in perpetuating a “hoax”. I do have strong feelings about the abuse of science and defending the reputations of honest, hard working, non-wealthy, scientists against attacks from amateurs and cranks.

  123. Dr No says:

    Correction – “expect less atmospheric mass at the equator”

  124. Dr No says:

    Some more data of relevance.

    Year 2102.
    Month September.

    Location Yeppoon 21S 151E (on the east coast of Australia)
    Very little rain fell during this month.
    Average minimum temperature 8.7 degC

    At Rockhampton, 38 km inland, the average was 7.2 degC
    (i.e. 1.5 degC colder)

    At Emerald, 233 km inland, the average was 6.3 degC
    (i.e. 2.5 degC colder)

    (there are countless other similar examples)

  125. Doug Cotton says:

    Firstly, Dr Anonymous No, I have good reasons for considering only cities which are at least 100Km inland and away from lakes or rivers of significant size. It was much cooler when I lived close to Sydney Harbour in my youth, for example. I use 30 year temperature and rainfall averages – not a single one month record like your “during this month” for a place like Yeppoon on the coast. The Australian cities in my study are as below and are restricted to altitudes less than 1200m and latitudes 15 to 24 degrees. I considered that I had enough in Queensland and wanted NT and WA cities included.

    The numbers at the left represent their ranking, highest rainfall first.

    04: Halls Creek, Western Australia, AU, 422m
    05: Charters Towers, Queensland, AU, 336m,
    08: Mount Isa, Queensland, AU, 356m
    12: Longreach, Queensland, AU, 193m
    14: Paraburdoo, Western Australia, AU, 389m
    15: Alice Springs, Northern Territory, AU, 545m

    I referred to the whole atmosphere being affected and very specifically said the effect of “centrifugal force” on just the troposphere would be minor. I gave examples of when centrifugal force exactly counters gravity for geostationary satellites. Equal pressure does not imply equal mass, because you are ignoring the very thing we are talking about, namely centrifugal force being greater at significant distances above the Equator than above the poles.

    When it comes to physics, you, Dr No are the amateur. I recognised that long ago. Name yourself and prove that you have formal education in tertiary physics, and to what level. I completed my first degree B.Sc.(Physics) at Sydney University in 1967 under Prof Harry Messel et al. I have subsequently done further extensive study and have helped many students with both Physics and Mathematics, as well as writing popular Mathematics software for school children at all levels. In recent years I have spent thousands of hours studying the writings of climatologists (and other commenters on climate blogs) pertaining to their assumed radiative greenhouse effect. In the course of such study, it has become more and more obvious that their reasoning has been soundly flawed and is blatantly contrary to the laws of physics.

    So I set about discovering the answer to what really does maintain Earth and Venus surface temperatures, and I found that, in order to comply with the laws of physics, it requires a paradigm shift in thinking away from the false concepts of radiation making the surface hotter. There was simply no way that radiation from the atmosphere on Venus could multiply energy from the Sun and end up delivering over 1,000 times the energy that the Sun delivers to the surface of Venus. The breakthrough in the dilemma has been consideration of the ramifications of the thermal gradient which evolves spontaneously in a gravitational field.

    Whether you wish to learn about this new paradigm is your choice. But “defending” the status quo with comments such as your last one does nothing but make your motives obvious to Roy and the silent readers. Heed what Norman said.

    .

  126. Dr No says:

    Doug, you are obviously going to avoid my advice and get yourself lost using 30-year rainfall and temperature averages.
    I have said enough – you can lead a horse to water …etc etc.

    Getting back to Venus. Why do you keep talking about
    ” …no way that radiation from the atmosphere on Venus could multiply energy from the Sun and end up delivering over 1,000 times the energy that the Sun delivers to the surface of Venus.” ???
    Where do you get the figure of 1,000???
    Surely you understand the difference between energy and temperature??
    Nobody anywhere claims there is more energy being delivered to the surface.

    I have previously explained to you why the surface temperature on Venus is the way it is. I will repeat it again.

    The atmosphere on Venus can be assumed to be well mixed/convecting.
    This means the temperature will follow the average lapse rate (i.e. increase/decrease about 10 deg per kilometer down/up).
    The mean radiative temperature is known, the height at which this occurs is known, the surface temperature follows. Nothing difficult here. No need to mention energy sources..

    Maybe you think that the lapse rate involves some form of energy sources and sinks to explain the warmer/cooler temperatures?? If so, I recommend you study the meaning of the term “adiabatic”.

  127. Doug Cotton says:

    Radiative flux of 16,000 W/m^2 is needed for Venus surface temperature >730K by SBL. Direct Solar radiation measured by Russian probes as reaching the surface of Venus was a mean of 5 to 10W/m^2. Say, even 16W/m^2 at absolute most. Hence we have 16 x 1,000 = 16,000.

    You wrote a classic here: ”This means the temperature will follow the average lapse rate.”

    This is the absolute epitome of over-simplification, Dr No and assertive statement without physical explanation in support thereof. This is just so typical of climatology “argument.”

    It’s actually quite correct in a way, but it’s missing the all important description of the physical process of which brings it about. So, by what mechanism does the temperature just “follow” Dr Know-it-all ??? Describe the required energy flows that control that temperature.

    While ever you continue to display such an obvious lack of understanding of the physics of temperature and heat transfer, Dr Anon, I will continue to expose such lack of understanding to Roy and all the silent readers. Now, what’s your real name and physics qualifications?

  128. Doug Cotton says:

    Dr No-it-all wrote: If so, I recommend you study the meaning of the term “adiabatic” . . That’s OK Grandma No – I know how to suck eggs.

    We’ll just send all the sunshine away from Venus with a big mirror, because we don’t need any of it. The surface temperature is controlled by the lapse rate, which, being adiabatic, doesn’t require any energy input, so everything will just stay nice and >730K hot at the surface because no energy can enter or leave the atmosphere, because the lapse rate is adiabatic, and there you have it. We don’t need the Sun for the Earth either. /sarc

  129. tonyM says:

    Norman:
    Thanks for your comments and efforts.

    I’m not sure what I can do with averages or comparing such disparate numbers. The purpose of my challenge to Doug was to go to Namibia on a night where the day Tmax was the same as say Singapore – and compare on like for like basis with no wind etc. Then we should note the difference in Tmin. Obviously we would be using T measures so the purpose of my suggesting shorts is simply to dramatise my expected results.

    This is really a physics question and not one of climate. Doug will switch between the two as a diversionary tactic depending on how badly he is faring in one or the other.

    In terms of your data the observation that can be made is that the Tmins get closer together.
    The Tmax difference is 15F and the Tmin diff is 11F which would be in the direction expected given that Montgomery is more humid.

    It is probably better displayed in the Melbourne/Perth data that Doug gives whereby:
    Tmax diff is 3.9C and the
    Tmin diff is only 0.4C (for Perth : Melb)

    (that was for winter but similar trends occur in summer averages)

    Again this favours the hypothesis and contradicts Doug. Kindly note the goose-neck side shift that Doug attempted – he asserted that Perth was more humid by either showing rainfall or number of days rain. Ah yes, Doug is a real scientist given the humidity data is available officially where clearly Melbourne is more humid. Heavens, doctors will advise some patients to move to Perth on these grounds.

    My illustrations in winter were trying to be more direct and highlight it as an anomaly rather than have so much suppression of detail come into play via averages.

    NB – he is not being picked on; just being asked to account for his assertions.

  130. Dr No says:

    There is no mystery here.
    The temperature at the surface is determined by the adiabatic lapse rate and the height of the radiative equilibrium temperature. That does depend on the sun.
    The same occurs on Earth and all planetary atmospheres.

    You seem to have fixated on the Venus temperature as if it was unusually “very hot”. It is no more unusual than Earth’s surface temperature. Both are warmer than can be explained by the amount of solar radiation being absorbed.

    Your problem with the amount of radiative flux is a non-issue. You could just as well measure the temperature 1km above the surface and ask “What is the energy source for this? Why is it as warm as it is? (since there is effectively zero absorbed solar radiation at this height).

    I think the problem here is that you do not believe that air can expand, and cool, without any change in total energy – and vice versa. Am I correct? That would explain your perplexity.

  131. Norman says:

    Dr. No

    I was looking at your dew point post. It is correct the temperature at night cannot fall below the dew point (without some form of front) since the condensation would maintain the temperture preventing a further decline.

    But dew point will not predict the low temp at night. It can let you know what the minimum might be but not the actual. In the Phoenix the dew point rarely has anything to do with the actual night time temp (usually much higher in summer than dewpoint).

    Here is an excellent resource to use to look for evidence of this debate. I think the evidence is strongly in favor of Doug. More data may not support him but this quick look really does indicate he is on the correct path and perhaps you should reconsider the evidence.

    http://www.wunderground.com/history/airport/KPHX/2012/7/5/DailyHistory.html?req_city=NA&req_state=NA&req_statename=NA

    July, 5 2012 in Phoenix. The minimum temp is 77 F the Relative Humidity is 78% with a dewpoint of 63 F. (Also what is nice about this resource is it includes wind speed, and cloud condition so you can control those variables). Just the next day July, 6 2012 the minimum temp is much warmer at 85 F now the dewpoint is down to 45 F and the maximum relative humidity is 36%.

    http://www.wunderground.com/history/airport/KPHX/2012/7/6/DailyHistory.html

    So in this case the lower humidity resulted in a much warmer night (8 F warmer). With this resource you can look at many cities worldwide and see actual daily weather data on temp, dewpoint, humidity, cloudiness, windspeed. I think with some dedication the answer is available.

  132. Doug Cotton says:

    Yes, the mean minimum daily temperatures for 15 cities are quite close. I gave you the results of my study here …

    http://www.drroyspencer.com/2013/02/decreased-surface-wind-as-a-contributor-to-warming/#comment-69738

    But there is no evidence in the results of any net warming by water vapour.

    Obviously you can prove nothing with comparisons of 2 or 3 coastal and island cities like Singapore, which are strongly influenced by ocean temperatures. I refuse to even discuss such cities that are within 100Km of substantial bodies of water, not in the tropics and even at totally different latitudes. At least those in the tropics have the Sun directly overhead twice a year. You also need to adjust temperatures for altitude differences, as I did, but to avoid too much error in such adjustments I eliminated cities higher than 1200m.

    I have “accounted for my assertions” in my paper on Planetary Surface Temperatures, though I’m working on an expanded version thereof with more detailed explanation of the physics involved so that people (like some of you here) might possibly better understand the physics. I am also discussing how planetary core temperatures remain so hot.

    Dr No thinks “there is effectively zero absorbed solar radiation at this height – meaning up in the atmosphere. He should study the NASA energy diagram and see that 19% of incident solar radiation is absorbed by clouds and Earth’s atmosphere. On Venus, about 98% of incident downwelling solar radiation is absorbed by carbon dioxide, as he could have read in this excerpt from my paper …

    … the temperature gradient is established naturally in the atmosphere, quite independently of whatever energy is coming from the surface. Clearly there is nowhere near enough energy from the surface of Venus, and possibly not enough even on Earth to warm the very base of the atmosphere.

    Each atmosphere is quite capable of absorbing incident Solar radiation. Carbon dioxide, for example, can absorb in the 2 micron band. Thus there is no doubt that enough energy could have been absorbed quite easily over the life of each planet, and probably much more quickly than that.

    As the energy is absorbed the more dense regions at the base are able to hold more molecules each with more kinetic energy, and so a higher temperature is measured there. As molecules move between collisions their trajectory must be influenced by the force of gravity, just as happens with any object in flight. This creates a greater propensity for more molecules to accumulate in lower regions of the atmosphere, but numbers are also limited by pressure considerations, and so kinetic energy will propel some molecules upwards. Equilibrium is established between these upward and downward tendencies and, as a result, a uniform temperature gradient is established.

    Strictly speaking, the process does not have to involve individual molecules travelling relatively long distances, because the KE is passed from one to another in collision processes. It was originally thought that this diffusion process would ensure uniform temperature at all levels in a closed container. However, entropy must be maintained and this means that the sum (PE+KE) will remain constant for any particular molecule between collisions. The diffusion process “equals out” the above sum, not just KE. Hence, when equilibrium is established, we do indeed observe uniform entropy and temperature in any horizontal plane (because PE is constant) but in a vertical plane what we observe is uniform entropy, and this necessitates a temperature gradient because KE (which determines temperature) must vary with PE in order to keep the sum (PE+KE) constant.

    The only alternative would be a naturally developed entropy gradient rather than a temperature gradient. This is about as implausible as it would be for an object not to accelerate when falling in a vacuum.

    Now the interesting consequence is that the base of the atmosphere on Venus must therefore have become hot naturally of its own accord and actually heated the surface by both radiation and conduction at the interface. So, just as on Earth, the temperatures are close.

  133. Norman says:

    Dr. No and tonyM if you are interested, I looked at another spot (I was looking for Montgomery and got Maxwell AFB). No matter, again Doug looks like he is on to something. This one would be for you tonyM. You wanted a similar location with only differences in humidity. Both nights are clear.

    http://www.wunderground.com/history/airport/KMXF/2012/7/4/DailyHistory.html

    The above link is July 4,2012 at Maxwell AFB in Alabama:
    Minimum Temp: 69F
    Humidity Max: 96%
    Dew Point: 70F
    Night conditions: Calm and Clear

    http://www.wunderground.com/history/airport/KMXF/2012/7/5/DailyHistory.html?req_city=NA&req_state=NA&req_statename=NA

    The above link is next day July 5, 2012 at Maxwell AFB
    Minimum Temp: 72F
    Humidity Max: 93%
    Dew Point: 71F
    Night conditions: Calm and Clear

    This data point strongly rejects the greenhouse hypothesis. The air with more moisture is actually allowing more nighttime cooling which is a complete violation of the theory.

    This could be considered a cherry pick by some but it was an attempt to answer questions and assumptions posed by Dr. No and tonyM. I can continue to investigate the situation but it looks bleak for the greenhouse theory at this stage of research.

    The Climatologists should definately check more data on this. I have limited time to investigate. If it was my career I would be all over it.

  134. Doug Cotton says:

    Norman That’s interesting, and I will refer to that resource in my revised paper. I personally don’t have the time to do unfunded research (not having ever received a cent for my time in all this, and my business having lost money as a result) but I will make the point that this kind of research ought to have been done with some of the government grant money, so it’s about time it is.

    Maybe Roy could take it on board.

    That’s all folks!

  135. tonyM says:

    Norman:
    Thank you very much for that information.

    It is abundantly clear that you are no bona fides scientist. I suggest you go back and read your comic books. Take Doug with you as he certainly has exhibited the same limitations which would disqualify him as a scientist.

    When I get a chance I will explain for other readers the naked chicanery involved. For a start look at Norman’s 2nd referance, go to the bottom and read what it says for events: “thunderstorm.”

    Since when is “thunderstorm” considered “calm and clear” as described by Norman. Neither the previous nor the next day states “thunderstorm!”

    Some mother’s do have them!

  136. Dr No says:

    It has been a bit of fun to date but I think I am done trying to explain things. Maybe it is time for somebody else to have a go.
    I hope that some of you have benefited from the exchanges and learnt a bit about the science. More importantly, maybe some of you might agree that climate scientists are not all part of a conspiracy, but have well argued points of view……………………………………………………………………….. (which happen to be correct!)

  137. Norman says:

    tonyM

    “Since when is “thunderstorm” considered “calm and clear” as described by Norman. Neither the previous nor the next day states “thunderstorm”

    tonyM the thunderstorms took place later in the evening. The night time low temperature took place under calm and clear conditions in both cases so I am not sure what your objection is. It was just a very quick search I need to do more investigation. What I did was go to july of last year, look at the entire month graph (clicking on the month tab) and look for the days with the highest Dew Point then go to that day and look at the next few days for more details.

    Explain what is not calm and clear about calm and clear?

  138. Norman says:

    tonyM

    I understand what you did, you did not scroll down far enough. Keep going down and they have all the AM weather, look at the right columns on this larger page and you see clearly the words calm and clear written in them. Later down the list you see thunderstorms taking place in the evening. Not sure what you are attempting with this post. Hopefully people have better investigative ability than you are showing in your zeal to prove people of different opinion wrong.

  139. tonyM says:

    Norman:
    I’m afraid your explanation is rather too loose and convenient for me. It should have been obvious that we were trying to compare like for like. Dr No also made clear the requirements.

    Having a short period of calm is hardly comparable if conditions have been affected by thunderstorms on one day and clear on another. You should have declared this upfront.

    I stated that the reference was at the bottom of the page; the only confusion was whether the early morning hours were of that day or the next. If they were of the same day then those measures were meaningless. You seem to be suggesting this by “the thunderstorms took place later in the evening” of the second day.

    The thunderstorms occurred after the days Tmax. Simple logic would make it clear that it would be absurd to have thunderstorms after this and then try to measure the next Tmin and declare comparable conditions to the previous day. If you are not measuring this Tmin then what exactly are you trying to measure and show?

    I find this sort of behaviour little different to Doug wanting to use proxies for humidity when the humidity data were readily available. In other words if you have to resort to this sort of manipulation then you have very little to sell in your story and are a waste of people’s time.

    If it was simply a case of just using a set of numbers I could have done that with the averages you put originally and with Doug’s averages. They both showed the right trend supporting the GHE effect and were obvious to me from the start. But I also knew that was not the appropriate way. In fact the differences, particularly as an average, were far, far more meaningful than the piddly stuff you wish to rely on as a one off measure.

    You are the one that went looking for some anomaly to make such a silly claim. Error levels alone would wipe out your assertion. Using relative humidity is equally inadequate for this comparison as you should well know. The thunderstorm activity could never make such a period after it comparable.

    Relative humidity is simply absurd here. In this setting it can vary by the hour for the same absolute water concentration which is of course what is operable in the Beer-Lambert relationship. This is just too silly for words to even consider.

    You are the one bent on chasing such close conditions in humidity which could never be acceptable in an experimental science setting as having comparable other variables in the system simply because such a system can never be measured or controlled to that degree of accuracy.

    This is the reason why I chose the Namid desert. It’s humidity is extremely low (inland) so that there can be little issue with confounding factors when compared to a very high humidity area. But I did stress that other conditions should still be on a like for like basis – same T max, calm conditions etc and not for a few hours only as you seem to feel is acceptable.

    As a skeptic myself I am fully aware of the claims of manipulations that can be levelled in climatology. But it is counter productive to then foster those practices in any anti case. Contrary to your belief it would make no difference to me as long as the evidence was robust and repeatable.

    Norman, I will stick to Dr Christy’s assessment about Alabama. I feel comfortable that he has far better knowledge than Doug or you He has a proven track record; neither of you are on the board yet.

  140. Norman says:

    tonhM,

    “Having a short period of calm is hardly comparable if conditions have been affected by thunderstorms on one day and clear on another. You should have declared this upfront.”

    I do not think you are looking at the data I posted to. Not just the Alabama one but the phoenix one before it where the moisture content of the air is much different and the wetter air reaches a lower minium temp.

    Look at the two days in Alabama. July 4 is clear the whole day. The minumum temperature on July 4 is at 5:55 AM (in the larger chart below) under clear and calm conditions. It remains clear and calm when the minimum low is recorded at 5:55 AM July 5th. The thunderstorm took place on the evening of July 5 and has no contribution at all to the two minumum temperatures under consideration. I posted a humidity calculator somewhere above. I can use that to give you the absolute humidity of the two air masses if this would help.

    You did give a very difficult problem. Trying to find calm clear night time with the only variable changing is humidity. Not easy to find this. I did find an example for you but all you want to do is suggest it is a poor representation. What do you need or want that will satisfy you? You ask for a given condition, I give it to you and then you say this is poor quality work. Maybe you should be thankful for finding a case for you to look at and consider instead of trying to make the investigator look dishonest, manipulative. I only provided what you had requested and nothing more. I linked to the site so you can look at the data yourself and suggested you can look at your own dates and cities with this resource. It is extensive. I really do not understand what you are wanting and I really do not understand why you would attack my character based upon giving you the data you requested. What is your point. You seem like a dog that bites a person who gives them a treat.

  141. Doug Cotton says:

    My final word before the revised paper is published ….

    Thirty year means for 15 inland tropical cities when Sun is at its Zenith, with data for altitudes (ranging 0 to 1200m) adjusted to 600m assuming lapse rates 7, 7.5 and 8C/Km for the groups of 5 cities in the wet, medium and dry thirds gave these results …

    http://img27.imageshack.us/img27/1612/tempwater.jpg

    Full details of this study will be published in an Appendix to “Planetary Core and Surface Temperatures” soon to appear on the Principia Scientific International site, initially in the PROM (Peer Review in Open Media) menu and subsequently in the Publications Menu.

    The expanded paper (with the above title) will replace the current one which only relates to surface temperatures.

    The revised and expanded paper will provide a detailed explanation of the mechanism of “heat creep” and also comprehensive counter arguments to all known attempted rebuttals of the concept of the autonomously evolved thermodynamic equilibrium state of maximum entropy which is shown to be isentropic in a gravitational field, this being a corollary of the Second Law of Thermodynamics.

    If you have comments to make thereon, please note that, when the paper appears on the PROM menu, a new public thread will be opened for such comments in the PSI forum.

  142. Norman says:

    tonyM

    Using this calculator
    http://www.humidity-calculator.com/index.php

    On the Alabama post you are correct. The absolute moisture of the air is greater in the warmer temp case. (205.33 grams/m^3 vs 188.75)

    However, the case in Phoenix (posted above the Alabama temp post) is much different. The warmer temp 84.9F at 30% R.H. has an absolute moisture of 105.17 grams/m^3 Where the cooler air at 77F with 76% R.H. has an absolute moisture of 198.41 grams/m^3.

    I do not think there is any way to assume that drier regions cool faster at night. I think much more study and conditions would be needed before any one can honestly state a certain answer. Perhaps there is a peer-reviewed paper that does have such a study. I think many people assume the case is drier leads to cooler nights just like many assumed the heavier weight would fall faster in Galileo’s time. What is needed is more research and far less belief and assumptions.

    Thanks for explaining the situation about humidity. My stake in this is the Truth, not belief. What is the data saying and why.

  143. Norman says:

    Doug Cotton,

    I was thinking about your theory of a thermal gradient developing in a gravity field. Your logic is reasonable about the K.E. + P.E to get total energy of the system. I was reading the article you had linked to “On Maximum Entropy Profiles” and it brought up something to consider. Not that it is correct but something to think about.

    There is another thing that happens to air in a gravity field. More molecules exist at the bottom of the feild and fewer at the top. This would change your K.E. + P.E. = Total Energy a bit (not sure how much at this time).

    In an isothermal condition at the bottom the average speed of all the molecules would be the same as at the top but there would be more overall molecules and so a greater oveall energy stored at the bottom in K.E. than an equal temp at the top. But the top part has more P.E. that does not contribute to the temp. So if the two parts were at the same temp (isothermal) there total energy may still be equal (and entropy the highest) because the lower part at the same temp has more molecules and each molecule will contribute to the overall total energy of that region.

    Does that make sense?

  144. Norman says:

    tonyM,

    In your post above you state: “If it was simply a case of just using a set of numbers I could have done that with the averages you put originally and with Doug’s averages. They both showed the right trend supporting the GHE effect and were obvious to me from the start.”

    Why would the dry air of Phoenix averaging 10F warmer than Mongomery, Alabama at night support the GHE effect?

    If I understand GHE correctly it would not matter if there is wind, clouds or night. It is a continuous effect only determined by surface temperature and amount of radiating molecules in the atmosphere. Wind would not change this.
    It would also be a stronger effect during the day than at night. During the day the surface gets much warmer than at night (the surface, during the day, in many cases is much warmer than the air temperature being measured so it is really radiating at a high rate). If you have a high amount of water in the air it will create a strong greenhouse effect (according to theory). So a sunny day in Alabama should warm much more than Phoenix because it receives equivalent solar radiation but it has a much stronger greenhouse effect so it will be double dosed with radiation. The drier desert should not get so hot because as the surface warms it will began radiating at a higher rate and having much smaller quantities of water in the air compared with Alabama much more of this radiation will make it through so it should not achieve higher temperatures during the day but it definately does. Why?

  145. tonyM says:

    Norman:
    Let me apologise as I had interpreted your action as something similar to Doug’s attempted proxy for humidity when the actual data was readily available and showed the opposite effect. The issue arose due to different “experiments.” From my perspective, you are putting the cart before the horse with your version of the experiment. Equally, you could say the same about me.

    Your experiment had finished once Tmax was reached. Mine virtually started then and was then confronted by thunderstorms. I’m looking for what happens once a Tmax has occurred and trying to make comparisons between extreme hi/lo absolute humidity conditions using the next Tmin as a proxy for heat retention. You are timing it the other way. I’m looking for extremes of humidity to try to show there is a heat effect; you are comfortable with close variations (which will cause problems in that other variables swamp what you try to measure).

    However cause and effect will favour my approach. Your approach will dictate that Tmin will be the cause of subsequent Tmax subject to humidity considerations if it has an effect. But this is almost like trying to create a meteorological model on the back of an envelope without any of the sophistication at all. How do you handle the latent heat for example as absolute humidity changes. I don’t have that problem in Namib because there is so little moisture and is so different compared to a high humidity area.

    The purpose of keeping variables the same is so that they can be excluded as much as possible as having much influence. I’m no meteorologist and your knowledge here would far surpass mine but I have seen fronts come in and change T by 15 deg in half an hour. Condensation/cloud formation will drop out heat and will influence T. Unless one has a good handle on all these variables and actually measures their contribution it is impossible to form a conclusion. Further, this would need to be done right through the experiment period not just T max/min.

    A GHE effect is not an effect which heats the earth. It is meant to work on the energy already in the system. Similar to a blanket – it will not heat a person where heat is internally generated chemically. A blanket simply suppresses heat transfer. Insulation does the same thing. It never heats a house – just keeps it warmer or cooler for longer by comparison.

    The GHE is very limited. It needs a doubling of CO2 concentration to increase the earth T by about 1.0C according to climatologists. There are formulae for these effects for various GHGs. Putting this in perspective between doubling CO2 and the assumed H2O positive feedback we are talking about 4 watts/m2 or about 3.0C. When the sun is overhead we are talking insolation of over 1300 watts/m2 or down to around 950w/m2 after albedo. Allowing for some atmospheric absorption we are still talking numbers which obliterate the GHE difference.

    So we are not looking at big effects to start with and will be swamped by different local conditions.

    Hence variations in GHG through a GHE have quite a minor influence on daily T. Water is of course different in that it participates in such wide array of ways through its different phases – most not GHE related such as clouds, cloud formation, condensation, rain, evaporation and even ice. There is an enormous amount of energy in latent heat absorption by water which is retained in its vapour state. This energy has to be accounted for somewhere. and it will not show up as T if it just increases.

    I might add that by pain of burning a lot of pans to red hot is a good way to understand that water takes up a lot of heat without going above its BP. Any evaporation takes up the same heat per mole (at same P) and consequently cools the source.

    This may help explain why Phoenix can have such higher Tmax compared to more humid Montgomery.

    I don’t know why you even ask these questions when your knowledge seems so well advanced in asking some pointed Q.

  146. tonyM says:

    Norman:

    Following on, I don’t believe in that full 4 watts per doubling of CO2. It doesn’t show up empirically at all via T measures. At best half that might at a stretch be acceptable based on empirical evidence over the last 160 years or even 70years (when 85% of the CO2 increase happened).

    Dr Spencer does not believe it either. Nor Dr Lindzen. Nor I think Dr Christy.

    I am not an advocate of CAGW but I can’t dismiss radiative suppression. Pyrgeometers certainly show the absorption of certain longwave radiation; that is very real.

    Reverting back to Namib desert versus a very high humidity location I have come to a conclusion that it must show mostly a lower Tmin even if Tmax is a bit higher.

    I will give you my rationale for you to comment..

    The dew point in Namib is going to be exceptionally low – far lower than say Singapore. Although the dew point is no guarantee of the minimum it is a good indicator of the limit. For the dew point to go lower then heat needs to drop out as condensation occurs. It is going to be caught in some sort of tandem yo-yo of T retention around the dew point or heat is being dropped out by condensation or rain.

    In Namib much of desert life relies on condensation for water – like beetles collecting it with their wings. This could only happen if the T drops to close to the dew point often enough which is much lower than Singapore.

    Whether this is a true test of the GHE effect is a different matter. The whole issue actually arose more from my saying that it would be colder in a dry place overnight which then seemed to morph into a direct GHE effect (but I’m not going to check on the exact wording).

  147. Norman says:

    tonyM,

    You said: “A GHE effect is not an effect which heats the earth. It is meant to work on the energy already in the system. Similar to a blanket – it will not heat a person where heat is internally generated chemically. A blanket simply suppresses heat transfer. Insulation does the same thing. It never heats a house – just keeps it warmer or cooler for longer by comparison.”

    I am not sure all think of it this way. Willis Eschanenbach thinks it works this way (will actually heat a surface).
    http://wattsupwiththat.com/2013/02/06/the-r-w-wood-experiment/#more-78966

    Do you have a previous post on your experimentation with Namib? I may have missed it. I am a newcomer in this debate.

    The way I have read the theory is that the GHE is huge. 33 C degrees worth. Most think water vapor contributes at least 75% or more and CO2 the bulk of the rest. So water vapor is heating the Earth’s surface by at least 24.75 C. It should be more than easy to see the effect between very dry air and very moist air.

    First I was a total Global Warming advocate (trusting in the scientists to give a true picture). Then I slipped to the Spencer level of feeling GHE was real but overplayed. Now I am moving into the Doug Cotton PSI view that it might not even exist.

    I am thinking if water vapor acts like a blanket or insulation than why don’t people put a insulate their attics with just thin metal? The metal will absorb the IR from the lower levels, quickly warm and start transmitting IR back to the floor keeping it from cooling as fast. Rather we use fiberglass to greatly slow down conduction. It seems a better blanket might be dry air since it can’t radiate as well and can only transmit its heat to the surface by conduction. Air is a very good insulator so this would be a slow process. Moist air can do both, conduct and radiate. Maybe that is the reason moist areas are cooler than deserts with same levels of solar insolation. The desert starts warmer because of the insulating effect of dry air and in the day it gets hotter because it started out hotter in the morning. Moist air is a good radiator so it cools off at night and during the day as things warm up it starts to radiate more keeping things from getting too hot. Yes enthalpy of the gases does play a role but even if desert air had less overall energy than the moist air, it could only lose its energy slowly via conduction with the surface.

    I am not sure of my reasoning at this time. I am throwing it out there to see your response and do more thinking about it.

  148. Norman says:

    tonyM,

    Another big one I forgot to mention. Many people use a cloudy night to prove back radiation slows down heating. But what if that is not the case at all. What if a cloudy night is caused by a termperature inversion which stops convection (a very rapid heat transfer process) so that the main cooling method of the surface is blocked and the heat accumulates and cooling is slowed down considerably and it has nothing to do with backradiation slowing the cooling?

  149. Doug Cotton says:

    Norman No, it is mean KE of the molecules that determines temperature. The 20 page paper will be online on the PROM menu at PSI within 24 hours. I guess it will be OK to copy the abstract and conclusions here …
    . .
     

    PLANETARY CORE AND SURFACE TEMPERATURES

    ABSTRACT

    The paper explains why the physics involved in atmospheric and sub-surface heat transfer appears to have been misunderstood, and incorrectly applied, when postulating that a radiative “greenhouse effect” is responsible for warming the surfaces of planets such as Venus and our own Earth.

    A detailed discussion of the application of the Second Law of Thermodynamics endeavours to settle the much debated issue as to whether of not a thermal gradient evolves spontaneously in still air in a gravitational field. The author is aware of attempted rebuttals of this hypothesis, but cogent counter arguments are presented, together with reference to empirical evidence.

    The ramifications are substantial, in that they eliminate any need for any “greenhouse” explanation as to why the surface temperatures are as observed. No other valid reason appears plausible to explain how the required energy gets into the planetary surfaces, this being especially obvious in regard to the high temperatures measured at the surface of the crust of Venus.

    The paper includes some counter-intuitive concepts which sceptical readers may be tempted to reject out of hand. Physics sometimes has some surprises, and so you are encouraged to read and understand the argument step by step, for it is based on sound physics, and unlocks some mysteries of the Solar System, including core and mantle temperatures, not previously explained in this manner to the best of the author’s knowledge.

    …..

    16. CONCLUSIONS

    When Maxwell and Boltzmann dismissed Loschmidt’s postulate of a gravity gradient they did the world a great disservice, and they contributed to a belief in a non-existent warming by an imaginary radiative greenhouse effect. The subsequent “calls to authority” should be a lesson for all in the scientific world, for this has resulted in an absolute travesty of physics. The greenhouse conjecture will inevitably take its brief place in history as the biggest and most costly mistake ever in the field of human scientific endeavour. Hopefully that will be soon.

    Scientists, be they climatologists, physicist or whatever, need to step outside the square and to adopt a paradigm shift based on, and supported by 21st century science. Dr Hans Jelbring and Roderich Graeff have each made significant contributions which must now be heeded before the mistake is perpetuated by those who now have personal vested interests in maintaining the status quo.

    Climate has in fact been following natural cycles [28] as shown in the Appendix to the author’s paper on Radiated Energy [2] and the world can expect a period of about 500 years of cooling to start within 50 to 200 years from now.

    The Loschmidt gravity-induced thermal gradient is more than enough to explain the proverbial “33 degrees of warming” and in fact the dry adiabatic lapse rate would lead to a mean surface temperature of about 25°C were it not for water vapour and, yes, to a much smaller extent, carbon dioxide reducing the gradient and causing lower base surface temperatures. In the Appendix is an outline of methodology that would almost certainly produce studies which would demonstrate the cooling effect of water in locations around the world.

    Thermal energy can and does “creep” up the very shallow thermal gradients in planetary atmospheres and also in their solid crusts and mantles, supporting sub-surface temperatures. Indeed the physics of “heat creep” resolves the long-term puzzles of planetary core and surface temperatures, and, for this very reason, begs attention and claims validity for this 21st century new paradigm shift in climate change science. [29]

  150. Doug Cotton says:

    Norman (continued)

    You need to consider what happens in a horizontal plane first. We know that energy diffuses and isothermal conditions develop by adiabatic diffusion in the horizontal plane. So we know mean KE is homogeneous horizontally where PE is constant. So we can deduce that there is a propensity to equalise KE at the time of molecular collision between two molecules. Basic physics shows this anyway.

    So in general, the molecules gain or lose KE during free flight whilst there is a propensity to share KE equally when they collide.

    So, consider the example in the last paragraph of Section 7 of the new paper. Those molecules that move into the lower one third bring more KE to their next collision, so it is as if they are already “hotter” than the ones that were down there. Vice versa for ones going from the warmer middle section to the top one third of the cylinder when the insulated dividers are removed.

  151. Doug Cotton says:

    tonyM

    Regarding use of precipitation rather than humidity: see third paragraph on p.18 of the new paper – just before the list of city data.

    Regarding ocean gradients: see Section 14. Rebuttal of Counter Arguments.

    Regarding max and min daily temperatures both correlated with reducing rainfall: See Section 17 – Appendix

    Regarding the rate of cooling and how it is affected by radiation and non-radiative processes and the impact on climate see Sections 1, 2, 8, 9, 10, 11, 12, 13 and 15 in particular. I hope you don’t think I “dismiss radiative suppression” – see “the big picture” in Section 15 but only after rading the other sections.

    How many people do you think you have to “call on authority” to? It does not impress me one little bit.

    If I know Dr Lindzen is wrong, I will tell him, as I just did before reading your comment in a private email to him, and also to Roy.

    I have many well known names backing me at PSI, but I don’t make a point of it or name them in an attempt to impress. But I call a spade a spade, and where Maxwell and Boltzmann were wrong, I have said so, as you can read above. I will not tolerate the ongoing travesty of physics, and I don’t care who someone is – if they propagate the mistake, I will say so, and do so in articles that get read by tens of thousands. You should know by now that the team at PSI is out to slay the greenhouse fraud.

    Water vapour and carbon dioxide do not act like a blanket. Oxygen and nitrogen do, whilst radiating molecules are holes in the blanket sending heat to space.

    See Ref [3] of the 30 references in my paper … to do so, find this file on the PSI website …

    Latest-News/the-greenhouse-gas-blanket-that-fails-to-warm-the-world.html

  152. Doug Cotton says:

    Norman is quite right of course about dry air being a better insulator than moist air. Have you ever heard of engineers telling builders to fill the gap between double glazing with moist air? If they did, energy would leap frog the slow diffusion and conduction processes, because water vapour molecules would radiate it at the speed of light across the gap, maybe via other molecules on the way, but always only ever transferring heat from warmer to cooler molecules. That’s what also happens in the atmosphere. Would you like me to study 100 cities, or will 15 do you? I’ve given you the results, and yet you refuse to even pick out another ten or so and do your own calculations.

    I think you’re threatened to face reality, tonyM, probably because you earn, or expect to earn (when you graduate) your income in some way which depends on retaining the status quo. Am I right?

  153. Doug Cotton says:

    The requirements of the Second Law of Thermodynamics are for a state of thermodynamic equilibrium which is also a state of maximum entropy. Logic leads to the inevitable conclusion that (PE+KE) must be constant per molecule for any small (just measurable) region.

    Because it is mean KE (per molecule) that determines temperature, what we have when (PE+KE)=constant is the mean (PE+KE) being equal in every small region, even when that region approaches the limit of 1 molecule, though I know we can’t measure that temperature. But you can imagine a thought experiment wherein you select a small cubic region that is just big enough to measure temperature. Then you consider the next cubic region of the same size which is vertically below and overlaps the first by 99% and so on for 100 regions, until the last one is quite separate from the first. But the last one will still have the same mean (PE+KE) per molecule, even though mean PE would be different. So mean KE would be different and thus temperature is different, regardless of whether or not there are more molecules in the lower region.

    Consequently, there must be a thermal gradient in dry air resulting in a mean Earth surface temperature probably between 20 and 25 deg.C if all air was dry and free of radiating molecules which would reduce the gradient. Now introduce WV and CO2 and its colleagues, and then intra-atmospheric radiation reduces the gradient so that the surface temperature drops to a mean of about 15 deg.C. It happens world-wide, and it happens in any particular location. you just have to compare locations where other parameters are the same, or can be allowed for, such as different altitudes.

    If you think you have a counter argument, you will probably find it already debunked in my paper.

  154. tonyM says:

    Norman:
    You are covering a lot of ground.

    You are going to have to discern for yourself about what various people write. Ultimately science is supposed to be about empirical evidence so until someone actually shows some then treat it a little warily. Even then question whether there is cherry picking.

    GHE:
    Re GHE I’ll stand by the blanket or suppression effect definition which is what most writers seem to suggest nowadays. They put it in a manner that avoids saying that there is a direct “heating.”

    There certainly is an effect. Engineers being practically oriented and know their business in heat transfer use Poynting vectors and an array of formulae. This too seems to accord with some outgoing heat radiation suppression and is in accord with what Doug Cotton describes from Claese Johnson.

    Don’t misunderstand: Doug/Claese Johnston are not saying there is no effect – something has to happen to that back-radiation. It does not just disappear which would contradict the 1st Law of T as it is energy. Even creating permanent standing waves bouncing about is not enough because at some stage somewhere on the surface T drops to below the T from where those photons came. What would happen then?

    Namib:
    On the Namib desert experiment it was purely fictional challenge to Doug to compare it with Singapore under similar conditions (except moisture). Namib has very low moisture and Singapore has high levels. I have given you my thoughts on the two. I would be reluctant to form conclusions about GHE from that as obviously much is related to latent heat.

    Insulation:
    Systems do actually use thin metal like aluminium to moderate T – just two sheets of Al in the ceiling separated by free air. But it does not act by absorption of any radiation (maybe 5%). It reflects and you see this effect in flimsy aluminium to wrap people who have been subjected to the elements. As long as there is a reasonable air gap Aluminium is great as an “insulator” by reflection.

    Fiberglass acts by trapping air and slowing conduction/convection. But, have you never seen fiberglass WITH a film of aluminium stuck to one side? It is real! It exists and is a system in parctical use when a new roof is installed – applied directly under the corrugated metal (not sure about tiles).

    Dry air will not stop radiation. GHG’s only absorb certain limited ranges in the spectra so they hardly just call a halt to radiation.

    Degree of forcing:
    True the conjecture has been that it is a 33deg cooler earth without GHG. But even if correct it is related logarithmically. Double the CO2 or halve it for a 1.0C effect. Halve that again etc. for the same change. These formulae for forcings are documented in the IPCC reports. The effect I posited is basically what Hansen et al 1988 paper uses. So you will just have to accept that changes at the margin don’t have the same impact – much like diminishing returns principle.

    I don’t believe it even has that effect. I said that at best it would have half that rate given the empirical evidence when tested from 1850 or from 1945. Dr Lindzen is even more sanguine suggesting that we have had a full doubling of CO2 equivalent for only a total of about 1.0C deg warming loosely from the 1880’s.

    In other words the “catastrophic” component of CAGW is falsified empirically.

    I may be wrong and spreading gossip but I seem to remember seeing a a comment reinforced by another reader that there may be a new paper involving Drs Spencer, Lindzen, Choi and coming out with evidence of even smaller increases. One can only hope! Sparks would certainly fly then.

    A 2001 paper of John E. Harries et al says:
    “…outgoing longwave radiation of the Earth as measured by orbiting spacecraft in 1970 and 1997. We find differences in the spectra that point to long-term changes in atmospheric CH4, CO2 and O3 as well as CFC-11 and CFC-12. Our results provide direct experimental evidence for a significant increase in the Earth’s greenhouse effect that is consistent with concerns over radiative forcing of climate. ”

    http://www.nature.com/nature/journal/v410/n6826/full/410355a0.html

    Clearly it can’t be dismissed lightly. Of note is it says nothing about H2O spectrum.

    Norman, I can’t comment on inversions and so on as I don’t have the knowledge to contribute. But I leave you with this thought about the immediate direct influence of GHG’s. If a sandy surface was at 40C and the emissivity was 0.75 then the S-B radiation flux would be over 400 W/m2. This compares to a total effect of doubling CO2 of up to 4 W/m2 of back-radiation. Clearly it is swamped…

  155. Entropic man says:

    I flew gliders in years gone by, and still fly radio control model gliders. Both remain airborne by using convection.

    A reasonable sailplane sinks at 3kt and can maintain height in a 3kt thermal. Anything above that allows the sailplane to gain altitude.The pilots become experts in finding, detecting and exploiting thermal activity in the surface to 3000M band of the troposphere.

    My models do the same, but visibility constraints limit them to 300M.

    Both find that the best soaring weather is warm and sunny. A little humidity helps, but not too much. A slight wind around 2M/sec also helps.Visually the day appears sunny, with scattered cumulus clouds at 1500M plus.

    From the physicists’ point of view sunny conditions give maximum surface heating.

    The humidity comes from surface moisture vapourising, which increases the efficiency of heat transfer from the surface to the air above.It also warms the rising air when water vapour condenses at the cloudbase, allowing convection to continue above that level.

    In zero wind conditions the bubbles of warm air tend to remain attached to the surface. A light wind helps them separate.

    Hot weather actually reduces convection initially. A layer of hot and humid air is trapped by an inversion layer at around 1000M.Convection is suppressed for a time.until enough energy accumulates for hot air to break through the inversion layer. This then rises rapidly to high altitudes, condensing water vapour as it goes.The result is storm cells, thunderstorms and heavy rain.

    You will recognise this pattern as typical of Summer anticyclone conditions. A few days of hot, still and humid conditions breaks with heavy rain. Conditions become cooler briefly and the cycle then recurs.

  156. Norman says:

    tonyM,

    Thanks for your continuation of your posts. You post “Don’t misunderstand: Doug/Claese Johnston are not saying there is no effect – something has to happen to that back-radiation. It does not just disappear which would contradict the 1st Law of T as it is energy. Even creating permanent standing waves bouncing about is not enough because at some stage somewhere on the surface T drops to below the T from where those photons came. What would happen then?”

    I think Doug explained it that it would be scattered away and not make it to the satellite detection (would leave atmopshpere at a different route). Yes the water vapor and CO2 absorb IR at certain wavelengths so there is a lack of these radiations coming through. They reemit but the warmer ground cannot absorb them (all possible states of the incoming IR are taken there is no place for this radiation to go). It would be like an atom is at an excited state already for a red photon and a red photon strikes it. The red photon cannot be absorbed until after the atom has released a photon and moved to a lower energy level. I am going out on a limb here and could very well be wrong. Maybe it is like a fog. Photons still hit a tree and tansmit the image of a tree in all direction (you can see it if you get close enough) but with a thick fog the photons are so scattered in so many directions that the image of the tree is no longer visible. The sensors on a satellite need some type of lens to focus the IR with and a detector, maybe with the scattering done by the Doug Cotton idea, the true image of IR leaving the Earth is like in a fog and cannot be accurately determined.

  157. Norman says:

    tonyM,

    You are correct about the aluminum blankets.

    http://en.wikipedia.org/wiki/Space_blanket

  158. Norman says:

    tonyM,

    “Ultimately science is supposed to be about empirical evidence so until someone actually shows some then treat it a little warily. Even then question whether there is cherry picking.”

    That is a good comment. It makes me want to investigate further. So I went back to Maxwell AFB in Alabama and looked for a period of clear days (not calm though). It was between June 23-30.

    I took all the high/low temperatures, the relative humidity for the high/low and the barametric pressure.

    I used the humidity calculator to get the absolute humidity (in grams/cubic meter) of each sample air. This is a direct measure of the water vapor in the air being looked at. I also used the caluclator to determine the energy of the air (enthalpy).

    Very limited sample but it also shows the complexity of gathering empirical evidence to prove anything about GHE (since water vapor is the strongest of the GH gases this would be the place to look for evidence).

    In this short study I logged all the data on an excel spreadsheet and made graphs between the various data. I found that Temperature and actual energy of the air do not correlate at all. When temp goes up energy may go down or visa versa. Absolute humidity and the energy of air correlate strongly. I do not think temperature should be used to prove or disprove if a greenhouse effect is taking place. What should be looked at it the absolute humidity of the air and the energy the air has. Since temperature alone tells you nothing about the energy of the air and you could not use this to determine how energy is either being retained by water in the air or losing energy.

    To get good empirical data would take a lot of data and time. All the information is available to test but I am not sure anyone has taken the time to do this. It would provide absolute empirical evidence for or against a GHE and alos would give a very clear level of any amount a GHE would have. Would be much better than a model projection as it would take in all the complex variables that go into the energy equations.

    Thanks again for you posts, they make me think.

  159. Norman says:

    Doug Cotton,

    “Because it is mean KE (per molecule) that determines temperature, what we have when (PE+KE)=constant is the mean (PE+KE) being equal in every small region, even when that region approaches the limit of 1 molecule, though I know we can’t measure that temperature. But you can imagine a thought experiment wherein you select a small cubic region that is just big enough to measure temperature. Then you consider the next cubic region of the same size which is vertically below and overlaps the first by 99% and so on for 100 regions, until the last one is quite separate from the first. But the last one will still have the same mean (PE+KE) per molecule, even though mean PE would be different. So mean KE would be different and thus temperature is different, regardless of whether or not there are more molecules in the lower region”

    Thanks for your response to my question. I am reading this and thinking about it. I can see what you are saying but I still have to work it through.

  160. Doug Cotton says:

    The new paper has had some polishing and should be online soon in the PROM menu at Principia Scientific International. Some of the refinement I wrote today in Sections 1 and 2 (out of 18) may make clearer to you all that all the talk about radiation etc is just to do with marginal temporary daily warming and cooling. You have to see the big picture. You can’t study climate even for one city with using several years of indormation, preferably 30 years as in the data I used to show that dry cities are warmer (both max and min) than wet ones.

  161. Espen says:

    Wow, what a lot of noise in the comments session!

    Dr. Spencer may soon break the record for the world’s tallest website!

  162. Norman says:

    Doug,

    The point I was making in the little study is that temperature does not reflect the actual energy content of the air. You need to know the enthalpy of the air to do a fair study. You would need 30 years of average enthaply studies to see if a GHE was real or not. Drier cities can easily be warmer yet contain less energy and energy loss and gain would be much more critical for a study than temp.

  163. Massimo PORZIO says:

    @Norman
    “tonyM,
    You are correct about the aluminum blankets.”

    Uhmmm… Maybe I misunderstood what you meant Norman, but this link seems to tell an another story:

    windowoutdoors.com/WindowOutdoors/Staying%20Warm%20-%20Interesting%20Observations%20on%20Heat%20Loss.htm

    Just below Fig.7 you can read:
    “So what do all these calculations mean:…

    … c) a space blanket is no better in most emergency situations than an ordinary large plastic garbage bag, bivouac sack, or cagoule”

    And this link seems to confirm:

    http://www.traditionalmountaineering.org/FAQ_SpaceBlankets.htm

    Some times ago I did an experiment heating a 1 inch diameter first surface mirror and measuring the temperatures of the air at points very close to its two opposite surfaces. The mirrored face heated the air practically at the same temperature of the opposite rough surface, even if the IR thermometer reported a very different radiation on the two surfaces.
    In my opinion space blankets works great only in vacuum. That’s because in vacuum the only ways heat has to dissipate is by radiation, while in atmosphere, as Doug said some posts ago, heat seems propagate using the best way it can.

    Massimo

  164. Doug Cotton says:

    Norman Let’s not get too esoteric here. All that the climatologists are going to tell us is what their thermometers read between 1.5m and 2m above the ground, and what their rain gauges measure. The water vapour at that level is unlikely to release latent heat, and chemical reactions are also unlikely, so kinetic energy and gravitational potential energy are the main things to consider. Besides, how do you propose measuring total enthalpy? Normally you can only measure changes in enthalpy from one state to another. In general, I have adjusted temperatures for differences in potential energy in my study of the 30 year data which showed that wetter locations were cooler, contrary to what greenhouse proponents think should be the case.

    Just wait till you see the paper – I’ve now sent the final corrections, so it should appear early in the week.

    .

  165. John K says:

    Roy,

    If climate alarmists are correct, shouldn’t higher average temperatures experienced during the time period comprising the wind speed data translate to greater thermal energy in our (U.S.) atmosphere and result in higher wind speeds? In fact, many climatologist claim that storms have increased in strength and wind speed for precisely that reason. Apparently the data doesn’t support such popular beliefs.

  166. David South says:

    My guess is the wind speed has dropped because the vegetation around the station has increased since 1970. An increase could be demonstrated by comparing photos taken 30 years ago (at the station), vs photos taken now. For example, from 1970 to 2006, forests in the USA increased in volume by about 28%. Could the extra branches and leaves reduce wind speed by 1.5 MPH?

  167. Norman says:

    Massimo PORZIO

    Thanks for the info on the space blankets. The websites I visited all praised them as amazing. I have never used one so I had no experimental evidence to how effect they were in keeping a body warm.

  168. Norman says:

    Doug,

    The point I was bringing up was that to determine if water vapor is providing a cooling effect you would need to measure the energy of the air between wet and dry and see if the loss of energy (mainly from day to night conditions) were greater in the wetter air.

    http://www.ohio.edu/mechanical/thermo/Applied/Chapt.7_11/Chapter10b.html

    This link has a chart (they say it is a simplified version of the more complete charts) which has temperature, humidity levels and then an energy (enthalpy) component.

    On the graph you can see that air at 45C with 10% R.H. has the same energy as much cooler air 24C at 80% R.H. Wetter air holds much more energy than dry air so even if wetter areas are cooler in temp, they may hold more energy than the dry areas.

    In order to determine if moist air is losing energy faster than dry air wouldn’t you have to move the study to energy rather than temperature? Wouldn’t you want to take the energy of wet air and see how much energy it loses in the day/night cycle (provided masses of air from other areas are not effecting the study so you need calm conditions). Then also take the energy in your drier air and observe how much energy it loses in the day/night cycle?

  169. Doug Cotton says:

    Norman, it would be best if you read the revised paper which is about to appear on the PROM menu at Principia Scientific International.

    Basically I’m talking about the underlying support temperature which is affected by the fact that water vapour causes a less steep thermal profile, which thus intersects the surface at a lower temperature.

    I am not disputing that, between day and night, water vapour slows the rate of radiative cooling of the surface, but the daily warming and cooling is only a marginal effect. This is the key point that has not been recognised by climatologists.

  170. Norman says:

    I can see what you are saying in data I am compiling. Not the long term average you did but similar. So many assume a desert cools so much at night but none of the data I look at would prove this point.

    I compared a clear July day in Las Vegas, Nevada and a clear July day in Maxwell AFB in Alabama. The air in Vegas is very dry, 8.5 times drier than the Alabama air. This should be more than enough to show a very strong difference in cooling. None really exists. The temperature trend seems more to follow your temperature gradient theory. The dry Las Vegas Air has a higher temp day and night.

  171. Doug Cotton says:

    The data source I have been using (Ref [30] in the paper) does not have Maxwell, but Las Vegas is certainly hot and dry: latitude 36N Altitude ~700m
    July mean daily minimum 24.6C July mean daily maximum: 41.1C Precipitation: 8.9mm

    The hottest and driest in my study (limited to the tropics, was
    Alice Springs, Northern Territory, AU, altitude 545m, Lat: 23.6S
    January mean daily Min: 21.8C, January mean daily Max: 36.9C Precipitation: 39.9mm

    It would be hard to imagine many cities with high rainfall having hotter temperatures than these.

    Roy: It staggers me that climatologists have not done studies on this as far as I can ascertain – be the first! See the Appendix of my new paper “Planetary Core and Surface Temperatures” which will be linked from my PSI article about your misunderstandings.

  172. Norman says:

    Doug,

    I think there is more evidence in your theory if you go up elevation for a study. The cool desert idea comes from high plains deserts. These have a high dinural range. Denver Colorado (mile high city) has a dinural range of 27 F in July(sorry for English temp scale but the variation is what counts) where Alabama is 20 F. This also fits your theory of temperature caused by the lapse rate. The solar heating of the ground and lower atmosphere during the day opposes the gradient, then at night the temperature wants to revert to the normal lapse rate temp (regardless of the moisture content of the air).

    I wonder if they do have good detailed explanations of why dry desert air is warmer at night than really moist air? From other posters on this blog it seems as if most assume the desert gets much cooler at night and that the GHE via water vapor is confirmed. When you have air that is 8.5 times drier is means you are doing 3 undoublings on the logrithmic scale for water vapor absorption. This should for sure show up in the temperatures but it does not. I would really like to see Roy and others explain what you are demonstrating. Hopefully all your detractors will actually do some research before calling you wrong. I did and my research is pointing to your reasoning and not the other.

    Well you might be off soon for surgery. Hope all goes well and you continue with your theory. If it is as wrong as so many say then I hope they can back up their claims.

  173. tonyM says:

    You asked for data on Namib.
    http://weather.namsearch.com/namibdesert/wxclimate.php?date=climatedataout

    Perhaps you can compare the variation in T from max to min
    of Namib (Kalahari is also there for Feb) which is really dry with

    Las Vagas – not as dry or Maxwell more humid again) for July.

    In both cases Namib will clearly show a greater difference compared to the US cities.

    Namib will show differences mostly in excess of 15 deg whereas the more humid US cities will show mostly lower than 15 deg even though Tmax is mainly higher in Vagas. A better picture emerges when comparing the more humid days in Vagas – when the Vagas data symbols are showing thunder/cloud. I leave you to work out segmented averages as I’ve only cast my eyes over them.

    Maxwell is more pronounced.

    This started off with a comparison of humid Singapore with Namib where this effect is even more pronounced again.

    I noted your comment in the last post :
    “I wonder if they do have good detailed explanations of why dry desert air is warmer at night than really moist air? “

    Perhaps both of Doug and yourself could try to experience this warmth in the Namib. Sorry I could not help that given that the minimum this month has been 11.1C when the max that day was 32C.

    On the issue of back radiation you say:
    “I think Doug explained it that it would be scattered away and not make it to the satellite detection (would leave atmopshpere at a different route). “

    I can’t find that. Just because he says that does not make it right. He is wrong with his logic on dismissing the “1st school of thought” and I have pointed that out.

    But I am not convinced he would argue that way as whatever scattering occurs and makes it to space has the same chance of detection basically as any GHG re-emission from the same locality.

    Massimo PORZIO perhaps has a view on this as he earlier, or on another thread , referred to a paper where it suggested the satellites may not be detecting all the outgoing radiation. But this has more to do with how restrictions on field of view may affect it rather than missing specific “scattering.”

  174. Norman says:

    tonyM,

    Using the Namib may not help your case. It is a wet desert with high humidity. I calculated the R.H. of the desert on January 1st 2013. Ave Temp 25, average dew point 11.2 which calculates to a 41% Relative Humidity. Las Vegas is in the teens on R.H. at night and goes down to 5% during the day. About Namib desert.

    “On the coast, humidity is 100 percent for 19 hours per day in summer and for 11 hours in winter. At the inner edge of the desert, the air is much drier, fog is virtually unknown, and the humidity seldom exceeds 50 percent. This is nevertheless fairly high for a desert region.” source
    http://www.newworldencyclopedia.org/entry/Namib_Desert

    Also consider that the location you chose is 965 meters above sea level. I think, if you research it (I have started a little project) you will find higher elevations have significantly greater dinural ranges than those closer to sea level (which seems to support Doug Cotton’s thermal gradient idea but in no way proves it). In Colorado a town in the mountains (10,000 feet) has a dinural range of 30F which is much higher than the sea level deserts.

    I looked at the elevation of the Kalahari “The Kalahari is a featureless, gently undulating, sand-covered plain, which everywhere is 3,000 feet (900 metres) or more above sea level.” source:
    http://www.britannica.com/EBchecked/topic/309972/Kalahari

    If you go to the PSI site you can read articles on the radiation measurements. They indicate the downwelling measure of radiation might not be valid the way it is checked. The amount of radiation coming down may not be what they say. SB equation works for a blackbody surface. I do not know how it works for radiating species in the atmosphere. How much energy would water vapor and CO2 radiate at a given atmopsheric temperature. If you had a blackbody you can directly calcualte it, but does the air work the same way?

  175. Massimo PORZIO says:

    Hi Norman,
    “If you had a blackbody you can directly calcualte it, but does the air work the same way?”
    Nice question.
    The only reference I found was from an old Italian book of physics where the author stated something like that: “if you enclose the gas in a box the SB equation works as for solids, no matter the kind of gas”.
    But that’s not what we are looking for of course.
    I still have many doubts about the correctness of considering the incoming radiation as the result of the averaged temperature “seen” by the radiometer.
    As far I know the climatologists use an atmospheric emissivity of about 0.83 which should be the sum of the emissivities of the GHGs only.
    What I’m arguing is that if you aim the almost mirrored plate of a hot flatiron using an IR thermometer, you read about the same temperature of the surrounding environment, but if you touch it you get a very different “sensation”.
    My heated first surface mirror experiment proved that it works with the surrounding air too.
    In fact, I imagine that nobody could argue that an hot flatiron don’t heat the surroundings air.
    Thus, I believe that all the gases work as a blanket not only the GHGs.
    In my opinion the IR thermometers read only the tiny radiative part of the blanket effect.
    Blanket effect which it’s almost all done via thermodynamic diffusion due to the gravitational field, which make rebound the molecules to the ground.
    In few words, it’s like that the Earth gravitational field works as a box which constrains all the gases to impinge the ground making the whole atmosphere a black body suited to the SB equation.

    Massimo

  176. Norman says:

    tonyM,

    If you are interested I am doing a limited study on elevation/moisture/ and dinural range of temperature.

    So far I have long term climate for 4 US cities. Since you live in Australia I will put the terms in metric.

    Denver, Colorado: 1610 meters above sea level
    Rainfall: 40.16 cm/year Dinural range yearly average: 15.8C

    Springfield, Illinois: 178.6 meters above sea level
    Rainfall: 90.32 cm/year Dinural range yearly average: 10.9C

    Las Vegas, Nevada: 610 meters above sea level
    Rainfall: 11.40 cm/year Dinural range yearly average: 13.1C

    Vail, Colorado: 2484 meters above sea level
    Rainfall: 55.80 cm/year Dinural range yearly average: 16.2C

    In July Vail has dinural range of over 20C
    July in Las Vegas dinural range of 14.4C
    July in Springfield dinural range of 11.3C
    July in Denver dinural range of 16.3C

    Vail has much more moisture annually than Las Vegas and more than Denver but it has a much higher dinural range than the other two. So is high dinural ranges due to moisture content of the air or is it more do to elevation?

    I think the answer is worth asking and it needs a much larger study since local effects can cause significant deviations. I think it would be very useful for a climatologist study with a full grant and time to do a proper scientific job looking to eliminate the complex variables that can easily effect my short study.

  177. Doug Cotton says:

    Norman With my study I considered it was too complicated to start bringing in areas outside the tropics where temperatures would need to be adjusted for the angle of the Sun, extra absorption of incident radiation etc. So I just considered cities where there was one month in which the Sun would be almost directly overhead. There tends to be a delay, so that January is usually hotter than December. Latitudes closer to the Equator have peak months in February or March.

    Remember I also selected cities at least 100Km inland and I adjusted for altitude as explained in the Appendix of the paper, only selecting 0 to 1200m altitude. This limits the number of cities that can be included in the tropics. The new paper will be online for all to read, together with my article “Roy Spencer’s Misunderstood Misunderstanding and the $100,000,000,000 Question” within 24 hours at Principia Scientific International.

  178. Doug Cotton says:

    My new paper is now online …

    ABSTRACT

    The paper explains why the physics involved in atmospheric and sub-surface heat transfer appears to have been misunderstood, and incorrectly applied, when postulating that a radiative “greenhouse effect” is responsible for warming the surfaces of planets such as Venus and our own Earth.

    A detailed discussion of the application of the Second Law of Thermodynamics endeavours to settle the much debated issue as to whether or not a thermal gradient evolves spontaneously in still air in a gravitational field. The author is aware of attempted rebuttals of this hypothesis, but cogent counter arguments are presented, together with reference to empirical evidence.

    The ramifications are substantial, in that they eliminate any need for any “greenhouse” explanation as to why the surface temperatures are as observed. No other valid reason appears plausible to explain how the required energy gets into the planetary surfaces, this being especially obvious in regard to the high temperatures measured at the surface of the crust of Venus.

    The paper includes some counter-intuitive concepts which sceptical readers may be tempted to reject out of hand. Physics sometimes has some surprises, and so you are encouraged to read and understand the argument step by step, for it is based on sound physics, and unlocks some mysteries of the Solar System, including core and mantle temperatures, not previously explained in this manner to the best of the author’s knowledge.

    http://principia-scientific.org/publications/PROM/PROM-COTTON_Planetary_Core_and_Surface_Temperatures.pdf

  179. Norman says:

    Doug Cotton,

    I was looking around the web for evidence one way or the other on the issue of your gravitational thermal gradient theory. Many have argued that the oceans show no evidence of such a gradient and will not accept your explanation. Based upon your answer you would not expect to see the temp increase as you move down the oceans in areas where there is a lot of solar insolation warming the surface. So I went to the arctic where there is no solar insolation in the winter and the surface is covered with ice so it has a cap.

    This .pdf on page 10 of the 50 page document has a graph of the arctic ocean at the north pole (both temp and salinity). The water temperature actually does rise as you move down in the ocean (to a point) showing some signs of the gravitaional induced gradient in ocean water.

    http://www.colorado.edu/geography/class_homepages/geog_4271_f12/lectures/notes_6.pdf.

  180. Norman says:

    Doug Cotton

    I was looking at glaciers to see how they respond to a gravitational induced thermal gradient. It is a possibility with this glacier. Page 6 of this document has a vertical temperature profile of the glacier. In the winter with low solar insolation the temperature becomes more positive with depth. In summer months the opposite effect takes place, the surface is much warmer and the gradient is opposite. I do not know if this example shows the gravitational effect or not.

    people.ee.ethz.ch/~luethim/pdf/script/pdg/chapter6.pdf

  181. Doug Cotton says:

    Thanks Norman for your time spent on this. It is interesting and I think that probably the best indicator is the deeper water and ice being warmer in winter at the poles. I know they say terrestrial heat flow is warming the base of the ice where it rests on land in Antarctica, but my hypothesis says the ice is supporting the sub-surface temperature, and that we do not know when heat is flowing up or down in the thermal plane in the outer crust when it represents a thermodynamic equilibrium state.

    There are many factors at play in all this, though, so summer months don’t prove much. As they said: “Heat sources at the surface are from the air (sensible heat flux), direct solar radiation (short wave), thermal radiation (long wave), and the penetration and refreezing of melt water (convection and latent heat). The temperate layer at the bed can be of considerable thickness and is caused by geothermal heat flux and heat dissipation due to friction and ice deformation.”

  182. Doug Cotton says:

    (continued)

    The Beaufort Sea (north of Alaska) does indeed show the right gradient below 200m which would be beyond the main effect of the Sun because of the oblique angle. In the next 400m (down to 600m) it rises in temperature from -1.5C to +0.5C which is equivalent to 5 degrees in 1Km. That is about right, because the specific heat of the salt water is about twice that of air, so the gradient is about half the dry adaibatic lapse rate in air as would be predicted with -g/Cp.

  183. Norman says:

    Doug Cotton,

    I was thinking some about the gravitional thermal gradient.

    I think gravity may work to establish such a gradient (it makes sense logically at least with the K.E. + P.E. total energy) but gravity would also oppose this effect in liquids and gases.

    A thermal gradient is established in a heated room by gravity but opposite of the K.E. + P.E. effect. The other effect is density. Outside of a gravity field warm air would not rise and keep the air in the upper part of the room warmer than the floor. Gravity creates a thermal gradient in a heated room by pulling down the colder more dense air and allowing the lighter warmer air to rise to the top of the room.

    Maybe that is why oceans only show the gradient for a while than end up in a strait line down. The gravity force working to establish a thermal gradient of K.E. + P.E. is opposed by graivty pulling down the colder heavier water or air because of density differences.

  184. Doug Cotton says:

    Norman – best if you read ny paper – especially Sections 8 on heat creep. Warm air doesn’t always rise.

  185. Norman says:

    Doug Cotton,

    I did reread Section 8 of your paper (heat creep). I do understand your points in this and it does explain both Venus and our Troposphere. The gravitaional thermal gradient can exist on Earth because the density of the air drops as you go up so that the colder air above is less dense so the nighttime warmer air has no tendency to rise. During the day the air is warmed faster and the density of the air drops creating the convection circulation. At night when the surface has cooled down and convection stops the gravitaional thermal gradient works.

    If the kinetic energy would creep down (through all the molecular interactions) in still air it leaves colder air above. If the density was not different (also created by the gravity field, outside gravity no density gradient would exist) the colder air would drop and replace the less dense warmer air. The reason the colder air remains aloft and the warm air below is because the density is the same (the warm air is less dense because of its temperature and the colder air above is less dense because of the thinner air as you go up).

    I am still agreeing with your view at this time. As an experiment would it not be better just to have a very well insulated pole rather than air since density differences of water or air can effect the outcome you are looking for. In a solid the density will not change only the K.E. and P.E. will exchange so the gradient should be easier to detect in solid material where opposing flows caused by density differeces will not take place.

  186. tonyM says:

    Norman:

    Sorry for the delay. I take your point but the Namib Desert is a huge expanse and is hard to classify by limited descriptors.

    There are numerous references to the Namib which do indicate extremes – certainly for localised areas.

    Thanks for your invite but thought I was was being helpful in providing the resource for you 🙂 rather than my volunteering for work.

    Any such study is on an “open system” with no real natural boundaries. Hence it allows energy and matter to flow in and out. It really is mostly an uncontrolled experiment when we try to deal with limited parameters and these are mostly averaged (on a couple of measurements per day) or subjectively interpreted.

    Before you undertake any real work perhaps it may be a good idea to dialogue with weather Bureaus about their modelling. They deal with it constantly and are pretty good in their forecasts despite the usual “complaints” we make.

    Perhaps also research the published papers. Here is one by chance:
    http://www.atmos.umd.edu/~sun/Sun_IEEE_DTR.pdf

    From the paper:
    “Evapotranspiration from land vegetation and the effects of water-vapor radiative forcing have a major effect on the detected spatial and seasonal variations in the DTR (Diurnal temperature range ) patterns.

    A remarkable resemblance between low DTR and high vegetation index is found for all seasons [25]. Evapotranspiration is found to be higher in the east than in the west, especially during summer
    (Fig. 2). Evapotranspiration from vegetation contributes significantly to the dip of DTR during the warm months in the
    eastern U.S. [26].

    On the back radiation I’m not sure what problems you are seeing. Every type of measure has errors but engineers do address these issues so I guess we need to trust them.

    Dr Spencer’s Tropospheric Temperatures Monthly T is done in this manner using O2 microwave radiation (a brief description is in his monthly thread).

    I know Nasife Nahale talks about the variability of emissivity of CO2 but I’m not sure he can conclude anything which changes the basic thrust. Emissivities change for concentration, pressure and for wavelength even. But these types of variations apply to most matter.

    AlecM gave a good account on this site on the limitations when using pyrgeometers. But his thrust really was a cancellation of Poynting vectors such that most of the down-welling radiation did not have a thermalising effect. Equally it does effectively suppress a proportion of outgoing radiation.

    Even Doug’s paper recognizes this. Where Doug goes wrong is his assumption that it either is instantaneously compensated (which he can’t show) or it simply takes longer to cool and then, from this, concludes the “1st school of thought” is wrong and dismisses it.

    Problem is if it takes longer to cool then it substantiates the AGW hypothesis because it is not T max which is being used but rather an average T of two daily measures – really as a proxy for continuous T measures.

    AlecM was going to write a paper which would have been very informative being from an engineer well versed in heat transfer. You should be able to find his original comments.

  187. hello there and thank you for your information ? I’ve definitely
    picked up something new from right here. I did however expertise some technical points using this site, as I experienced to reload the web site many times
    previous to I could Natural Pure Keto – Get A Better Body Naturally! | SpecialOffer! it to load correctly.
    I had been wondering if your hosting is OK? Not that I’m complaining, but sluggish loading instances times will
    very frequently affect your placement in google and can damage your high quality score
    if advertising and marketing with Adwords. Anyway I’m adding
    this RSS to my e-mail and can look out for a lot more of your respective interesting content.
    Ensure that you update this again very soon.

  188. I like this blog its a master peace! Glad I detected this on google.

Leave a Reply