Tropical SSTs Since 1998: Latest Climate Models Warm 3x Too fast

February 21st, 2013 by Roy W. Spencer, Ph. D.

Following up on yesterday’s post, I’d like to address the more general question of tropical sea surface temperatures since 1998. Why haven’t they warmed? Of course, much has been made by some people about the fact that even global average temperatures have not warmed significantly since the 1997/98 El Nino event.

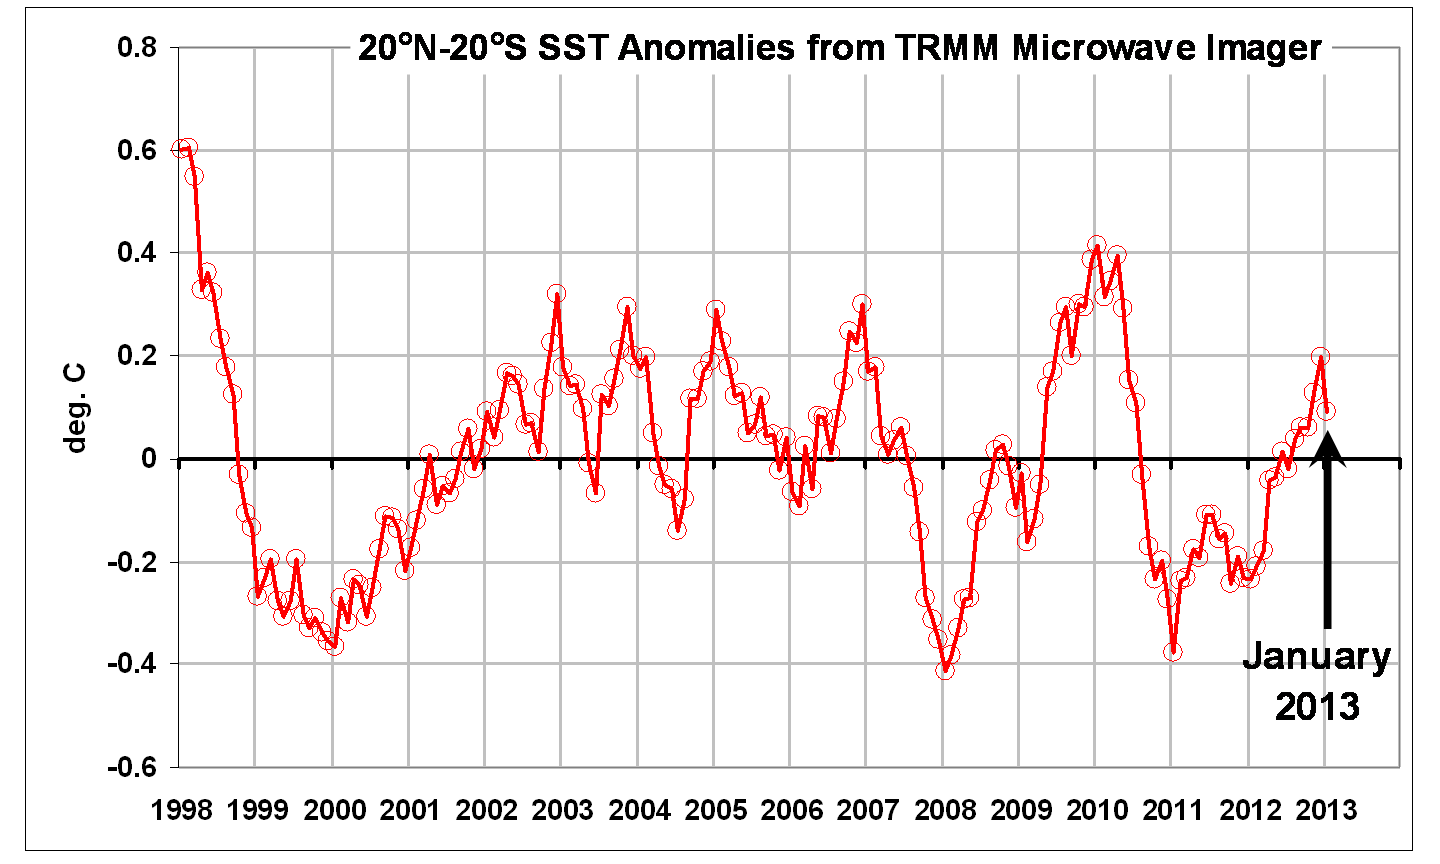
Using the Tropical Rain Measuring Mission (TRMM) Microwave Imager (TMI) SSTs available from Remote Sensing Systems (all 15 GB worth), here I will statistically adjust tropical SSTs for El Nino and La Nina activity, and see how the resulting trend since 1998 compares to the latest crop of IPCC CMIP5 model runs. We will restrict the analysis to 20oN to 20oS latitude band, which is the usual latitudinal definition of “tropical”.

The resulting TRMM TMI SST anomalies since January 1998 through last month look like this:

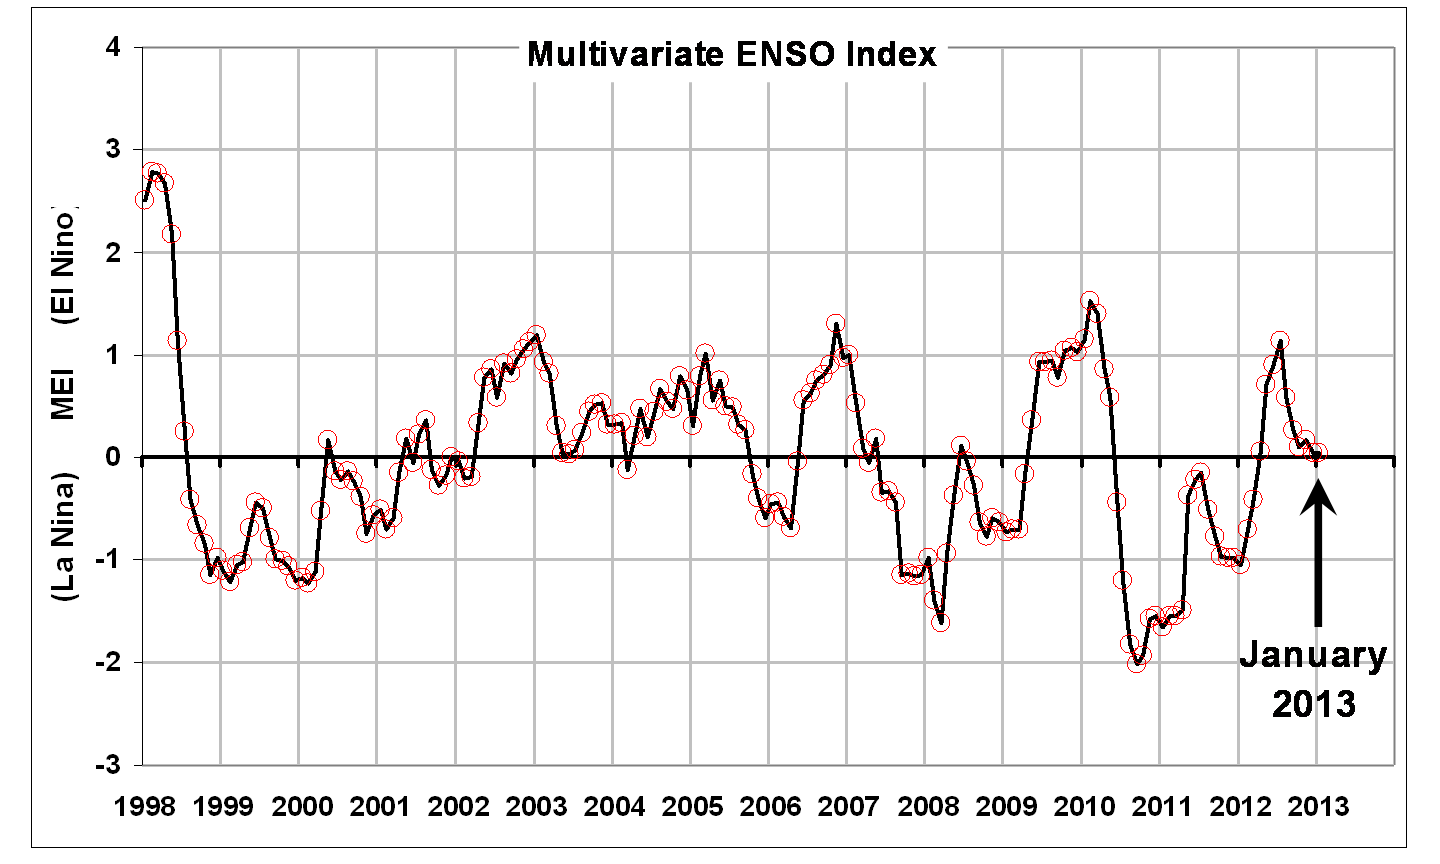
The up and down variations are clearly related to El Nino and La Nina activity, as evidenced by this plot of the Multivariate ENSO Index (MEI):

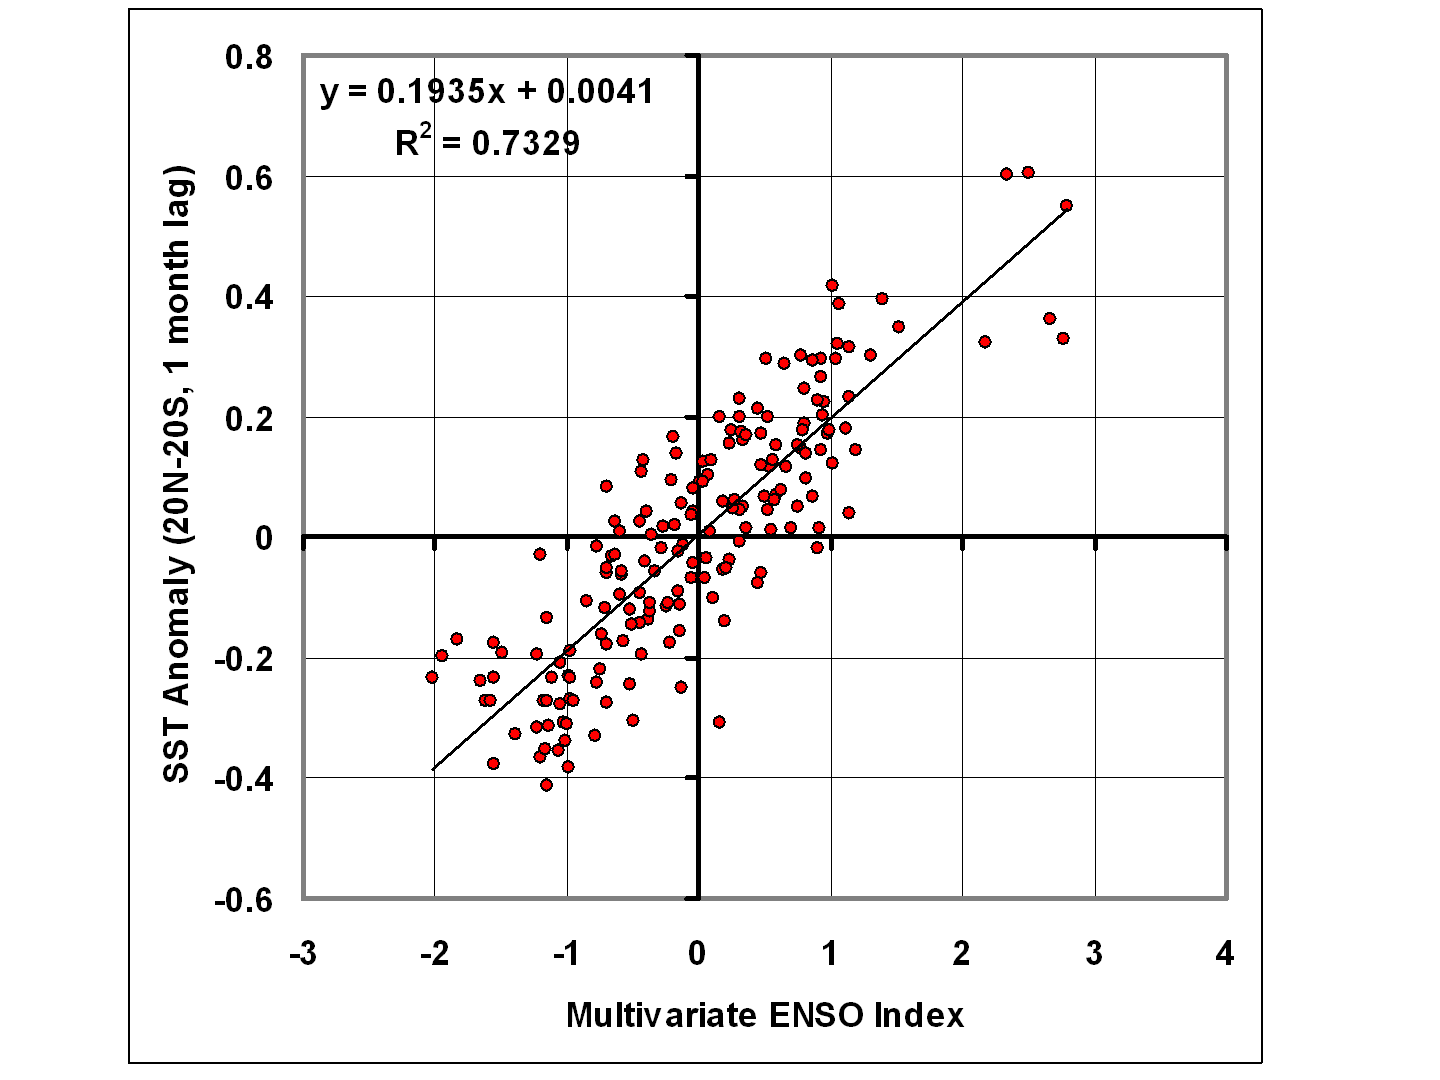
We can then plot these SST and MEI data against each other…

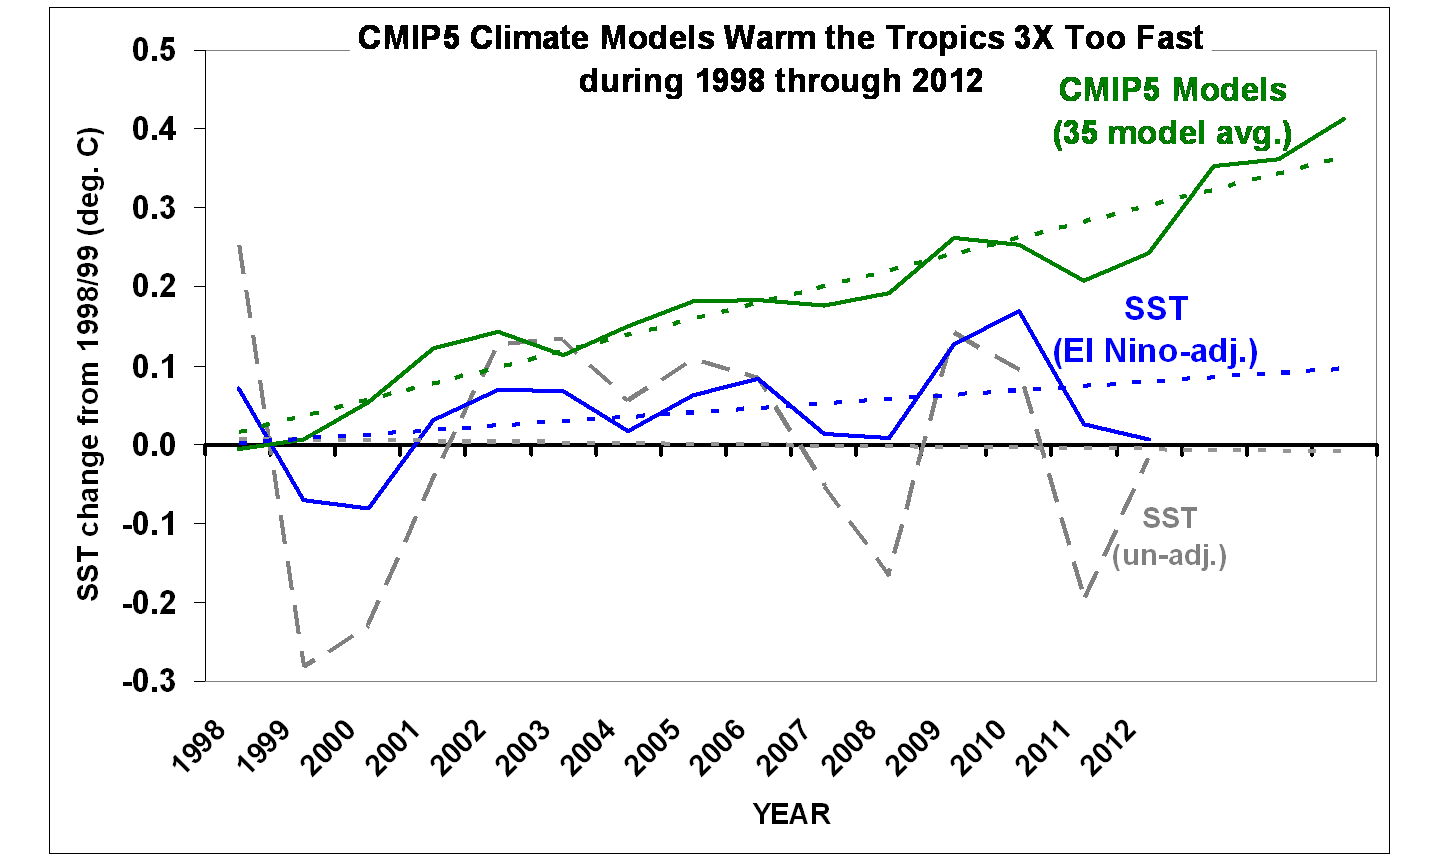
…and use this statistical relationship to estimate SST from MEI, and then subtract that from the original SST data to get an estimate (however crude) of how the SSTs might have behaved without the presence of El Nino and La Nina activity (the blue line):

Note that I have now averaged the monthly data to yearly, and this last plot also shows an average of 35 CMIP5 climate models SSTs during 1998-2012 for the same (tropical) latitude band, courtesy of John Christy and the KNMI climate explorer website. Also note I have plotted all three time series as departures from their respective 1998/99 2-year average.

The decadal linear temperature trends are:
un-adj. SST: = -0.010 C/decade
MEI-adj. SST: +0.056 C/decade
CMIP5 SST: +0.172 C/decade

So, even after adjusting for El Nino and La Nina activity, the last 15 years in the tropics have seen (adjusted) warming at only 1/3 the rate which the CMIP5 models create when they are forced with anthropogenic greenhouse gases.

Now, one might object that you really can’t adjust SSTs by subtracting out an ENSO component. OK, then, don’t adjust them. Since the observed SST warming without adjustments is essentially zero, then the models warm infinitely faster than the observations. There. πŸ˜‰

Why Have the Models Warmed Too Fast?

My personal opinion is that the models have cloud feedbacks (and maybe other feedbacks) wrong, and that the real climate system is simply not as sensitive to increasing CO2 as the modelers have programmed the models to be.

But there are other possibilities, all theoretical:

1) Ocean mixing: a recent increase in ocean vertical mixing would cause the surface to warm more slowly than expected, and the cold, deep ocean to very slowly warm. But it is debatable whether the ARGO float deep-ocean temperature data are sufficiently accurate to monitor deep ocean warming to the levels we are talking about (hundredths of a degree).

2) Increasing atmospheric aerosols: This has been the modelers’ traditional favorite fudge factor to make climate models keep from warming at an unrealistic rate…a manmade aerosol cooling effect “must be” cancelling out the manmade CO2 warming effect. Possible? I suppose. But blaming a LACK of warming on humans seems a little bizarre. The simpler explanation is feedbacks: the climate system simply doesn’t care that much if we put aerosols *OR* CO2 in the atmosphere.

3) Increasing CO2 doesn’t cause a radiative warming influence (radiative forcing) of the surface and lower atmosphere.

I’m only including that last one because, in science, just about anything is possible. But my current opinion is that the science on radiative forcing by increasing CO2 is pretty sound. The big uncertainty is how the system responds (feedbacks).


157 Responses to “Tropical SSTs Since 1998: Latest Climate Models Warm 3x Too fast”

Toggle Trackbacks

  1. steveta_uk says:

    Roy, does the CMIP5 data also just cover the tropical regions?

    If not, then the spurious warming may just be “elsewhere”.

  2. Olavi says:

    This is my opinion:
    3) Increasing CO2 doesn’t cause a radiative warming influence (radiative forcing) of the surface and lower atmosphere.

    Sun gives amount of energy wich is pretty constant. Only change of albedo helps earth absorb more energy. The rest of it is heat transfer around the globe. Athmosphere is only isolation agaisnst 2,7 k space. Earth is one piece and the sun is other piece in this energy balance. Is CO2 better isolation than nirogen or oxygen? If not it wont warm this globe.

  3. Jim Cripwell says:

    Roy, you write “But my current opinion is that the science on radiative forcing by increasing CO2 is pretty sound. The big uncertainty is how the system responds (feedbacks).”

    I would suggest that, first, we dont know how global temperatures respond to changes in radiative forcings caused by additional CO2 at all; the no-feedback response, the feedbacks and the total climate sensitivity. There must be a maximum number for climate sensitivity, but apart from that, we know nothing at all as to what the true number is, nor is there any estimate of accuracy, since no such number has ever been measured. With current technology, total climate sensitivity cannot be measured at all.

    • Jim, I agree with most of that. I’m just saying I think the no-feedback temperature response is pretty sound…although I admit it must be computed based upon theory, and can’t be observationally verified.

      • David Springer says:

        Why can’t it be experimentally confirmed?

        Surely someone can try taking a 12um laser, illuminate the surface of a vessel filled with water that is free to evaporate, and see if that slows down the rate of cooling compared to control that is not illuminated.

        I suspect the outcome is that the increased DWLIR will raise the evaporation rate so long as the air is not saturated and actually accelerate cooling in that circumstance as opposed to the warming narrative.

        In the real world I suspect a further effect is that the environmental lapse rate is reduced, water vapor has to then rise higher to adiabatically cool to the dewpoint, and hence clouds form at a higher altitude where there is less atmosphere above them to restrict radiative cooling to space. The net result would be as you describe in possibility #3.

        This handily explains regional and temporal distribution of AGW. You simply follow the water. Where there is water free to evaporate on the surface you get little AGW and vice versa. So in high latitudes in the winter when the surface is frozen you get the maximum AGW which would approach the MODTRAN (computed) 1.1C/doubling.

        Clouds are a slightly negative feedback at least in the tropics. They self-regulate throttling how much sunlight reaches the surface but clear sky is the warmer climate. This is confirmed observationally by the fact that tropical deserts have the highest mean annual temperature of any climate type.

  4. Doug Cotton says:

    Isn’t it time to realise that carbon dioxide levels are a result of natural climate variations? They lag by about 9 to 12 months. This new paper proves it …

    http://principia-scientific.org/supportnews/latest-news/135-atmospheric-co2-not-linked-to-humans-says-global-and-planetary-journal.html

  5. Doug Cotton says:

    You can’t keep ignoring the facts Roy – carbon dioxide levels lag temperature changes by nearly a year …

    http://www.sciencedirect.com/science/article/pii/S0921818112001658

    Abstract

    Using data series on atmospheric carbon dioxide and global temperatures we investigate the phase relation (leads/lags) between these for the period January 1980 to December 2011. Ice cores show atmospheric CO2 variations to lag behind atmospheric temperature changes on a century to millennium scale, but modern temperature is expected to lag changes in atmospheric CO2, as the atmospheric temperature increase since about 1975 generally is assumed to be caused by the modern increase in CO2. In our analysis we use eight well-known datasets: 1) globally averaged well-mixed marine boundary layer CO2 data, 2) HadCRUT3 surface air temperature data, 3) GISS surface air temperature data, 4) NCDC surface air temperature data, 5) HadSST2 sea surface data, 6) UAH lower troposphere temperature data series, 7) CDIAC data on release of anthropogene CO2, and 8) GWP data on volcanic eruptions. Annual cycles are present in all datasets except 7) and 8), and to remove the influence of these we analyze 12-month averaged data. We find a high degree of co-variation between all data series except 7) and 8), but with changes in CO2 always lagging changes in temperature. The maximum positive correlation between CO2 and temperature is found for CO2 lagging 11–12 months in relation to global sea surface temperature, 9.5–10 months to global surface air temperature, and about 9 months to global lower troposphere temperature. The correlation between changes in ocean temperatures and atmospheric CO2 is high, but do not explain all observed changes.

    ——————————————————————————–

    Highlights

    ? Changes in global atmospheric CO2 are lagging 11–12 months behind changes in global sea surface temperature. ? Changes in global atmospheric CO2 are lagging 9.5–10 months behind changes in global air surface temperature. ? Changes in global atmospheric CO2 are lagging about 9 months behind changes in global lower troposphere temperature. ? Changes in ocean temperatures explain a substantial part of the observed changes in atmospheric CO2 since January 1980. ? Changes in atmospheric CO2 are not tracking changes in human emissions.

    • Doug, I looked at those relationships years ago. Even the IPCC report has shown a plot of how El Nino/La Nina *cause* lagged CO2 changes in the atmosphere.

      But those are different processes from the long-term growth of CO2. We know approximately how much CO2 humanity is putting into the atmosphere, but the rate of growth in the atmospheric CO2 content is only 50% of that, so 50% is being absorbed by the biosphere/other processes. Green things love CO2.

      Are you saying that ALL of what we emit is being absorbed? if So, then what is causing the long-term increase in CO2 today?

      I did my own simple calculations based upon the El Nino-CO2 relationship, thinking that more frequent El Nino activity might have caused CO2 to go up, but the effect was small…maybe 5% of the Mauna Loa increase since 1958.

      Besides, we are now into more La Nina conditions, and CO2 continues to go up.

      • Hops says:

        I thought the other 50% was being absorbed by the oceans, hence the increased acidity…

        Some forests, such as those in New England are absorbing a lot of CO2, but other forests are being cut down.

        Also, I think it has been shown that the additional CO2 is from very old carbon by means of carbon isotopes.

        Hops

  6. Entropic man says:

    The 21st century pause in measured global temperature might be partly due to the extended solar cycle minimum and the weakness of cycle 24.
    Alternatively, the heat may still be accumulating, but in areas where we do not have temperature monitoring. The deep ocean below 200M is a possibility, below the depth range of the ARGO buoys.
    Support from this comes from the continued rise in sea level.Since the 1997/98 El Nino sea level has risen at a sustained 3.2mm/yr. That’s 50mm in 16 years.

    http://sealevel.colorado.edu/

  7. Entropic man says:

    Curses. Make that 2000M

  8. Doug Cotton says:

    Roy

    I wasn’t in any way involved in that journal paper published in “Global and Planetary Change” (Vol. 100, Jan 2013) and I only learnt of it today. The implication appears to be that warmer temperatures cause the release of more carbon dioxide from the oceans, this happening about 9 to 11 months later.

    My position is as stated in my 21 page paper
    http://principia-scientific.org/publications/PROM/PROM-COTTON_Planetary_Core_and_Surface_Temperatures.pdf
    and anyone is welcome to submit comment thereon under the “Peer Review in Open Media” system.

    Note that in the Appendix of my paper is a small study of the relationship between daily maximum and minimum temperatures versus precipitation and, not at all surprisingly, we see that drier cities have slightly higher minimums and significantly higher maximums. I know this is a small sample of only 15 inland tropical cities, and I intend to do a larger one after my open heart surgery on March 8th – if I’m still on the planet.

    The cooling by water vapour is due to the fact that it reduces the absolute magnitude of the thermal gradient (AKA wet adiabatic lapse rate) and so, when radiative equilibrium is established, the supported surface temperature is lower. Only at the margin does water vapour slow radiative cooling (not non-radiative) between day and night for example. But this is a negligible effect compared with about a 7 to 8 degree lowering of surface temperatures.

    In a nutshell, the 255K figure is inaccurate for a start. It needs to be adjusted downwards when treating the Earth as a rotating sphere (rather than flat) and then adjusted upwards because of lower emissivity of the atmosphere. The net effect brings it to about 270K. Then the autonomous gravitationally induced thermal gradient (necessitated as a corollary of the Second Law of Thermodynamics) adds about 25 degrees in a dry world, but water vapour reduces this by about 7 or 8 degrees so that we get back to14 or 15 deg.C.

  9. Kasuha says:

    As long as MEI is calculated from sea level temperature and pressure, I guess by subtracting MEI from the temperature, what’s left is something like the pressure component. I understand that it’s not _that_ simple but I’m still not very sure that subtracting MEI and temperature from each other could lead to anything meaningful.

    • MEI is based upon spatial patterns in a variety of measures in the Pacific, clouds, SST, etc. It’s a good statistical measure of the strength of El Nino or La Nina conditions.

      It is also, as I (and others) have shown, highly correlated to year-to-year variations in *tropical-average* temperatures.

      So, it makes sense to use MEI as a surrogate for the MEI-related temperature changes in order to better isolate any underlying trends.

      I think it is certainly better than saying “it hasn’t warmed in 16 years”, when we know very well that the start of that 16 year period was a very warm El Nino event.

  10. Entropic man says:

    A pity we lost Glory. It would have clarified several areas of uncertainty.

    http://www.space.com/11030-nasa-glory-climate-satellite-failure.html

  11. Doug Cotton says:

    Roy

    The start of the 16 year period was also about the expected maximum of the ~60 year (59.6 year) cycle which had previous maxima around 1880 and 1939. The cycle is evident in the plot in the Appendix of my March 2012 paper where I also showed the long term (~1000 year) cycle is still increasing at about 0.05C/decade. With the 60 year cycle going down until about 2028 and the long term trend still rising, we can expect fairly level temperatures with a slight decline from 2015 to 2027.

    Carbon dioxide levels have also been increasing because of the long term trend. Remember, though, that carbon dioxide, like water vapour, reduces the lapse rate by intra-atmospheric radiation, and so it has a minuscule cooling effect, which is also supplemented by some absorption of incident insolation.

  12. Thomas says:

    To see if the current period contradicts the CMIP5 models it is not enough to show the mean, you need to show the spread of the simulations as well. You do not expect a single realization (Earth) of a stochastic process to exactly match the average.

    Consider a trivial example where you repeatedly flip a coin, adding one to a sum if it is heads, nothing if it is tails. The average of many realizations of this process is a smooth line with slope one half, but do the experiment once and you will inevitably get sequences of tails where the function remains flat for a while.

    • yes, except there is no easy way to correct an individual model run for its El Nino/La Nina activity, which is going to dominate the spread of the models over the 15-year period.

      So, instead I use the average of all of the models since they contain what can be considered a random distribution of ENSO events, and then compare that average to the observations which have had ENSO effects “removed”.

      Remember, the IPCC’s best estimate of future warming is pretty close to the average of all of the models.

      What you are advocating is what the IPCC likes to do…show that the observations are not necessarily inconsistent with ALL of the models. But that type of analysis cuts both ways, because then we find that some of the individual models are wildly inconsistent with the observations…yet those models are still allowed to influence the IPCC’s best guess of future warming.

  13. Doug Cotton says:

    I don’t buy that argument Thomas. Go to the NASA satellite data and overlay 9 years at low altitudes and you will see a very regular seasonal pattern indicating greater variation within a year than from one year to the next. Temperatures are tightly controlled by natural cycles, short and long. Long term natural cooling can result from increased (not decreased) water vapour levels which cause lower supported surface temperatures, as I showed with empirical data.

  14. ChrisH says:

    @Doug Cotton
    Thanks for the link to that Principia Scientific International paper. I think I was able to reproduce it’s general result (annual CO2 change lagging annual ocean temperature change by about 1 year) using the wonderful WoodForTrees web site:
    http://www.woodfortrees.org/plot/esrl-co2/mean:12/derivative/mean:3/normalise/from:1960/to:2010/plot/hadsst2gl/mean:12/derivative/mean:6/normalise/from:1960/to:2010

    This shouldn’t be unexpected, since the amount of CO2 that water can hold depends on temperature. i.e. warmer (ocean) water can hold less CO2, so CO2 is released. (You can demonstrate this by gently heating a bottle of fizzy water or Coca Cola!)

    So at annual time scales it is clear that this effect dominates temperature changes. Since this is a simple physical relationship, I see no reason why it should not also have a signficiant effect at longer time scales (although of course man-made CO2 will be added on top of whatever the ocean does).

    The question then becomes: If CO2-induced-global-warming were true, then why have we not seen a (natural) run-away effect in the past? i.e. naturally increased temperatures raise CO2, and then that CO2 induces warmer temperatures, which then increases CO2, etc etc until the world melts.

    The only answer I can think of is that climate feedbacks reduce the effect of CO2 warming, rather than enhancing it (as is required for catastrophic global warming), and thus CO2 does not greatly affect temperature.

    • David Springer says:

      CO2’s ability to raise surface temperature depends on how much water is available for evaporation. All the mysteries go away if you presume that DWLIR raises surface temperature in inverse proportion to how much water is available for evaporation. In a wet surface environment with unsaturated air DWLIR simply raises the rate of latent heat transport away from the surface without raising surface temperature. Absent water to facilitate latent transport the surface temperature must instead rise which raises radiative and conductive transport rates.

  15. ChrisH says:

    CORRECTION: Instead of “this effect dominates temperature changes” I should have said “this effect dominates CO2 changes”.

  16. ChrisH says:

    A minor error correction: To avoid comparing apples to oranges, I should have used exactly the same averaging for both datasets. So I should have used this link instead:
    http://www.woodfortrees.org/plot/esrl-co2/mean:12/derivative/mean:6/normalise/from:1960/to:2010/plot/hadsst2gl/mean:12/derivative/mean:6/normalise/from:1960/to:2010

    If anything the effect is even more obvious now!

  17. Doug Cotton says:

    ChrisH: If you want to read how physics establishes that both water vapour and (to a far less extent) carbon dioxide reduce atmospheric thermal gradients and thus lead to lower surface temperatures you will find answers here, where you will also find the only valid explanation as to the physical mechanism which keeps the surface and the core of Venus hot – and Earth’s.

  18. Doug Cotton says:

    Roy and others:

    You all need to come to an understanding as to how and why the models are all based on a totally false assumption – the same false assumption that Roy made in his misunderstanding (6) namely that there would have been isothermal conditions in an atmosphere of 80% pure nitrogen and 20% pure oxygen. There can never be isothermal conditions in any atmosphere which is subjected to a gravitational field, but I don’t intend to try to prove that here in a short comment, because it has taken 21 pages in my paper to prove it. Anyone with a degree in physics should be able to understand it and maybe others if I’ve managed to explain it well enough.

    • David Springer says:

      I agree that isothermal is not the equilibrium state in a non-convecting atmosphere. Internal energy, the sum of kinetic and gravitational potential energy, is equal everywhere such that a kilogram of air at the bottom of the gravitationally confined column has the same internal energy as a kilo of air at the top of the column. Where I don’t agree is that the temperature at the base of the column is any warmer than it would be absent gravity. At the base of the column kinetic energy is 100% of the total but at the top of the column the total contains some fraction of gravitational potential energy. A thermometer only measures kinetic energy so by that measure the top of the column appears colder than it would without the effect of gravity.

  19. pochas says:

    4) Radiative models are inappropriate for the lower troposphere where convection is dominant.

  20. ChrisH says:

    @Doug Cotton
    I’m afraid that I’m more interested in challenging AGW from the point of view of established interpretations of physics (as Roy seems to be), rather than new physics (interpretations) that almost no-one believes.

    OTOH, I still think there is scope for new physics (interpretations) in the realm of astronomy, simply because most of that stuff is quite difficult to test (and so much easier for scientists to fool themselves).

  21. Doug, if you think you have an alternative explanation (which I’m all for), come up a time dependent 1-D model of the temperature in different layers which conserves energy in each layer. Initialize the model with any initial temperature profile you wish, and see if you can get it to converge to the observed average temperature profile.

    Don’t tell me “the model falls out of the equations in my paper”…it’s your model, program it up.

    Until someone does this with their alternative ideas, I will stick with what works.

  22. Norman says:

    Dr. Spencer,

    Your third point: “3) Increasing CO2 doesn’t cause a radiative warming influence (radiative forcing) of the surface and lower atmosphere.”

    I have been reading up and thinking about Doug Cotton’s ideas. I do not think they are a new physics, just a different look at old physics.

    What I try to do it look for empirical evidence of his claims where I can. I looked up this link (yearly incoming solar radiation and yearly outgoing radiation).

    If you look at it the oceans are emitting a high amount of IR to the TOA. They receive the most energy but then emit it away. You can see the desert areas of Australia on this graphic. It does not seem to have any higher degree of outgoing longwave radiation than the ocean. But the ocean (especially a very warm ocean) would have extremely humid air above it. It should be the place of the highest possible greenhouse effect. I would think over the warmest ocean the outgoing longwave radiation would drop significantly and you could see a very clear example of GHG effect in progress. From my view I do not see such a clear example of the GHG effect. Maybe my understanding is not correct and the bright people that visit your blog can inform me of the wrong thinking I have. I am here to learn and look for the truth and not afraid of being wrong.

    http://stratus.astr.ucl.ac.be/textbook/chapter2_node6.html

    • norman, those ocean areas are the pesistent subsidence zones, where sinking air has very low humidity in the middle and upper troposphere. Since water vapor is the main greenhouse gas, that means the IR radiation is origination from the lowest (and thus warmest) altitudes in those regions. This is well understood.

  23. Chris Colose says:

    The even simpler explanation than phantom negative feedbacks is that you have done a crappy comparison, one that doesn’t account for modeled internal variability. Gavin has done it right…you can repeat for tropical only…
    http://www.realclimate.org/index.php/archives/2013/02/2012-updates-to-model-observation-comparions/

    I sure hope the students at UAH aren’t getting their climate education from you…

    • Chris, my averaging of the models together DOES account for interannual variability…by averaging it OUT since it is different in every model. I then removed the interannual variability from the observations, so they can be compared on an equal basis.

      If you want to continue posting here, please try to not condescend.

    • David Springer says:

      You’re an obnoxious little snot, Chris. When do you plan on growing up?

  24. Wayne2 says:

    @Chris Colose: You don’t have to read any farther than the part about the 95% CI including 95% of model runs. And also that they mention F&R 2011, which is a paper that uses inaccurate data, over-simplified models, and a host of other poor methods, followed by an illegitimate extrapolation of their results 30 years into the future.

    Better Dr. Spencer teaching than you or an activist website.

  25. Chris Colose says:

    Wayne,

    The analysis has no relevance to anything. Reality is one member of an ensemble of possibilities, even after subtracting El Nino fluctuations with no uncertainties (and there are other factors at play, including solar variability, volcanic, possibly some other forcing like stratospheric water vapor…e.g., Solomon et al). But when you cherry-pick the 1998-present period, as was done, the model spread may range from negative temperature trends to rather large temperature trends. It actually makes no sense to average out this variability on a sub-decadal timescale and then compare with an ENSO-only adjusted SST. Even more ridiculous is to infer statements about equilibrium climate sensitivity.

    One can play the activist, conspiracy, groupthink, dogma, etc cards all they want. But in reality, the reason the low sensitivity crowd hasn’t convinced anyone is because of sloppy science that cannot stand up to a wide range of tests and remain robust.

    • RW says:

      Chris,

      What convinces you the cloud feedback is positive?

      This plot below is alone enough to show that clouds acting to further warm on incremental warming is almost certainly wrong.

      http://www.palisad.com/co2/gf/st_ca.png

      It’s a scatter plot of 25 years of satellite measurements from ISCCP (1983-2008). The green and blue dots are the averages for each 2.5 degree slice of latitude in each hemisphere.

      What makes this plot and data unique is it’s just the total cloud amount independent of cloud type or combination of cloud types. The inflection point around 0C is where the net effect of increasing/decreasing clouds switches from warming to cooling. The net effect at and above the current global average temperature is unambiguously to cool.

      • David Springer says:

        If cloud feedbacks are negative then why do tropical deserts have the highest mean annual temperature of all climate types?

        Riddle me that, Batman.

      • David Springer says:

        Nice plot. Difference between NH and SH is of course less water available to evaporate in NH due to much larger percentage of dry land there. Accordingly then if we use my rule of follow the water the NH should experience more greenhouse warming because there’s less water available to evaporatively cool the surface. Everything makes perfect sense when one supposes DWLIR doesn’t raise surface temperature so long as there is water free to evaporate on that surface.

        • RW says:

          David,

          I’ve yet to see anyone anywhere come up with a better explanation for why the net effect of clouds is to cool by about 20 W/m^2 on global average (let alone any explanation at all). Relative to ‘climate change’ what matters (i.e. what really counts) is the change in the average. IME, proponents of CAGW can’t accept this because of the emabarassing simplicity, but in lieu of some really extraordinary evidence to the contrary, which I don’t believe exists, Occam’s Razor prevails.

    • RW says:

      Do you see how at temperatures above about 0C the net effect of clouds on average is to cool, and below 0C the net effect of clouds is to warm? That is above 0C, the more clouds there are the cooler it is on average, and below 0C, the more clouds there are the warmer it is on average?

      Do you agree that ice and snow are roughly as reflective to solar energy as clouds are? Do you agree that ice and snow generally only persists at temperatures at or below 0C? Do you agree that on global average, most of the Earth is not snow and/or ice covered? Is it just a coincidence that the net effect of clouds switches from warming to cooling at about the same point that the surface becomes less reflective than the clouds above?

      Can you see the fundamental physical mechanism behind this? Above 0C, clouds are more reflective than the surface, so the net effect of clouds is to cool by reflecting more incoming solar energy away than is delayed beneath them (i.e. re-directed back toward the surface). Below 0C, clouds are about equally reflective to solar energy as the surface is (due to snow and ice), so the net effect of clouds is to warm by delaying more energy beneath them than is reflected away in total. Clouds on average are much more opaque to upwelling infrared radiation emitted from the surface and lower atmosphere than the clear sky is.

      In a warming world, if anything, less of the surface would be snow and ice covered (not more). Hardly a case for the net effect of clouds acting to further warm instead of cool on incremental global warming.

    • RW says:

      BTW, each individual small orange dot represents a monthly average for one sampled grid area in a 2.5 degree slice of latitude. There are more individual grid areas in the tropics compared to the areas closer to the poles, because the total area from east to west decreases with latitude.

    • RW says:

      Another way of explaining this which may be easier to see and understand is on average as clouds increase at temperatures above about 0C, the surface temperature cools and as clouds decrease the surface temperature warms. At temperatures below about 0C on the other hand, as clouds increase, the surface temperature warms and as clouds decrease the surface temperature cools. The signature of this in the data itself is independent of why the clouds increase or decrease, though if you can grasp the somewhat counterintuitive nature of how feedback works, the direction of causation is that above 0C increasing cloud coverage on average causes cooling and decreasing cloud coverage causes warming on average.

      If this is still hard to see or grasp, take a look at these gain plots from the same ISCCP data set:

      http://www.palisad.com/co2/plots/wbg/nh/gain.png
      http://www.palisad.com/co2/plots/wbg/sh/gain.png

      As the surface temperature increases, the cloud coverage increases, and as the surface temperature decreases, the cloud coverage decreases. Notice how in both the northern and southern hemispheres, the surface temperature (i.e. the ‘surface out’) stays well above 0C (273K = 315 W/m^2) throughout the entire year. The ‘gain’ in the plots is just the dimentionless ratio between the surface power (i.e. net power gained at the surface) and the post albedo incident solar power. Notice also as the temperature increases and the cloud coverage increases, the ‘gain’ decreases, and as the temperature decreases and the cloud coverage decreases, the ‘gain’ increases. As the cloud coverage increases, the decreased gain reduces or attenuates the surface temperature increase, and as the cloud coverage decreases, the increased gain reduces or attenuates the surface temperature decrease. This is negative feedback in response to a surface temperature change. If the feedback was positive, as the surface temperature and cloud coveraged increased, the gain would increase – forcing or amplifying temperatures even higher.

      Do you see how this is working? That cloud coverage appears to be modulating the surface temperature changes? That is, overall, when clouds are increasing the surface is too warm and trying to cool, and when clouds are decreasing the surface is too cool and trying to warm. In the end, it’s probably just basic thermodynamics and cloud physics.

  26. Norman says:

    Dr. Spencer,

    Thanks for your explanation. An OLR map tells you how little there is between the hotter region and space. More clouds and your OLR goes down because what you are reading is the top of the cooler clouds.

    “The highest OLR values are found above the hot,
    dry, cloud-free desert regions, where a lack of atmospheric water vapour permits the
    effective infra-red radiating temperature to originate from lower down in the atmosphere
    (i.e. warmer). High OLR values also occur above many ocean regions where there is a dry
    mid-to-upper troposphere (e.g. large areas of the sub-tropical Atlantic and Pacific Oceans).”

  27. Mike Flynn says:

    Chris Colose,

    I am curious as to why you think that reducing the amount of radiant energy absorbed by a body causes a rise in temperature.

    Anything other than a vacuum impedes the transfer of radiant energy.

    Whether you block the EMR from the Sun using CO2, an umbrella, or even some of the tinfoil left over by the tinfoil hat brigade, the body receiving less radiant energy cools. This is easily demonstrated experimentally. If you are unsure how to do this, please ask.

    Nobody has ever managed to raise the temperature of a body being heated by radiation by wrapping it in CO2. I will keep this short – I believe Einstein, Planck etc., in preference to any number of Warmists who cannot demonstrate this wonderful “greenhouse effect” by any experimental means whatsoever.

    Regards,

    Mike Flynn.

  28. Doug Cotton says:

    ChrisH

    All right. I challenge you to find a single word in my 21 page paper which is not based on valid physics that is well accepted, such as the usual statement of the Second Law of Thermodynamics. Note what Norman says, he being one who has actually read and understood what I have written in the paper.

    It is the greenhouse conjecture that is not based on standard physics, and which completely contradicts such physics as I have proved beyond a shadow of a doubt, backed up by no less than four totally different and independent lines of empirical proof for what I have said.

    So, yes, I’m throwing down the gauntlet to you and any reader – any physics expert you can call upon – anyone in the world to prove me wrong. After all, that’s what “Peer Review in Open Media” is all about, and experienced scientists at Principia Scientific International will look into any and all official attempts at rebuttal of my paper from anyone, anywhere.

    And, believe it or not, I genuinely want to know if I can be shown to be mistaken in any detail.

  29. lemiere jacques says:

    Well, models are based on some hyothesis , you mentioned some, ocean mixture and so on…
    before to be able to predict anything, you much check ih hyothesis are right or wrong…obviously they are.
    We don’t understand climate yet.

  30. Doug Cotton says:

    Roy and others:

    It’s not easy to explain “heat creep” in a comment like this, as it needs the diagrams in the paper and the text in several of the Sections.

    If you read the paper and understand how the thermodynamic equilibrium is established with isentropic conditions, then you’re half way there.

    The model applies to the sub-surface regions of all planets, namely the crust, mantle and core. Without any knowledge of anyone else’s estimate of the temperature of the core of Venus, I can say from the model that it would not be much hotter than Earth’s core – probably between 6000K and 7000K at the most.

    Basically the model uses a thermal gradient of about -0.7g/Cp where Cp is the mean specific heat of the solid, liquid or gas. This gradient is shown to be valid in the regions we can measure, notably the troposphere, the outer 10Km of the crust and in areas of the ocean where the Sun has little influence, such as the Arctic ocean. Some data is linked in the paper in Section 14.

    The reason for the factor 0.7 is primarily due to intra-molecular radiation which has a levelling effect. Thus water vapour in our atmosphere reduces the gradient from the -g/Cp value (9.8C/Km) to about -0.7g/Cp as a mean “wet” gradient.

    Now, the plot of temperature against altitude in the atmosphere thus has a predetermined gradient with a mean of about 0.69C/Km give or take a bit. But it will be steeper in dry areas and a little less steep in really moist areas.

    Now physics tells us that there will always be a propensity for radiative equilibrium to be established. Thus the whole plot adjusts with small rises and falls in parallel positions (maintaining the required gradient) or, if radiative equilibrium is already established, the plot will rotate about a pivoting altitude. This is not the so-called radiating altitude which has no practical application. The calculations are in a recent comment in the Forum thread at PSI which is about my paper, “Planetary Core and Surface Temperatures.” Such calculations (which take into account the T^4 relationship) show that the pivoting altitude is at only about 3Km.

    Now, one application of the “model” is to calculate the effect of water vapour which reduces the gradient. If for example, we compare a reasonably dry inland tropical city where the thermal gradient (AKA lapse rate) above it is, say, 8C/Km with a moist city with thermal gradient 7C/Km we would expect about a 3 degree cooling effect for water vapour due to the plot adopting a more level gradient and rotating around the pivoting altitude (anchor point) which is 3Km up.

    This is demonstrated in a study of 15 such inland tropical cities in the 30 year mean daily minimum and maximum temperatures, and that study which I did is in the Appendix. One day I’ll extend it to many more such locations, but I am confident the data will still show that the effect of increasing water vapour is to lead to a lower supported temperature at the surface.

    All the effects of non-radiative and radiative cooling are just marginal effects between day and night, and are of nowhere near of as much consequence as the initial pre-determined underlying base thermal plot which extends with almost continuous rising from the tropopause, through the surface, then steeper through the crust, but curving over and reducing to a very slow rising rate (about 1C/Km) in the very hot mantle.

    In all locations, the model dictates, and empirical evidence confirms, that the thermal gradient is about -0.7g/Cp.

    For example, in the outer crust one of the deepest bore holes allowed measurement of 270C at a depth of 9Km. The specific heat of the crust is about a quarter of that of the atmosphere, so we expect a gradient about four times as steep. And what do we get? (270-15)/9 = ~28C/Km compared with ~7C/Km in the atmosphere. When we get to the 4,000C mantle, specific heat increases substantially, and the gradient reduces likewise in absolute magnitude.

    Why is it so?

    Well, it is due to the propensity for thermodynamic equilibrium to be established (as the Second Law of Thermodynamics says will happen) and that thermodynamic equilibrium is not thermal equilibrium. The difference is that we have to consider other forms of energy as well, and the only relevant one in most cases is gravitational potential energy (PE) and not just kinetic energy (KE).

    This is what Loschmidt recognised as he thought along the same lines as I did and realised that molecules in free flight between impacts have to obey Newtonian physics. Thus the sum (PE+KE) remains constant. Diffusion of KE occurs and creates isothermal conditions in a horizontal plane, these being also isentropic, so that mean (KE+PE) is constant and, because PE is constant in a horizontal plane, so is KE. It is only mean KE per molecule which determines temperature. But, as Loschmidt explained, without any air movement – just diffusion at the molecular level, thermodynamic equilibrium in a vertical plane must be isentropic. This is because, if there were a region with greater (PE+KE) per molecule than in an adjoining region, then work could be done, and so, Roy, your isothermal atmosphere would not be in a state of thermodynamic equilibrium because entropy can and will increase.

    A direct corollary of the Second Law of Thermodynamics dictates that it would automatically adopt the required thermal gradient.

    Now, another interesting corollary is that any addition of extra thermal energy somewhere in the sloping thermal plane will upset the equilibrium. Then what happens is what is shown in the two diagrams in Section 8 of the paper which you really need to study carefully.

    We now can explain how sufficient energy actually gets into the surface of Venus, even at the poles where less than 1W/m^2 of direct Solar insolation is received. Such low Solar radiation makes a mockery of the “runaway greenhouse effect” which would have to multiply the mean of about 10W/m^2 by more than 1,000 – that is, multiply energy by more than 1,000! So, no, it is not a greenhouse effect which magically gets the required energy into the 730K Venus poles, but “heat creep” whereby incident Solar radiation absorbed anywhere in the atmosphere then spreads out in all directions (some towards the surface) in order to re-establish the isentropic thermodynamic equilibrium as is required to comply with the Second Law of Thermodynamics.

    If anyone thinks I am wrong, despite all the empirical evidence such as Graeff’s 800 experiments, the Venus thermal profile, the Earth’s atmosphere and its sub-surface temperatures, the temperatures in the Arctic ocean where, for example, there is water which is 2 degrees warmer at 600m than at 170m in the Beaufort Sea, as well as that for the 15 cities in which cooler temperatures were recorded for those with the highest rainfall, then I suggest you develop an alternative model which explains all this empirical data at least as well as my model does.

  31. Doug Cotton says:

    (continued)

    Unfortunately Loschmidt did his reputation harm when he postulated that the thermal gradient would enable perpetual motion, which is of course not correct.

    I have explained what Loschmidt couldn’t explain in the last paragraph of Section 14 of the paper.

    Also, Graeff displayed his lack of formal training in physics when he made a serious mistake in thinking that the gradient should be multiplied by the degrees of freedom. I have also explained in detail in the paper why Graeff was wrong on this issue, but never-the-less his excellent experiments did in fact establish the veracity of an autonomous thermal gradient in a gravitational field.

    By the way, I see little point in discussions of hypothetical non-radiating and non-absorbing atmospheres, but will discuss here as Roy talked about it in his misunderstanding (6). Oxygen and nitrogen do absorb incident Solar radiation in the UV and visible spectra. This is obvious in the thermosphere where some molecules heat to very high temperatures as a result and are able to radiate when at these temperatures. The same can happen for a small minority of molecules even in the lower troposphere. We do not notice if one molecule in a million gets extremely hot as a result, but it can and does, thus enabling re-radiation of similar radiation and/or diffusion of the thermal energy into neighbouring molecules. So an isothermal atmosphere is not possible, with or without any radiation, but nor is a non-radiating atmosphere actually found on any planet in our Solar system.

    Hence we find that planetary surface temperatures can be calculated just by knowing the force of gravity, the mean specific heat and the mean Solar radiative flux absorbed by the atmosphere and surface. The surface does not have to absorb any insolation, and nor does convection have to happen from the surface upwards. On Venus there is about as much downward convection as upward, nearly all of it starting in the atmosphere and spreading out in all directions from the source of absorption (such as when night becomes day) and heating the base of the atmosphere, which then supports the surface temperature.

  32. Doug Cotton says:

    Footnote:

    Gravity is of course a force and not a source of energy. What it is doing in establishing the thermal gradient is redistributing energy within any layer, so this is an adiabatic process in ideal calm conditions, perhaps just before dawn, when we might assume any net upward convection is insignificant. Gravity is establishing thermodynamic equilibrium. If that equilibrium is disturbed, gravity will work to re-establish it. It can be likened to a rain storm falling on a part of a lake. Gravity redistributes the water over the (slightly) spherical surface which gravity had previously created, and now has a propensity to re-establish when it was disturbed by extra rain, or maybe wind.

    So, whatever the initial conditions, gravity works to establish the right gradient (-g/Cp) but, at the same time, intra-molecular radiation has a propensity to level out temperatures. Empirical evidence indicates that such radiation tends to reduce the absolute magnitude of the gradient by about 30% when that radiation is significant, such as in a moist atmosphere on Earth, where water vapour sends heat to higher, cooler regions.

    Energy is always conserved of course, but we also have to observe the Second Law of Thermodynamics, and not just the First Law, failure to do so being the main fallacy in the climatology models. Such models appear to imply that, if there is no loss or gain of energy in the net result, then all is OK. But it’s not – and that’s why there is a Second Law which must be observed in all independent (one-way) processes anywhere. And the Second Law is not what Clausius thought – as his statement only applies accurately in a horizontal plane, and is thus not a generalised statement. Physicists realised this and thus adopted the current statement involving entropy.

    The climatology models ignore the entropy conditions and requirements of the Second Law of Thermodynamics. As such, they use outdated, superceded concepts dating from 1850 which are simply incorrect. Because of their belief that conduction and diffusion only transfer heat from hot to cold, they reject what Loschmidt postulated, as have many others without really thinking about it.

    Conclusions

    When Maxwell and Boltzmann dismissed Loschmidt’s postulate of a gravity gradient they did the world a great disservice, and they contributed to a belief in a non-existent warming by an imaginary radiative greenhouse effect. The subsequent “calls to authority” should be a lesson for all in the scientific world, for this has resulted in an absolute travesty of physics. The greenhouse conjecture will inevitably take its brief place in history as the biggest and most costly mistake ever in the field of human scientific endeavour. Hopefully that will be soon.

    Scientists, be they climatologists, physicists or whatever, need to step outside the square and to adopt a paradigm shift based on, and supported by 21st century science. Dr Hans Jelbring and Roderich Graeff have each made significant contributions which must now be heeded before the mistake is perpetuated by those who now have personal vested interests in maintaining the status quo.

    Climate has in fact been following natural cycles [28] as shown in the Appendix to the author’s paper on Radiated Energy [2] and the world can expect a period of about 500 years of cooling to start within 50 to 200 years from now.

    The Loschmidt gravity-induced thermal gradient is more than enough to explain the proverbial “33 degrees of warming” and in fact the dry adiabatic lapse rate would lead to a mean surface temperature of about 25°C were it not for water vapour and, yes, to a much smaller extent, carbon dioxide reducing the gradient and causing lower base surface temperatures. In the Appendix is an outline of methodology that would almost certainly produce studies which would demonstrate the cooling effect of water in locations around the world.

    Thermal energy can and does “creep” up the very shallow thermal gradients in planetary atmospheres and also in their solid crusts and mantles, supporting sub-surface temperatures. Indeed the physics of “heat creep” resolves the long-term puzzles of planetary core and surface temperatures, and, for this very reason, begs attention and claims validity for this 21st century new paradigm shift in climate change science. [29]

  33. Doug Cotton says:

    Models and Calculations of Surface Temperatures

    In regard to Venus, empirical data does confirm that the thermal gradient in its troposphere is in agreement with -0.7g/Cp but calculations are complex because the specific heat of carbon dioxide varies by about 30% over the temperature range. There are such calculations in two papers cited in my paper – one by Hans Jelbring and one by Alberto Miatello.

    On Earth we saw that the pivoting altitude is about 3Km. This was based on a troposphere of height 10Km. In fact the mean height might be closer to 11Km, which would make the pivoting altitude 3.5Km. Hence, if the mean thermal gradient is 7C/Km, this 3.5Km would account for 3.5 x 7 = 24.5C of warming. It is quite possible that the 255K figure should be about 8K to 10K higher, because mean emissivity of the surface is a little below 1.0 and a lot lower for radiation from the atmosphere. Also additional energy leaves the surface by non-radiative processes. There are also errors that arise from not treating the Earth as a rotating sphere which warms more by day and cools by night.

    What really controls surface temperatures is the underlying stable thermal plot which intersects the surface at about the same temperature as the sub-surface plot intersects the surface coming from the other direction. This is no coincidence, because the atmospheric plot sets the level of the surface end of the sub-surface plot.

    You can do all the energy diagrams you like, but these are based on mean values over 24 hour periods. They do not show how the rate of cooling slows down as the temperature of the surface approaches the underlying temperature of the base of the atmosphere. This happens on calm nights not long before sunrise. Have you never wondered why the temperatures can cool at, say, 3 or 4 degrees per hour in the afternoon, but do not keep on cooling at this rate all through the night, even in the absence of clouds? This is the critical oversight of the climate models, because they assume there is a need for back radiation to raise the surface temperature (which it never could) when gravity has already done so. But they have no way of explaining why the rate of cooling slows down and always, in calm conditions, returns to about the same temperature regardless of how hot or cold the day has been. Doesn’t that help to confirm what I am saying? The thermal plot (running right through the boundary and on into the crust) supports the surface temperature, preventing it getting too hot or too cold. We can relax because of this stabilising effect, and the only climate change will be natural, predictable and beyond the control of man.

  34. Slabadang says:

    RW!

    Very nice and powerful presentations of the relationships.
    Ita that simple!!

    • RW says:

      It probably is, but it seems no one can accept it even though the data (and logic) demonstrates it unambiguously.

      The purpose of looking at the issue from this broad perspective is to show the big picture. Trying to understand the complex dynamics of clouds physics on a more micro and/or localized level is extremely difficult – practically impossible perhaps even, and it’s really easy to get lost and be unable to see the forest through the trees.

      Understanding and knowing why the net effect of clouds on global average is to cool by about 20 W/m^2 should be a basic starting point in trying to determine the net effect clouds will have on incremental warming, yet those pushing positive cloud feedback don’t even know or can’t provide a reason why.

    • RW says:

      Here is another scatter plot from the same ISCCP data sett:

      http://www.palisad.com/co2/gf/st_wc.png

      The ‘water column’ is the water vapor amount (or H2O density) in the atmosphere. The data unambiguously confirms that warmer temperatures result in increased water vapor in the air as frequently claimed; however, notice how as the water vapor increases the temperature increase is not equally proportional throughout the range. Above the current global average temperature (about 288K), the water vapor content increases by a much greater amount than the temperature increases (and even reaches a point where no matter how much it increases, the temperature doesn’t even further rise).

      The conventional wisdom in climate science is that water vapor acts as the primary positive feedback in response to warming because it’s also a greenhouse gas. The idea behind this is warming from CO2 causes more water to evaporate, which causes more warming from increased absorption and so forth (i.e. positive feedback). If this is the case, then the temperature above the current global average should increase by an amount proportionally greater and greater than the water vapor amount, yet the data shows the exact opposite relationship.

      Now, think about the significance this in conjunction with the data in the cloud amount vs. temperature plot, and keep in mind that clouds are made up of water.

      The data in these two plots very likely provides the answer to the fundamental question of not just the net effect of clouds themselves, but to the net feedback acting on the climate system (i.e. the combined feedback of water vapor and clouds).

  35. Slabadang says:

    Chris Colose!

    Whats wrong with you? How could you possible earn an Phd when you are totally blocked from inputs that doesnt fit your narrative. Im not a certfied climate scientist but that doesnt make me unable to understand the difference between a good valid argument from false one. Act as an responible reprentative of your science .. not as its stubborn clown!!

  36. Norman says:

    Mike Flynn

    Your statement “I believe Einstein, Planck etc., in preference to any number of Warmists who cannot demonstrate this wonderful “greenhouse effect” by any experimental means whatsoever.” is a good one in that I could not find any labratory experiments proving the greenhouse effect.

    I found a few that reject it (Wood’s test and a follow-up).

    I have read lots of thought experiments on what should or could happen but I do not know why the scientists don’t roll up their sleeves and actually do the experiments.

    Roy Spencer says that if you put a heater inside a vacuum sphere that is cooled (so it does not produce significant back radiation) and it heats to 150F then you put another object in close proximity of the heated element, the second element, upon heating will tranfer heat to the orignial object and cause it to warm. Why can’t this be lab tested?

    Another test claims if you put a series of spheres around a heater at the center of the first, each sphere will cause the radiation flux from the heater to double. Seems this should be a very easy experiment to carry out and test.

    Why the lack of experimental evidence? Most back radiation measurements are not with actual instruments but rather calculations, what happened to empirical science?

    If there is any doubt about the theory of backradiation warming the Earth’s surface, or delaying the cooling, then it is time to do actual tests to see what the real results will be. Proof of any claim or theory. Why is there such a lack of actual experimental tests run? These are important concepts and funding should not be hard to obtain.

  37. Doug Cotton says:

    Well said, Norman. Another study which perhaps Roy could do would be to extend the study of 15 cities in the Appendix of my paper to perhaps 200 or 300 inland tropical cities between 24 deg.S and 24 deg.N in their warmest months.

    My results took just a few hours to calculate from the linked source of 30 year means ..

    Means of Adjusted Daily Maximum and Daily Minimum Temperatures
    Wet (01-05): 30.8°C 20.1°C
    Medium (06-10): 33.0°C 21.2°C
    Dry (11-15): 35.7°C 21.9°C

    http://principia-scientific.org/publications/PROM/PROM-COTTON_Planetary_Core_and_Surface_Temperatures.pdf

  38. Doug Cotton says:

    Would you like to do a joint study with me Roy? See the Appendix for what I mean. Suppose we each analyse 30 cities in each of four of the eight zones, so we have 240 cities –

    24 – 18 deg N & S
    16 – 12 deg N & S
    12 – 6 deg N & S
    6 – 0 deg N & S

    I predict we will find that dry cities have mean daily minimum temperatures about 2 degrees above the minimums for wet cities, and mean daily maximums about 5 degrees above wet cities, so precipitation (causing less steep lapse rates) results in cooler surface temperatures, both maximum and minimum. This is in accord with what is explained in my paper.

  39. Doug Cotton says:

    Oops – line 2 should be 18 – 12 deg N & S of course.

    Frankly this result is obvious. If you have a wet region with a lower thermal gradient, then, when the area under the plot of radiative flux against altitude is the same as that for a dry region (ensuring radiative balance) then the intersect with the surface must be at a lower temperature than that for dry regions.

    Given that this is such a straight forward conclusion to reach, it astounds me that they got away with claiming water vapour produces net positive feedback. They could have spent just one or two man weeks proving that dry cities are warmer than wet ones, other parameters being the same, or adjusted for altitude variations.

  40. Norman says:

    Doug,

    I highly encourage that type of research. You have a theory that the drier cities will be warmer than the wetter ones (same solar insolation). The limited research I have done shows this could be the case. A larger more extensive study would confirm or deny your prediction but it would be based upon reality instead of possibilities. That is real science. A larger study will reduce the changes that could be do to some local weather pattern (such as persistant wind favoring a certain condition).

    Doug, on a side note about your thermal gradient idea. Some think it is new and strange physics. The way my mind visualizes it is like taking a rubber ball inside a chamber and dropping it from the highest point. We just need a ball that is like a molecule with perfect elasticity. As the ball drops to the bottom it picks up velocity in the gravity field. Its potential energy turns to kinetic energy. You measure the velocity and notice it is greatest at the bottom. As it bounces and moves upwards it slows down and the kinetic energy goes down (with temperature you are only measuring that velocity). Now if you fill the chamber with rubber balls you should notice the same effect, balls near the bottom are moving faster than those at the top.

  41. pochas says:

    Sorry to thread bomb here (my second comment) but graphics showing tropopause potential temperatures are available. These temperatures seem to be uniformly higher than surface temperatures and I wonder why. Convection comes to mind. It seems a short jump to ask whether a useful estimate of sensitivity can be gained by comparing these tropopause potential temperatures with actual lower troposphere temperatures or surface temperatures.

    http://climaterealists.com/attachments/ftp/Tweet%20Feed%20442.jpg

  42. Massimo PORZIO says:

    Hi Norman,
    your explanation of the bouncing ball is obvious but for some (most?) climatologist seems that it doesn’t work.
    I often asked how do they imagine the last layer of the topmost “balls” at the very same speed of the below ones. Because in their imagined isothermal atmosphere, those last outer layer’s molecules should run perfectly tangent to the atmosphere with a full horizontal movement, but at the same time those molecules should get their energy from the below ones, which must have at least a tiny vertical movement. That should imply a mechanism to convert the vertical movement into a full horizontal one, which I never heard of.
    If you play the eight ball pool game you can’t hit the cue ball and see it to stop at all transferring its speed (energy) to the other balls in a perfect perpendicular direction to the original cue ball run.
    In my opinion the isothermal atmosphere molecules should have this very incredible behavior at the very last layer.
    Thus, until someone out of here will explain me how this is possible, I remain skeptic about it and I agree with Doug hypothesis.

  43. Doug Cotton says:

    To all:

    Massimo’s concern appears to relate to how molecules of air that move upwards then start to move horizontally and then downwards. This is covered in my paper in the discussion of wind and the funnel effect resulting from decreasing volume of the troposphere when approaching the poles. See Section 13 of the paper.

    Pochas’ problem about higher potential temperatures at the tropopause is explained by the fact that the effective gradient is less than the “dry” (-g/Cp) theoretical thermal gradient (about 9.8C/Km) which would have constant potential temperature. The “wet” gradient (AKA lapse rate) is less steep partly because of the release of latent heat, but mostly because water vapour radiates heat to cooler, higher layers of water vapour, and this leap frogging effect is of course far faster than diffusion and convection, and it has a propensity to make the net gradient less steep by about 30%.

    Norman, billiard balls give a good idea of molecular motion. Imagine two players each shooting a ball at the same time and same speed from the centre of each end of the table, such that the balls are aimed at each other and meet in the centre of the table. The balls will each cancel the other ball’s momentum. But then slope the table with props under one end, and repeat the process. This time gravity causes one to accelerate and the other to slow down more, so that there will be net downward momentum when they collide. So, if you had a horizontal cylinder of air and then rotated it to a vertical position, more molecules would immediately “fall” to the lower half, thus increasing the pressure quite quickly. However, it then takes much longer for diffusion of kinetic energy to establish the temperature gradient.

    Now, many people think increasing pressure causes and maintains increased temperature, and vice versa, that expansion causes and maintains a cooler temperature. This is not what physics says will happen. The reason is seen in the above example. The pressure comes first (as fast as a marble would fall in the cylinder) and the temperature gradient comes later due to diffusion. The reason is that temperature depends only upon the mean kinetic energy of the molecules, whereas pressure depends on both the mean KE and the density of molecules. (See Wiki “Kinetic Theory”) Hence it can be very hot in the thermosphere, but the pressure is very low. And likewise, pressure is not the reason why the surface of Venus is so hot.

    So pressure is not proportional to temperature as some seem to think. It would be easy to find a region high up in the Venus atmosphere where the pressure is only 1% of that at the surface. But you won’t find that the temperature there is only 1% of 730K, that is 7.3K. The gas would be solid and would have collapsed towards the surface.

    There is a very detailed discussion of the gravitationally induced thermal gradient from Section 4 to Section 7 in the paper, the section headings being …

    1. Radiation and Heat Transfer
    2. The Problems with the Greenhouse Conjecture
    3. The Venus Dilemma
    4. The Second Law of Thermodynamics
    5. The State of Greatest Entropy
    6. Quantification of the Thermal Gradient
    7. Explanation at the Molecular Level
    8. The Concept of “Heat Creep”
    9. How Earth’s Surface Temperature is Supported
    10. Laboratory Evidence for the Gradient
    11. Planetary Evidence for the Gradient.
    12. The “Pseudo” Lapse Rate.
    13. Non-Radiative Heat Transfer Processes
    14. Rebuttal of Counter Arguments
    15. Support for the Mantle and Core Temperatures
    16. Conclusions
    17. Appendix – Study of Temperature / Rainfall Correlation
    18. References

    My offer to do a joint study of real city data with Roy is genuine. If he does not wish to put his name to it, I will do it all myself in due course. You can contact me, Roy, at [email protected]

    .

  44. AlecM says:

    There can be no CO2-AGW because the thermal CO2 IR emission atmosphere to surface turns off the surface-atmosphere emission in the same wavelengths.

    This is engineering radiative thermal equilibrium 101.

    The reason is a subtle bit of physics.

  45. Massimo PORZIO says:

    Hi Doug,
    “Massimo’s concern appears to relate to how molecules of air that move upwards then start to move horizontally and then downwards.”
    Maybe I bad explained my concern.
    What I meant, it was that if the gravity doesn’t reduce the KE of gases as the molecules rise up (that is their temperature reduces as function of altitude), I can’t imagine how they stops to rise at all. I’m just try to imagine the so called isothermal atmosphere, where (following that theory) everything is in equilibrium and there is no winds, no convective cells at all.
    In that theoretical situation, what is the physical effect which make the molecular run change direction keeping the speed constant?
    That’s my unanswered question.
    In fact, even if I can’t state that you are right or wrong, I can understand your funnel effect argumentation.
    But if I don’t misunderstand you, you too don’t believe in the isothermal atmosphere.
    I would like that those who believe in the isothermal atmosphere explain me how that static atmosphere could have a ceiling at all.
    Do they believe that all the atmospheric layers run horizontally? In that case what is the physical effect which explain the molecular “fly” at any altitude with the same KE, so that the higher molecules have higher total energy?
    Because those molecules are in a gravitational field, so they must have as much PE as they are high in their fly.

  46. Massimo PORZIO says:

    Hoops, in my previous message:
    “What I meant, it was that if the gravity doesn’t reduce the KE of gases as the molecules rise up (that is their temperature reduces as function of altitude),”
    Must read:
    “What I meant, it was that if the gravity doesn’t reduce the KE of gases as the molecules rise up (that is their temperature DOESN’T REDUCE as function of altitude)”

  47. Doug Cotton says:

    AlecM: In a sense I suppose you could say radiation from the cooler atmosphere “turns off” surface radiation of the same frequency (and intensity) but I’m not sure where you are implying the energy goes. Please see Sections 2 to 5 of my Radiated Energy paper. I have been saying that the back radiation supplies energy for the corresponding surface emission. Alternatively you can say it is pseudo scattered and switches off the surface radiation. It amounts to the same thing – do you agree?

    But all the discussion about radiation is not seeing the big picture as in Section 15.

    Massimo: I agree that rising air that was not cooling would be gaining free potential energy and it would be like a stone thrown upwards which kept on going at the same speed even though it was gaining potential energy – so yes, it would launch into space. Those satellites would be so much cheaper to launch, Roy, but I’m not sure how they’d stay in orbit in such a crazy world that somehow supposedly supported an isothermal (but not isentropic) atmosphere.

  48. Doug Cotton says:

    Roy

    It’s not a case of models warming 3x too fast. The models are not models of natural climate change, so whatever their result might be, it is irrelevant, and the models won’t ever show the cooling that lies ahead.

    Why sit on the fence, Roy, when there’s no fence to sit on? See the BIG pictute

    Imdeed it’s time for the whole world to see the good news in the big picture, as in Sections 15 and 16 of my paper reproduced below.

    Anyone who understands why carbon dioxide has no significant effect on climate should consider joining about 200 of us at Principia Scientific International.

    There have been many new members this month. Most prominent among them is John Sanderson, immediate past president of the Royal College of Science Association, Prof. Ole Humlum of the University of Oslo, Prof. Cliff Ollier of the University of Western Australia.

    15. Support for the Mantle and Core Temperatures

    The mystery of planetary core and mantle temperatures can now be unravelled with the concept of heat creep. Borehole measurements [27] indicate a thermal gradient of about 25 to 30°C/Km in the outer 10Km or so of the Earth’s crust. This is what we would expect, because the mean specific heat of earth, rock and clay is about a quarter that of atmospheric air, and a “pseudo” rate would also develop because of intra-molecular radiation. But specific heat increases significantly at higher temperatures, leading to the thermal gradient in the deep mantle being perhaps even less than 1°C/Km because the specific heat is in the denominator of the -g/Cp quotient.

    Now, we need to see the big picture. There must be a continuous thermal plot which rises, at least from the top of the troposphere, down to the surface and then, at a steeper upward gradient in the outer crust, curving over to an almost level plot as it approaches the core. The whole plot has evolved autonomously by conduction and diffusion processes over the life of the Earth, and presumably similar plots have evolved on other planets like Venus.

    Energy from the Sun “creeps” up the thermal plane, not only supporting surface temperatures, but even those of the crust, mantle and core. So, if insufficient energy is generated beneath the surface, then the shortfall will come from the Sun, at least over the course of many years.

    The key point is that this plot would be very stable, and we should have nothing to worry about for thousands of years because it would take a huge amount of extra energy (which could only come from the Sun) to raise the whole length of the plot from the tropopause to the core.

    When the Sun warms the surface by day, it merely deposits extra thermal energy at the boundary so that some flows into the crust and top layers of the ocean, and some provides extra warmth in the first 100m or so of the atmosphere. This extra pile of energy dissipates at night, the marginal cooling process being slowed by non-radiative and radiative processes.

    But the big picture is, that the underlying thermal plot “supports” both the surface temperatures and even those in the crust, mantle and perhaps the core. It does not matter if extra energy is created in the core, or trapped temporarily at the surface, because the cooling process will accelerate if the temperature gap widens, or slow down when the gap narrows. Even the apparent loss of energy in the calculated terrestrial flow is misleading, because it is based on a thermal gradient that gravity formed and over which energy might even be flowing up towards the mantle, from where it may be released in volcanoes, thermal springs or undersea vents.

    16. Conclusions

    When Maxwell and Boltzmann dismissed Loschmidt’s postulate of a gravity gradient they did the world a great disservice, and they contributed to a belief in a non-existent warming by an imaginary radiative greenhouse effect. The subsequent “calls to authority” should be a lesson for all in the scientific world, for this has resulted in an absolute travesty of physics. The greenhouse conjecture will inevitably take its brief place in history as the biggest and most costly mistake ever in the field of human scientific endeavour. Hopefully that will be soon.

    Scientists, be they climatologists, physicists or whatever, need to step outside the square and to adopt a paradigm shift based on, and supported by 21st century science. Dr Hans Jelbring and Roderich Graeff have each made significant contributions which must now be heeded before the mistake is perpetuated by those who now have personal vested interests in maintaining the status quo.

    Climate has in fact been following natural cycles [28] as shown in the Appendix to the author’s paper on Radiated Energy [2] and the world can expect a period of about 500 years of cooling to start within 50 to 200 years from now.

    The Loschmidt gravity-induced thermal gradient is more than enough to explain the proverbial “33 degrees of warming” and in fact the dry adiabatic lapse rate would lead to a mean surface temperature of about 25°C were it not for water vapour and, yes, to a much smaller extent, carbon dioxide reducing the gradient and causing lower base surface temperatures. In the Appendix is an outline of methodology that would almost certainly produce studies which would demonstrate the cooling effect of water in locations around the world.

    Thermal energy can and does “creep” up the very shallow thermal gradients in planetary atmospheres and also in their solid crusts and mantles, supporting sub-surface temperatures. Indeed the physics of “heat creep” resolves the long-term puzzles of planetary core and surface temperatures, and, for this very reason, begs attention and claims validity for this 21st century new paradigm shift in climate change science. [29]

    http://principia-scientific.org/publications/PROM/PROM-COTTON_Planetary_Core_and_Surface_Temperatures.pdf

  49. Norman says:

    http://scienceofdoom.com/2010/07/17/the-amazing-case-of-back-radiation/

    According to SOD the backradiation has an approximate value of 300 watts/m^2.

    Wouldn’t it be most easy to demonstrate by taking a parabolic mirror around 1 meter square surface area and use it to heat water at night by concentrating this 300 watts into a container of water at the focal point of the mirror?

    Why do solar plants shut down at night, can’t they still concentrate that downwelling IR and use that to heat water to steam and run the turbines (just less than daytime but still a good source of energy).

    http://answers.yahoo.com/question/index?qid=20110324191316AAnl2rQ

    This is a discussion of an existing solar power plant in California. Even though the backradiation is about 1/3 of the daytime radiation (or maybe 1/4 if you include the solar radiation plus the daytime back radiation), if you can generate megawatts of energy during the day you should still be able to generate a good amount of energy at night with the backradiation.

    Am I missing something with this?

  50. Massimo PORZIO says:

    Yes Norman,
    but it seems to me that yours idea is not new.

    See here:

    http://www.vermonttiger.com/.shared/image.html?/photos/uncategorized/2008/07/25/toaster.jpg

    πŸ˜‰ πŸ™‚

  51. VincentGray says:

    I cannot understand how you can carry out accurate statistical analysis on a sample population which consists not of individual measurements, but averages, each of which has unknown and probably large levels of uncertainty.

    I would also like to point out the the supposed “Measurements” of atmospheric carbon dioxide are the result of multiple rejection of the “noise” which is acually the true measurements, and is chaotic..
    Maybe CO2 is rising but why does nobody measure it over land surfaces?. Is it because the figures are higher over industrial areas, so increases are less important, and figures are lower over non .industrial ares where increased CO2 is beneficial.

    Finally the “Climate System” cannot possibly comply with the Second Law of Thermodynaimcs since it is not thermally isolated. Also there can never be an equilibrium because part of the energy is stored by growing plants and making concrere and steel.

  52. Norman says:

    Massimo PORZIO

    Thanks for the link it was a good laugh.

  53. Entropic man says:

    CO2 measurements are taken at a number of sites worldwide. Some, like Japan, are downwind of industrial areas and tend to show higher levels due to locally produced CO2.Land sources with abundant vegetation also show a diurnal and seasonal cycle, so time of day and time of year affects the readings.

    The Hawaiian Keeling curve is generally regarded as the most reliable long term trend indicator because it is far enough from major sources of CO2 for mixing to equalise local variability, and small enough that diurnal and seasonal variation from local biological sources is small. Hawaii is also close to the Equator and samples air mixing between both hemispheres.

    The Hawaii data still shows a seasonal variation because the majority of photosynthesis takes place in the Northern Hemisphere, reducing CO2 worldwide in the NH Summer months.

  54. Mike Flynn says:

    @Doug Cotton.

    Re your “request” for comment.

    1. Nobody has measured the Earth’s temperature accurately. Nobody has measured the Earths’s surface temperature accurately – or even managed to define the term “surface” in any meaningful sense. Talk of historical “warming” is an assumption.

    2. Could I point out that if the Earth started off as an incandescent blob, it has cooled. We live our lives on the congealed cooled surface. The Sun has not heated a cold earth from around absolute zero.

    The current temperature of the Earth is that to which it has cooled so far, taking into account all sources of energy, internal and external.

    Gravity (or the lack thereof) is not responsible for warming anything.

    3. Your statement “. . . this cannot be coincidental . . .” is nonsense. Of course it can. Whether it is or not, requires an explanation of the reason for the planetary temperature. If Venus also started off as an incandescent blob, given its present distance from the Sun, what should its surface temperature be now? I warrant you don’t know, and neither does anybody else.

    4. Loschmidt was just as wrong as Arrhenius. Otherwise, the water in Lake Baikal at a depth of 1000 m, wouldl be warmed by compression due to gravity. It isn’t.

    5. Just take away your external source of energy for a moment. Your gas will cool to absolute zero, and become isothermal. Multiply your gravitic force as much as you like. Result? Temperature does not change. Cylinder will be the same temperature at both ends. You might have overlooked that all your gas particles are radiating EMF, and that they will all continue to cool until the conditions are such that the Second Law (however you define it) is “obeyed”. Gravity (or the lack thereof) makes not difference at all.

    6. With regard to the lapse rate, I am curious as to the behaviour of a column of air above the Earth which is at a temperature of say 288K, and the other end of the column at a temperature of say 3K. Would there not be, quite naturally, a rate of change of temperature along the column? Increased gravity would of course change the rate of change as the column became “shorter”, but the temperature would still have to proceed from 288K to 3K.

    7.
    I am not sure where to start. “. . . it is apparent. . .” – not to me it isn’t. I am not sure what you mean by a “conduction-like” process. Is it conduction or not?

    In regard to your rather odd assumption that nitrogen has no appreciable ability to radiate EMR, I suggest you experiment with a hair dryer. You will discover that a gas comprised of around 80% nitrogen can be heated. It cools by radiation.

    The rest of the paragraph is filled with assumptions both stated and unstated. I f you wish, I can address them more fully.

    8. Refer to the Second Law of thermodynamics. Gravity either does something, or it does not. ” . . . in effect . . .” usually means “I don’t really understand what I am trying to communicate”. Is this true of you?

    9. Back to para 1. According to geophysicists, (at least some, there is argument about the amount), the Earth is cooling at a rate of about one millionth of a degree C per annum. This of course may change if the “heat sources” both internal and external vary in the future. Gravity is not involved to any significant extent.

    10. Graeff believes he has tapped into a “free” source of energy utilising gravity induced temperature differential. He has, IIRC, actually received a patent for his device, although it studiously avoids any mention of a “perpetual motion machine.” As you point out, his results do not appear to accord with observed reality at the very least.

    11. As I am one of your “third group” of people, I could take issue with your bland dismissal due to implausibility.

    Given Venus’s closer proximity to the Sun compared with the Earth, it may well be taking longer to reach the same temperature as the Earth. As neither you, nor anyone else, knows the original planetary temperature at its creation, the external and internal energy sources since its creation, its changes in reflectivity and emissivity etc., you cannot say what the present temperature “should be”.

    You assertion that “. . .heat will only be transferred . . .” is, at least, misleading. You assume that your reader accepts the same definition of heat that you do. There are dozens of definitions of “heat”. All can be shown to be defective. What definition are you using?

    I like your assertion that the mechanism you postulate is ” . . . the only possible mechanism. . .”. I can think of one or two other possibilities

    12. The lapse rate would appear to be a necessity, given the difference in temperature between the surface of the Earth and the close to absolute zero of outer space. If a calculation provides a different result to repeated observations, maybe the calculation should be revisited – just in case.

    13. At the moment, the air temperature outside is around 34C. Humidity around 80%. Not a perceptible breath of wind within a kilometer or so. Now tell me again about wind, and warm air rising. The air temperature drops as you ascend in general. Your assumptions are simplistic, and misleading.

    14. Unfortunately, you have said the Sun warms the top of the stratosphere, and previously that it warms the lower atmosphere. This is actually true, but in relation to the ocean, your explanation of cold bottom temperatures in Lake Baikal for example, appears to require less dense warm water descending to the bottom. Interesting New Age physics. If you care to learn a little more about EMR, you will realise why deep water gets very cold (in the absence of geothermal vents, of course).

    In relation to Graeff and Loschmidt, you may be confusing the thermoelectric effect (which can cause an EMF across junctions of different metals) with “heat” energy. Graeff’s invention IIRC, claims to be able to extract electrical energy by virtue of the gravity induced temperature difference by means of a thermocouple. No heat transfer at all required. However, energy is of course lost to the system.

    15. Once again, if the core of the Earth is at say 5000K (my assumption only), and the Earth sits in a near vacuum with a “temperature” of 3K, then there will be a temperature gradient of some 5000 degrees between the core, and outer space. It makes sense to me.

    16. There is no need for a paradigm shift currently. Once you demonstrate that you can calculate what the current surface (you may choose your own definition) temperatures of Earth and Venus “should” be, I may of course change my thinking. So far, I see nothing more than vague assertions and an obvious misunderstanding of radiation, heat and the laws of thermodynamics (such as they are).

    17.I am not sure what this paragraph is for. You spent a few hours producing a table. What was the point of this?

    So you asked, and you have received. Color me unconvinced, stupid if you wish.

    So far, I am of the opinion that Astrology has provided more to the scientific body of human knowledge than Climatology is ever likely to. Astronomy evolved from Astrology – Climatology will lead to – ?

    At the moment, Phrenology and Climatology possess about the same utility to mankind.

    Please do not take offence, as certainly none was intended.

    Mike Flynn.

  55. Doug Cotton says:

    Mike Flynn

    (1) The exact amount of variation in the ~1,000 year cycle may well have some uncertainty, but my point is that whatever has and will happen is natural, whatever the magnitude.

    (2) And you have not read and understood the mechanism of heat creep and the need for thermodynamic equilibrium, rather than thermal equilibrium. In other words, my response is in the paper.

    (3) Every planet has had plenty of time to cool off well before now, and would have done so but for the Sun keeping it warm.

    (4) There is evidence of the gravitationally induced thermal gradient cited in Section 14 Rebuttal of Counter Arguments. Next time please read the paper first. Where do I talk about compression causing warming? Nowhere! You are just making assumptions about what is in the paper, and you are way off the mark.

    (5) Again you indicate that you have no idea of what is in the paper. And your isothermal assumption is wrong anyway, and the gases would solidify well beforehand. So the whole example is irrelevant.

    (6) You like your 3K gas don’t you? It will fall on your head as a solid mass. My paper is all about the gradient and why and how it occurs (not due to pressure) and the consequences. You will be surprised when you actually read it.

    (7) Your comment here reveals your lack of understanding of the diffusion process. The nitrogen is not heated and cooled by radiation in your example. But now I have an understanding of how little understanding you have of physics. Having taught students for nearly 50 years I don’t have any trouble sorting the sheep from the goats.

    (8) No, but it is true of yourself.

    (9) The assumptions they make are incorrect, and my paper explains why.

    (10) My paper tells you why I disagree with Graeff who had no formal training in physics and botched up his calculations as a result.

    (11) As I said, the planets are not the temperature that they are because they have only cooled that much. Yours is an old wives’ tale, totally unable to be verified computationally. By all means give your alternative explanation of the Venus surface temperature of over 720K at the poles where less than 1W/m^2 of insolation gets through to the surface. Why are the poles about as hot as the Equator? Come on – let’s see your explanation rather than hand waving.

    (12) A circular argument. Which came first, the lapse rate or the warmer surface?

    (13) Again you are hand waving – but see Section 13 for my response, and if you don’t find all your questions answered, trying reading and understanding the whole paper.

    (14) You repeat yourself about the oceans, so I repeat that my response is in Section 14. Regarding possible confusion with the electromagnetic effect, I would appreciate it if you didn’t treat me like a first year undergraduate. Again I repeat, Graeff’s invention will never work for the reasons explained in Section 14.

    (15) Of course there would be a gradient, but it is not linear for a start. But you miss the point. How is the core temperature maintained so precisely?

    (16) There are calculations in the paper and, in particular, in relation to Venus in the two cited references.

    (17) Why should I take offence at so many comments which have nothing to do with what I have written, are based on incorrect physics (such as assumptions that an atmosphere could be isothermal) and, above all, clearly demonstrate a lack of knowledge and understanding of what is in my paper? May I suggest that, in future, you make a genuine effort to understand the other person’s argument before you just go off at a tangent. You don’t have to believe the argument, but at least if you understand it your attempts to rebut it will be somewhat closer to the mark.

  56. Doug Cotton says:

    (14) typo – thermoelectric effect of course. Regarding electromagnetic radiative heat transfer, see my peer-reviewed paper published March 2012

    http://principia-scientific.org/publications/PSI_Miatello_Refutation_GHE.pdf

  57. Doug Cotton says:

    Oops – that link has an interesting Section 8 about Venus, but, sorry, my first paper on Radiated Energy was http://principia-scientific.org/publications/psi_radiated_energy.pdf

    You mentioned the Second Law of Thermodynamics, so I’m wondering whether you are referring to the outdated Clausius statement which says heat transfer is always from hot to cold. If so, may I suggest you read my paper and refer to the more general entropy version which is needed in the study of the fairly advanced physics of “heat creep” explained in my paper.

    You cannot understand or explain all that happens in an atmosphere of any planet or moon until you understand this “heat creep” mechanism.

  58. Mike Flynn says:

    @Doug Cotton,

    I am not sure why you assumed I did not read your paper. Possibly you did not realise that my numbered comments were in correspondence with your numbered paragraphs.

    Sorry. I should have been clearer.

    You asked me whether I am referring to ” . . . the outdated Clausius statement . . .”.

    I am not sure. Please give me the definition of the Second Law of Thermodynamics that you use. The link in your paper is to a Wiki page which contains several definitions.

    Which one did you use?

    I guess I should point out that the editor of the Wiki page is confused about radiation in some areas. He should reread the Einstein paper regarding the photo voltaic effect. I believe Einstein received the Nobel Prize for his work in this regard, so I am surprised that a Wiki editor could make such a silly error. Does this render everything else on the page similarly suspect?

    Anyway, I would like to state that I can explain most (if not all) that happens in an atmosphere without resorting to “heat creep”.

    What would you like explained/

    Regards,

    Mike Flynn.

  59. Doug Cotton says:

    Mike

    If you read the paper, you display little knowledge, let alone understanding of the contents. As the author thereof, I would suggest that I am in a position to make this statement. For example, you ask about the Second Law of Thermodynamics, and yet there is a whole Section 4 devoted to such, with a statement thereof in Paragraph 3 which is in accord with that in numerous physics texts.

    What would I like explained? OK .. this …

    Venus has had plenty of time to cool off, and would have done so but for its atmosphere.

    The poles of Venus are about the same temperature as the Equator. Empirical evidence shows that the Equator receives no more than about 10W/m^2 of direct solar radiation, and the poles receive less than 1W/m^2.

    Hence, unless other energy is received into the surface of Venus that surface would cool well below 730K.

    Radiation from a cooler atmosphere cannot transfer heat to the hotter surface. That would be against any statement of the Second LoT. The 1W/m^2 at the poles could not produce more than 1W/m^2 back out again and into the atmosphere, so there is nowhere near enough radition from this energy to have any significant effect on the rate of surface cooling.

    Radiation can only slow the radiative cooling of the surface. So we have to ask “cooling from what temperature?” Or in other words, how did the temperature get so high in the first place?

    How precisely, and by what physical mechanism does sufficient energy keep on entering the Venus surface at its poles? Provided details with quantitative net flows of thermal energy, as distinct from electromagnetic energy.

  60. Doug Cotton says:

    And Mike, wouldn’t it be the photoelectric effect (not, as you say, the photovoltaic effect) for which Einstein received his Nobel Prize?

    http://www.edn.com/electronics-blogs/edn-moments/4400940/Einstein-wins-1921-Nobel-Prize-in-Physics–November-9–1922

  61. Espen says:

    Roy, regarding the Humlum et al. paper:
    Even if we may have entered a multi-year La Niρa-dominated regime now, we still have quite warm oceans, so even in a world without anthropogenic influence, atmospheric CO2 might still have been on the rise. I don’t think we will be able to see clearly to which extent the derivative of the Keeling curve is dependent on natural ocean processes until we have had some years of ocean cooling.

    Here’s a Google translate of an article which may interest you, where Ole Humlum answers some of the critique of their paper, I think it looks reasonably readable (Norwegian -> English isn’t the most difficult task for automatic translators):

    http://translate.google.com/translate?sl=auto&tl=en&js=n&prev=_t&hl=no&ie=UTF-8&eotf=1&u=http%3A%2F%2Fgeoforskning.no%2Fblogg%2Fitem%2Ftemperatur-og-atmosfaerisk-co2&act=url

  62. Mike Flynn says:

    Doug Cotton,

    Second first. Humble apologies. I grovel in mortification. Of course it was the photoelectric effect, rather than the photovoltaic effect.

    Now to your question re Venus.

    You ask (in bold, if I may be so bold) “How precisely, and by what physical mechanism does sufficient energy keep on entering the Venus surface at its poles? Provided details with quantitative net flows of thermal energy, as distinct from electromagnetic energy.”

    I confess I do not understand your question. Are you of the opinion that Venus is somehow heated by energy entering at the poles? Is your proposition that Venus was created hot, cooled, and then somehow warmed up due to the effects of gravity and “heat creep”?

    My assumption (an assumption only – I wasn’t there at the time), is that Venus and the other rocky planets started off as incandescent blobs. If you choose to believe that Venus was created as a cold blob, and has since developed a molten core and so on, then we must agree to disagree.

    I believe my explanation is simpler, and more in accord with observed fact.

    Time will tell.

    Live well and prosper.

    Mike Flynn.

  63. Doug Cotton says:

    Mike Flynn, Roy or anyone in the world

    What is difficult to understand about the first paragraph? “Venus has had plenty of time to cool off, and would have done so but for its atmosphere.” Millions or years ago it cooled down to what it is now, just like Earth cooled down. But it now stays at the temperature we observe because it is in an equilibrium state, wherein the energy which it radiates, even at the poles, balances the energy that the poles receive – somehow. Such energy can only come from the Sun. Just like Earth, Venus is kept at the temperature it is at because the energy in equals the energy out.

    Earth warms and cools each day and night, and so does Venus, so obviously the Sun is warming both during the day. They are not just cooling off from some hot temperature millions of years ago.

    But very clearly, the “energy in” by way of radiation, especially at the poles, is nothing like the radiation energy (which Stefan Boltzmann Law indicates is over 16,000W/m^2) coming out of the surface – even at the poles, and even during the four month long night where it cools by about five degrees. It then warms again by five degrees the following four month long day. So obviously the warming is caused by the Sun. But how does enough of the Sun’s energy get into the surface?

    I believe that no one in the world can provide an alternative answer to what is in my paper. Go and contact all your physics or climatology experts! Draw attention to this question anywhere. Yes, I’m throwing down the gauntlet, because I genuinely want to know if there can be any possible alternative.

  64. Norman says:

    Mike Flynn

    I think the second graph on this link will help you understand Doug’s concept.

    http://joannenova.com.au/2011/10/there-is-a-greenhouse-effect-on-venus/

    It compares the Earth and Venus temps. At the very low pressure Earth atmposphere is very hot because of the thermosphere: http://en.wikipedia.org/wiki/Thermosphere

    Something must work different with Venus and UV. The next deviation from an obvious gradient is the Earth’s upper stratosphere that is warmed by UV light breaking up O2 and forming ozone: http://en.wikipedia.org/wiki/Stratosphere

    After those variations both Earth and Venus run on a thermal gradient. The difference between the two temps is equivalent to the difference in solar energy between the two planets.

    Solar energy is what is warming both planets’ atmoshperes (gravity does not compress the gases and cause the warming as you suppose Doug is stating, which he is not). What gravity does is cause more kinetic energy to be found at the bottom of the atmosphere than the top. The total atmosphere is at the Blackbody temp for the solar energy it would receive. Gravity causes more kinetic energy at the bottom and less at the top so the temp increases at the bottom but overall the atmosphere is at blackbody temp (I guess -18C). Doug’s claim is that the atmosphere is what is causing the surface temperature to be where it is at (not the surface causing the overall warming of the atmopsphere). Solar radiation at day will rise the temperature of the air above the gradient temp (by warming of the surface) but the energy will spread into the atmosphere and maintain the thermal gradient at isoentropic equilibrium. Hope I am understanding you correctly Doug.

  65. Mike Flynn says:

    Doug Cotton.

    If I understand correctly, you have finally asked a question that I can understand.

    Correct me if I am wrong, but “What is difficult to understand about the first paragraph?”, followed by “Venus has had plenty of time to cool off, and would have done so but for its atmosphere.” appears to be your question, if stated in a slightly unorthodox fashion

    The answer is simple. Nothing. If you choose to believe the second part of your question, as a matter of faith, then that is the end of the matter. People have believed that the Earth is flat, that the Sun is the centre of the universe, that heavy objects fall faster than light ones, and so on.

    Belief does not necessarily imply fact. You are in good company however. Lord Kelvin (physicist William Thomson), as late as 1897, believed the Earth was between 20 and 40 million years old, based on his calculations of the initial molten state, and the heat loss since creation. He believed that the age of the Earth was probably closer to 20 million than 40 million years. I believe he was out by some billions of years.

    So yes, in 1897, you would have received support for your assertion. Today maybe not so much. I do not challenge a person’s beliefs without good reason. The reason in this case is that you have asked me a question related to those beliefs.

    Any more questions?

    Live well and prosper

    Mike Flynn

  66. Mike Flynn says:

    Norman.

    Thank you for your thoughts.

    To clear up one small matter, as I understand the matter, Loschmidt was of the belief that gravity acting on a column of gas would create a temperature gradient vertically within the column. Please note that I did not assume that Doug believed that to be the case. It was a comment querying Loschmidt’s belief.

    If I understand you correctly, we are in agreement (at least partially). The Sun warms the Earth. As Lord Kelvin’s calculations showed, assuming the Earth’s only heat sources to be the remnant heat from the time of the Earth’s creation, and heat subsequently received from the Sun, gives a wildly inaccurate estimate of the Earth’s age.

    In any case, you might care to ask why placing any sort of matter (no hotter than the Earth’s surface) between the Sun and the Earth will cause the temperature of the Earth to rise. As far as I know, it doesn’t and it can’t. Anyway.

    Live well and prosper,

    Mike Flynn

  67. Doug Cotton says:

    Mike

    I repeat …

    “Earth warms and cools each day and night, and so does Venus, so obviously the Sun is warming both during the day. They are not just cooling off from some hot temperature millions of years ago.”

    And I ask you then to explain …

    “How does the Venus surface get enough energy to warm an extra 5 degrees during each 4-month day?

    Note that the required energy input would be at a rate of over 16,000W/m^2 because the temperature is over 720K.

  68. Norman says:

    Mike Flynn

    Your last point is the one I am trying to figure out. Nearly all climatologists including Roy believe in backradiation from a colder atmosphere warms the sun. I have been looking at radiation heat transfer equations and they acknowledge that radiation will be given off by a cooler object that will strike a warmer object but heat never flows from a colder object to a warmer object. It does not matter if it is conduction, convection or radiation. The heat always moves from warmer to colder and never the other way. Radiation flows freely between the two but heat only moves in one direction.

    This link explains a black body surrounded by a sphere. The sphere does send radiation back to the blackbody at the center but the overall heat flow is away from the blackbody to the sphere. Heat flow means that the hot one cools down and the cool one warms until they achieve an equilibrium temp and no more heat flows (radiation continues to be exchanged but the emit and receive identical amounts).

    http://www.efunda.com/formulae/heat_transfer/radiation/blackbody.cfm

  69. Doug Cotton says:

    PS – Mike

    You will get nowhere being condescending to me.

    You wrote “If you choose to believe the second part of your question, as a matter of faith”

    Seeing that Venus demonstrates (via empirical measurement) that it can cool by 5 degrees during the 4-month night, I would suggest that it does not take much “faith” to understand that it could have cooled well below its observed temperature either in the absence of a Sun or in the absence of an atmosphere. I find a bit of mathematics and physics a good substitute for your faith, but if you wish to hold to your own faith that it is still just cooling off, then that’s your prerogative – in full view of all the silent readers.

  70. Norman says:

    Mike Flynn

    Doug does believe that gravity creates a temperature gradient. It is based upon the idea that overall energy remains the same but molecules that move downward will gain kinetic energy (temperature is a measure of the mean kinetic energy of a number of atoms or molecules) and those moving up against the gravity field will lose kinetic energy (temperature) but gain potential energy. The gas will be cooler at the top than at the bottom. Doug gives some experimental evidence of this condition. I would like to see more experiments done to prove this effect to the larger body of interested scientists. I like ideas and theories but when there is a point of disagreement you know what Galileo did. He did an experiment to prove objects accelerate at the same rate in a gravity field.

    With the backradiation hypothesis of being able to warm the Earth’s surface by 33C (that is a lot of energy) I am still wondering why they don’t capture and concentrate this energy and use it as a power source. It exists day and night. If backradiation of the level given (300 watts/meter) is real we should be able to end all energy problems permanently. If such exists why is all that energy just going to waste heat to warm the surface and no one is building means to capture and use it?

  71. Doug Cotton says:


    To all:

    Those who have read and understood my paper will know that the paper outlines solid physics which debunks Mike’s statement “In any case, you might care to ask why placing any sort of matter (no hotter than the Earth’s surface) between the Sun and the Earth will cause the temperature of the Earth to rise. As far as I know, it doesn’t and it can’t. Anyway.”

    But I have no intention of trying to condense 20 pages into a brief comment here. Those who are interested in what is, I believe, a major breakthrough in the understanding of climate need only to read “Planetary Core and Surface Temperatures.” It’s not a matter of “faith” as Mike seems to think. It’s a matter of correctly understanding and applying standard physics.

    This is why Mike is left floundering for an explanation as to how the Venus surface warms by 5 degrees during its day, and why it doesn’t keep cooling at the rate at which it does during the night.

    The Russians measured the Solar radiation at the Venus surface and found it could not possibly come anywhere near being sufficient to raise the temperature 5 degrees. And, as Norman says quite correctly, no radiation from the colder atmosphere can transfer heat to the hotter surface. So Mike has no explanation as to how the required extra energy (which obviously must come from the Sun) actually gets into the surface of Venus, especially at he poles.

    And neither does Roy have an explanation, nor the IPCC, nor any other published author – as best I can ascertain.

    You only need read http://principia-scientific.org/publications/PROM/PROM-COTTON_Planetary_Core_and_Surface_Temperatures.pdf


  72. Norman says:

    Calculation. Backradiation from atmosphere to Earth is claimed by the climate community to be around 300 watts per meter square. Currently all this 24/7/365 energy is only heating the surface of the Earth as waste heat.

    The US has a few large solar collection sights in deserts that produce useable power.

    A 1 GW nuclear power plant would need

    (1×10^9 watts)/(300 watts/m^2)=3333333 m^2

    One square kilometer is equal to 1 million meters squared (1000 x 1000). Divide 3333333/1000000 and you need 3 square kilometers to recover a GW power. If your system runs at 30% efficiency then 11 square kilometers of concentrating collectors will get you a continuous supply of 1 GW of power. It may cost a few billion to build but after that the energy source (backradiation) is free. There are a lot of desolate areas on Earth that could spare a few kilometers here and there. No need for anymore power plants. You could eliminate all CO2 emissions as you move to electric cars (but then you will have an ozone haze). Energy problem solved for all nations. Third world needs to be third world no more. Sorry Middle East, but with all your desolate areas you could become huge power generators for the world. Iran would not need to build nuke reactors for energy. Backradiation is a miracle that no one seems to want to harness. Why? Roy Spencer why don’t you discuss this with higher ups and push for the building of backradiation power plants across the planet?

  73. Doug Cotton says:

    Of course Norman and I both know such a back radiation gathering plant wouldn’t generate anything. It’s now 50 weeks since I had my peer-reviewed paper on all this published here …
    http://principia-scientific.org/publications/psi_radiated_energy.pdf

    It appears that Mike believes that a still atmosphere in a gravitational field, or still air in a well insulated sealed cylinder (such as in Graeff’s 800 experiments) would somehow develop an entropy gradient. This indeed would be a very strange phenomenon in which a state would exist which was not a state of thermodynamic equilibrium, because obviously entropy would be free to increase. But Mike must think that there must be a constraint such that any state with greater entropy would not be an accessible state for the system, as is a prerequisite for the Second Law of Thermodynamics*… perhaps Mike can explain why he has faith that it would be isothermal, rather than have the obvious propensity to become isentropic – as per the Second Law..

    * The Second Law of Thermodynamics: “An isolated system, if not already in its state of thermodynamic equilibrium, spontaneously evolves towards it. Thermodynamic equilibrium has the greatest entropy amongst the states accessible to the system.”

  74. TonyM says:

    Norman:

    Hi, you have not taken note of AlecM who I mentioned in our last post. He commented above and simply stated that from an engineer’s viewpoint annihilation of radiation occurs.

    Your argument about using back radiation for energy could equally be framed in another way – why not use the energy being radiated and convected from earth since back radiation can only be a part of that energy? Let’s double up!

    But, would you construct a hydroelectric generator in the Ganges just because there is a water flow and plenty of it without first creating a large potential energy difference? Similarly would an electric motor work simply by connecting it across two independent wires having the same voltage?

    Plank’s law covers it; E = hv. The frequency of back radiation is far lower than insolation photons.

    Nowhere in the world can solar panels generate power at night – except Spain! Yep, the electric utilities were paying big bucks in the buy back schemes from night generated “solar” power. On investigation they found that some consumers were diverting mains power back into the grid so they could get paid about three times the rate per kW hr. πŸ™‚

    But your underlying question is valid. Both AlecM and I did some experiments to detect back radiation. His was more sophisticated but neither of us could detect the level suggested i.e. by covering panels and controls etc etc.

  75. Massimo PORZIO says:

    Hi TonyM.

    The link below is to a video of a famous Italian satiric TV news:

    http://www.striscialanotizia.mediaset.it/video/videoextra.shtml?12948

    The man with the blue jacket explains how Spanish were not the first doing what you say about diverting the mains power back into the grid to get paid three times the rate per kW hr.
    The video is in Italian of course, but believe me, the trick is better than you can imagine because it makes the production counter counts the consumed energy.
    So the more you consume, the more you get paid! Great! A real genius… And the Italian “ship” is still sinking… Sigh! πŸ™

    It’s just one of the results of Dr.Spencer’s “fundanomics”.

  76. Norman says:

    Hi TonyM,

    I liked you Spain story. The power plants in the California desert do not use photovoltaic cells to generate their power. They use mirrors that concentrate the solar energy at the center that heat up water to steam and run a turbine like a conventional power plant.

    IR radiation can be concentrated the same as visible so you have to have a lot of concave mirrors that reflect and focus the 300 watts/m^2 and aim it at a tower to collect and heat up water to steam. The energy of the individual photons does not matter in such a system, just the amount of energy you can concentrate upon the tower to heat up the water.

    I am being sarcastic as Doug pointed out. I think there is radiation emitted by the cold atmosphere but it is not 300 watts/m^2. When I look for some actual measurement of backradiation I can never find it, it is always some calculated amount. You can have the most complex equations and know how to use them but they won’t be right unless they are based upon the actual reality.

  77. steveta_uk says:

    Norman, why concave mirros? That implies a point source. There is no point source, but a diffuse source from all directions. How do mirrors help?

  78. Massimo PORZIO says:

    @steveta_uk says:

    “Norman, why concave mirros? That implies a point source. There is no point source, but a diffuse source from all directions. How do mirrors help?”

    The Solar Two plant uses parabolic mirrors indeed, which focalize the almost parallel Sun rays in the SW to the tower.
    Maybe Norman referred to “concave” just to say that those mirrors look concave even if they are parabolic.

  79. Norman says:

    steveta_uk and Massimo PORZIO,

    Thanks. I had the wrong mental picture of the backradiation. Since it is diffuse like light in a fog, you can’t concentrate to extract its energy by that method (mirrors).

    But that does not stop me from doing research on the topic.

    If found this one from Nasif Nahle. It looks like he has done some good research and calculations to demonstrate the current understanding of Greenhouse effect is not correct. He has also done experimental testing to demonstrate what he has calculated.

    http://www.biocab.org/Total_Emiss_Mixed_CO2_and_WV_and_Mars_GHE.pdf

  80. steveta_uk says:

    It’s even worse problem that extracting energy from fog.

    Since the ground is likely warmer than the air above, any orientation of mirror to capture “downward” radiation may well be shielding the “collector” from radiation from below, so actually cooling rather than warming the “collector”.

    And any attempt to shield a sensor to try and measure the difference between DLR and no DLR would require a shield with no temperature itself, which is silly.

  81. Doug Cotton says:

    Prof Nasif Nahle has done studies on backradiation in his paper
    http://principia-scientific.org/publications/New_Concise_Experiment_on_Backradiation.pdf
    which I cited a year ago in my paper
    http://principia-scientific.org/publications/psi_radiated_energy.pdf

    Nasif is one of several physicists and professors of other disciplines on the team at Principia Scientific International all of whom recognise fallacies in the AGW conjecture.

    You need to see the big picture to understand the relative insignificance of backradiation, as explained towards the end of my latest paper
    http://principia-scientific.org/publications/PROM/PROM-COTTON_Planetary_Core_and_Surface_Temperatures.pdf

    1. The thermal gradient (AKA “effective lapse rate”) is pre-determined by the force of gravity, the weighted mean specific heat of the gases in a planet’s atmosphere (at that altitude) and the degree of intra-molecular radiation which, in the case of Earth, is somewhat dependent on the percentage of water vapour which, as is well known, makes the gradient less steep.

    2. The overall level of the plot is established by the autonomous propensity for there to be radiative equilibrium with incident Solar radiation. The area under the curved plot of outward radiative intensity thus has a propensity to remain constant if the gradient alters. So extra water vapour makes it less steep by lowering the surface end and raising the tropopause end.

    3. The surface temperature can then be calculated by extrapolation of the thermal plot of temperature against altitude in the troposphere. The temperature can be derived using SBL from the values of radiative flux at each altitude from (2). The higher the tropopause, the greater the distance over which the temperature can rise, this explaining why Venus is much hotter than Earth.

    4. The mechanism whereby the thermal plot is maintained involves the absorption of energy originally from the Sun (both in downwelling and upwelling radiation) which is then dispersed in all directions over the thermal plane, in order to maintain thermodynamic equilibrium, in accord with the requirements of the Second Law of Thermodynamics.

    5. The thermal plot continues its upward climb more steeply in the crust (due to lower specific heat) but far less steeply in the hottest regions of the mantle because specific heat increases significantly with increasing temperatures.

    6. Heat creep, as described in (4) allows thermal energy to enter deeply into the subsurface regions and, eventually, to support core temperatures and provide energy which can contribute to that in volcanoes and thermal springs and vents.

    7.The surface warms temporarily during the day and then both radiative and non-radiative processes slow its rate of cooling, but there is a limit to such cooling due to the underlying very stable thermal plot of temperature against altitude or underground depth. This is why the base of the atmosphere does not continue cooling at a fast rate all through the night. The force of gravity redistributes absorbed energy in such a way as to provide a supporting temperature at the boundary of the surface and atmosphere, and even at the boundary of the mantle and core.

  82. Bart says:

    3) “But my current opinion is that the science on radiative forcing by increasing CO2 is pretty sound.”

    I would very much like to know more about how the calculations are done, and what assumptions are built in which are necessary to conclude this. Because, it ain’t necessarily so. I would appreciate your consideration, and any commentary, upon the following.

    Willis Eschenbach recently had a WUWT post here in which he discussed a thought experiment to elucidate the greenhouse effect. The setup is as follows.

    You have a planet with an internal nuclear furnace. In cold, empty space, you can determine the steady state temperature of the surface based on the power output of the core Pcore, and the radius of the planet Rplanet:

    T1 = (Pcore/(4*pi*Rplanet^2))^0.25

    Then, you enclose the planet inside a perfectly heat conducting, completely opaque to radiation shell. What happens to the surface temperature?

    If you assume the shell has an inner radius Rinner and an outer radius Router, then the steady temperature will be

    T2 = T1 * (1 + (Rinner/Router)^2)^0.25

    Obviously, T2 is greater than T1 in general, with the maximum effect being when Rinner is approximately Router. In that case, it becomes roughly 20% hotter.

    But, here is the rub: Let “d” be the thickness of the shell, and Rinner = R0 – d/2, Router = R0 + d/2, where R0 is the average radius. Then

    T2 = T1 * (1 + ( (1-f) / (1+f) )^2 )^0.25

    where f = d/(2*R0). As d increases, the factor (1-f)/(1+f) decreases, so the incremental change in T2 due to an incremental increase in d is negative.

    The reason is that, as the thickness increases, the radiating surface back to the planet decreases, while that to cold space increases. The math is all shown here.

    I believe that this very simple example shows that the GHE does not necessarily increase with increasing CO2. At the very least, it shows that additional warming cannot be taken for granted. Empirical data appears to argue that there is virtually no effect on surface temperatures from additional CO2. The latest data here show that the ~60 year cycle peak arrived on time. The linear trend and that cycle comprise the lion’s share of the temperature plot. Compensating for them, there is no discernible significant change due to increasing CO2.

  83. Bart says:

    I left out the SB constant in the first formula:

    T1 = (Pcore/(sigma*4*pi*Rplanet^2))^0.25

    Dr. Spencer, I did not express my plea directly to you above, and you might miss it in all the comments traffic. Please take a look and let me know what you think.

  84. phlogiston says:

    1) Ocean mixing: a recent increase in ocean vertical mixing would cause the surface to warm more slowly than expected, and the cold, deep ocean to very slowly warm. But it is debatable whether the ARGO float deep-ocean temperature data are sufficiently accurate to monitor deep ocean warming to the levels we are talking about (hundredths of a degree).

    Any increase in vertical mixing will indeed have the overall effect of moving heat downward from the surface to the depths, due to the ubiquitous thermal stratification (warm surface, thermocline, cold depths).

    The ARGO floats show less warming at the surface, more deep down. There are sampling issues concerning if this represents a real increase. However the relative difference with surface and depth is self-referenced and thus the most robust aspect of the ARGO data. And this shows downward movement of heat.

  85. Bart says:

    phlogiston says:
    February 28, 2013 at 6:48 PM

    “And this shows downward movement of heat.”

    It shows a location of heat energy. It does not provide an arrow of directionality in the flow.

    Thermal transport via the heat equation requires that the heat should be greatest near the source. E.g., when the handle of your frying pan is warm, you may be assured that the pan itself is hotter.

  86. Arno Arrak says:

    I don’t like “El Nino adjusted” data and especially I don’t like the multivariate El Nino index. Nino3.4 has more credibility to me because it sits in the middle of the equatorial countercurrent and watches all the El Nino waves go by. Because it catches them before they get to South America there is a time lag and variations in this time lag tell us what might have happened to it after it passed the midpoint of the countercurrent. But if you must for some mysterious reason compensate for the ENSO system you should pick a location in the Eastern Equatorial Pacific where the El Nino wave spreads out and gives up its heat to the atmosphere. La Nina is harder because the back flow is spread out and more irregular. It does join the two equatorial currents whose temperature drops as a result. The Walker circulation most likely gathers it together to join these currents. Someone ought to look into the details of this because I have not been able to locate info on that.

  87. Noblesse Oblige says:

    There is a slight error in the analysis. You should not just subtract the MEI regression component from the temperature time series to get the underlying ENSO-free signal. You should do the regressions of temperature against time and MEI simultaneously; i.e., a two-dimensional regression:

    T = a t + b MEI + c,

    where a, b, and c are consatnts to be determined. The reason this is likely to turn out different than doing the regressions sequentially is that the MEI may have an underlying trend: is not equal to zero. I suspect you will get a very similar result as the blue trace in the third figure, but this way is rigorous.

  88. JPS says:

    Dr. Spencer,

    I was led here from the WUWT site and have found some of the information here interesting, but I must say the only way I can describe the comments section is “bizarre”. WHo is this Doug Cotton (who is obviously taking on multiple personalities and having a conversation with himself) and why are you letting him essentially hijack your discussion?

  89. Ned Nikolov says:

    Roy,

    Your possibility (3) is actually the CORRECT one! Radiative forcing by CO2 is a pure simulation artifact resulting from an artificial decoupling of radiative transfer from convective heat exchange (an algorithmic error) in all climate models…

  90. Mike Flynn says:

    Norman,

    Sorry to take so long to reply.

    The problem with mainstream climatologists is that that they are forced to believe the unbelievable.

    The main tenet of climatology is that reducing the amount of energy reaching the Earth’s surface by replacing the near vacuum between the Sun and the Earth with denser matter, be it oxygen, nitrogen, carbon dioxide (or indeed anything else at all), causes the surface temperature to rise.

    As I have said before, based on current scientific knowledge, this is utter nonsense.

    It is sad that so much has been wasted by so many to produce so little.

    So, again, if anybody can demonstrate a way to increase the heat content of a body by reducing the energy available to that body, I will grovel in abject apology.

    It’s balderdash. And with that, I bid you all adieu.

    Live well and prosper,

    Mike Flynn.

  91. Norman says:

    Mike Flynn

    I think it is time for me to do some experimentation. Debate is endless. Equations are numerous. The best way to resolve the conflict of GHE is to do some experminents.

    All equations for heat transfer I have found all indicate that a cooler body cannot warm a hotter one. The equations for Heat flow have the hotter temperature (to fourth power) minus the cooler temperature (to fourth power). If you put the cooler temperature of a surface first, the net heat flow is negative. All these equations are totally aware of “backradiation” both surfaces give off radiation continuously but the cooler one never is shown to warm the hotter one.

    My experminent would be to have a hot plate warm to its high potential and measure its surface with a high range thermometer. Then take a second hot plate and move it close to this one (but a little cooler in temperature) and see if this one is able to increase the temperature of the first one. This should end the debate on all the blogs it has been going on and on yet no one wants to run some simple expermiments and everyone is completely sure of that their understanding is correct. Time for real science to end the debate one way or another.

  92. Arfur Bryant says:

    Norman,

    I look forward to seeing your results!

    It would be great to think that the results (whichever way it goes) would be warmly embraced by the ‘climate science’ community. However, I fear they will only embrace a result which confirms their collective preconception. The political aspect of the debate has become far too forceful for scientific truth to have any weight except in a purely academic sense. Sad and a crying shame but I suspect there are many scientists who already know what you (and I) suspect but who, for whatever reason, have decided not to speak out.

    Still any evidence from whatever source has to be a good and worthy thing, so I wish you all the best.

  93. Arfur Bryant says:

    Doug Cotton

    I seem to remember you are due to undergo major surgery in the next week or so.

    If I’m right, I wish you all the very best! I hope it goes well.

    Regards,

    Arfur

  94. TonyM says:

    Norman:
    I feel the experiment you propose is heading in the wrong direction.

    The issue is not whether a lower T item increases T of a hotter item. Even climatologists will readily give the answer here in the negative.

    T anomaly measures reflect the Tmax and Tmin – an average.

    In addition it is not about simple radiation but whether CO2 suppresses heat loss or insulates the system by that mechanism. If it slows the cooling then that is in effect increasing the average T as measured and stated.

    It may result in an increase in the actual Tmax of the day over a lengthy period if there was not enough time in the day to reach an equilibrium Tmax. Hence, starting at a higher point in the morning may allow the Tmax of the day to be higher than otherwise would be the case without the

  95. TonyM says:

    ctd…(did not all go thru):

    It may result in an increase in the actual Tmax of the day over a lengthy period if there was not enough time in the day to reach an equilibrium Tmax. Hence starting at a higher point in the morning may allow the Tmax of the day to be higher than otherwise would be the case without the

  96. TonyM says:

    ctd … not sure Y ..but last attempt..

    Hence starting at a higher point in the morning may allow the Tmax of the day to be higher than otherwise would be the case without the insulating

  97. Norman says:

    TonyM

    What you describe is one of the theories of how increased CO2 can warm the surface above the temperature it would have without CO2 in the atmosphere. But so many on various blogs are saying that a cooler body will warm a hotter one. The standard argument given is that radiation does not know how hot the body it is going to hit (in line of sight) so radiation from a cooler body will hit and warm a hotter object. Science of Doom, Roy Spencer, Skeptical Science, Jo Nova, Judith Curry, WUWT all of them are stating that radtiation from a cooler object will indeed increse the temperature of the hotter one and that the Second Law of Thermodynamics does not violate this.

  98. Norman says:

    TonyM

    I think I can also cover you explanation by measuring the rate of cooling. I can monitor the surface of the hot plate after turning off the current to see how long it takes to cool to room temperature (it would be more ideal to have all the equipment in a vacuum chamber but I do not have access to one) but conduction rate should not change drastically so it may still prove valid. After I determine the cooling rate or how long it takes to reach room temperature again I can put any old object near the plate (not heated). I wait until the second unheated object reaches equilibrium temperature (now radiating much more than at room temp) and turn of the hot plate and monitor its cooling rate to see if a radiating body can slow the rate of cooling of the hot plate via back radiation. Insulation would slow the rate of cooling. Now it is to determine if a radiating body would. At this time I don’t think it will act as an insulator to heat flow.

    Earlier on this thread it was explained that silvered surfaces will slow down radiative cooling but I am not sure if just any radiating material will do such. If you just had thin material on the walls of the house it will not do much to slow down heat loss in the winter if your heat goes out. The best way to tell is run some form of experiment. My experiments may not be correct and have some flaws but that is why more tests of all types should be run and documented on procedure. The issue should not remain in limbo.

  99. TonyM says:

    Norman

    Good idea. You may as well include T measures on the way up as back-radiation should show up as well versus time. You might also include insulating the backs of the metals. A nickel that there is an effect! πŸ™‚

    One puzzling aspect of the GHE hypothesis is why, with so much money involved, there are no modern experiments with large cylinders of air with different levels of CO2. Perhaps no one wishes to know by real, controlled experimentation.

  100. Mario Lento says:

    @Norman: you wrote; “If such exists why is all that energy just going to waste heat to warm the surface and no one is building means to capture and use it?”

    Because you need a delta t to do work. The radiation leaves towards the sky at night from below the sky. It does not radiate downwards. If we were at some colder temperature than the sky, then you could collect energy from the sky.

  101. Mike Flynn says:

    @TonyM,

    The GHE effect is nonexistent. Hence, no experiment can prove its existence.

    I will say again – reducing the amount of energy that the Earth’s surface receives from the Sun, cannot cause an increase in temperature.

    Mario Lento has it right. At night, radiation proceeds from the surface towards the cold of outer space. In the absence of cloud, dust and so on, in arid regions such as the Libyan desert, it is practical to make ice by this principle. It’s been done for thousands of years in different parts of the world.

    Does this count as an experiment showing that the warming effects of back radiation exist mainly in the brains of those who propose such nonsense from the comfort of their taxpayer funded sinecures?

    @Norman,

    A silvered surface (eg aluminium foil) will reduce the rate of energy loss in both directions. Your thin walled house (or thin roofed, if you have a “tin” roof), will benefit greatly from foil lining. “Sisalation” is one brand. The “space blanket” used by emergency services personnel and others works on the same principle.

    The most efficient insulator I can think of (in terms of bulk) is the “Thermos” flask, which has two opposing highly reflective surfaces with as high a vacuum as practicable between them.

    It works rather well. Any GHE proponent would no doubt remove the silvering, and replace the vacuum with carbon dioxide. No wonder the only organisations willing to employ such people are Governmennt funded, one way or the other!

    Oh well, must away.

    Live well and prosper.

    Mike Flynn.

  102. TonyM says:

    Michael Flynn:

    Thanks for your comment but unless you try to understand the varied possibilities associated with the GHE hypothesis then a glib answer certainly won’t address it.

    It is not necessary for Tmax to increase for the GHE effect to result in effective warming. You are referring to Tmax and not the accepted meaning of the term

  103. TonyM says:

    ctd…I can’t copy paste for some reason..
    You are referring to Tmax and not the accepted meaning of the term

  104. TonyM says:

    ctd…I can’t post my full response..will try to complete last sentence at least.

    You are referring to Tmax and not the accepted meaning of the term “warming” which is averaged T.

  105. TonyM says:

    The GHE hypothesised mechanism is consistent enough with this measure to warrant experimental investigation.

    Neither your experiment nor a kerosene lamp, under certain conditions, making ice address the issue.

    I am quite comfortable with Norman’s controlled experiment which addresses more than simply GHE.

    As we are only talking effects from something like 1.5 w/m2 from CO2 for doubling its concentration in a 10km+ atmosphere, I fail to see your point with the thermos flask substitution comment.

    Yes of course may we all live well and prosper.

  106. TonyM says:

    Sorry about all that…but have no idea what limits my copy/paste.

  107. Norman says:

    I have completed one experiment. Before I do more I wonder if anyone would want to send feedback or ideas on the test I have already run. It seems to demonstrate a cooler surface can warm a hotter one.

    The setup was in a lab hood. I used a hotplate for one surface and a 175 watt heat lamp for another.

    I used a 550F thermometer for the test.

    I turned on the hotplate with the thermometer resting on its surface. I waited until the temperature of the surface reached an equilibrium temperature with its surroundings at 360F. I also tested the surface temperature of the heat lamp at equilibrium of 350F. The heat lamp was a little cooler than the hotplate surface.

    I placed the heat lamp a few inches from the hotplate surfacae and directed the beam path onto the surface of the hotplate. The surface temperature of the hotplate started to rise and continued climbing until it reached 400F (the thermometer was in the scale of 5 degrees per line). It seems as if the cooler heat lamp surface was able to raise the temperature of the hotplate surface from 360F to 400F.

    When I turned off the heat lamp the surface of the hotplate began to drop quickly to the previous equilibrium temperature.

    If anyone has ideas or sugggestions on what might be going on or a different way of running the experiment I can run the test in a different manner.

  108. Mike Flynn says:

    TonyM,

    Experiments (eg Wood), show the GHE is a myth.

    I was not referring to making ice with a kerosene lamp (I do not know where you got that idea), but rather to demonstrate the way the Earth’s surface loses heat by radiation to space.

    My comment about the Thermos flask also demonstrates radiative heat transfer mechanisms rather neatly, by tryng to prevent heat transfer.

    Your comment about ” . . . something like . . . ” misses the point. Blocking energy from reaching the Earth’s surface by inter posing an atmosphere of any sort will not raise the temperature of the Earth.

    Not T max (which is easily exceeded by the Moon, with a relative lack of atmosphere), nor the “average”, however you choose to define it. Climatology was invented to make astrology look good. That is a joke. Climatologists obviously believe their unverifiable assumptions, just as fervently as astrologers.

    I really must leave you to your beliefs.

    Live well and prosper,

    Mike Flynn.

  109. Mike Flynn says:

    Norman,

    Did your “heat lamp” by any chance contain a filament heated to some thousands of degrees by any chance? You may have inadvertently demonstrated “real” radiative physics rather than “climate” physics.

    If your heat lamp was supposedly filtering out all but infrared radiation, you would see nothing visible when looking at the front surface. This is not usual, and “proper” measurement, of total energy reaching the target may be in excess of that absorbed by the front glass, and re emiited in the infrared spectrum.

    There is of course, another factor to consider. That is, energy received by the hot plate is dissipated until the energy in equals the energy out. If you reduce the rate at which the initial supply of energy is being dissipated, by raising the temperature of the surroundings (or in your case, part thereof), then the plate temperature will rise. This does not actually indicate that a cool body is warming a warmer one.

    However, as you have discovered, your heat lamp consumes another 175W, which is dissipated in your system. So far, I can’t be certain you have demonstrated a failure of the laws of thermodynamics. Keep at it, but use bodies that do not have continuous external flow of energy (eg electricity), involved.

    Sorry to appear so obtuse, but I think you are smart enough to understand that your experiment needs a little refinement.

    Live well and prosper.

    Mike Flynn.

  110. Bart says:

    Norman says:
    March 3, 2013 at 5:58 AM

    “The standard argument given is that radiation does not know how hot the body it is going to hit (in line of sight) so radiation from a cooler body will hit and warm a hotter object.”

    That’s not quite right. The hotter body is radiating, too, and more than the colder one. So, although it can accept photons from the colder body, in the aggregate, it is going to provide more back to it, and it is impossible for the colder body to warm the hotter one.

    But, that is NOT what the GHE is about. Let me refer to the hotter body above as H, and the colder one as C, to avoid confusion in what follows.

    In the GHE, you have a third body, which provides the source of heat. Call it S. H is continually taking in heat from S, and it has to be continually clearing it out, or it will accumulate and H will grow hotter. C is inhibiting the dissipation of heat from H. Hence, the heat from S accumulates on H, and the outward radiation grows until C can no longer inhibit as much leaving H as is coming in from S.

  111. Norman says:

    Mike Flynn

    Thank you for your comments about the experiment I carried out.

    The temperature of the surroundings (lab hood walls and glass cover) did not get much above warm so I do not believe that would much change the equilibrium temperature reached by the hot plate surface. I let the hot plate heat for about a half hour before directing the heat lamp onto its surface. It remained fairly stable during this time. I did see a few temperature changes which could have been caused by changes in voltage. Because of this I do not think the surrounding environment was causing an increase in the surface of the hot plate. When I directed the heat lamp on to the hot plate surface the temperature started to rise and continued to about 400F. When I turned the heat lamp off the surface temperature on the hot plate dropped rapidly. The extra heat into the environment did not seem to be the cause of the surface heating. As I stated the walls were only warm to the touch and not hot and these same walls did not seem to cause additional warming of the surface of the hot plate until the addition of the heat lamp.

    The goal of this test was not to prove or disprove climate science. It was more to see if a cooler surface could warm a hotter one. You may be correct that measuring the temperature of the heat lamp glass surface is not a true measure of the energy being emitted by this equipment. I did let the hot plate cool awhile and then left it off and turned on just the heat lamp. It could not bring the temperature to the 360F equilibrium temperature of the hot plate on full power. That would seem that it is putting out less energy to the hot plate surface than the heating element of the hot plate.

    Do you have any good suggestions on an experimental design that would actually prove one way or another if a cooler body can increase the temperature of a hotter one?

    I am still wondering why there is endless debate but little actual experimentation. In science when there is strong debate over how something works, the issue gets resolved in the lab. Yet no one wants to go there. Even if my primative first experiment did not demonstrate anything useful, it is moving the debate in the right direction.

    I do not know how many climate blogs you have visited but I see this same Second Law of Thermodynamics argument brought up over and over and talked about at length and equations brought up but I never hear of any actual experimental results.

  112. Norman says:

    Bart

    I was going to attempt a second experiment to determine if a a radiating body (be it water vapor, CO2, or any other radiating material) will noticeably slow down the rate a surface loses heat. I know insulation will slow down the rate of heat loss. I am not sure a radiating body will do the same. On previous posts they mention silvered sides reflecting IR back to the source. That is different from absorbing and reradiating. As you increase the amount of radiating material in the atmosphere, you can increase radiation directed to the surface but you also increase the amount directed to space away from the surface so it is still possible to have no actual effect on the surface. Rather than guess or debate a good experiment can enlighten and redirect the focus. At this time I have uncertainty on what will take place in reality. Maybe you have a good suggestion on how to set up a valid experiment to test for this. I do have limited supplies and equipment to test with but I will attempt the best experiment with what is available. The design is the key.

  113. AlecM says:

    Sorry Roy, but you and virtually everyone else in climate science is wrong.

    ‘Back radiation’ is the potential energy flux the atmosphere would deliver to a sink at absolute zero. To a slightly warmer surface, only net IR is real, and there is no 15 micron CO2 band IR.

    To prove this you need a bit of new physics, to be published soon I hope.

    It’s the solar influence which warms and cools.

  114. Mike Flynn says:

    Norman,

    Simplest way I can think of is to attempt to prove the existence of the GHE.

    You will need a room with a fairly steady temperature (an underground wine cellar is good, if you happen to own a chateau).

    A container that can be sealed and is fairly large – I think you mentioned a fume cabinet or similar. That may suffice.

    Your heat lamp, thermometer, and a supply of carbon dioxide. You can make this with a bottle, sodium bicarbonate and vinegar. A bit of plastic tubing and some putty or chewing gum or something and you are good to go.

    Anyway, the theory might be that surrounding something like the Earth (in your case your thermometer, hopeful attached to a largish coin which has been blackened with soot from a candle), with carbon dioxide will cause your Earth to become warmer than if the carbon dioxide was not there in the same abundance.

    So arrange your heat lamp so that the thermometer reads somewhat higher than the surrounding. Let the temperature stabilise. Take enough readings that you are happy with the result.

    Replace the air in your gas tight container with carbon dioxide. It is considerably heavier than air, so it will displace the air in short order. Seal your container when done.

    Now you have an atmosphere with a high percentage of CO2 between your Sun and your Earth. Repeat your temperature readings as before. Repeat as necessary.

    You can make up your own mind – if the results are not what you expect, your setup may need revising.

    If you’re in a lab, and have access to a vacuum pump, su

  115. Mike Flynn says:

    Norman,

    Sorry – must have hit something by mistake. Vacuum pump and suitable chamber, regulated variable low voltage power supply, low voltage 25 – 50 W incandescent lamp and a couple of bits and pieces, you can have a lot more fun.

    No prizes for guessing why I hold the views I do!

    In the meantime,

    live well and prosper,

    Mike Flynn

  116. Mike Flynn says:

    Norman,

    Many apologies. Ignore what I said, if you wish. I just realised you were asking Bart, not me.

    Sorry, I’ll pull my head in.

    Live well and prosper,

    Mike Flynn

  117. Norman says:

    Mike Flynn

    “Many apologies. Ignore what I said, if you wish. I just realised you were asking Bart, not me.”

    I am interested in any experminetal proposals. But the lab I work in in much more limited than what you suggest. I am old no longer a chemistry student with access to a nice lab.

    It sounds like you have done some actual experimentation on the subject matter and it seems to convinced you that GHE is not possible.

    I wish more would do experiments. Any University climatologist could have access to nice chemistry and physics labs were they could do various experiments. I think a vacuum chamber is a requirement to do pure radiative transfer testing.

  118. Bart says:

    Norman says:
    March 4, 2013 at 9:41 PM

    “As you increase the amount of radiating material in the atmosphere, you can increase radiation directed to the surface but you also increase the amount directed to space away from the surface so it is still possible to have no actual effect on the surface.”

    But, some is going to be more coming back to the surface, which otherwise would not be the case. Now, if the radiating material were also re-emitting incident sunlight back in equal measure, it might be a wash, but the majority of incident sunlight is not in the IR band which the material absorbs. So, in effect, the material acts like a diode for energy, passing through the sunlight, but resisting the radiation from the Earth.

    Geometry plays an important role, and I am interested in how it has, or has not, been taken account of. See my question to Dr. Spencer above.

  119. Norman says:

    Bart,

    I read through your post above with the calculattions. Interesting.

    Mike Flynn I am now convinced one cannot run experiments to determine anything in an atmposphere. Any experiment does need to be run in a vacuum chamber where convection and conduction and air have zero impact on the results.

    I also found out the thermometer I am using is not the best one for the application. It is a rod based thermometer with a round gauge (used for measuring the temperature of an oven). Today using the same thermometer (with probably a slight difference in the way the rod lay on the surface of the hot plate) reached and equilibrium temp of 500F.

    I thought I could run the test of seeing if an object would increase the surface temperature of the hot plate. I put a smaller ceramic plate an inch above the hot plate surface. The temperature rose rapidly to 520F before the ceramic plate had time to even warm up. My thinking is that the ceramic plate is a barrier to air movement and the air between the hot plate surface and ceramic plate would act like a good insulator and slow the heat flow so that the heating element would drive up the temperature. My belief is that if I used a material that was nearly transparent to IR the IR would go through and I cooled the plate so it had miniumum back radiation, the air trapped in between would have acted like a good insulator and caused the accumulation of heat on the surfaace.

    I do not have access to a vacuum chamber but I am sure many scientists have access and could easily perform very low cost tests to determine if a cooler surface will warm a hotter one. Then also if backradiation will slow down the cooling of a surface as an insulator would do. I have read many ideas on the topic and would much rather see experiments run than form any belief based upon the many opinions offered.

  120. Bart says:

    Norman says:
    March 5, 2013 at 4:02 PM

    “Any experiment does need to be run in a vacuum chamber where convection and conduction and air have zero impact on the results.”

    I think that is true and, of course, brings up the question of, does the GHE really work as advertized when you have significant convection, as we do in the Earth’s atmosphere?

    I tend to believe that the GHE is real, and it has raised surface temperatures above what they would be without the atmosphere. MLI blankets show that the effect of warming by inhibiting radiation transfer works for simple systems in a vacuum, and the use of such techniques is fairly routine in space.

    But, there may be a point of diminishing returns for complex systems such as the Earth’s thermal regulation system, when these other effects, e.g., convection and variable depth of radiating/absorbing media, come into play. In fact, I go so far as to say there surely is, because there really is no compelling evidence that increasing CO2 levels have elevated global temperatures at all in the last century.

    This could be a feedback effect of clouds, such as Dr. Spencer has speculated upon at one time or another. Or, it could be something more fundamental. But, we probably won’t get any real answers until the crisis of the current paradigm comes to a head with the recognition that the current warming hiatus is going to extend for another 20 or so years, and the current models are seriously flawed.

  121. TonyM says:

    Mike Flynn
    You are entitled to believe whatever you wish about back-radiation. Your illustrations of radiation fall far short of the mark when you make no mention of the key contributing factors like conduction, convection, evaporation etc. There are more direct ways to observe radiation heat transfers from earth on a daily basis.

    Similarly your comment

  122. TonyM says:

    ctd…
    Similarly your comment

  123. TonyM says:

    ctd ..try again apologies..

    Similarly your comment

  124. TonyM says:

    Mike Flynn

    You are entitled to believe whatever you wish about back-radiation. Your illustrations of radiation fall far short of the mark when you make no mention of the key contributing factors like conduction, convection, evaporation etc. There are more direct ways to observe radiation heat transfers from earth on a daily basis.

    Similarly your comment “Not T max (which is easily exceeded by the Moon, with a relative lack of atmosphere), nor the “average”, however you choose to define it” is rather meaningless given that you do not state the Tmin of the moon.

    Perhaps you might care to do a few Googles showing the moon’s surface T:

    Mean surface T (day) 107C

    Mean surface T (night) -153C

    So I guess -20C average may be a good guide.

    While you are flitting around you might get back to addressing Doug Cotton’s question to you about why Venus has an almost uniform T anywhere on the planet, day or night at over 450C. It is apt.

    So we have the moon at -20C and earth at +15C and Venus at +450C as average T.

    Distance from the sun is not the only component. Mercury which is closer to the sun than Venus achieves only around +310C average with four times the irradiance.

    The issue is not Max T nor whether something in between earth and sun can cause an increase in T max.

    In plain terms the issue is whether changing an atmosphere will change the average T. Note the AVG T – have you got that now?

    But as you are rather busy and need to fly off again trust me I can manage without the back of the Weeties pack science that you wish to believe in.

  125. TonyM says:

    ..errata above… sorry my experiments of ways to post…

    So we have the moon at -20C and earth at +15C and Venus at +450C as average T.

    Distance from the sun is not the only component. Mercury which is closer to the sun than Venus achieves only around +310C average with four times the irradiance.

  126. Norman says:

    Bart,

    Your MLI Blanket link above would seem to prove the WUWT post not correct physics. The claim on the MLI link is that the radiation insulation will send back 230 watts to the hot radiating surface. The surface will then still lose 230 watts not increase in temp. It does what you say, slow down the loss of heat.

    I still think real empirical testing should be done to demonstrate what is really going on. Currently all debate seems like religion not science. It is based upon someone’s interpretation of the physics. What is needed is real lab testing then it is not longer in the realm of opinion but fact.

    Vacuum chamber with an IR transparent dome over a surface similar to Earth average. Fill the dome with different gases to see the result. You have a source of energy above the dome that turns on for awhile warming the surface and then goes off for awhile. One test could be pure nitrogen, another pure CO2, another water vapor. Just do some real testing and verify what people believe. The testing would end the debate and either prove or disprove the GHE and it is very important to get the information at this time with all the debates going on. It would clear out the clutter of opinion and get it back to Science!

  127. Bart says:

    Norman says:
    March 6, 2013 at 8:41 AM

    “Your MLI Blanket link above would seem to prove the WUWT post not correct physics.”

    It is a little confusing. Mind you, I am not an expert on spacecraft thermal control. But, I think the difference is that the link is striving for simplicity, and assuming there is not an active source providing the heat which resulted in the 460 W original radiation. If there is such a source, then to achieve a steady state temperature, you must reach a point at which the outgoing power is the same as that being internally generated.

    In the case of the Sun-Earth system, the idea is that, since the atmosphere passes through the lion’s share of the incident sunlight, and only inhibits the outgoing IR, the situation is equivalent to having an internally generated power source.

    Your point about experimentation is well taken. You really never do know precisely how a system will react unless you can generate an input, and observe its effect in a direct cause-and-effect relationship, and many surprises tend to crop up when you do. Unfortunately, the practicality and expense of doing such experiments, much less ones which scale to the Sun-Earth system, are so daunting that people are winging it, and attempting to extrapolate what they know for very simple systems to this very complex one. That approach, IMHO, does not appear to be working very well.

  128. TonyM says:

    Norman:

    I sympathise with you in lack of suitable conditions and apparatus.

    I think you right in that bringing the

  129. Norman says:

    Bart

    I do not think that experiments, to at least establish some of the Greenhouse effects, would be overly expensive or too difficult.

    At this time it is vital to know if there is a solid foundation for the worst case scenario predicted by those who model the greenhouse effect on powerful computer systems.

    Look at the exchange between Mike Flynn and TonyM. Both have strong opinions they view reality correctly. This exchange goes on for thousands of posts on Judith Curry or Jo Nova’s blogs. You can view the PSI understanding or the completely opposite view on Science of Doom. Both websites claim the other wrong.

    With such serious consequences riding on what is the actual reality at least some testing should be strong focus. On one hand the Earth could warm 10C in the next few decades and cause a massive melting of stored ice. Or if this one is completely wrong, we cut back on energy resources and collapse the global economy and millions or billions die from starvation and other problems.

  130. Norman says:

    Bart,

    I think a vacuum chamber with an IR transparent dome above some type of surface, with a radiant source above to heat the surface inside the dome (that can turn on and off similar to the sun warming the surface during the day). The researchers can add different gases into the system to see what overall effect they have on the temperature of the surface. How fast does it cool when the energy source is turned off. You can have IR sensors about, thermometers about to get really good and detailed data on what is actually happening. It would not be an exact replica of Earth and Sun but some of the fundamentals would still be determined. You could even have water as part of your surface.

    Will CO2 cause the surface to retain heat more than a N2 atmosphere? You will be able to answer this question with good test procedures.

    The only thing such a set up will not help with is the gravitational induced thermal gradient that Doug Cotton is very confident exists and can explain the surface warming.

    If there is no difference between a CO2 and an N2 atmosphere in this test environment it could indicate that Doug Cotton is correct in his view (although I would like to see more experimental verification of this idea but one lone experiment).

  131. Norman says:

    In Scientific American November 2012 issue, there is an article in the magazine about Quarks.

    Particle physicist Don Lincoln has this to say about science.

    “Physics is ultimately an experimental science. No matter how clever the theory, if it fails to agree with measurement, it is wrong.”

    We need the scientists in this field to do more experiments in the lab to go with their computer models.

    The endless debate would end quickly if there were a few more experiments run except for one done in 1909 by Woods with a few trying to verify this testing. I can not find experimental data on the GHE theory one way or the other. Just a lot of opinions on how each group interprets the laws of thermodynamics.

  132. I’ll immediately seize your rss as I can’t in finding your email subscription link or e-newsletter service.
    Do you have any? Please let me understand in order that I
    may subscribe. Thanks.

  133. Fantastic website. Plenty of useful info here. I am sending it to some friends are also sharing in delicious. And naturally, thanks to your effort!

  134. Str Tropical says:

    Hi there are using WordPress for your blog platform? I’m new to the blog world but I’m trying to get started and set up
    my own. Do you need any coding expertise to make your
    own blog? Any help would be greatly appreciated!

Leave a Reply to Roy W. Spencer, Ph. D.