Our new paper has finally appeared in Asia Pacific Journal of Atmospheric Science (APJAS). Entitled “The Role of ENSO in Global Ocean Temperature Changes during 1955-2011 Simulated with a 1D Climate Model“, we use a time-dependent forcing-feedback model of global average ocean temperature as a function of depth to explain the Levitus record ocean temperature variations and trends since 1955.
The modeling philosophy is to answer the question: What combination of net feedback (climate sensitivity) and ocean mixing best explain the observed global average ocean temperature variations since 1955? In the global average, temperature variations are the result of only 3 processes: Forcing, feedback, and ocean mixing. These can be addressed in a simple 1D model.
Our primary interest was to explore how El Nino and La Nina activity since the 1950s affect our interpretation of climate sensitivity. Basically, if all of the ocean warming in the last 50 years (assuming it is real and accurate) has been due to anthropogenic greenhouse gas emissions, it leads to a higher climate sensitivity. But if some of that warming was due to stronger El Nino activity (since the 1970s) it would lead to a lower climate sensitivity. We let a variety of observations tell us how the various influences combine to cause climate change, by varying the model “free” parameters over many thousands of combinations to find a best match to the observations.
We examine three scenarios, shown schematically below.
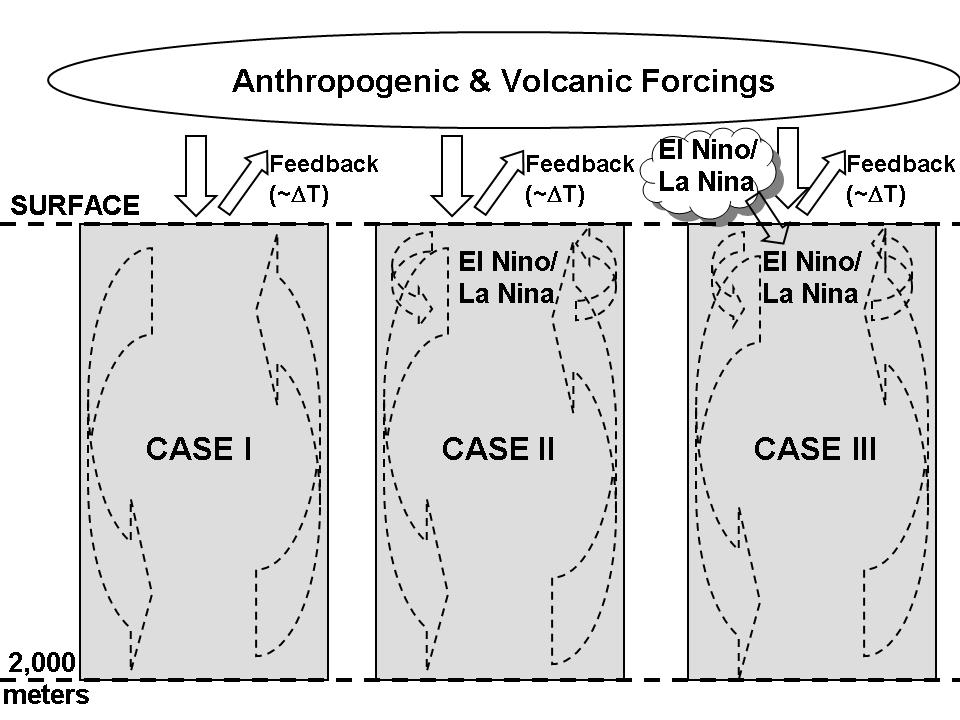
Schematic representation of the 1D forcing-feedback-mixing model. Solid arrows represent radiative energy exchanges, while dashed arrows represent non-radiative energy exchanges.
The first case (CASE I) uses only the RCP radiative forcings (also used by the latest crop of IPCC climate models) to see if we get about the same climate sensitivity as those models get (under the VERY important assumption that those are the ONLY forcings causing warming since the 1950s). This is sort of a sanity check on the model. We run the model with thousands of combinations of climate sensitivity and ocean mixing to get an approximate best-match with the Levitus observations.
In that case we get about 2.2 deg. C of equilibrium warming in response to a doubling of atmospheric CO2, somewhat below the average of the IPCC models. The model fits to the ocean temperature trends as a function of depth are shown in the next figure:
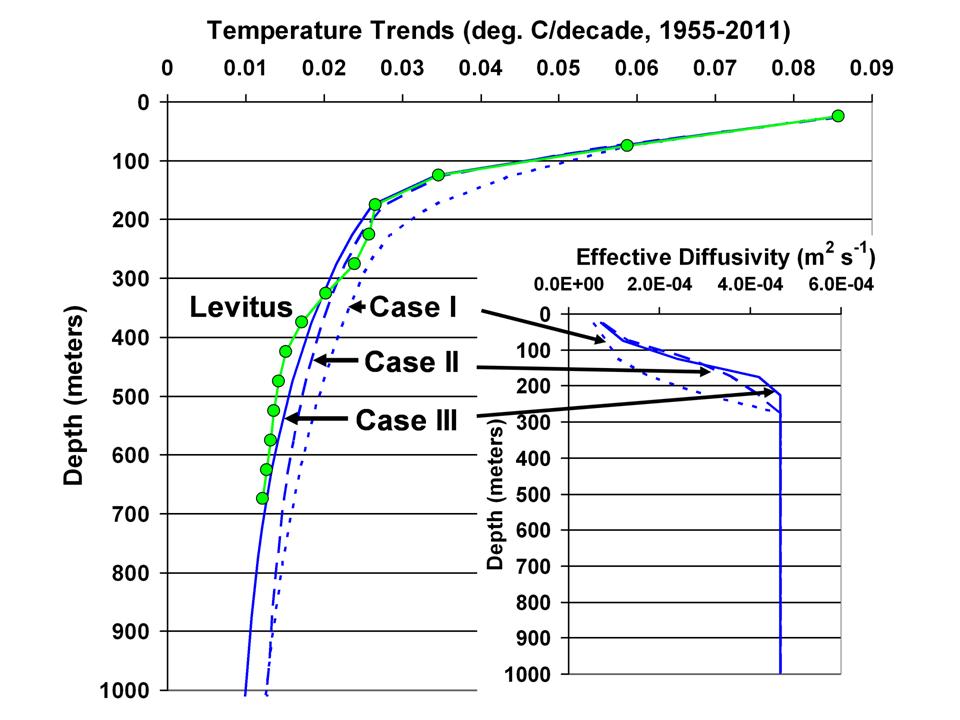
Comparison of three model cases to observed decadal ocean temperature trends as a function of depth, in 50 m layers, for 1955-2011. The layer effective diffusivities used in the model simulations are shown in the inset.
In the second case (CASE II), we add the observed history of El Nino and La Nina activity (from the Multivariate ENSO Index, or MEI) as a change in ocean mixing alone. Basically, using the ocean temperature vs. MEI variations as a guide, we warm the top 100 m of ocean and cool the 100-200 m layer by exactly offsetting amounts, thus conserving thermal energy, in proportion to the strength of El Nino activity. The opposite is done for La Nina activity. Case II leads to a slightly lower climate sensitivity, 2.0 deg. C.
But the third case (CASE III) is the one we were really interested in, because it addresses the debate we have with Andy Dessler over the role of cloud variations associated with El Nino and La Nina. I maintain that the global atmospheric circulations associated with El Nino lead to a slight reduction in global albedo, and so a portion of El Nino warming is actually due to radiative warming of the system, not just a temporary reduction in upwelling of colder water.
In other words, in addition to the model specified feedback parameter (climate sensitivity) which determines how much radiative energy is lost by the Earth to space in response to warming, we also allow the model to change the Earth’s radiative balance preceding warming (or cooling) due to El Nino (or La Nina). The time lead or lag of this “internal radiative forcing” is adjustable, and the model “decides” the best match to the observations.
The observations we use to help guide the model fit is the CERES-observed changes in the global oceanic radiative budget since March 2000. The lag regression plot of these changes in Earth’s radiative budget versus HadSST2 sea surface temperatures shows that only when we include the “internal radiative forcing” aspect of ENSO does the model behavior show the lead-lag behavior seen in the satellite observations:
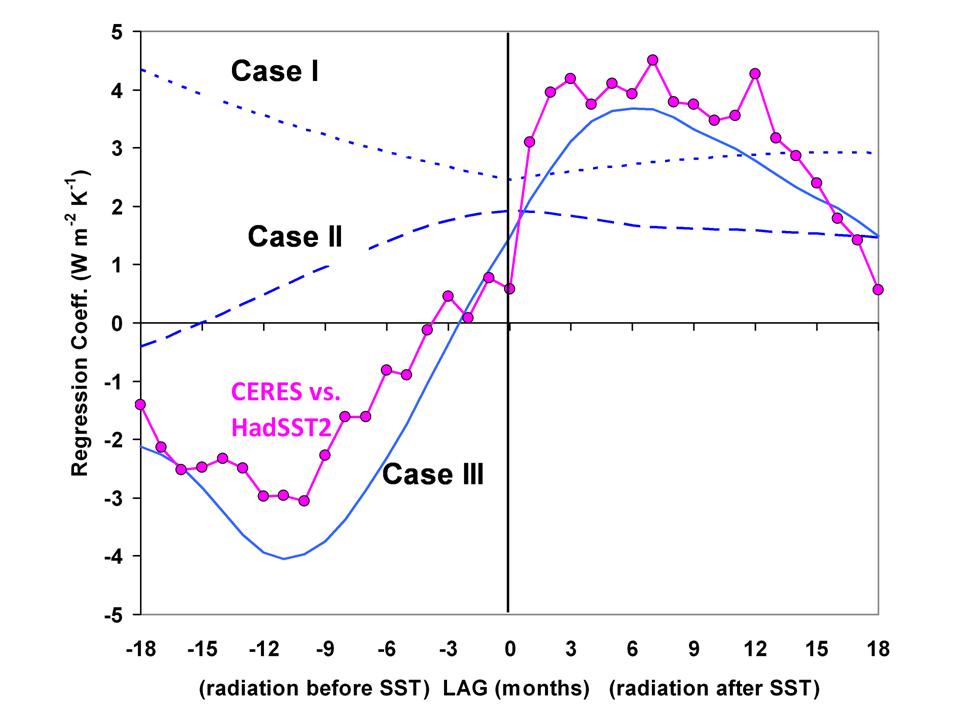
Lag regression coefficients between monthly CERES radiative fluxes and HadSST2 sea surface temperature variations, and compared to the three model simulations
Significantly, when the natural radiative warming effect of El Nino is included, the climate sensitivity is reduced substantially — to 1.3 deg. C.
Basically, a portion of El Nino warming is radiatively forced, probably due to a decrease in low clouds allowing more sunlight in, with the model choosing a 9 month average time lag of the cloud changes preceding the ENSO activity changes.
So, when the Earth went through a ~30 year period of more intense El Nino activity after the mid 1970s, a portion of the warming we experienced was caused by the more frequent El Nino activity. (Although not in the paper, we also found that the model explains the warming before 1940 as a response to stronger El Nino activity back then, as well as the slight cooling from the 1940s to the 1970s from stronger La Nina activity).
Here’s the model response by year for the three Cases, for the 0-50m layer ocean temperature (note how stronger La Ninas explain the lack of recent warming, Case III vs. Case I):
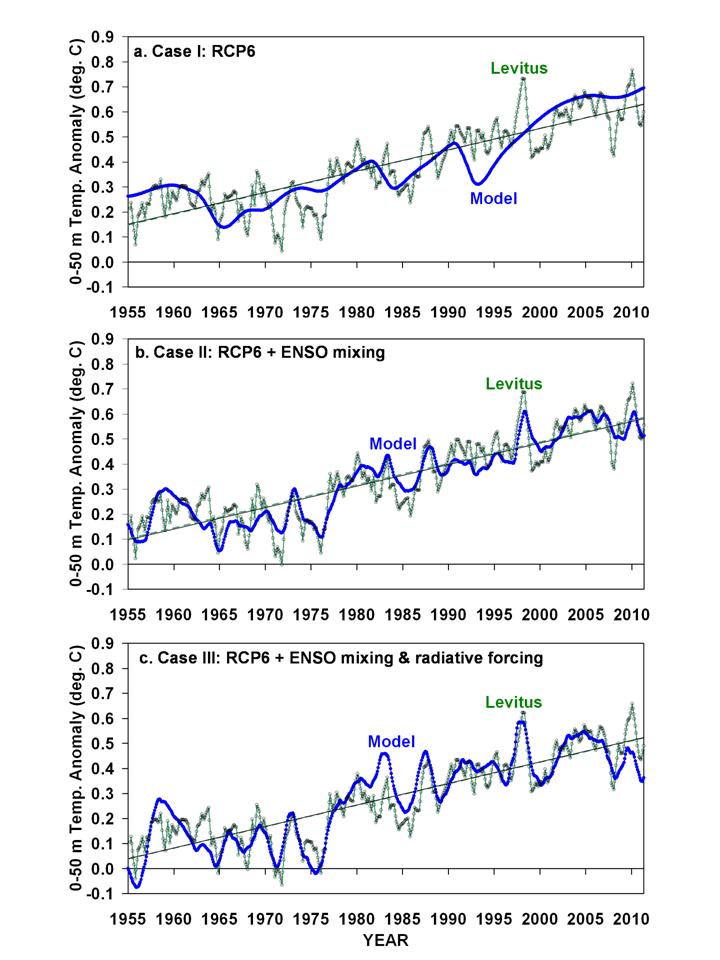
Model simulations of monthly global average 0-50 m layer ocean temperature variations for three cases: (a) only RCP6 radiative forcings; (b) RCP6 plus ENSO-related non-radiative forcing (ocean mixing); and (c) RCP6 plus ENSO-related radiative and non-radiative forcings.
This ENSO-climate change connection has, of course, been hypothesized by others. What we have done is to provide a stronger physically-based framework for quantifying that connection. For example, we find that 1 unit of MEI index (which is 1 standard deviation in the El Nino direction) causes a 0.6 W/m2 of radiative forcing of the climate system.
Again, the model only reproduces the CERES satellite-observed behavior when the radiative budget changes precede the El Nino and La Nina activity, suggesting a cause-and-effect connection. And when that is included, the optimum climate sensitivity chosen by the model is considerably below what the IPCC claims is reasonable for expected warming in our future.
Some of you might recall that Andy Dessler tried to get me to admit that my position was equivalent to saying that “clouds cause El Nino”, which would be inaccurate. What I am saying is that El Nino is associated with changes in Earth’s radiative balance which are not just a feedback response to surface warming, but also force some of that warming. When that “internal radiative forcing” effect is included, optimizing the agreement with 10 years of satellite radiative budget measurements, it considerably reduces the diagnosed sensitivity of the climate system.
In simple terms, the climate system is chaotic, capable of causing global warming (or cooling) all by itself. There probably is no magical normal average albedo, keeping the same amount of sunlight coming in to the climate system year after year. As I keep reminding people, the increase in ocean heat content over the last 50 years is equivalent to a 1 part in 1,000 change in average radiative energy flows. Do we really think nature cannot cause such small changes all by itself?
There needs to be more studies of this type, and I am at a loss to explain why they haven’t been performed. They are relatively easy, and don’t require a marching army of climate modelers. Yet, I will tell you that it is virtually impossible for someone like me to get a proposal specifically funded to perform such a study, because a few gatekeepers in the science community make sure during the peer review process that it doesn’t happen. Instead, we have to piggy-back on other funded projects we have.
I would hope that a simple model like the one we used can help guide the development of the more sophisticated, 3D models. Find a simple, physically-based model that best matches a variety of observations, and add complexity to the model only when it is required to explain observations which the simple model cannot explain.
That’s the way much of science is traditionally done…why not climate science?
Maybe simple modeling studies will gradually emerge from the mainstream climate community, especially with the glaring 15+ year hiatus in warming which is currently being swept under the rug. When they do, I predict it will end up being “their” discovery, not the few skeptics who are working this issue. But I’ve been down this road before, in a previous research life, and I’m OK with that.
Finally, this study leaves open the question of what other natural warming mechanisms there might be out there. We have only addressed ENSO, which alone reduced the diagnosed climate sensitivity in response to increasing CO2 to only 1.3 deg. C, a level I would consider benign or even beneficial. We say nothing about what else might be contributing to warming — I suspect we have already rocked the boat too much.
Thanks, Roy. I was waiting for someone to do exactly what you’ve done.
I haven’t had a chance to look at your post in great detail, but I do have a quick question.(Also asked it at WUWT.) How did you account for the additional mode of natural variability in the North Atlantic, the AMO?
Regards
Roy, now that I’ve digested the post fully, I have the answer to my AMO question.
Regards
Roy, you wrote: “There needs to be more studies of this type…”
I have always suspected that ENSO in the more-complex CMIP3 and CMIP5 models has to be constrained to prevent it from contributing to or suppressing the warming. Thus, the modelers “zero” ENSO skewness, in effect neutering it. It would be a treat to “force” those models with an ENSO signal and watch what they do.
You wrote, “Basically, a portion of El Nino warming is radiatively forced, probably due to a decrease in low clouds allowing more sunlight in…”
There are portions of ENSO that are known to precede the warming of the waters in the eastern equatorial Pacific by a few months, such as trade wind strength in the western tropical Pacific. So a change in cloud cover, preceding the warm water flooding eastward, would also make sense.
Regards
Yes this explains why the climate changes quite well when the climate is in a particular climatic regime.
It does not explain however past abrupt climate change and why this has happened many times in the past.
I will send my two cents worth in my next post.
On second thought I will wait until the Oct. temperature data is released since it would stray to much from this study, Dr. Spencer has done which is excellent.
Thanks, Dr. Spencer. You have done good work to help clarify the role of natural phenomena in climate variations.
Yes, ENSO is a key factor in climate.
Since Beenstock et al and Mora et al have shown that there is no CO2 signal in modern temperature/time graphs, the proper conclusion to come to is that the climate sensitivity of CO2 is indistinguishable from zero. This takes in to account ALL natural variations.
Copied from WUWT:
Roy Spencer said:
“there is more radiant energy coming in during El Nino, about 0.6 W/m2 per unit MEI Index value. Without that, El Nino warmth would just be a near-surface phenomenon (because it coincides with approximately equal cooling in the 100-200 m layer), and incapable of explaining the increase in ocean heat content. ”
Exactly, which is why one needs the cloud reduction first.
That is what led to my emphasis on a top down solar effect to kick start the cloudiness changes as per my New Climate Model which is just a summary of observed events in the correct sequence.
True, the El Nino once in progress will add energy to the air above and in doing so widen the equatorial air masses but one has to stoke up the energy for a strong El Nino in the first place and replace the lost energy when it occurs.
During the late 20th century warming spell more energy was entering the oceans than leaving them despite a string of powerful El Ninos.
Now, less energy is entering the oceans than leaving them despite ENSO neutral conditions.
The current recharge rate is much reduced by increased global cloudiness so the skids are being put under the prospects of strong future El Ninos. If we do get a strong El Nino despite the current low recharge rates the subsequent cooling will be undeniable.
Hope I’m still alive when someone in authority ‘gets’ it.
Stephen, you assume that some one in authority wants to get it… [If my I-phone had a smiley face then I’d insert one here]
How does the rise in sea level due to thermal expansion fit into this? As I understand it, the ocean must be warming overall because there isn’t enough ice melt and aquifer depletion to account for all the sea level rise. So the ocean heat content is not in equilibrium but is rising, no?
Magnificent. Let me have some time to digest it. But at a glance it looks right.
At first glance it looks quite interesting, more work is needed but for sure what is and what was hard to understand is the ipcc confidence in assumptions made in models.
Aren’t you ashamed to try to respect energy budget? Ocean was such a mysterious place before…
“Basically, a portion of El Nino warming is radiatively forced, probably due to a decrease in low clouds allowing more sunlight in”
Is there any evidence that the decrease in low clouds is caused by an increase in sun spots as per Svensmark?
It appears to be linked to solar variability in relation to which sunspots are but one proxy and I suspect cosmic rays merely another.
One needs to be able to change stratosphere temperatures to get the observed climate zone shifts and I don’t see how cosmic rays affecting clouds below the tropopause could do that.
“I suspect we have already rocked the boat too much!”
Heavens no! If scientific accuracy rocks the boat, than that boat needs to be rocked! Some aren’t going to like it, but that is always the case.
Rock on!!!
Roy, congrats on getting it published…FYI
http://www.theaustralian.com.au/opinion/letters/scientists-should-look-beyond-two-climate-paradigms/story-fn558imw-1226757658164
Is there a non-paywalled version of the paper available — perhaps a final draft?
“Finally, this study leaves open the question of what other natural warming mechanisms there might be out there.”
Actually this question has always been there. What we lack is real evidence to show that something other than GHG forcings are the cause of the current warm period.
Wilson wrote:
What we lack is real evidence to show that something other than GHG forcings are the cause of the current warm period.
Perhaps because there is no such evidence.
OH, REALLY? Then what the hell caused global warming a hundred years ago?
.. and is it still causing the warming today?
Dr. Spencer, over at Wattsupwiththat, Mosher is saying that your 1.3C warming is the transitory and not the equilibrium amount, even though you do use the word ‘equilibrium’ in referring to Case I. I assume that also applies to Cases II and III as well.
Can you clarify? Thanks.
To me it seems to be neither what is commonly referred to as the transient or equilibrium climate sensitivity. TCR, or ECR, are *global* (over land + oceans) *surface* temperature responses to changes in forcing before, or after, surface layers of the oceans have warmed, respectively. But the sensitivity figure derived by Spencer seems to be the actual response of the top ocean layer (0m to 50m). This only seems to be close to the sea surface component or TCR. It neglects the fact that warming over land has been much larger. It is also lower than ECR, of course. Land temperature equilibrates to changes in forcing much faster than sea surface (or the top oceans layer) does. So, there seems to be an invalid comparison when Spencer’s figure is claimed to be lower than the commonly cited 2°C for TCR.
I meant to type TCS and ECS rather than TCR and ECR. I was thinking “response” rather than “sensitivity”.
Also …This only seems to be close to the sea surface component *of* TCS…
O.T. Dr. Spencer on CNN
(3 minutes) I found it a bit frustrating to watch.
http://www.cnn.com/video/data/2.0/video/bestoftv/2013/11/12/exp-pmt-roy-spencer-mark-hertsgaard-climate-debate.cnn.html
I began to watch this segment, but the violence of the interviewer quickly made me feel sick and I didn’t watch it further. That Dr Spencer stuck it through with him is a miracle.
Interesting in the context of the permanent el niño state that has been suggested as a mechanism to explain elevated temperatures in the Pliocene relative to the modern even though most climate drivers are thought to have been similar as today (Pliocene paradox). The permanent el niño is controversial but there is isotopic evidence for it…perhaps this model would have a role in that line of climate research as part of the mechanism for elevated temperatures.
I am wondering – When IS the October number going to appear?
The essence of the paper seems to be:
“Mad Dogs and Englishmen (and the Pacific) go out in the midday Sun!” Doesn’t fit the AGW tune, however.
The October numbers appeared a few minutes later.
Spooky.
A simple question, possibly addressed before: This is an Asian journal, so did you try to publish it here? I am wondering if peer review / gatekeeping was a factor, forcing you overseas.
Great. Most admirable.
But still I would like to see the lag regression coefficients plotted over many years, not just the 24 and 18 months that are shown in the paper.
For these coefficients really to tell us about direct causal linkage, as distinct from lagged correlation, perhaps with some quasi-periodic phenomenon, then we need their values to tend to and stay near zero as the lags in both senses grow longer. The MEI seems itself quasi-periodic. That makes it hard to interpret the lag regression plots. The fully fitted 1-D models as shown in Figure 6 are more informative.
”assuming it is real and accurate”
that’s the question: http://globalwarmingdenier.wordpress.com/sea-rising-or-not/
Roy Spencer writes;
The first few columns of Table 9.5 from AR5 here;
http://www.friendsofscience.org/assets/documents/CanESM/Table9.5_AR5.jpg
shows the mean equilibrium climate sensitivity for double CO2 of the 30 climate models evaluated by the IPCC is 3.2 deg. Celsius.
Well, 2.2 C is only 69% of the model mean of 3.2 C. I would say that is a lot below, not “somewhat below”, the average of the IPCC models.
All the senior IPCC scientist are adamant that cloud cover can only change in response to a temperature change, that is, they only changes as a feedback response. This paper shows that clouds change before a temperature change, so act as a forcing agent. This is an extremely important result.
The ENSO process causes clouds to change, causing a temperature change.
“this study leaves open the question of what other natural warming mechanisms there might be out there.”
Roy, cosmic rays could account for 0.47 C of the warming last century according to this paper by physicist Nir Shaviv.
http://www.eike-klima-energie.eu/uploads/media/Shaviv.pdf
Undoubtedly some portion of warming since 1950 is due to modern solar grand maximum which appears to have ended a decade ago. Consensus belief is that since insolation only increased 0.1% during the maximum that tiny amount of forcing doesn’t explain much. However we now know there’s a great deal more than 0.1% change in how the power is distributed across the solar spectrum with power in the ultraviolet waxing and waning 6% from maximum to minimum. This changes the vertical distribution of power absorbed in the atmosphere since most UV is absorbed in the stratospheric ozone layer. I have no idea how the mechanism might work to effect surface temperature except to note that solar grand minimums such as the Dalton and Maunder are historically associated with global cooling at least in northern Europe where records of both sunspots and temperature go back 400 years.
re; El Nino reduces albedo through cloud reduction.
That handily explains the few years following the 1998 mother of all El Ninos where global average temperature stair-stepped about 0.4C higher then stopped.
Dig it:
http://www.drroyspencer.com/wp-content/uploads/UAH_LT_1979_thru_October_2013_v5.6.png
From 1997 to 1998 GAT spiked 0.5C upward then by 1999 dropped back down to exactly where it started. One might think from that it was a wash but, mysteriously, in 2000 GAT started to climb and by 2002 had risen 0.3C then leveled off and hasn’t gone up any more in 11 years and counting.
I had suspected the delay and stair-step was a pulse of warm water in the tropical Pacific making its way along the conveyor belt to the Arctic ocean where it changed the dynamics there by going into latent heat of fusion in the sea ice. The transit time is about right at 18 months for the conveyor belt speed from tropical Pacific to Arctic ocean.
I further suspected that a reduction in Arctic sea ice cover initially raises GAT by exposing liquid water (near freezing) at the surface instead of sea ice that’s well below freezing. This then is self-stabilizing at a new, higher GAT because the open ocean loses heat a lot faster than when it has an insulating layer of ice over the top of it.
So I’m still leaning away from a change in cloud cover as transport time along the conveyor belt is such a good fit for lag between El Nino and when the stair-step in GAT began. You can also observe the reduction in sea ice cover beginning about 18 months after the El Nino. I would think that El Nino causing a change in cloud cover would not have the observed delay of about 18 months but I suppose vertical transport of OHC could cause a lag that’s coincidently the same length of time as the conveyor belt transport time.
Dr. Spencer et al,
Please consider preparing a simple (enough that laymen like myself and politicians can understand) presentation of this study that ties into your 4 June article “EPIC FAIL”.
In your previous presentations and your Senate testimony you attribute the major disagreement between the IPCC modes and observations being due to “global warming response to increasing CO2 is not being amplified by water vapor increases”.
Can you show us laymen how this El Nino study ties into the temperature observations and water vapor effect.
I believe that I have made some headway with my congressman and that he might take some initiateive if I continue to push. A further simple presentation would sure help.
If you can show to me and him how you get 1.3 degrees C and how it is benign or even beneficial; I think we have a winner.
Roy
If you used the whole depth of the oceans would this further reduce climate sensitivity in case III?
Regards
Rob
Anyone find a non-pay link yet?
RW, I have not found a non-pay link of this RS’s paper. (I have not read RS’s deduction of climate sensitivity 1.3 value so I cannot critisize).
I shall suggest you to read my pdf on climate change:
https://docs.google.com/file/d/0B4r_7eooq1u2VHpYemRBV3FQRjA
where all references in there are for free downloading.
In fact, anyone can understand the main issues of climate change theories without spending a single dollar.
Great article. I agree with you about simple models. I have thought before about trying to use SPICE models for electronic circuits to make a climate model. I bet it would be easy to reproduce the IPPC models. All inputs but CO2 damped way down, voila!
One question does earth’s radiative budget = TOA Energy Out – In?
Which other natural climate drivers? The answer in:
http://www.knowledgeminer.eu/eoo_paper.html
The paper demonstrates 5 macrodrivers over a 20,000 year time span, all five of them govern exclusively global warming and cooling…..JS The answer is therefore clear.
Great line up. We will be linking to this great article on our site. Keep up the good writing.
Fantastic website. Plenty of useful info here. I am sending it to some friends are also sharing in delicious. And naturally, thanks to your effort!