UAH Global Temperature Update for January 2014: +0.29 deg. C

February 5th, 2014 by Roy W. Spencer, Ph. D.

The Version 5.6 global average lower tropospheric temperature (LT) anomaly for January, 2014 is +0.29 deg. C, little changed from December (click for full size version):
UAH_LT_1979_thru_January_2014_v5.6

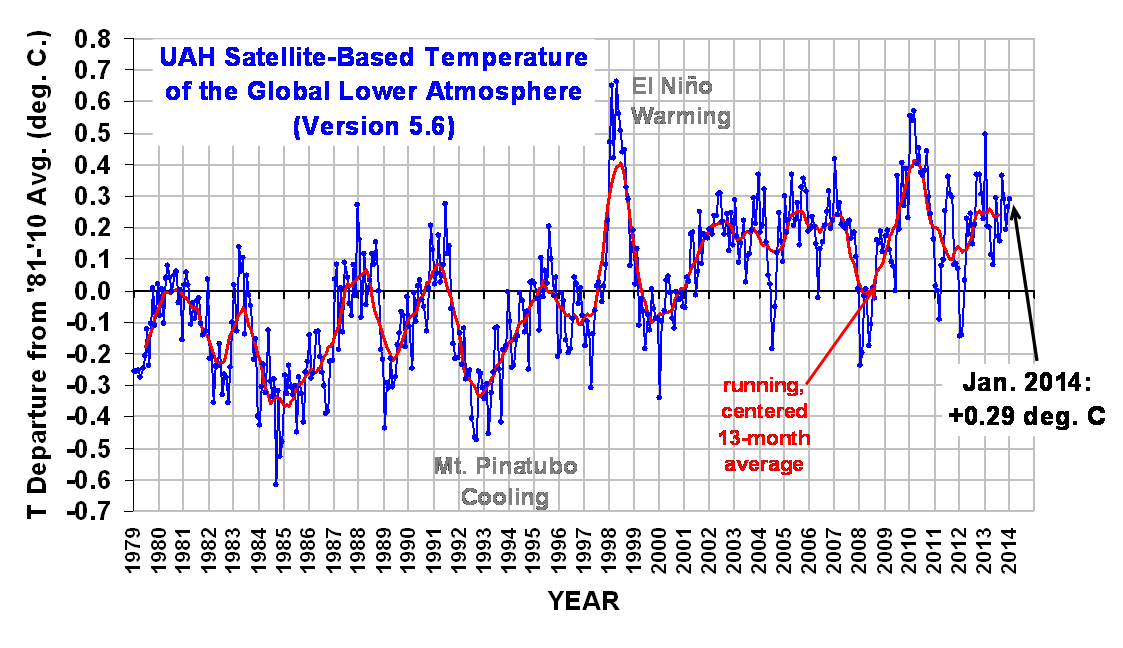
The global, hemispheric, and tropical LT anomalies from the 30-year (1981-2010) average for the last 13 months are:

YR MON GLOBAL NH SH TROPICS
2013 1 +0.497 +0.517 +0.478 +0.386
2013 2 +0.203 +0.372 +0.033 +0.195
2013 3 +0.200 +0.333 +0.067 +0.243
2013 4 +0.114 +0.128 +0.101 +0.165
2013 5 +0.082 +0.180 -0.015 +0.112
2013 6 +0.295 +0.335 +0.255 +0.220
2013 7 +0.173 +0.134 +0.211 +0.074
2013 8 +0.158 +0.111 +0.206 +0.009
2013 9 +0.365 +0.339 +0.390 +0.190
2013 10 +0.290 +0.331 +0.249 +0.031
2013 11 +0.193 +0.160 +0.226 +0.020
2013 12 +0.266 +0.272 +0.260 +0.057
2014 1 +0.291 +0.386 +0.196 -0.027

The global image for January should be available in the next day or so here.

Popular monthly data files (these might take a few days to update):

uahncdc_lt_5.6.txt (Lower Troposphere)
uahncdc_mt_5.6.txt (Mid-Troposphere)
uahncdc_ls_5.6.txt (Lower Stratosphere)


219 Responses to “UAH Global Temperature Update for January 2014: +0.29 deg. C”

Toggle Trackbacks

  1. RW says:

    Thanks for the report.

  2. Jim Cripwell says:

    Looks like the cessation in the rise of global temperatures is continuing.

    • Kristian says:

      What do you mean? UAH shows a continuing distinct upward trend since the early 2000s. The trend ’01-’14 is just as steep as the trend ’79-’97.

      • DWM says:

        Egad Kristian, temps have been fluctuating with a 1 degree band since 1997. How on earth can you see this as a “distinct upward trend”?

        • David A. says:

          Because statistical tests on the time series shows there is a distinct, statistically significant upward trend, over the last 15 years and over the entire dataset.

          • Cupsui says:

            once again people only see what they want…

            so they find people (this website) that manipulate the data in the ways they want it to be represented.

            So big influence this cold north american winter has made hey Dr Spencer

      • Gordon Robertson says:

        ’79-’97 was a recovery from cooling. The anomalies are mainly negative.

        If you look at the red running average from 2002-2007 it is bracketed at the lower end of the 0.2-0.3C range. The cooling in 2008 offsets the El Nino peak of 2010 and the cooling in 2000 more than offsets the El Nino peak in ’97-’98.

        From 2011 till present there are two lesser humps that offset. You can see visually that the trend is flat as a pancake. Furthermore, the IPCC has admitted in AR5 that the warming trend since 1998 has been 0.05C/decade.

        That’s if you accept the surface stations that cover about 30% of the planet and which have been fudged and homogenized by alarmists. I don’t.

        The question arises as to what caused the sudden rise in 2002 into the 0.2-0.3 C bracket? Anthropogenic CO2 could not do that and it looks like a residual from the ’98 El Nino. That often happens in harmonic systems, not that I am claiming warming is that kind of system.

        Apparently there was a similar rise of about 0.2 C circa 1977 when the Pacific Decadal Oscillation changed phase. That would mean that natural processes have accounted for nearly half the warming over a century.

    • David A. says:

      Cessation? The current 5-year period is the warmest in UAH’s history.

      • JJ says:

        That’s what happens at a peak.

        UAH is flat for the last decade, and trending downward for the last five.

        That is also what happens at a peak.

        Huh. Whatya know.

      • fonzie says:

        david, i concur… the last couple years have shown that the peaks are no higher but the troughs aren’t quite as low. let’s hope dr roy’s data set is right (as opposed to rss); putting up with al gore’s mouth is a small price to pay for warmer temps…

      • David A. says:

        You have to strain pretty hard to see a peak in this graph:

        http://davidappell.blogspot.com/2014/02/uah-last-5-years-still-warmest.html

        Nor is a peak expected on theoretical grounds.

        • fonzie says:

          david, what is that and how come it doesn’t look like dr roy’s graph here? thanks much…

          • David A. says:

            It’s what it’s labeled to be: the 5-year moving average.

          • David A. says:

            JJ, it’s a fact that the last 5 years (60 months) have been the warmest in UAH LT’s history. And that’s been true for several months now.

            Or are you going to deny even arithmetic now?

          • Tony Sullivan says:

            A year or so ago questions were raised about the accuracy of the satellites recording the data. We were told at that time that yes, there did seem to be a bias on the warm side,perhaps of 0.2 degrees, and that a study was in process to readjust for that bias. Was that study undertaken and what was the result?

          • Cupsui says:

            its because Dr Spencer chooses a 13 month rolling average, which is too short to show decent longer term trends. hence its ridiculous up and downs

        • JJ says:

          “You have to strain pretty hard to see a peak in this graph:”

          Anyone who can stomach making “last 5 years still the warmest” type arguments should have no problem pulling it off, if they can get past their political bias. Evidently you can’t.

          “Nor is a peak expected on theoretical grounds.”

          Which theory is that, exactly? The one that failed to expect the flat temps that are 0.3 to 0.5C below where the scary story telling men said they’d be?

          Or do you have some other failed theory to which you’d like to appeal?

          • David A. says:

            Which theory is that, exactly? The one that failed to expect the flat temps that are 0.3 to 0.5C below where the scary story telling men said they’d be?

            The theory of the enhanced greenhouse effect, of course.

            That theory is not going to go away, ever. CO2 is a greenhouse gas. Like a lot of contrarians, you seem to think that if surface temperatures don’t track projections precisely that theory must be rejected. That’s not how the science works — there are simply too many other uncertainties in the picture to explain the differences, and the radiative effect of GHGs is too well known — it’s actually the best part of climate science — and too much other evidence for it.

            Of course, there are uncertainties in the exact value of climate sensitivity, and how the extra heat will be distributed among the different planetary systems (on both a short-term and long-term basis). And there are questions even about whether the data is right.

            But nothing happening today — and especially not short-term fluctuations — casts any doubt on enhanced greenhouse warming. It is a fact, solidly proven by the science of the last 100 years.

          • JohnKl says:

            Hello David A,

            You claimed:

            “The theory of the enhanced greenhouse effect, of course.

            “That theory is not going to go away, ever.”

            “But nothing happening today — and especially not short-term fluctuations — casts any doubt on enhanced greenhouse warming. It is a fact, solidly proven by the science of the last 100 years.”

            Hmmh! If it’s a FACT, why do you still call it a THEORY? Personally, I have no problem with the theory being true. Hopefully, it is we could use the warmth. Please let me know when you personally observed the green-house effect take place and precisely what you observed (not read).

            Have a great day!

          • JJ says:

            David A. says:

            The theory of the enhanced greenhouse effect, of course.

            That theory is not going to go away, ever.

            That removes it from the realm of science, sweetie.

            CO2 is a greenhouse gas.

            Your failed ‘theory’ has a lot more in it than that. And the sum total of all of it is simply wrong, and has been demonstrated as such.

            There exists no coherent theory of climate. That may change, but I doubt that it will come in our lifetimes.

            Like a lot of contrarians, you seem to think that if surface temperatures don’t track projections precisely that theory must be rejected. That’s not how the science works —,

            Yeah sweetie, it is. The theory of climate embodied in the current models is wrong. Period. Even IPCC won’t front it anymore.

            – there are simply too many other uncertainties in the picture to explain the differences,

            And you people have the nerve rag on Roy for his religion.

            and the radiative effect of GHGs is too well known —

            The net effect of that on the massively multivariate system that is the earth’s climate is not.

            it’s actually the best part of climate science — and too much other evidence for it.

            Agreed. The rest of it isn’t known for shit, but that part is a better guess.

            Of course, there are uncertainties in the exact value of climate sensitivity,

            Quit equivocating. Climate sensitivity IS your theory. Specifically, obnoxiously high climate sensitivity. And that summation of your ad hoc ‘theory’ isn’t uncertainty, it is abject ignorance. The only thing we know about the value of climate sensitivity to CO2 is that it is a fraction of what you political hacks claim it is. IPCC is too scared to even put their name to a guess at what it is, because they know the only two alternatives they have are 1) Too low to be scary and 2) Too high to be anything other than embarrassingly incorrect.

            and how the extra heat will be distributed among the different planetary systems (on both a short-term and long-term basis). And there are questions even about whether the data is right.

            Yeah, you remain non-committal on everything except the politically necessary conclusion. That way you can ad hoc claim everything that happens is proof of global warming. You don’t have a theory, you have an unfalsifyable conclusion.

            But nothing happening today — and especially not short-term fluctuations —

            Sweetheart, short term fluctuation is all you’ve got. Hoist by your own petarded tactic.

          • David A. says:

            If it’s a FACT, why do you still call it a THEORY?

            “Theory” simply means body of knowledge — as in the theory of evolution, the theory of special relativity, the theory of quantum electrodynamics, etc…..

          • David A. says:

            Please let me know when you personally observed the green-house effect take place and precisely what you observed (not read)

            I’ve never personally observed a quark either, but I know they exist.

            Or are you taking Ken Ham’s view of reality?

          • JohnKl says:

            Hi David,

            You assert without reason:

            ““Theory” simply means body of knowledge — as in the theory of evolution, the theory of special relativity, the theory of quantum electrodynamics, etc…..”

            On your website you claim academic training but have no clue regarding the very words you use. A theory is not a body of knowledge it is a conjecture (akin to a hypothesis) intending to explain a given body of knowledge (aka. facts and laws of nature).

            As to the sundry theories you list you truly need help. You may wish to review Darwin’s own letters regarding the Theory of Evolution in which he claimed no evidence (factual basis) existed proving one species ever evolved into another.

            “Science is organized common sense where many a beautiful theory was killed by an ugly fact.” – Thomas Huxley

            Have a great day!

            P.S. – A body of knowledge (aka facts, laws of nature) comprises SCIENCE, not theory!

        • JJ says:

          David A. says:

          JJ, it’s a fact that the last 5 years (60 months) have been the warmest in UAH LT’s history. And that’s been true for several months now.

          Yes, that exactly is the sort of lame-ass, innumerate, anti-scientific type of argument of yours to which I was referring.

          • DocRichard says:

            Hi David,

            It strikes me that many of our friends here have a very similar perception problem to that experienced by people with anorexia nervosa. It is well known that anorectics standing in front of an adjustable mirror, asked to adjust their reflection until it accurately represent their body form, will adjust it until the image is far wider (fatter) than it in fact is. In other words, the surface of the mirror facing the subject ends up not planar, but concave.
            In the same way, our friends here are actually *unable* to see that Roy’s graph, and your 5 year moving average, has an upward trend.

            I am uncomfortably aware that this contribution is going to provoke a certain amount of anger. The same happens if you point out to anorectics that they have distorted the mirror.

            You also get a torrent of rationalization from anorectics. You can show that their body weight is in the lowest percentile of the charts, and they will challenge the “normality” that the charts express, and so on.

            The debate with anorectics is infinite. It must be continued, in an effort to undermine the cognitive errors that are part of the condition, but the turning point usually comes only when they realise their life is threatened. In the same way, our politicians will cease to be swayed by the delayers only when it is blindingly obvious that we are getting 100-year weather events every few months, and that storm damage repair &c is beginning to undermine the economy.

          • JohnKl says:

            Hello Doc(Holiday)Richards,

            Your blog site asserts:

            “Solutions-oriented commentary on politics and economics from a longstanding Green Party activist. Warning: This blog may contain traces of irony.”

            Fairly minute traces of irony to be sure, and the “SOLUTIONS” plainly seemed to be few if any as well. Sure you suggested government spending on projects supposedly designed to reduce “flooding”, not exactly a new problem or phenomenon and possibly other plans to mitigate damage or even run/migrate from certain areas of Britain and/or the U.K. should some unimaginable climate catastrophe occur. Notably absent was any real suggestion of how exactly you plan to induce 7 billion people on this orb to reduce their carbon emissions to levels you find palatable. Since apparently atmospheric carbon levels have increased since the 19th century, to halt or reverse current emissions seems to require the VOLUNTARY support of a lot of people with many different values than your own.

            Apparently frustrated that you lack any real solution you lament:

            “The debate with anorectics is infinite. It must be continued, in an effort to undermine the cognitive errors that are part of the condition, but the turning point usually comes only when they realise their life is threatened.”

            Hmmh! Your point appears more telling than you realize. Your not having a Ted Kaczynski moment are you? You then conclude:

            “In the same way, our politicians will cease to be swayed by the delayers only when it is blindingly obvious that we are getting 100-year weather events every few months, and that storm damage repair &c is beginning to undermine the economy.”

            So you conclude with vague climate disaster predictions that may somehow spur politicians to some ill-defined CLIMATE SOLUTION. Perhaps you mean something like the Galveston sea wall built to protect inhabitants after the worst storm in U.S. history that notably occurred in the 19TH CENTURY! Or more likely you mean some ecologically meaningless government confiscation of financial assets like the KYOTO PROTOCOLS and/or various sundry IPCC regs and rules (like kicking African tribesman off their land for some vague ill-defined climate goal) in order to buy political favors and simultaneously do absolutely nothing to solve any problem except the financial designs of a few plutocrats.

            You seem to believe for some ill-defined reason that people cannot believe the world is warming. Personally I think it’s time to leave the current ICE-AGE. It seems hilarious for me to watch the CAGW community of the supposedly panic ridden, clamorously scared the permafrost might end, ready to confiscate everyone else’s resources and yet objectively having no plan or idea as to how do anything about atmospheric CO2 levels all the while apparently completely indifferent to the real and many environmental mischief (Oh! I don’t know say desertification due to poor land management or Fukishima) that occurs everyday. The only real anorexic condition seems to be your ever thinning rational hold on the ever present world we live in.

            Have a great day!

      • Gordon Robertson says:

        @David A “The current 5-year period is the warmest in UAH’s history”.

        Actually, the past 15 years. Since 1998 the average has never risen more than about 0.25C over the 30 year average. It’s sitting there right now.

        That 0.25 C average ‘true’ warming happened all at once, circa 2001. That is not the signature of AGW, to have a sudden spurt then nothing for a decade or more.

        • David A. says:

          In the last 15 years, UAH LT has warmed 0.22 C, if you take “warming” to be the usual slope*interval.

          It gives 0.28 C of warming in 20 years, and 0.52 C of warming in 30 years.

          • JJ says:

            David A. says:

            In the last 15 years, UAH LT has warmed 0.22 C, if you take “warming” to be the usual slope*interval.

            In the last 16 years, UAH LT has warmed 0.09 C, if you take “warming” to be the usual slope*interval.

            It gives 0.28 C of warming in 20 years, and 0.52 C of warming in 30 years.

            Wow! The warming has dropped from 0.43C for the first fourteen years of that interval, to only 0.09C for the last sixteen years!

            The amount of warming has dropped by 95%!! While the amount of anthropocene CO2 went up by 35%. Just like ‘global warming’ theory predicted! Oh, wait…

          • David A. says:

            Your math is bad. You can’t simply subtract these warming numbers; you need to compute the slope*interval for each one individually.

          • Gordon Robertson says:

            @David A “In the last 15 years, UAH LT has warmed 0.22 C…”

            If you look at the graph, the warming spurt of 0.2C+ happened all in one year….2001.

            I don’t see how anyone can apply meaningful statistical analysis to the 33 years of UAH data given the various contexts involved. When statistics are applied, the context must be specified. For example, it must be specified that the initial negative anomalies were influenced by aerosol cooling and the warming spurts caused by El Ninos.

            The El Nino spike in 1997 started it all and that was followed by a cooling. Then the warming spurt followed, going to a flat trend almost immediately. If you average everything out over 15 years, the trend is flat.

            The details are covered in the UAH 30 years report. You have to read the entire report to get the details:

            http://vortex.nsstc.uah.edu/climate/2011/November/Nov2011GTR.pdf

          • David A. says:

            The El Nino spike in 1997 started it all and that was followed by a cooling.

            Your classic cherry pick — picking a starting year because it gives the result you want.

            THanks for a better demonstration than I could have provided.

  3. Helge Drange says:

    Looks like an El Niño – whenever it may occur – will lead to record-high temperatures.

    • Joe Freeman says:

      Looks like you’re grasping at straws – wherever you might find them.

      • Hops says:

        If you look at chart of global average temperatures, there used to be times when it went down.

        Flat is the new down.

        When was the last time we saw a string of negative numbers and some reversion to the mean?

        • Ansgar John says:

          Hops, It seems to me that global temperatures are increasing, there´s plenty of evidence of that. The questions are:

          1. Are they increasing mainly because of CO2 ?

          2. How quickly are they increasing and will they increase in the future?
          http://www.theclimatebet.com/gore.png

          3. Is it a bad thing for plant life on the planet if becomes warmer and there is more CO2 to feed on? (Colder and less CO2 wouldn’t seem to be an improvement).

          • Hops says:

            1. Yes.
            2. You can put Dr Spencer’s data in Excel and plot a trend line for various time periods. I get 0.15C per decade or so since 2000.
            3. CO2 will increase some plant growth in some places, but other factors like water will limit it; otherwise, the plants would just suck up all the CO2 and it would not be rising past 400 ppm.

            As for warming, ask the farmers in California how the warming thing is working for their plant life.

          • Kristian says:

            Hops says, February 5, 2014 at 12:07 PM:

            “2. You can put Dr Spencer’s data in Excel and plot a trend line for various time periods. I get 0.15C per decade or so since 2000.”

            Well, it’s a bit unfair to start the trendline in 2000. But even if we pick 2001 as the starting point, you’re right – UAH boasts a significant warming trend:
            http://woodfortrees.org/plot/uah/from:2001/plot/uah/from:2001/trend

            (And remember, this plot is of their version 5.5, not 5.6, and Jan’14 is not included.)

          • Kristian says:

            Dr. Spencer: Wouldn’t it be nice if you and Christy at some point explained us why exactly you’re right about the evolution in global temperatures since the early 2000s (distinct warming), while all the others are wrong (flat (GISS, NCDC, HadCRUt4) or cooling (HadCRUt3, RSS)?

          • Kristian says:

            Here are the trendlines ’79-’97 and ’01-’13 compared.

            GISS:
            http://woodfortrees.org/plot/gistemp/from:1979/to:1997.5/trend/plot/gistemp/from:2001.5/trend
            (First one fairly steep, second one flat or ever so slightly down.)

            HadCRUt4:
            http://woodfortrees.org/plot/hadcrut4gl/from:1979/to:1997.5/trend/plot/hadcrut4gl/from:2001.5/trend
            (First one fairly steep, second one slightly down.)

            HadCRUt3:
            http://woodfortrees.org/plot/hadcrut3gl/from:1979/to:1997.5/trend/plot/hadcrut3gl/from:2001.5/trend
            (First one fairly steep, second one distinctly down.)

          • Kristian says:

            RSS:
            http://woodfortrees.org/plot/rss/from:1979/to:1997.5/trend/plot/rss/from:2001.5/trend
            (First one fairly steep up, second one fairly steep down.)

            UAH:
            http://woodfortrees.org/plot/uah/from:1979/to:1997.5/trend/plot/uah/from:2001.5/trend
            (First one distinctly up, but not very steep, second one also distinctly up.)

          • Kristian says:

            GISS is just adjusting up, up, up (that’s the name of their game) and still they can’t get an upward trend.

            You, however, manage just fine. And at the same time, your ’79-’97 trend is distinctly more gentle than all the others’, which are quite similar to each other.

            Coincidence?

          • Kristian says:

            Just lift your midsection (1992-2005/06) by 0.06 degrees and everything’s fine …

          • Kristian says:

            http://woodfortrees.org/plot/uah/to:1992/plot/uah/from:1992/to:2005.67/offset:0.06/plot/uah/from:2005.67

            As you’ll see, you need do nothing about the starting and end sections. The ‘problem’ lies in the section in between. It is too low. Like it’s slightly caved in. Compared to the other global datasets out there (sea, land, troposphere).

          • JJ says:

            Hops says:

            2. You can put Dr Spencer’s data in Excel and plot a trend line for various time periods. I get 0.15C per decade or so since 2000.

            Then you’re doing it wrong. You’re too high by almost 40%.

            3. CO2 will increase some plant growth in some places, but other factors like water will limit it;

            Higher CO2 increase drought tolerance in plants. They don’t need to keep their stomata open for as much of the day to get their food, so they transpire less water.

            As for warming, ask the farmers in California how the warming thing is working for their plant life.

            The drought in California is due to cool temperatures, not warm ones. Drought in California is caused by cool Pacific (La Nina) temperatures. During warm Pacific temperature periods (El Nino), California gets drenched.

            “Global warming” theory predicts more El Nino (warmer, wetter) conditions for California. The drought is California is evidence against “global warming”, not for it.

            If global warming were actually happening, California wouldn’t be in drought, and you wouldn’t have to lie about the trend to pretend it was happening.

          • Cupsui says:

            Once again another tedious debate about how to manipulate data so it best shows things the way people want to see them…

            but what should we expect. this website is not about science its about ways to interpret data

        • An Inquirer says:

          I remember a comment from Spencer/Christy a few years ago: It seems like there was a shift in the mean in about 2002. Before From 1979 to 1997, the cycles seem to fluctuate around a mean that was about about .4 degrees cooler than the mean around which the cylces are now fluctuating. Perhaps an intriguing question: In the earlier time period, there was noticeable (dominating?) influence of major mid-latitiude volcanic eruptions. Such volcanic eruption has been absent for about twenty years. Could that be a key reason for the shift in the mean temperature?

          BTW, thanks to Dr. Spencer for the #s. For his analysis to show an increase in temperature anomalies when his consituents are experiencing colder temperatures speaks well of the integrity of his analysis.

          • ed says:

            Hops
            The california farmers are suffering because
            1) California has been and will continue to be a desert
            2) crops have only been able to be grown there at current levels because politicians rerouted natural water supplies all over the west to allow Los Angelans to sprinkle their lawns twice a day
            3) The “natural” climate in California is drought and if you think this one is bad Scientists understand that California has endured 100 or even 200 year droughts.

            So if you dont want to experience droughts, dont build cities that rely upon an non-normal expectation of precipation to provide sprinkler supplies to tens of millions of people that are living in a desert. Refer also to “Las Vegas”. Thank god midwestern politicians in the early 20th century banded together to prevent the west coast water barons from draining the great lakes.

            Oh by the way, if you build all of Jim Hansen’s nuke plants to minimize co2 you’ll have plenty of power to desalinate drinking water for the west coast. Sorry, but you’ll have to get used to astro-turf lawns just like they have in phoenix.

          • Kristian says:

            The shift occurred in 1998, during the transition between El Niño 1997/98 and La Niña 1998/99. Bob Tisdale has shown this over and over again and he has explained by simply following the data how this happened and where it happened (primarily in the West Pacific/East Indian Ocean and in the North Atlantic basins).

            It’s all process-related.

            There was also a similar shift in 1988, during the transition between El Niño 1987/88 and La Niña 1988/89. All global datasets clearly exhibit this shift. UAH only vaguely, because it sinks in somewhat after 1992. (This is one of the reasons I feel that UAH’s midsection (1992-2005/06) needs to be adjusted up …).

            Apart from the specific course of events that caused the sudden upward shifts in 1988 and 1998, leading to global temperatures not responding fully to the NINO3.4 La Niña signal, global temperatures simply follow NINO3.4 slavishly all the way from 1979 to 2014 (there is of course noise in between, including volcanic impact).

            Well, not so much in UAHgl. It’s tracing below NINO3.4 post 1992, even after the Pinatubo impact. And, significantly, there is definite global warming outside NINO3.4 after 1998/99. It’s the only dataset suggesting it. With the possible exception of the severely tampered-with GISS dataset. (This is one other reason I feel that UAH’s midsection needs to be adjusted up …).

        • crakar24 says:

          Jesus H Christ riding a chariot,

          Hops i used to enjoy reading the comments here because the people that commented were not your average hacks like us, it used to be informative comment but now you come along and treat the place like SKS or some other last bastion of the church of climatology.

          Basically what you are now saying is that AGW is not as bad as first thought because the temps are not rising but it is bad enough to stop the planet getting colder (as per the “flats”).

          I think its time you do what i do and just read the comments from knowledgeable people and learn rather than try and stir up an emotive argument which is the usual standard fair we have come to know from the warmbots.

          Regards

  4. ed says:

    Hops
    I guess the answer to your question is What is the correct mean? I remember having flame wars trying to comment at Unrealclimate when I asked the simple question, “What is the temperature of our planet on this date supposed to be?”. People only compare it to something within recent memory or measurement but this is a warm spell between glacial periods. How do we know that the temperature is abnormal due to CO2? My guess is only by denying the existence of previous warmer times, adjusting recorded temperatures to augment trends that reflect “warming”, picking a period of time to be considered “average” that supports a starting point that would show recent warming and then repeating the mantra climate change, global warming, CO2 over and over again while covering your ears and “stoning” anyone that disagrees with you.

    • Hops says:

      Ed, there is of course no “correct” temperature, but there is a desirable temperature, which would be the one we and all the life on Earth are adapted to.

      Have I stoned anyone who disagrees with me? Anyone out there feeling stoned?

      • Scott Scarborough says:

        I have adapted to -25 F when I lived in Michigan. And I have adapted to +120F when I took a vacation out West. I doubt if + or – 10 degrees on that range would kill me. The temperature has increase,so far, about 1 F in a century and you really want me to be concerned?

        • Hot Potato says:

          No, he just wants your wallet and the next generation’s birthright is all. It’s not too much to ask, is it?

          • alex says:

            No, we should all run for the hills. Its o.29C above average dammit and we are all gonna die if we stay here. Do not hesitate and don’t go inside to get your valuables. Just start running for the hills.

        • bob says:

          “I doubt if + or – 10 degrees on that range would kill me”

          LOL we have skeptics crying about a maunder minimum causing crop failures. How can that be true when the LIA was less than 1C cooler than today?

          You are saying plants in Michigan could survive 10C cooler conditions?

        • bob says:

          Last glacial period global temperature was only about 5 or 6C cooler than present.

          So presumably if the Earth dived into a glacial in less than 100 years everything would be just fine, because…wait for the logic:

          you have adapted to -25 when you lived in michigan and 120F when you took a vacation out West.

          Talk about being a poster boy for why skeptics just don’t understand climate change.

      • ed says:

        Hops
        Define the correct desirable temperature that all life on earth is adapted to. Define the amount temperature can vary from that “desirable” level before all life on earth becomes “mal-adapted”.

        I think Scott hits it out of the park in his comment below. Life adapts and 1-4 degrees is not outside the range life is adapted to on this planet. Life would have become extinct a long time ago if it was unable to adapt to large changes in climate.

        Based on the NCAR web site the “average temp” is 14C. Currently temp is +.29C to that average which is a 2% variation from normal. Why didnt life become extinct when temp varied by more than that over the last few million years? Because life was adapted to survive a wide range of temperatures.

        • NoFreeWind says:

          There is no such thing as “normal”, there may be an average over a period of time, but history shows there is not a normal. Also, it’s absurd to write that a .1C upward trend over 10 years is an upward trend. The instruments and calculations that give us that amount can easily have that amt of error/deviation, and the oceans could swallow or spit that amount out in a matter of a month.

        • bob says:

          “Life adapts and 1-4 degrees is not outside the range life is adapted to on this planet.”

          then how come species boundaries are sensitive to slight changes in average temperature?

          Many species in scotland differ from species in england for example, and the average temperature difference isn’t anywhere near 4C.

        • David A. says:

          What were the time periods over which life supposedly adapted to 1-4 C in the past?

          How does that rate of change compare to today’s?

  5. H.B. Schmidt says:

    Dr. Spencer, has anyone explained the sharp drop-off in UAH global records in 2007-2008 and then the even more dramatic increase from 2008-2010 in terms of global economic output? Economic development is dependent upon energy input (more development = more energy burned) but the financial crisis extended well into 2010 which would mean less CO2 emitted, which would poke a big hole in the idea that CO2 > natural variation. Thanks.

  6. An Inquirer says:

    One fingerprint of AGW is the divergence of temperature trends in the stratosphere versus the troposphere. A cooling stratosphere combined with a warming troposphere would be consistent with the AGW theory where CO2 influence dominates natural variability. However, the stratosphere stopped cooling 20 years ago — at the end of the major mid-latitude volcanic eruptions. Trends in stratospheric and the tropospheric trends are not consistent with the AGW theory.

  7. Once low solar activity establishes itself going forward after the current maximum of solar cycle 24 ends it looks like the temperatures will be heading lower.

  8. Murray Allan says:

    I have little respect for any climate scientists that start climate history at 1880, when the cold trough leading up to that point on earth would beg for natural rebounding. The real warmist deniers don’t want to accept 1450 – 1850.
    Currently, this 15+ year level off evidences the much more minimal effect of man-made CO2. Would this little increase in temperature really be possible based on actual CO2 levels and the models/hysteria that were produced?

    • Hops says:

      Some papers suggest that the cool period was not global but rather limited to Europe. Can you prove otherwise?

      • Jake says:

        Hops, I am commenting on a previous questions you asked.

        In terms of the California drought, recently peer reviewed papers indicate that the Western region of the United States have dealt with dry periods that have lasted well over 100 years over the past two Millennia, prior to a time when man was burning fossil fuels and dumping CO2 into the atmosphere. There is no scientific proof that the rather short dry period in California can be attibuted, to any degree, to global warming.

        I only became interested in the AGW issue after one particular individual stated that the science was settled. Science is never settled, I’ll always except questioning, it’s what makes a scientist a scientist.

        Most people who try to be “scholarly” about this understand that the globe has warmed. Many will admit that CO2 has had some impact. Personally, I find what James Barrante has put forth in terms of Beers Law and negligible impact of CO2 past 400 ppm is compelling. In addition, little is understood about what direction feedbacks, specifically clouds, have on our future global temperatures.

        The science is unsettled, and what I feel offends so many of us who are keeping our minds open is that many of you committed to the “cause” AGW to be Law rather than Theory.

        And my hope is that if we observe a downward trend anytime soon that the public doesn’t lose faith in the scientific community due to a few zealots who forgot how the scientific method operates.

        • ed says:

          I’m with Jake on this. I oly became interested in researching this topic after I saw people being ridiculed for questioning the AGW mantra on UnRealclimate.com and wikipedia. My skepticism has only been confirmed over the last 6 years.

          • Hops says:

            I think Dr. Spencer’s position that the rate of warming is what is up for debate is reasonable. CO2 reflects IR, and that is settled. Only the planet itself can fully compute the rate of warming in the long term, given feedback etc.

            Given ambiguity, then what?

            1. Do you care about future generations?
            2. Do you care about people in the tropics?
            3. Do you think we can fix the climate if we break it?

            My attitude is (1) yes, (2) yes, and (3) definitely not.

            It’s like we’re throwing our kids off a cliff and saying gravity is only a theory.

            I think this “pause” is as temporary as the declines that have happened many times in the past century.

          • Kristian says:

            Hops says, February 5, 2014 at 3:31 PM:

            “CO2 reflects IR, and that is settled.”

            Whoa, hold your horses, there, buddy!

        • NoFreeWind says:

          The Cali drought is very likely the worst of the past century. Plot the Cali precipitation(only available through Jan right now) here http://www.ncdc.noaa.gov/cag/
          and for the past 12 months Cali has the lowest precipitation on record, lenghten the period to 24 months and the drought is not a record and equaled by about 10 other 24 months periods in the past 110 years.
          And can anyone tell me some mechanism where 1 in 20,000 parts of the atmosphere changes from something to CO2 causes a lack of precipitation in one relatively small region, except “everything get screwed up”? If you have the “belief” it shows a distinct lack of logic on your part and an obvious belief system. That’s why we call it a religion.
          Roy has a religion, as do I, and religion is where religion should stay.

          • crakar24 says:

            No free wind,

            Yes but there are a number of differences about those religions.

            1, Roy has his religion and he keeps it to himself, he does not run around trying to push it onto everyone else via taxation and indoctrination.

            2, If you ask Roy for evidence of his religion he may or may not be able to produce any and if he cannot he will freely admit it, he will not defy the laws of logic and commin sense to sell it.

            3, If you enter into a religious debate with Roy i am sure he would maintain his dignity and be polite no matter what.

            I am not a religious person having said that i respect those that do but i have no respect for those that believe in the religion of AGW.

            Regards

            Crakar24

      • Murray Allan says:

        I did not know Europe had not joined earth yet at that time. Are you a denier? Are you denying the earth had a cold period prior to 1880? It does make you look like an opportunist, doesn’t it, claiming fossil fuels came along in 1880 and that was that. Do you own a car?

        • ed says:

          Of more immediate concern about those that care about children is whether you wish to saddle them with trillions of dollar of debt to support an aging population. Why would you want to pile expensive energy costs on top of that?

          For those in the third world, why would you do anything to make energy more expensive to those where a pump to extract clean water or irrigate has such a beneficial impact on the quality of life? I’m not concerned that a few meter rise in sea level is going to inconvenience all the wealthy 1% with ocean front property.

          In terms of generations, a million years worth of humans survived just fine with fluctuations in sea levels and even did pretty well while there was a mile of ice above Chicago. 2C is not going to do jack to threaten humans or any other species on this planet.

          Finally, to assume you can fix climate assumes you know what “normal is”. If you dislike CO2 so much you need to support the James Hansen solution, a massive building program for new nuclear power plants. Solar, wind and anything else are proven jokes and when your butt is freezing in Norway and the wind aint blowing you either burn something or get power from a nuke plant.

          The planet is however already “solving” the CO2 problem. It’s greening the Sahara and crop yields benefit from extra plant food in the air. Let me know how much less food will be grown at 260 ppm of CO2 and whether crop yields could still support our present population at that level.

        • Hops says:

          I’m saying a recent paper concluded the “little ice age” does not appear in proxy records such as tree rings around the globe. Is there evidence to the contrary?

          Sure I own a car. For me to give up my free CO2 emissions while others drive SUVs as they please would be like me paying to have my garbage removed while my neighbors toss their trash in my yard. We all need to pay for garbage collection, and putting trash in the common areas needs to be fined. Do you pay for garbage collection?

          CO2 is a waste product: trash. We all need to pay for it as a way to discourage inefficiency and pay for the cost of it. I will gladly pay my share, just as people long ago decided it was better for all concerned if it was mandatory for everyone to pay to have their trash collected, rather than tossed on the streets.

          There was likewise a time when people first paid taxes to install sewer systems rather than toss their “night soil” out onto the streets. I’m sure some people were against that.

          • NoFreeWind says:

            Read Fabian’s book on The Little Ice Age and check the historical references of European villages, hundreds of years old, being destroyed by rapidly advancing glacier. This we KNOW to be indisputable FACT! You would rather accept studies performed by political hacks doing complex mathematical calculations using indecipherable models measuring thousands of an inch of tree ring which are affected by humidity, sunlight, volcanic ash, ocean cycles, the sun, planetary orbits etc, all to come up with the supposed EXACT temperature within a tenth of a degree 300 years ago? Sure…

          • David A. says:

            You mean “Fagan”…. and his book primarily pertains to Europe and the North Atlantic, with some small discussion of North America. He doesn’t say anything about the rest of the world.

          • ed says:

            Hops you are so off your game. 96.5% of the CO2 emitted each year is from non-man made sources. So vegetation is emitting trash co2. Are you suggesting we burn all the vegetation on the planet to reduce this huge source of trash?

            Human respiration accounts for .1% of the CO2 emitted each your, would you suggest we off half the population to minimize our trash output or tax people by how much they breath?

            Per capita CO2 emissions in the USA are about 17.2 tons annually. In Ethiopia it is .1 tons. Are you willing to give up the use of electricity, transportation and any heat source so that you can occupy the same moral CO2 ground as an Ethiopian? If 17.2 is too much define what the correct emission per person should be. Then tell me you will be donating your excess to someone in a third world country and voluntarily give up the use of heat or electricity for the rest of your life.

            Al Gore has a large CO2 footprint than entire Ethiopian towns. What a bunch of hypocrites.

          • David A. says:

            96.5% of the CO2 emitted each year is from non-man made sources.

            And all of that (and more) is taken up each year from non-man made sources.

            It is only because of man’s emissions that CO2 is building up in the atmosphere and ocean, which is why atmospheric CO2 changed little for millennia before the Industrial Revolution.

            I am always surprised when people try to play that card; it’s weak and easily refuted.

          • ed says:

            David
            Here is a more appropriate representation of the levels of CO2 in the atomosphere. Most graphs set the scaling to create the appearance of a problem with CO2. There isnt one.

            http://www.drroyspencer.com/wp-content/uploads/mauna-loa-co2-1-percent-scale.jpg

            Oh and by the way the modeling increase in temperature from a doubling of c02 only occurs with feedbacks. If clouds act as a negative feedback big increases in temperature never occur because the temp effect of co2 alone is just about capped out starting around 300ppm. See the attached.

            http://2.bp.blogspot.com/-ESMSe9GmfMw/TWqUnO2h47I/AAAAAAAACxs/DCtKiNH_1jo/s1600/temperatures6.png

            What we are seeing is that doubling co2 to 400ppm gets you about 1C of a temp increase as most rational scientists will agree. Beyond that negative feedbacks minimize any further effect. Otherwise how do you explain 17 years and 5 months with no further uptick in the trend line? Models dont prove theories. Evidence does. Right now the evidence does not agree with the “theory of AGW”.
            Your turn
            Ed

          • David A. says:

            Here is a more appropriate representation of the levels of CO2 in the atomosphere.

            Your graph is not only useless, it couldn’t be more misleading — as the history of climate shows clearly, the correct interval for discussion CO2 changes is ~100 ppm.

          • David A. says:

            If clouds act as a negative feedback….

            And if they don’t then even more warming is in store, which is what Fasullo and Trenberth found for cloud changes (Science, 9 Nov 2012).

      • alex says:

        It has been proven by various papers. You only have to look for them. However there’s a very simple but logical answer. How can an anomaly such as the little ice age that spanned over a 500 year period no spill over the rest of the world if it was not the other way round, that is, the result of ‘the rest of the world’s’ climatic anomaly on Europe?

        • NoFreeWind says:

          Yet somehow the Cali drought anomaly which is occurring while neighboring states have relatively normal precipitation and the rest of the country is in a deep freeze and suffering through one of the worst winters of recent past is to be accepted as “global climate change”.

      • Tony J says:

        Some papers suggest that the cool eriod ws global – can you prove otherwise?

      • ColdinOz says:

        Ask that question of Bob Carter or Don Easterbrook. But as you already know their answer won’t be the one that you want.

  9. bernie says:

    The consensus of the USA government scientists at the Climate Prediction Center is that present ENSO-Neutral conditions will likely persist into the Northern Hemisphere summer.

  10. Don Easterbrook commentary on the climate is worth looking at it appears on CLIMATEDEPOT.COM as well as WATTS UP WITH THAT ,and ICECAP.COM web-sites.

    I am have been pretty much in agreement with him, but put even more emphasis on solar going forward, and the direct and potential secondary effects.

  11. Starting point and ending point is crucial. You may have whatever trend line you want. It is though a stand still, but on a high level. I am waiting for the new El Nino to appear. When it happens, he should exceed 1998 even with a tine little boy…or else…?

    Here in Norway the climate has changed quite a bit. The new normal in souther parts is approx 1.2 C degree above 1961-90 averaged over 1988-2013. It is the NH that takes the major part of the warming so far. The Norwegian Arctic (Spitsbergen)areas lie approx 11 (!) degrees above normal so far (Jan).

    • Hot Potato says:

      Yes Eystein, the climate is changing. I don’t see that fact changing anytime soon. An ever-changing climate doesn’t mean said change is caused by the activities of humans though.

      • No, I didn’t say that. But a lot of discussions here and other places focuse on digits behind commas. Then again trend lines obscure what the sceptisim should be in this context, from my point of view. Especially the hype in the media, hypocrisy of politics, the lack of focus on environmental issuses locally, and investigate why most people don’t care about climate change. Just arguing about minuscule digits is a waiste of time and besides…one shouldn’t put all the eggs (arguments) in one basket. It will come back and haunt you…

      • Hops says:

        It’s the rate of change that is different this time. Climate has always changed, but not at this rate. And it is the rate that is the biggest problem.

        Also, during previous changes in climate, humans, if they existed, were hunter-gathers. If the climate changed, they move. With billions of people living in cities on the coasts, climate change is a disaster.

        Anyway, as I keep saying, fossil fuels are a finite resource. Leave some for the kids.

        • NoFreeWind says:

          The worlds oldest temperature graph shows nothing whatsoever abnormal in the “rate of change”.
          http://www.metoffice.gov.uk/hadobs/hadcet/
          In fact in the UK the 10 year ave temperature is right now about the same as it was in 1950. So 1940-1950 was as warm as it was from 2003-2013. Now where I have I heard it before that the 1940’s were as likely as warm as now?
          Hops. I suggest you check what you call your facts.

        • NoFreeWind says:

          Hops. I suggest you treat yourself to a little of what they used to call “science”.
          http://www.esrl.noaa.gov/psd/enso/mei/
          See all that red, that’s El Nino phase of the oceans, the planet warms during El Nino’s and cools during the La Nina. Seems to happen every time except when a volcano blocks the effects of an El Nino. The period from 1977 through 1998 was dominated by El Nino, the planet warmed by about .5C depending on who is measuring. There is no way possible the planet would have cooled during that time. See all the blue before 1977, that’s a La Nina, the planet cools. That is why the scientists were so worried about global cooling and that is why the temperature graphs of the time showed a .6C cooling, of course that cooling has now been smoothed. So the .6C rise since 1977 is about the same as the .6C showed on graphs in the 1970’s. There has been no global warming. But it make a nice story. Same thing happened with US temperature graphs.

        • ed says:

          Given that the rate of temperature over the last 17 years and 4 months has been ZERO I agree with you. Climate is always changing and I expect that the rate it changes will fluctuate wildly. There have been several periods of warming and cooling over the last 150 years. Show me where the current rate of warming/cooling varies from any of those in the temperature record. Prior to that, any “tree” thermometers do not have the resolution to provide information on rate. So how do you come up with your baseless statements.

          Fossil fuels are finite? Based on the models from 20, 30 or 40 years ago we were supposed to have run out of oil by now and reserves are higher than ever. Perhaps oil is created by an ongoing process beneath the earth that was as yet have no clue about.

          And so humans today are incapable of moving? OMG help the poor NY citizens drowning in their appartments while surfing the internet with water washing through their windows because they cant move. Do you know how many former coastal cities are now inland or land locked? Do you know how much of current cities are built on swamps or fill that was previously underwater to start with.

          If you want to truly learn about a topic you need to be able to look at an issue 180 degrees differently and be open to the fact that you might be wrong.

        • JohnKl says:

          Hello Hops,

          Your bizarre climate POV in contradiction previously introduced observations/facts consistently astounds. First you blurted:

          “It’s the rate of change that is different this time. Climate has always changed, but not at this rate. And it is the rate that is the biggest problem.”

          CORRECT! THE PAST ICE-AGE ENSUED MUCH FASTER THAN THE CURRENT CHANGE ONSET OF CLIMATE WARMING!!! After all, we’re still in an ICE-AGE (last I checked the permafrost is still their) and this is after over a century of human/industrial CO2 emissions. Millions of Mastadons, Mammoths, dyre wolves, etc. froze to form what we today call PERMAFROST!!! The ARCTIC PERMAFROST regions today are far TOO COLD TO SUPPORT SUCH LIFE NOW!!! These life forms FROZE SUDDENLY with their flesh intact and often the food still in their mouths. In fact, explorers frequently feed the remains of mammoths and other organisms to their pets because the FLESH IS STILL EDIBLE!!! You may be surprised to find that Russia has been the world’s largest exporter of ivory for a long time. How do you think that can happen when elephants no longer live and flourish in their territory, being far too cold.

          You then laughably asserted:

          “Also, during previous changes in climate, humans, if they existed, were hunter-gathers. If the climate changed, they move. With billions of people living in cities on the coasts, climate change is a disaster.”

          Oh! FYI, human remains have been found in ICE-BOGS. Apparently, they couldn’t move fast enough!!! As to humans supposedly being hunter-gatherers, plenty of humans still take up this occupation. The climate alarmists frequently complain about coastal people being flooded (like they have any plan to stop it), as if this was a new phenomenon. Weren’t the Maldives supposed to be under-water by now?

          You went on to complain:

          “Anyway, as I keep saying, fossil fuels are a finite resource. Leave some for the kids.”

          Hmmh! No one can put one over on you! Please let us know what material resource in this universe is not finite?!!! It seems, they all are, including solar energy.

          Have a great day!

    • Kristian says:

      Have you had a look at Norwegian temperatures? Or those of Western Europe, for that matter? They made a big jump in 1987/88 when the AO went through the roof. Before and after, not so much going on.

      • NoFreeWind says:

        Same goes for Alaska.
        http://climate.gi.alaska.edu/sites/default/files/StateWide_Change_1949-2012_F.png
        During the past decade we were bombarded with “science” TV telling us how Alaska was warming. All because of CO2. They never mentioned that it had warmed, but the change all occurred during one year in 1977 when the PDO flipped to negative. A few years the PDO flipped the other way, and Alaskan temp.’s have plummeted down. Do you think the “science” shows are explaining this to the common people? Instead of a War Against Science we have a Propaganda War being waged against us by so-called scientists.

        Thank you Dr. Spencer.

        • Kristian says:

          Yeah, they love hiding how the warming actually came about and when it occurred.

          It’s the same with the alleged Antarctic Peninsula warming. Indeed it has warmed a lot since the 50s, the 60s and even the 70s.

          But since the early 80s? Nope. No continued warming recorded during the last 30 years … Does anyone care to let us know? Of course not. It would ruin the scare. And the narrative.

  12. Roger S. says:

    A question:
    Should the dreaded Polar Vorteces be expected to increase or decrease global warming? On the one hand, all that cold air down where people actually live causes us to generate more heat to warm our buildings and such. That means more hydrocarbons in the air. On the other hand, all that snow cover greatly improves the albedo of much of the northern hemisphere, meaning less solar radiation gets absorbed by the planet. Which effect should dominate?

  13. coturnix says:

    Looks like global temperature is hardly relevant to ANY local temperature changes at all. At least at a level of everyday sensoy perception.

  14. Thanks Dr. Spencer.
    I have posted your UAH Global Temperature Update for January 2014 graphic on my climate and meteorology pages.

  15. Wilson says:

    Darn it, still not coming down ay?

  16. stevek says:

    Models now have even more ground to make up. This month’s data increases the probability that they are wrong. Last time I checked it was 98% probability IPCC models are incorrect.

  17. mike maguire says:

    hops,
    On these points of yours:

    “CO2 will increase some plant growth in some places, but other factors like water will limit it; otherwise, the plants would just suck up all the CO2 and it would not be rising past 400 ppm”
    A more accurate description, based on the actual data and studies is MOST plants in MOST places by a SIGNIFICANT amount……even the deserts are greening up(so water is not a limiting factor as you state):
    http://www.climatecentral.org/news/study-finds-plant-growth-surges-as-co2-levels-rise-16094

    Increasing CO2 actually allows plants to adapt to hotter/drier weather……..regardless of it being caused by humans or natural.
    http://buythetruth.wordpress.com/2009/06/13/photosynthesis-and-co2-enrichment/

    “As for warming, ask the farmers in California how the warming thing is working for their plant life” Actually, they are doing better than they would be if CO2 levels had not increased to 400 ppm……..of course you are siting a drought in one small location.
    Let’s take a bigger one, like the US Midwest in 2012. That was a widespread severe drought in larger key growing region(for corn and beans). 2012’s drought got a lot of attention. Missing from the discussion were the 24 consecutive years without a widespread severe drought in the Midwest(since 1988), a new record.

    What seems more significant. 1 year of severe drought. Or 24 years without one, when that area, historically get’s at least 1 per decade? Remember the decade of droughts, the Dust Bowl 1930’s?

    “there is of course no “correct” temperature, but there is a desirable temperature, which would be the one we and all the life on Earth are adapted to”
    Exactly, we and all other creatures adapted to it. You are proposing we humans set the thermostat, oceans, CO2 and all other measured elements to unchanged because we think that is the way that is best for us.

    “It’s like we’re throwing our kids off a cliff and saying gravity is only a theory”

    So, you’re saying catastrophic anthropogenic global warming is as certain as gravity?
    It only exists in theory(since it hasn’t happened yet) The evidence is mostly from the mathematical equations chosen to represent the theorized physical laws of the atmosphere by global climate model builders.

    I have a better anomaly that uses 2 PROVEN laws:

    Cutting back on CO2(which is causing the vegetative health, biosphere, crop yields and world food production on our planet to soar higher) because it’s carbon pollution, would be like your family doctor telling you to stop feeding your rapidly growing and very healthy teenager, protein because protein is poison to the human body.

    • bob says:

      but when you are feeding your teenager protein at the fastest rate in earth’s history.

      So much protein that it’s jumping up at an unnatural rate…

      dangerous.

      • crakar24 says:

        Really Bob? You can die with one leg in the air if you get too much oxygen so now oxygen is a pollutant? Just because something falls outside of *your* predetermined ideals does not make it a pollutant.

        Bob please explain to us all the side effects of this pollutant, lets be fair and go all the way back to 1750 when co2 levels were approx 280ppm, since the additional 120ppm has been released what are the side effects?

        Breathing problems?, a rise in lung cancer rates?, a rise in heart attacks maybe, i dont know you tell me bob. What are the signs of this pollutant and its effects from 280 to 400ppm. Oh and while you are at it please tell us what is *your* preferred levels of co2 complete with justifications of course.

        Speaking of pollutants, the Australian carbon tax (highest tax in the world by far) generated 7 Billion dollars last year and reduced overall emissions by 1.8 million tonnes, no that is not a typo.

        Most of this decrease came from a drop in industrial activity and down time at the Yallourn power station due to suspicious damage. The tax was calculated to cost $350 per man, women and child or $1350 per household (family of 4) personally this tax cost me $1750.

    • Threepwood says:

      I saw the topic in a documentary recently narrated by Oprah Winfrey, apparently plants ‘breath in sunshine and breath out oxygen’ – CO2 is no longer a significant part of the process!

      It’s mind boggling how many young people now think that something as unambiguous- physically demonstrable as photosynthesis is just Big Oil propaganda.. While hypothetical computer simulated catastrophes are ‘settled science’

  18. tonyM says:

    Given some of the comments on rate of T change, I can see we wasted time learning Calculus and someone should have tapped Newton on the shoulder and told him he was wasting his time. Future generations will find simple solutions; just pick two points on any polynomial and draw a straight line – presto rate of change. Guess it works for integration too!

    I’m learning all the time!

    I have never seen a reference that warming due to CO2 is some sort of time series. Rather it is a physics principle ala Hansen et al whereby a given CO2 increase will give a resultant T increase (after short term equilibrium period including feedbacks). This has nothing to do with a time series. It either increases in line with the sensitivity or not (with due allowance for extreme events).

    It does not matter whether we take the last 17 years or 70years or 140 years the answer is basically the same; even if one is super generous and attributes all the warming to CO2 plus feedbacks it comes nowhere near the postulated CO2 sensitivity which causes alarm.

    To those who keep insisting T has continued to increase, I suggest they peg their pay increases to the change in T since CO2 will increase; they may soon grasp that their their graphical interpretations are not so robust. Just try it out over the last 17 years for fun. Then come tell us it is increasing in line with the scaremongering.

    More and more evidence is coming to the fore supporting Dr Spencer’s views that those enigmatic clouds have powerful influences which would mitigate much of the warming idea surrounding CO2 + feedbacks.

    Observed increased cloud cover over the Arctic offsets the lower albedo of ice break up in summer is one effect. A recent paper showing increased relative low level cloud cover would provide negative feedbacks.

    “New paper finds negative-feedback cooling from water vapor could almost completely offset warming from CO2” on The Hockey Schtick or WUWT.

    • David A. says:

      It does not matter whether we take the last 17 years or 70years or 140 years the answer is basically the same; even if one is super generous and attributes all the warming to CO2 plus feedbacks it comes nowhere near the postulated CO2 sensitivity which causes alarm.

      You can’t do this calculation, because the necessary data on aerosol emissions and concentrations isn’t available, and they are a negative forcing.

      • tonyM says:

        David:
        You are up yourself.

        Science is about empirical evidence. If you cannot produce the empirical evidence then it is not science no matter how elegant your ideas may seem.

        When one reads Hansen’s papers he talks about having the empirical evidence for the sensitivity. Now show it be so or roll over and go to sleep.

        Every year in which the sensitivity fails is an experiment in failure of the hypothesis. It is not my problem to dream of what may confound it. Every failed projection, prediction made based on the hypothesis is evidenced that falsifies the hypothesis. There is a litany of failures.

        That problem and onus of proof lies with the proponents. Thus far they have shown nothing other than gaseous emissions from top and bottom – a special sort of “foot n mouth” disease.

        The alarmist position is cargo cult science; the Oracle of Delphi was more adept at predictions.

      • David A. says:

        Tony, you are confused. The evidence Hansen writes about is paleoclimate evidence, not, as the commenter discussed, evidence from the 20th century.

        You can’t calculate climate sensitivity based on 20th century empirical data because there is no data for aerosol concentrations for that time.

        Since they are a significant negative forcing, you need them to do the calculation.

        • tonyM says:

          David A:

          It appears you are just a storyteller; you make it up on the run.

          I am not calculating the forcings and am not concerned with 3rd decimal places. Hansen’s postulated climate sensitivity does not hold in practice. You are simply conflating and obfuscating.

          The evidence falsifies the alarmist claims which is the point I am making. Hansen is clear enough as to the net effect to be expected.

          You seem not to understand the purpose of his paleoclimate studies given Hansen and Sato noted,
          “the empirical paleoclimate estimate of climate sensitivity is inherently more accurate than model-based estimates…”

          If you think they did all that work to apply it to paleoclimate may I suggest you are in limbo land.

          Hansen on aerosols:
          “Available data on aerosol single scatter albedo imply that anthropogenic aerosols cause less cooling than has commonly been assumed.”

          “However, as Hansen notes, empirical estimates of climate sensitivity based on paleoclimate data are consistent with the sensitivity in climate models of approximately 3°C for doubled atmospheric CO2. “

          So don’t babble on that it compromises the issues I raise.

          Hansen again:

          “Climate sensitivity is still an important topic, but we maintain that convincing evidence has accumulated in the past 20 years that climate is indeed very sensitive and that Charney’s estimate of about 3°C for doubled CO2 (which causes a forcing of 4.3 Watts/m2 is approximately correct.

          The strongest evidence is the empirical fact that the warmth of the current interglacial period, with Earth 5°C warmer than during the ice age 20,000 years ago, is maintained by a forcing between 6 and 9 Watts/m2. “

          Do you still think he is focussing on the application to paleoclimates? He is talking about TODAY. Got it?? Why don’t you read his work?

          • David A. says:

            No, you cannot calculate the atmosphere’s climate sensitivity to CO2 unless you include *all* forcings, including aerosols.

            Since there is no data on aerosol concentrations in the 20th century, you can’t use 20th century temperature and GHG data to calculate climate sensitivity.

          • David A. says:

            Do you still think he is focussing on the application to paleoclimates? He is talking about TODAY.

            He is APPLYING the climate sensitivity number to today. But he is CALCULATING it via paleoclimate data. Your own quotation proves it:

            “However, as Hansen notes, empirical estimates of climate sensitivity based on paleoclimate data are consistent with the sensitivity in climate models of approximately 3°C for doubled atmospheric CO2. “

          • tonyM says:

            David A.
            http://www.drroyspencer.com/2014/02/uah-global-temperature-update-for-january-2014-0-29-deg-c/#comment-103864
            you say:
            He is APPLYING the climate sensitivity number to today. But he is CALCULATING it via paleoclimate data. Your own quotation proves it:
            ………………………………………………………
            The issue was never about where he got it. Rather it was that he claimed to have empirical evidence for the sensitivity and that it was applicable in our period not simply to paleoclimate.

            For my purposes it would not have mattered if he dreamt it up on the royal throne.

            It fails miserably whether it be over 17, 70 or 140 years. Every year, in fact every month, is evidence of such failure.

            He also stated that aerosols had less effect than commonly assumed.

          • David A. says:

            The issue was never about where he got it. Rather it was that he claimed to have empirical evidence for the sensitivity and that it was applicable in our period not simply to paleoclimate.

            Of course it’s applicable — the molecular properties of CO2 haven’t changed between then and now, nor have the laws of physics.

            All else being equal, CO2 will cause as much warming now as it did then. But all else isn’t equal — one big difference is that now we have the cooling effect of anthropogenic aerosols, black carbon, etc.

          • tonyM says:

            You are clutching at straws again.
            Hansen has already accounted for aerosols and allowances can be made and/or tested for any other variable you can name.
            It is relatively unimportant what transpired in the intervening time of the last 140 years. The reason is it is not a time series. The hypothesis is that changes in GHG will result in forcings and feedbacks as defined by Hansen et al.

            If aerosols were higher in the past than now then clearly T now should exceed the T increase postulated by straight GHGs change and other forcings.

            If they were lower it does not matter as allowance has been made for aerosols as a forcing factor now. Hansen himself says they are less important than most people think so it can’t account for the disparity.

            The same applies to other variables. That is why some like Trenberth are diving for “hidden heat” and the divine mysteries of life and not science. If that is earth’s way of moderating T then with the ocean heat capacity over 400 times that of air it kills the alarmist proposals. Heat from a low T environment is hardly in a position to come growl and bite.

            Either way the hypothesis is a dead duck!

          • David A. says:

            If aerosols were higher in the past than now then clearly T now should exceed the T increase postulated by straight GHGs change and other forcings.

            Come on. There were no aerosols before the Industrial Revolution, except for some occasional, short-lived volcanic eruptions.

          • David A. says:

            Hansen himself says they are less important than most people think so it can’t account for the disparity.

            What exactly did he say, and where? Provide a link.

          • tonyM says:

            David A.
            It would be a simple process for you to copy and paste the key quote into Google where you would have been directed to many sites.
            http://onlinelibrary.wiley.com/doi/10.1029/96JD03436/abstract
            Radiative forcing and climate response
            J. Hansen, M. Sato,R. Ruedy
            Article first published online: 21 SEP 2012
            DOI: 10.1029/96JD03436

            Embedded quote:
            “Available data on aerosol single scatter albedo imply that anthropogenic aerosols cause less cooling than has commonly been assumed.”

            In any case this is NOT the issue itself, as I said, as it has been accounted for in any of his sensitivity claims applicable to the period in question.

            The point is that he has made ample allowance for it and his alarmist T increase prediction is still too high. Apart from the usual many things are possible waffle he has never resiled from the alarmist proposition.

  19. Hot Potato says:

    I’ve posted a link here before to an analysis of the current environmental movement, which has hung its hat and coat on the AGW hook by the way, and its radically sadistic agenda. These are dangerous people. They’re nuts and they wish to do harm. Here’s an example of their tactics. It wasn’t reported, but I suspect there’s more of this going on then is reported, and it will increase in frequency as AGW is increasingly accepted as a law of physics like gravity.

    http://sfist.com/2014/02/05/pge_metcalf_station_terrorist_attac.php

    Around 1 a.m. on April 16th last year, a team of attackers cut phone likes and took out 17 power transformers at a PG&E substation south of San Jose, nearly causing a blackout throughout Silicon Valley. According to the former chairman of the Federal Energy Regulatory Commission, it was the “most significant incident of domestic terrorism” involving the nation’s power grid. No one has been charged or arrested in the attack.

    • David A. says:

      There is absolutely no evidence this incident was done by anyone in the environmental movement. The news articles I’ve read and hear all say authorities have no suspects.

  20. Hot Potato says:

    I’ll make a deal with the “Warmists.” I just might be persuaded to believe your nonsense again if Al Gore pulls a McCandless. Christopher is an example for all “Warmists” to follow. I’ve yet to find a “Warmist” willing to give up their Starbucks and Internet connection though…or their private jets, bottled water from Fiji and mansions in Tennessee. See if you can persuade Al to follow McCandless Into The Wild.

    http://www.amazon.com/Into-Wild-Jon-Krakauer/dp/0385486804

    In April 1992 a young man from a well-to-do family hitchhiked to Alaska and walked alone into the wilderness north of Mt. McKinley. His name was Christopher Johnson McCandless. He had given $25,000 in savings to charity, abandoned his car and most of his possessions, burned all the cash in his wallet, and invented a new life for himself. Four months later, his decomposed body was found by a moose hunter. How McCandless came to die is the unforgettable story of Into the Wild. As told by Jon Krakauer.

    This is a great story by the way. Krakauer is an excellent non-fiction writer. He really knows how to tell a story. You know what Al will find before he starves to death (which may take a while considering his girth)? He’ll find the wilderness is Inconvenient to his survival and he’ll find the Truth about himself. His journey Into The Wild will be An Inconvenient Truth.

    • Jim Hughes says:

      It has now been shown that he died from eating a poisonous plant – not starvation.

      • Hot Potato says:

        Incorrect. He still died from starvation. The Hedysarum Alpinum from the wild potato seed rendered him too weak to hunt and forage for sustenance thus causing him to starve to death. Either way, the point remains. The poisoning from the seeds would eventually have killed him had the starvation not. No doubt Al Gore’s fate would be much worse than McCandless’s. No doubt a moose would trample his ass and paralyze him making him easy prey for hungry wolves.

    • David A. says:

      A few people living off the grid is not the solution to climate change, and it never will be. In fact, by slightly reducing demand for fossil fuel, they would only succeed in slightly lowering its price, making it easier for fossil fuel users to use even more.

      A real solution can only happen at an institutional, societal level.

  21. AGW, theory has been proven wrong at each and every turn.

    • David A. says:

      This is ridiculous. The vast majority of the world’s climate scientists would not accept a theory that contradicts observations at every turn. The thought is laughable.

      I know Salvatore — time will tell, right? How long have you been saying that for now?

      • tonyM says:

        David,
        If someone smacks you on the head quite frequently, fervently much like a pile driver, how many times will it take you to realise that your hypothesis that these are just friendly pats is wrong, plain wrong?

        In science it only takes one failed experiment to falsify the hypothesis. Sure one may modify the hypothesis and test again. The point being made is that the modifications needed with all the failed experiments (predictions and observations) means that the hypothesis needs to be reduced to an innocuous “don’t know” or minuscule sensitivity in order to hold.

        Pooof goes the alarmist proposition. Puff goes the gravy train.

        Your appeal to authority argument is the absurdity; it is not science!

      • David A. says:

        In science it only takes one failed experiment to falsify the hypothesis.

        Tony, you are confused. Climate science isn’t an experimental science.

        There are certainly sufficient uncertainties in climate science that need to be significantly reduced before the idea that CO2 is a greenhouse gas gets tossed out. A huge number of such uncertainties and complexities.

        In fact, the radiative properties of greenhouse gases are among the BEST known parts of the science, by now well established. No matter what else happens, those are facts that will never go away or be falsified, any more than many other theories in physics.

        The questions in climate science are mostly about feedbacks and, given our short-term perspectives, internal variablity. CO2’s radiative forcing is solid.

        • tonyM says:

          David A:
          says: “Tony, you are confused. Climate science isn’t an experimental science”
          …………………………………………
          Good to hear you admit it is not a science so stop pretending it is a science.

          It certainly is not orthodox science. Empirical evidence is what sets orthodox science apart from other fields. Science can never be “settled” as claimed.

          So why worry about CAGW; it is just a swindle based on the politicised religion that the “end is nigh.” Problem solved – now roll over and go to sleep. Poor Suzuki is finding it hard to go to sleep without crying due to this scaremongering.

          Any ideas which cannot be tested by observation with a falsifiable proposition or hypothesis is just not science. One cannot hide behind components which can be tested, like the limited effect of emission/absorption of GHG (which have never been in question), and then pretend that it is still science by extrapolating that to a system involving complex interacting variables outside those conditions tested. That system needs to be tested if it is to be science. But then it is not science so it doesn’t matter!

          You truly must be an ardent Mann follower. That clown believes that proofs are for maths and geometry but unnecessary for climate so called “science.” That’s why he manipulates data to fit his ideas. Right you are, all these past science greats wasted their time carrying out experiments. The large Hadron Collider is one giant money waster – who needs experimental confirmation?

          But I repeat myself as you have admitted it is not science. Perhaps you can now tell the IPCC and the rest of the scaremongering clowns including the UN and various Govts to declare such to the world instead of the pretence that it is science – orthodox science rather than the simple use of the word derived from Latin scio (I know) such as political science.

          As to CO2 radiative forcing in the atmosphere you claim it is solid. Now, show me the empirical supporting evidence for such a claim particularly when it is statistically compromised by other gases. Tell us its value.

        • David A. says:

          Good to hear you admit it is not a science so stop pretending it is a science.

          That’s not what I wrote, of course. And I’m not willing to waste my time debating someone who distorts even the simpliest things.

          • tonyM says:

            Sure, you did not say it verbatim but that is what it means.

            You promote a pseudoscience which never wishes to be tested and never wishes to be held to falsifiable hypotheses; Feynman’s classic cargo cult science illustration. There is no distortion as I have been clear on how it differs from orthodox science.

            If you can’t handle being put under pressure to face up to these issues then no one compels you to “debate.”

          • David A. says:

            I can handle the pressure. But I won’t handle your obvious and purposeful distortions.

          • tonyM says:

            David A.
            The assertion that I am distorting your comment is because I am stating that your statement is inconsistent with orthodox science which requires falsifiable hypothesis and empirical testing.

            Avoidance is classic cargo cult science of which Feynman spoke.

            One cannot claim an area is science and then refuses to submit to the key requirements of orthodox science. This is what you are doing when you say it is not an experimental science. If it is not experimental it is not science

            I am not saying it must be done in a lab with strict control of variables. Nevertheless there are fundamental claims which could and should be subject to such testing.

            You claim Physics is about numbers. Fine, then state CAGW hypothesis in clear, unambiguous, quantified, falsifiable form.

            Now show us that reality complies with it.

            Thus far Hansen’s predictions (adjust for CO2 and whatever else you wish) and 97% of model runs fail this test. There are many other physical predictions which have failed. They have all been based on the hypotheses put forward and thus falsify them. Again, adjust for any changes in variable.

            Just because an area has a physical basis does not mean it can be subjected to scientific analysis – for the present at least.

  22. The last refuge of anthropogenic global warming theory fails to stand up to scrutiny

    Reblogged from ICECAP:
    Looking at the latest refuge of AGW theory that fails data scrutiny

    By Joseph D’Aleo, CCM 2/3/14

    AMS is meeting in Atlanta this week as the north gets buried in snow and cold continues. The academics though still are pushing their agenda making the meeting uncomfortable for those who don’t buy into the scam. Many skeptics have left the society. Many like me remain because we have earned a CCM, a Broadcast Seal or CBM, designation as a Fellow. We will prevail.

    For 19 going on 20 years, global warming has stopped. Cooling has replaced warming in winters during that same period for the CONUS – we will update after this year for 20 years). Using projected February anomalies and anomalies to date it will rise to -1.25F/decade cooling for the last 20 winters.

    This has been true even as CO2 has risen 9.7%. In Europe and in places elsewhere including the US, the green agenda has led to harmful increases in the cost of energy or energy shortages, as winters have trended colder and snowier. This has falsified the climate models and assessments which had accelerated warming and snowless winters.

    In the United States, the number of high heat extremes have been declining since the 1930s. 23 of the 50 state all time heat records occurred in the 1930s and 39 before 1960. More cold than heat extremes have been set since the 1940s. The claims to high temperature months and years is with “adjusted” (manipulated) data. The actual heat and cold records are unadjusted.

    The tropical heat build-up in the atmosphere and oceans, one of the key outputs in ALL the climate models, has not been seen in the weather balloon, satellite data, or the dense ocean buoys used to track El Nino and La Ninas down to 300 meters depth, in the last 3 to 5 decades or 2000m in the ARGO buoy data since its implementation in 2004.

    Sea level rise has slowed dramatically from the 20th century, and there is no upward trend in incidents of droughts and floods. Hurricane activity globally is at a 34 year low. “Superstorm” Sandy was a borderline Category 1 storm. Eight Category 3 or greater storms hit the Atlantic coast from 1938 to 1960. The total tornado count this year was over 140 incidences less since records started in 1953. The number of wildfires are the lowest since modern records began in 1985.

    The arctic ice cover bounced back over 50% with one of the coldest arctic summers on record while new records for ice were set in Antarctica, even trapping a research ship this past month, during the Antarctic summer.

    Snow was supposed to become increasingly rare. Instead as this week will reinforce, it is increasing. 4 of the top 5 snowiest years for the northern hemisphere have been in the last 6 years. In just 4 years, we have had more east coast snowstorms this decade than any in history.

    The great physicist Richard Feynman said not matter how smart you are, who you are or how beautiful your theory, if data doesn’t support your theory, it is wrong. Einstein noted a model or a hypothesis cannot “prove” anything. But data can invalidate a hypothesis or model. Einstein described the “Key” to science well when he said: “The case is never closed.” “Many experiments may prove me right but it takes only one to prove me wrong.”

    In the case of global warming, we have many examples proving it wrong, but with the political motivation of heavy funding, exceeding $79B the last decade, data is ignored with claims of a consensus. Dr. Michael Crichton wrote “Historically the claim of consensus has been the first refuge of scoundrels; it is a way to avoid debate by claiming that the matter is settled.”

    By claiming both sides of every weather extreme (warm or cold, drought or flood, no now or too much snow), they have created an unfalsifiable hypothesis. They want you to believe every weather event proves their hypothesis. The most recent example is the controversy over the “polar vortex”. Though this is a common phenomenon, somewhere around the hemisphere most every winter, and has occurred in the United States often in the cold decades, as well as the last decade, they believe they can convince you that (You and your SUV are responsible).

    This weekend, I enjoyed meeting with a friend (PhD climatologist) from the Weather Company (TWC etal). Some outspoken TWC mets have convinced themselves that AGW is real because of the extremes (which in reality have not increased as discussed above) and the negative North Atlantic Oscillation in recent years they relate to the arctic warming and melting of arctic ice which has resulted in inconvenient colder winters in varying parts of the northern hemisphere.

    My friend told them they need to look further back in time. He is absolutely right. The arctic ice and warming relates to the AMO, and warming and melting happened before when the AMO was last in its warm mode from the 40s to 60s when winter turned colder and blockiness increased.

    The University of Alaska at Fairbanks shows how warmer Atlantic waters make their way into the arctic increasing ice melt (from the bottom) and air temperatures.

    Enlarged

    It appears also influenced by the geomagnetic solar activity.

    Our quiet sun in recent years and reduced geomagnetic Ap aligns with a declining NAO much as we have seen in similar circumstances in the past.

    • David A. says:

      For 19 going on 20 years, global warming has stopped.

      Only if you take the extremely myopic view that all change happens at the planet’s surface.

      It does not, of course. The UAH LT has warmed by 0.28 C in the last 20 years. The ocean has warmed enormously. The latter doesn’t happen without a cause, and that cause is GHGs.

      • Kristian says:

        David A. says, February 6, 2014 at 1:24 PM:

        “The ocean has warmed enormously. The latter doesn’t happen without a cause, and that cause is GHGs.”

        How can that be? Because how are the atmospheric GHGs supposed to, according to the hypothesis, to force a portion of the absorbed solar energy to remain in the bulk of the ocean thus making it warmer (increased OHC)?

        First the atmosphere must warm. Then the surface must warm as a result. And only THEN the OHC can start to rise as a result. If the cause of the rise is atmospheric GHGs.

        You know about the much referred-to Minnett explanation (RealClimate, 2006) of how the GHGs allegedly warm the ocean. They do so by first warming the skin layer so that the temperature gradient down through the surface layer to the bulk underneath is reduced. Then solar energy will have a harder time to get back out of the ocean and the OHC starts rising.

        But then we need to see a rise in surface temperature first. Satellite measurements of the ocean surface include measurements of the skin and it shows no warming globally since 1997:
        http://i1172.photobucket.com/albums/r565/Keyell/SST_zpsa03286e3.png

        In the meantime, global OHC has increased a lot:
        http://i1172.photobucket.com/albums/r565/Keyell/OHC_zpsa408a1e6.png

        This could not have happened if atmospheric GHGs were the cause.

        You’re just throwing out vague assertions that ‘GHGs done it!’ without ever stopping to think how you’re gonna show it, what the data says about it.

        What atmospheric GHG warming mechanism are you basing your case on that bypasses the bottom of the atmosphere and the surface and goes straight into the ocean? You know that the atmosphere can never put ‘heat’ directly into the ocean, don’t you, David?

        Same thing with the lower stratosphere. Increasing CO2 is supposed to cause stratospheric cooling. Well, why hasn’t it over the last 19-20 years?

        • David A. says:

          Because how are the atmospheric GHGs supposed to, according to the hypothesis, to force a portion of the absorbed solar energy to remain in the bulk of the ocean thus making it warmer (increased OHC)

          Your science is all wrong.

          GHGs don’t don’t absorb solar energy, they absord infrared radiation emitted upward by the planet.

          They then reemit IR, in all directions, some of it downward. That warms the planet further.

          • JohnKl says:

            David A,

            Please David use reason. You claimed:

            “Your science is all wrong.”

            “GHGs don’t don’t absorb solar energy, they absord infrared radiation emitted upward by the planet.”

            Do you really wish to claim that GHGs like O3, H2O, CH4, CO2, etc. cannot absorb ULTRA-VIOLET radiation from the sun and other forms of radiation including some infra-red?

            Have a great day!

          • tonyM says:

            David A:
            You say: “Your science is all wrong. GHGs don’t don’t absorb solar energy, they absord infrared radiation emitted upward by the planet.”

            According to Wein’s Law the insolation has far more longwave radiation but somehow you claim GHG can differentiate between solar longwave and ground emitted longwave of similar frequency. No doubt we can extend the proposition to meaning they can differentiate also between atmospheric longwave emissions too. Poof goes the semblance of warming again.

            Wow, what powerful, selective, magical properties GHGs have according to your pseudoscience. Tell us the mechanism of this new physics.

          • David A. says:

            Do you really wish to claim that GHGs like O3, H2O, CH4, CO2, etc. cannot absorb ULTRA-VIOLET radiation from the sun and other forms of radiation including some infra-red?

            Yes — greenhouse gases do not absorb UV radiation to any climatologically relevant extent. (Ozone does.) They absorb in the infrared part of the spectrum.

            Come on people, this is basic physics.

          • David A. says:

            Tony, you are confused. There is very little longwave radiation in incoming sunlight. (See the Planck distribution.) To any extent there is, of course GHGs can absorb that. But the number is tiny.

          • JohnKl says:

            David,

            “Yes — greenhouse gases do not absorb UV radiation to any climatologically relevant extent. (Ozone does.)”

            Your previous post mentioned nothing about climatologically relevant extent, nor did I.

            “Come on people, this is basic physics.”

            Correct! We’ll expect more from you next time!

            Have a great day!

          • tonyM says:

            David A. says
            “Tony, you are confused. There is very little longwave radiation in incoming sunlight.”
            ……………
            You take me to task with your claim that solar infrared is minuscle. Then perhaps you can go advise Wiki where it goes wrong here:

            http://en.wikipedia.org/wiki/Infrared
            “Slightly more than half of the total energy from the Sun was eventually found to arrive on Earth in the form of infrared. “

            “At zenith, sunlight provides an irradiance of just over 1 kilowatts per square meter at sea level. Of this energy, 527 watts is infrared radiation, 445 watts is visible light, and 32 watts is ultraviolet radiation.[5] “

            Please let us know Wiki’s response to your objections!

          • David A. says:

            Your previous post mentioned nothing about climatologically relevant extent, nor did I.

            This entire blog is about what’s climatologically relevant!

            Why don’t you show us data for the CO2 absorption coefficients for its major line in the UV part of the spectrum, and compare it to that in the IR.

            Or, assuming this is trustworthy:
            http://wattsupwiththat.files.wordpress.com/2008/06/atmospheric_spectral_absorption.png

          • David A. says:

            “Slightly more than half of the total energy from the Sun was eventually found to arrive on Earth in the form of infrared.”

            And little of that is climatologically relevant.

            Wikipedia’s IR limits are 700 nm to 1 mm. That’s from 0.7 – 1000 microns.

            A 2010 paper by Li et al (including Judith Curry) says 12 W/m2 of the solar spectrum lies from 4-1000 microns.

            http://journals.ametsoc.org/doi/pdf/10.1175/2010JAS3282.1

            Now compare that to how much of the Earth’s spectrum (total: 390 W/m2) lies between 4-1000 microns — nearly all of it does. I’d have to do the numerical integral, but obviously the solar part is going much smaller.

          • David A. says:

            I did the numerical integral, and found there is 13 W/m2 of sunlight between 4 and 1000 microns, essentially the same result as Curry et al who found 12 W/m2.

            For the Earth, 385 W/m2 lies in that range — 99.9% of its radiation.

          • tonyM says:

            The issue was whether GHG’s absorb solar radiation. You claimed they did not.

            You said “GHGs don’t don’t absorb solar energy, they absord infrared radiation emitted upward by the planet.”

            Later you claimed the absorption was minuscle and referred to the region beyond 4 micron. You relied on the Li et al (Curry) paper which showed it (sun) only provided 12 watts/m2 beyond 4 micron.

            That is just plain lack of logic. By restricting it to this area you are eliminating the regions of much higher intensity and still in the infrared region where absorption by GHG’s does take place. Poor earth can’t radiate there – so eliminate the region is your solution! Very bright approach.

            Viz absorption:
            methane in the 3.5 micron region
            CO2 at 2.6 and 4 micron region (clearly there are shoulders)

            The plot for water vapor shows an absorption spectrum more complex even than carbon dioxide, with numerous broad peaks in the infrared region between 0.8 and 10 microns.
            (now that is H2O vapour but water itself, in various phases droplets, clouds etc, will have additional absorption)

            N2O even comes into play;
            The actual solar infra red absorption by the total atmosphere is very significant up 4 micron; NOT minuscule at all!! Go and look it up!

            Strange you refer me to a paper where that paper CLEARLY identifies this as an issue. Did you read it or simply stopped at the 12 W/m2 beyond 4 microns???

          • Kristian says:

            David, listen to me (and stop your ‘misunderstanding’ on purpose):

            The OCEANS absorb energy from the Sun, not the atmospheric GHGs (they also do, BTW, but that is another matter). I never said anything to that effect.

            I wrote: “Because how are the atmospheric GHGs supposed to, according to the hypothesis, to force a portion of the absorbed solar energy to remain in the bulk of the ocean thus making it warmer (increased OHC)?”

            How can anyone misinterpret this to mean the GHGs absorb the solar energy??!

            Have you even read Minnett’s explanation? The atmospheric GHGs are supposed to prevent the solar heat to escape the bulk of the ocean again AFTER having been absorbed, by reducing the temperature gradient through the surface layer.

            So then I said: “First the atmosphere must warm. Then the surface must warm as a result. And only THEN the OHC can start to rise as a result. If the cause of the rise is atmospheric GHGs.

            You know about the much referred-to Minnett explanation (RealClimate, 2006) of how the GHGs allegedly warm the ocean. They do so by first warming the skin layer so that the temperature gradient down through the surface layer to the bulk underneath is reduced. Then solar energy will have a harder time to get back out of the ocean and the OHC starts rising.

            But then we need to see a rise in surface temperature first.”

            I know you’re applying the tactic of not addressing the main point but rather a minor one, ‘misunderstanding’ it and pretending by answering your own straw-man to have ‘countered’ the entire post you’re replying to. It’s a well-known alarmist debate tactic and a quite transparent one at that …

            But here’s the main point again: The surface of the global ocean has NOT warmed since 1997. Meanwhile the global OHC has gone up a lot. This could not have happened if the cause of the OHC rise is increased CO2 in the atmosphere as per the mechanism proposed by Minnett.

            So please address this and stop evading the real issue.

          • David A. says:

            By restricting it to this area you are eliminating the regions of much higher intensity and still in the infrared region where absorption by GHG’s does take place.

            Which regions?

            Physics is about numbers. So let’s see your numbers.

          • David A. says:

            Viz absorption:
            methane in the 3.5 micron region
            CO2 at 2.6 and 4 micron region (clearly there are shoulders)

            OK, go ahead and lower the IR window to 2.6 microns.

            Do the integral for the amount of sunlight between 2.6 microns and 1000 microns.

            I know the answer. Let’s see yours.

          • David A. says:

            Kristian wrote:
            How can anyone misinterpret this to mean the GHGs absorb the solar energy??!
            Have you even read Minnett’s explanation?

            I didn’t say the first.

            I have no idea who “Minnett” is. Provide context, quotes and links if you want to be understood.

          • David A. says:

            Kristian wrote:
            The atmospheric GHGs are supposed to prevent the solar heat to escape the bulk of the ocean again AFTER having been absorbed, by reducing the temperature gradient through the surface layer.

            Bull. The surface and oceans don’t radiate at the solar spectrum (5777 K), they radiate at the Earth’s surface temperature (~14 C).

          • Kristian says:

            Hahaha, David Appell once again retreats to the “I’m stupid, I don’t understand what you’re saying” argument in order to avoid discussing the issue at hand.

            Well, at this point we can at least now be sure that Appell already knows he’s got nothing and is just flailing about.

            What a character …!

          • tonyM says:

            David A.
            If you want calculations I suggest you go do this all by yourself. Make sure to include all the various water droplet size distribution, ice particles and other enigmatic cloud features. Do ensure that different heights are taken into account. Whilst you are at it, do go beyond the elementary minimum six separate processes of direct normal incidence angle on water droplets.

            You say you have all the answers! Funny how you have not included water and the remainder of the infrared in the mix of your comments. Can we expect your definitive report perhaps in a day or so?

            The issue was YOUR claim that GHGs did NOT absorb ANY solar energy. Here is your statement:

            “GHGs don’t don’t absorb solar energy, they absord infrared radiation emitted upward by the planet. “

            Then after being pressed you morphed this into it was a tiny amount by reference to LI’s paper at up to about 1 Watt/m2 absorption beyond the 4 micron range. That is your after thought restriction even though the authors stated this still presents an issue at shorter wavelengths.

            I am more than happy comparing the graphical spectra (insolation and arrival at earth, omitting reflection) to be satisfied that large chunks are taken out by the atmosphere in the WHOLE infrared (where O2, N2 play almost no part) which is roughly 50% of the insolation. It certainly is a lot more than the “tiny” amount you concede. You should try it sometime; may be an eye opener.

            As you say Physics is about numbers; is that why you use the word “tiny” as a wriggle room number (except you caught yourself out by restricting it to beyond the 4 microns as that is not what the claims are about).

            It seems to me you just want to argue any point no matter how patently wrong you are. I suggest you go chase your own tail!

          • tonyM says:

            David A.

            As for your comment that “little of that [all infra red] is climatologically relevant” would you like to tell us that they have no effect on inversions in say the Arctic and no effect on lapse rate maintenance.

            Additionally any infra red insolation which is absorbed is a net absorption of new energy. Any absorption from the earth radiation is not new. Back radiation has no effect in increasing the surface as it cannot be thermalised there.

            I imagine your statement can also mean if the incoming infrared was reflected instead of absorbed it would also have no climatic effect given it has little to begin with.

            You have strange ideas indeed.

            Ah I see you have the wriggle room factor again. Given you say Physics is about number what exactly is the “little” effect – please, in exact numeric form as you demand?

        • David A. says:

          Besides diffusion, gigantic ocean currents carry heat down into the ocean.

          There simply is no other known cause that can explain the ocean warming of the last several decades.

          • Chris says:

            David A,
            If you are convinced that the heat is going into the deep oceans, and you are also convinced that this is a future problem, then you must also accept that the climate changes over the last century could also be due to events that took place a thousand years ago, and those events have been buried in the deep oceans ever since until now.

            The explanation that the heat is going into the deep ocean and will come out later, essentially allows any heating or cooling event to be explained by events unknown a thousand years ago, and makes AGW due to CO2 an even less plausible theory than it is already.

          • David A. says:

            If you are convinced that the heat is going into the deep oceans, and you are also convinced that this is a future problem, then you must also accept that the climate changes over the last century could also be due to events that took place a thousand years ago, and those events have been buried in the deep oceans ever since until now.

            The heat in the deep ocean is increasing, not, if it were somehow responsible for all the other warming, decreasing. See the calculation of Balmaseda, Trenberth and Källén here:

            http://davidappell.blogspot.com/2013/03/missing-energy-claimed-to-be-found.html

          • Chris says:

            David A, I suppose you missed the point.

            You believe that the heat has gone into the ocean and will at some point come back out. I will not agree or disagree.

            But now you must also agree that recent climate events could be due to events that happened a thousand years ago.

            Now every climate event could be attributed to events that happened centuries ago.

            You cannot argue the first point without agreeing to the second.

            This weakens the AGW theory, as you have now provided an alternative theory to AGW itself, while attempting to prop it up.

          • David A. says:

            Chris, the ocean is gaining heat, not losing it. So is the lower atmosphere.

            So your hypothesis is wrong.

            Besides, there is every expectation for an enhanced greenhouse effect. And not surprisingly, we’re seeing warming everywhere.

          • Chris says:

            David A.

            Your theory provides an excellent alternative theory to AGW based on CO2.

            One can argue all you like about the current situation, but if your hypothesis is that warming of the deep oceans will eventually cause an air surface temperature crisis, then the warming in the late 20th century can similarly be blamed on events from a thousand years ago.

            Your theory is only creating more uncertainty as to the cause of recent climate changes. If you can argue your case well enough, and explain how the heat can come back out you could easily argue the case for no AGW at all.

            The AGW case is already weak enough without this type of argument adding to the uncertainty.

          • Kristian says:

            Uhm, yes there is. Solar energy goes into the oceans. From there it then needs to go out again, over time, at the same rate. Otherwise it would start to accumulate.

            Well, cloud cover determines to a very large extent how much solar goes INTO the oceans. And winds determine to a very large extent how effectively the energy goes OUT OF the oceans through evaporation.

            The coupled ocean-atmosphere processes of the global ocean basins control to a very large extent the cloud cover and the winds (pressure systems) in those very basins.

            The process of ENSO alone administers by far the largest reservoir of solar energy on the globe (you know of course that the energy from the Sun is mainly absorbed by the Earth system in the tropical/subtropical oceans). And by administering it, it essentially controls the Earth’s climate. It also essentially controls how fast the energy goes OUT OF the oceans compared to how fast it comes INTO them. By controlling cloud cover and winds. Of course it’s got ‘helpers’ in the other ocean basins outside the Pacific, but ENSO (the tropical/subtropical Pacific Ocean) is always pulling the strings.

          • Kristian says:

            My post above, BTW, was in reply to this statement by David Appell:

            “There simply is no other known cause that can explain the ocean warming of the last several decades.”

          • David A. says:

            Kristian wrote:
            From there it then needs to go out again, over time, at the same rate.

            If energy enters the ocean at a certain rate, and then leaves the ocean at the same rate, the ocean will not warm on average.

            Obviously.

  23. ClimatePete says:

    Here’s another perspective on the UAH 5.6 data. It consists of a set of linear regressions of 12-month smoothed data for varying dates from 1979 to 2013.

    Effectively it shows the warming from the given date to the July 2013 (last smoothed date available). From 2009 onwards the graph is not displayed as the random short-term temperature variations over four years or less cause it to oscillate wildly.

    http://theeestory.com/files/UAH5.6WarmingLinearRegressions.jpg

  24. David, Joe D’ ALEO and other folks such as DON EASTERBROOK have AGW pegged for what it is, which is a fraud.

  25. Hot Potato says:

    Alex said: Do not hesitate and don’t go inside to get your valuables. Just start running for the hills.

    So true. But then, all the trees will be dead and the hills will be denuded so even the hills won’t be a safe place. The oceans will be boiling and don’t forget all those nuclear power plants. Maybe see a grief counselor instead?

    http://guymcpherson.com/2014/01/picking-cherries/

    With an eye to improving my “bedside manner” when I deliver presentations, I’ve recently become a certified grief-recovery counselor. A brief summary of the program, which I learned about from a contact on Facebook, is here.

    I was extremely impressed by the workshop. In fact, I told the facilitator it was about a thousand times better than I expected halfway through the first of four emotionally wrenching days. The facilitator was among the best teachers I’ve ever seen.

    I can’t write better satire than this. My definition of the Singularity is when reality and satire merge. I think we’re there. Satire is redundant, or reality is. And that’s a pity because satire is my stock in trade. A reporter is now a satirist by default.

  26. David, time is telling us as each month passes by that the models forecast for ever increasing global temperatures is not taking place.

    • David A. says:

      Salvatore: What is 4 years ago, or 3, that you predicted cooling would arrive imminently? Or do you just cut-and-paste the same prediction in every month?

  27. Murray Allan says:

    Just remember why we all talking about this, Algore was at Harvard in a class long ago and heard the CO2 theory from his professor Rivelle. Suddenly, in 2005 he is doing his level best to scare the crap out of everyone weak-willed who would listen. He said CO2 would heat the earth, fast, and it was your fault for the way you live. He failed to mention there were 7.3 billion people on earth now, versus only 4 billion in 1975. He failed to mention the earth was cold in 1850 and a natural recovery to some warmth would make sense. In 2005, Algore could already see the temperature had not risen in 8 years, even at that time. Now we are over 17 years in and there is no way the earth is as remotely sensitive as he scared a generation into believing. Its effect is unknown, it is clear.
    It is the hypocrisy that kills me. Does Gore or Mann use any of the 1000+ oil synthesized items out there or do they shun them? Toothpaste, toothbrush, mouthwash and toilet seat are from oil and the list goes on and on. Electric car? Each tire required 8 gallons of oil to make.

    • JohnKl says:

      Thank you Murray Allan,

      One should note most every vehicle created today is filled with plastic (especially Nissan interiors). 3-D printed batteries use plastic, not to mention the plastics used in most every car battery container I’ve seen. Then there’s the environmentalist auto dream of the future the FUEL CELL! Where will they get all that hydrogen dream-fuel? Most likely it will come from the same methane (CH4) from natural gas (80% methane) that people have burned for years. Their is of course the newly arrived Ford solar-hybrid concept car. Yet again we’ll find hydrocarbons used in this technology as well.

      It’s amusing to watch otherwise somewhat sentient beings spending an inordinate amount of time and energy trying to avoid one of earth’s most common elements CARBON! Try as they might it always manages to sneak it’s way into everything we humans do. It must be particularly annoying to be a carbon based life-form with an inordinate fear of a basic element required by it’s very nature, without which our lives would be impossible. However annoying for them, it gives the rest of us many belly-laughs!

  28. david dohbro says:

    linear regression (y = ax + b) statistics on UAH data (version 5.6 until Dec. 2013) where y is time, and x is temperature anomaly. The a and b values are rounded to 2 decimals since the temperature data is 2 decimals; e.g. the 10yr slope calculated at 0.0086 becomes 0.01, and the 15 yrs slope calculated at 0.0143 becomes 0.01. Rounding is necessary since there is no data available about the 3rd or 4th decimal.

    last 5yrs: y = -0.01x + 20.64 (r2 = 0.01) NOT SIGN
    last 10yrs: y = 0.01x – 11.74 (r2 = 0.01) NOT SIGN
    last 15yrs: y = 0.01x – 28.59 (r2 = 0.15) NOT SIGN
    last 20yrs: y = 0.01x – 28.21 (r2 = 0.19) SIGN
    all years: y = 0.01x – 27.64 (r2 = 0.39) SIGN
    since ’98 el nino peak: y = 0.01x – 17.05 (r2=0.05) NOT SIGN

    Although statistically not significant the past 5 yrs show a negative slope, whereas all other time intervals including the entire data set show the exact same positive slope of 0.01. Note that only the slopes over the past 20 yrs and more are statistically significant. This is mainly due to the low n for the smaller time-frames and the high variability of the data (e.g. time can only explain 1% of the variation in temps over the past 10yrs…)

    There is therefore no change in the warming rate over the past 10, 15, 20 or 35 yrs, only over the past 5 yrs, and warming is therefore NOT accelerating as some pundits say. It can even be argued if there has been any warming over the past 10yrs or since the 1998 el nino. However, the data record is too short allowing for none significant test results.

    There has been warming over the past 20yrs and since 1979.

    • david dohbro says:

      ps: I forgot to add that the UAH temperature record doesn’t show (i.e. cannot say) using linear regression*, if there has been any warming or not over the past -at least- 15yrs or less. The slopes are statistically not significantly different from 0. Hence, neither a claim of warming or cooling over the -at least- past 15 years or less can be made using this regression technique; and as such the only scientific valid conclusion that can be drawn, using linear regression, is that over the past -at least- 15yrs or less the UAH shows temperatures have remained constant. That’s all there is to it.

      *drawing a linear regression line through none-linear, stochastic and chaotic data is a big fat statistical nightmare and no-no. It simply is not allowed…! But people do it anyway… all the time. Bad, bad, bad. NEVER, EVER DO THAT PEOPLE!!!! You will produce garbage results. None-linear, stochastic trend analyses is the way to go. This type of analyses shows cooling since 2007 in GISS, HadCRut3, 4 and NCDC’ data set. The UAH and RSS datasets are still too short for such kind of analyses.

      • ClimatePete says:

        If you do a linear regression over a number of years and the least-squares fit has a slope of, say, 0.17 degrees C per decade, then it is just as likely that the warming is, in fact 0.34 degrees C per decade as that there is no warming at all. But the most likely proposition is that the warming is 0.17 degrees C per decade, because that is what the linear regression has showed.

        If you assume the Lean and Rind decomposition of AGW temperature increases, as in this chart http://theeestory.com/files/AGWleanmodel.png then although the ENSO (El Nino) component can fairly be described as non-linear and stochastic, that is the only one of the four contributions which is. Solar radiance is cyclic and volcanoes are random but with only short-term effects. But the AGW signal over a timescale of decades is what the linear regression is evaluating, so it is fair to use the technique.

        The claim that you should not use linear regression on temperature trends is a circular argument because it assumes in the first place that there is no AGW signal which is steadily increasing with time, which is the proposition we are trying to test for.

        And if the processes were to be completely non-linear stochastic processes, then a good way to analyse would be to run an ensemble of computational models fed with different random number sequences. But you know what that is beginning to look like!!!

    • Nick Stokes says:

      Firstly your argument for rounding the slopes is obvious nonsense. The choice of time interval is arbitrary. You can say, 0.86 °C/century for 10 yrs and 1.43 °C/century for 15. There you are – 2 dp.

      “the only scientific valid conclusion that can be drawn, using linear regression, is that over the past -at least- 15yrs or less the UAH shows temperatures have remained constant”

      This is also complete nonsense. The observed trends are what you calculated. That’s what happened.

      You can ask the question, given the observed variability, if there really wasn’t a trend, might that have arisen by chance? Given certain assumptions about the nature of the variability, the answer may be yes.

      But you can equally ask, if the trend had been 2°C/century, could the observed trend have arisen by chance. The answer again is yes. There is an equally good base for saying that the trend is 0°C/cen or 2°C/cen.

      It’s a failed statistical significance test, and there is nothing to be inferred. All we know is that the observed trend over 15 years is 1.43°C/cen, which is pretty much what AGW predicts. It doesn’t prove AGW, but it is consistent with it.

      • david dohbro says:

        nick, one of the basics of math and statistics is that if your data set is say 0.2, 0.3 and 0.4, you can’t state the average is 0.30. You have to state it’s 0.3 because you have NO information about the 2nd decimal. If you had a more accurate measurement technique it may well very have measured 0.21, 0.32, 0.43; which would produce an average of 0.32. But, you don’t know those 2nd decimals since your technique can’t measure it. Manipulating the data to a per/decade trend (multiplying by 10) doesn’t solve that issue because you still have NO information about that 2nd decimal.

        Then you go own to say that my statement “the only scientific valid conclusion that can be drawn, using linear regression, is that over the past -at least- 15yrs or less the UAH shows temperatures have remained constant” is complete nonsense; because “The observed trends are what you calculated. That’s what happened.” First, thanks for being so condescending… Second, those trends are statistically not significant, so you can’t say anything about them. Therefore you can only conclude that temperature has remained constant since you have no statistics to back up a claim of an increasing or decreasing slope. The null-hypothesis (that there is no relationship [slope = 0] between two measured phenomena) is validated: neither warming nor cooling.

        Pete: “[My] claim that you should not use linear regression on temperature trends is a circular argument because it assumes in the first place that there is no AGW signal which is steadily increasing with time, which is the proposition we are trying to test for.” My claim has NOTHING to do with if there is AGW or not. It has EVERYTHING to do with applying the right statistics for the right type of data. You also assume AGW is steadily increasing over time in your statement. So who’s doing the circular arguments here!?!? I made no claim what so ever if AGW existed or not, just calculated the trends.

        Applying the right statistics is the fundamental question I am addressing here. Not if there is AGW or not. For example, if your data is log normally distributed you can’t do “normal” statistics. You either first transform the data to a normal distribution and then do “normal” statistics, or you use none-normal statistics on the raw data. That’s all there is to it. So if your data is none-linear how can you then do a linear regression?!!??! THAT’S the issue at hand. Climate data is none-linear (chaotic), cyclical, and stochastic. Where does linear-regression fit into this??? E.g. try drawing a linear regression line through a sinus wave. Makes no sense.

    • David A. says:

      Your x’s and y’s are mixed up — the independent variable (x) is time, and the dependent variable (y) is the temperature anomaly.

    • David A. says:

      You’re also not calculation statistical significant correctly — for that you need the uncertainty in the slope. See Tom Wigley’s document

      “Statistical Issues Regarding Trends”
      http://nimbus.cos.uidaho.edu/abatz/PDF/sap1717draft37appA.pdf

  29. Werner Brozek says:

    It may not be updated yet for January 2014, but the following gives January 1996 as the earliest date for warming that is not statistically significant for UAH:
    Temperature Anomaly trend
    Jan 1996 to Jan 2014 
    Rate: 1.215°C/Century;
    CI from -0.007 to 2.437;

    http://moyhu.blogspot.com.au/p/temperature-trend-viewer.html?Xxdat=%5B0,1,4,48,92%5D

  30. ßri says:

    Dr Roy I have a question:
    We have had snow on the ground for 7 of the last 9 weeks and for the last decade the opposite was true. Now this could just be a local event but from the news it appears to be all over the Midwest/eastern US.
    Dose this effect the heat balance and is the effect short term or delayed.
    ßri

  31. ßri says:

    I would like to point out to those debating the temperature graph that it is a tool and should be used for understanding not name calling. If you want the graphs to look like there is no warming change it to absolute temperature and if you want the opposite change it to +/- .3 deg.
    Both are just tricks to fool yourself and “you are the easiest one to fool”. (Richard Feynman)
    ßri

  32. Martinitony says:

    Assuming that CO2 spreads itself out fairly evenly across the planet, why then is the change in temp so much less in the tropics and southern hemisphere? As a lay person here, I would be suspicious of heat island effect and placement of data collectors since there are so many more manmade structures in the northern hemisphere. Am I being naive?

  33. DocRichard says:

    JohnKL

    Thanks you for taking a look at my blog, and for your response.
    You may have missed this page: http://greenerblog.blogspot.co.uk/p/about-this-blog.html

    I won’t take up too much space here, there is no point in covering the same ground time and again. The reference to flooding is because the Jet Stream has been parked over Spain for the last 6 weeks, bringing a succession of unprecedented storms, and my county, Somerset, has
    receive this January 3 times the rain it should have done, so that whole villages have been evacuated. Not complaining, I know you have had worse, but it is causing some people to reflect. Not everyone, I grant you.

    Cheers

    Richard

  34. rossbrisbane says:

    The rising temperatures are creating extraordinary evaporation rates over Western parts of continental Australia. Drought after so much rain (all at once downpours) with follow up record heat waves in A non- EL Nino era has Australia drying up at record rates.

    • Bill Sparling says:

      Ever consider looking at your water usage practices for the real culprit? Oz’s ground water has been seriously depleted, natural vegetation is likewise vanishing. Get your own house in order before demanding changes from others.

  35. Jack Lacton says:

    Dear David A,

    Please point to the empirical experiments that prove what the amplification figure is for a doubling of CO2.

    If you can’t then it’s all astrology.

    Cheers
    Jack

  36. bernie says:

    Using the correct weights for land and ocean in different parts of the world, the average calculated from the detailed UAH data is

    “average” for January 2014 = + 0.24, not + 0.29!

  37. dan says:

    ” + 0.24, not + 0.29! ”

    Fair enough. I remember somebody giving the corrected weights a few months ago – she had had the temerity to look at the Atlas!

    But, Forsooth! These corrections are absurdly trivial, aren’t they? Such obsessions about nothing at all! It smacks of beer-fuelled arguments about sports averages – or of the Madhouse.

  38. Gordon Robertson says:

    @David A “Your classic cherry pick — picking a starting year because it gives the result you want”.

    No cherry pick. 1997 was the first year the UAH temperature data broke into the ‘true’ warming level. Prior to 1997, the data had featured negative anomalies based on the 1980-2010 average.

    UAH has explained that cooling effect as due to volcanic aerosols. After the 1997/98 El Nino, there was a cooling spell right after it then the warming increased nearly 0.2C in 2001. The El Nino spike is actually quite severe and should raise the average, much to an alarmist’s advantage.

    The thing to note is that the overall trend from 1997 – present has been very close to 0.

  39. Michael Twomey says:

    Dr. Spencer,

    Your blogpost says that the January 2014 global anomaly was +0.291, but the UAH dataset at uahncdc_lt_5.6.txt (Lower Troposphere) says 0.30. One of them should be corrected, no?

    Thanks for your blog and work.

    Best,
    Michael

  40. GMH says:

    Certain individuals on this blog need to take an updated course in physical chemistry, although from what I’ve seen, I’d doubt they could make it through the simplest differentials.

    CO2 absorbs and re-emits photons at two major wavelengths. These are vibrational modes of absorption that obey quantum electrodynamic behaviors. You know, the same rules that all those busy electrons follow as they travel through the various gates of solid state circuitry. That increased CO2 results in an increase in system heat latency is merely fact. With isotopic abundance plots we can state at a greater than 95% confidence level the increase in CO2 that has taken place was mainly produced by fossil fuel combustion processes associated with man’s activities.

    The temperature increase we’ve seen in the instrumental record represents an enormous amount of energy added to the the planet’s tropospheric volume. Take the entire energy usage of the USA for any one of the last ten years and multiply that number by 4 X 10^6 years and you will have a product that equates to the total energy required to raise the entire tropospheric volume a single degree F.

    Now, please direct me to any validated proxy data that shows a 100 PPM CO2 increase over a 150 year period. How about you show me any proxy data where the CO2 has increased 100 PPM in less than 5,000 years. How about 20,000 years? Considering the enormous volume of the system in question, and the unprecedented rate of CO2 increase, temperature will lag CO2. It can only lag over such a short time scale as an increasing signal plotted against the various planetary heat sinks. That is consistent with thermodynamics.

    Now, do you geniuses have any concept as to how much energy 100 ppm of CO2 adds to the troposphere for even a single day at say perihelion or aphelion of our planet’s orbit around the sun? This is something any undergraduate chemistry student could figure out after his/her 2nd year. A few could get it right as high school seniors. Can you?

    The underlying mechanism that is forcing an increase in global temperatures is an increase in concentration over time, otherwise known as rate. Individuals who arbitrarily use starting points above trend lines to make an argument based on 10 or 20 years are not performing meaningful science. They are deliberately ignoring the entire issue of rate of increase in CO2 to make the numbers fit their existing views.

    • Wilco Wayne says:

      GMH: Here’s the calculations for you: Heat Stored by 381 ppmv (0.00069 Kg) of CO2:

      q = m (Cp) (ΔT) (Potter & Somerton. 1993. Page 58) (For a no equilibrium process with Cp rel. constant)

      Introducing magnitudes:

      q = 0.00069 Kg (871 J/Kg*K) (0.01 K) = 0.0060099 J; rounding the cipher, 0.00601 J.

      0.00601 J, which will cause a change of temperature of:

      ΔT = q /m (Cp)

      ΔT = 0.00601 J /0.00069 Kg [871 J/Kg*K] = 0.00601 J / 0.60099 J*K = 0.01 K; or 0.01 °C;

      Let’s apply the formula related to the heat transfer by radiation from hot sources of heat:

      Q = e σ A (Te ^4 – Ts ^4)

      Where Q is the radiated power, e is the emissivity of the emitter system, A is the radiating area, Te is the temperature of the emitter, and Ts is the temperature of the surroundings.

      The known values are:

      e of soil at 299.65 K and 1 atm = 0.7 in average (e is a unitless coefficient)
      σ = 5.6697 x 10^-8 W/m^2*K^4
      A = 1 m^2
      Tr or T of soil = 300.15 K [(300.15 K) ^4 = 8116212154.05 K^4]
      Tc or T of air = 299.65 K [(299.65 K) ^4 = 8062266098.565 K^4]

      Introducing magnitudes:

      q = 0.7 (5.6697 x 10^-8 W/m^2*K^4) (1 m^2) (8116212154.05 K^4 – 8062266098.565 K^4) =

      0.7 (5.6697 x 10^-8 W/m^2*K^4) (1 m^2) (53946055.485 K^4) = 2.141 W

      2.141 W = 2.141 J/s

      2.141 J/s is the rate of heat transferred from the soil to the atmospheric CO2.

      2.141 (J/s) (1 s) = 2.141 J

      From this amount of energy, the carbon dioxide absorbs only 0.002 * 2.141 J = 0.0043 J

      Equivalence in change of temperature (ΔT):

      ΔT = q/m (Cp)

      Introducing magnitudes:

      ΔT = 0.0043 (J)/0.00069 Kg (871 J/Kg*°C) = 0.006 (J)/0.60099 (J/°C) = 0.007 °C The thermal energy stored (the heat being stored and removed from any system by radiation) by 0.00069 Kg/m^3 of CO2 is equivalent to 0.007 °C.

      Converting to 100ppmv CO2 then = 0.001837 deg C

  41. Thi_t k_ website bn hng v web cng ty tr_n gi 1,8tr gi r_ nh_ng __y
    __ tnh n_ng v chu_n SEO chuyn nghi_p
    t_i tphcm, t_ng hosting, b_o hnh tr_n __i

  42. Hello, I think your blog might be having browser compatibility issues.
    When I look at your blog site in Safari, it looks fine but when opening
    in Internet Explorer, it has some overlapping.
    I just wanted to give you a quick heads up! Other then that, fantastic blog!

  43. Hello there, just became alert to your blog
    through Google, and found that it is really informative.
    I’m going to watch out for brussels. I will be grateful if you continue this in future.

    A lot of people will be benefited from your writing. Cheers!

Leave a Reply