It seems more than appropriate that the Gore Effect might be in full swing in NYC on Sept. 21 when climate hand-wringers from around the country gather to protest the world being maybe a full degree warmer than it was 100 years ago.
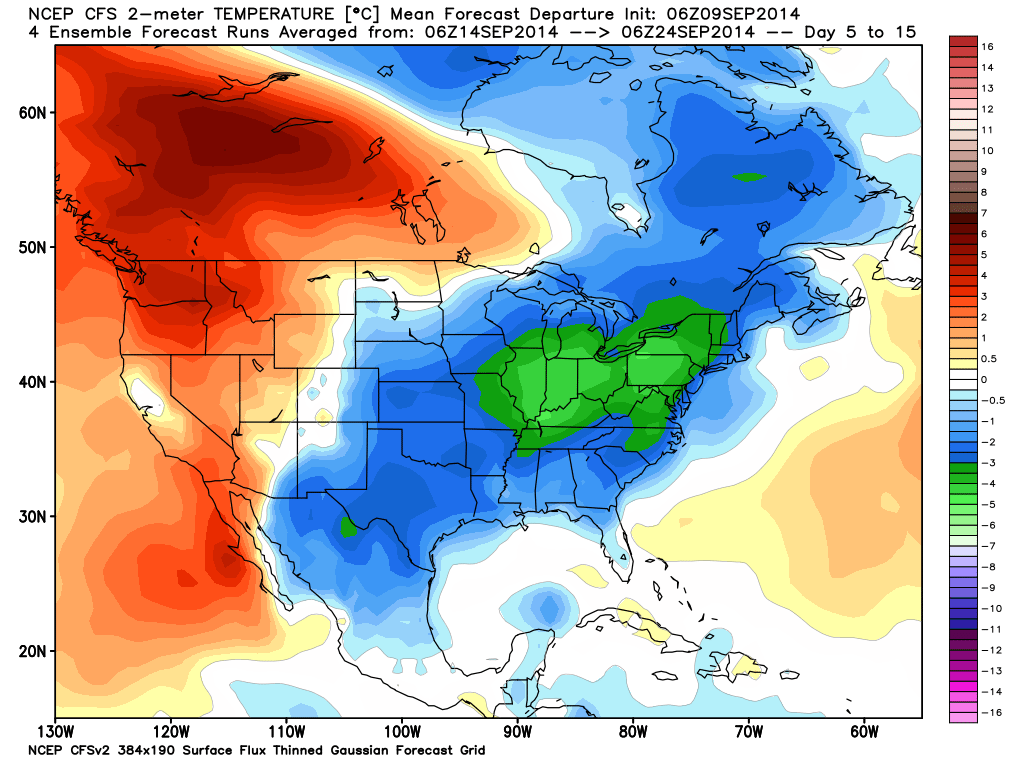
The latest Climate Forecast System forecast for the 10-day period around that blessed event (12 days from now) shows the eastern U.S. pretty dang chilly, with temperatures averaging 8-10 deg. below normal (Plot courtesy of WeatherBell.com):
Of course, now that cold weather is also the fault of global warming the participants can complain about that, too.
How confusing for the carbophobes
They’ll just torture the logic to get the answer they want without even breaking stride. SOP.
Not at all confusing. A cold patch covering about 0.5% of the Earth’s surface is evidence of nothing. One might look up and to the left on the plot and note that Yellowknife will be about 12 deg. (F, as the doctor uses) above normal in the same period.
I think you may be slaying a straw man of your own creation. Say what you want about my observation (about 17 years of global “pause”), but RWS’s post was about irony (the Gore Effect).
Warmistas have no sense of humour and certainly do not appreciate irony.
Well, then I certainly cannot be labeled a “warmista” since I very much appreciate irony; “Gore Effect” events always bring a smile to my face.
To Jim Curtis: I was replying to oldbrew’s post, not commenting on the Doctor’s post.
Slipstick,
Not so sure about Yellowknife being super warm in the next few days. This long term forecast shows cooler than normal for this area.
http://www.accuweather.com/en/ca/yellowknife/x1a/september-weather/49534
Interestingly, from the same site, NYC shows almost no deviation from historical averages during the same period.
http://www.accuweather.com/en/us/new-york-ny/10007/september-weather/349727
I’m not certain what the departure plot the Doctor posted is departing from.
Same pattern for a year as warm pool of water in North Eastern Pacific continues to exist, helping to cause ridging in the western U.S.A and a trough in the central and eastern U.S.A
I think this pattern will continue going forward.
Precisely. It will last for sometime.
Us see forecast pressure in the lower stratosphere for 10 days.
http://www.cpc.ncep.noaa.gov/products/stratosphere/strat_a_f/gif_files/gfs_z100_nh_f240.gif
Low pressure center (polar vortex) will be above Hudson Bay. There will be no warm in the east.
If not for the farmers I would hope it snows on their parade. First they said they had it figured out. Their models have it nailed. Temperature would go up with CO2. Then when the temp didn’t do as they said they denied that there was a “pause”. Now, a decade later, most seem to admit that there is a “pause” or it seems now the preferred word “Hiatus” but all of a sudden by some magic they claim that they have models that have now been adjusted to predict the “Hiatus”.
And then we have our president and his team that still denies that the global temperature trend has gone flat for almost 18 years.
And not a one will ever be held accountable for all this needless and expansive BS.
No, and the most torturous part is it will never get reported by the mainstream media.
That is, they’ll never be held accountable by the MSM. It will never get reported.
Yes the legacy press have proven themselves to be masters at avoiding the obvious and amplifying the trivial.
‘…the preferred word “Hiatus”…’
I think it is appropriate.
It is from Ancient Greek, where it meant “yawning hole”.
Because of the 60 year cycle (superimposed on a ~1000 year cycle) it is not appropriate to compare a period of 100 years. Any trend should be taken over periods which are multiples of 60 years. When you do this you find that the rate of warming was about 0.6 degree/century 100 years ago, but has now declined to about 0.4 degree per century because we are approaching the maximum in the 1000 year cycle in about another 100 years time. After that we should expect 500 years of cooling.
As I have explained in another comment (and three years ago on my first climate website which I can’t give you the URL for here) there is a very strong correlation between natural climate cycles and the inverted plot of the scalar sum of angular momentum of the Sun and nine planets. All the carbon dioxide in the atmosphere does nothing but cool by about 0.1 degree as shown in my book “Why It’s Not Carbon Dioxide After All.”
Dear Roy Spencer, Ph.D. and others:
In his book Weather and Climate (W. W. Norton, 1966) R. C. Sutcliffe wrote: “… one cannot explain the broad features of world climate if one does not know the actual mechanisms involved.” [pp 138].
Roy, your blog is supposedly about world climate. This is an experiment. The question is: How long can you ignore what R. C. Sutcliffe and Richard Feynman wrote? (I first tried to bring this to your attention in a comment which I submitted 8/25/14 at 9:38 PM). Both of these scientists were recognized as eminent scholars in their field at the time they wrote. Yet, it seems that many have failed to consider what they wrote and was published in 1963 (Feynman) and 1966 (Sucliffe).
The following are excerpts from pages 32-8,9 of The Feynman Lectures On Physics (Addison-Wesley, 1963). “One interesting question is, why do we ever see clouds? Where do clouds come from? Everybody knows it is the condensation of water vapor. But, of course, the water vapor is already in the atmosphere before it condenses, so why don’t we see it then? After it condenses it is perfectly obvious. It wasn’t there, now it is there. So the mystery of where clouds come from is not really such a childish mystery as “Where does the water come from, Daddy?,” but has to be explained. We have just explained that every atom scatters light, and of course the vapor will scatter light, too. The mystery is why, when the water is condensed into clouds, does it scatter such a tremendously greater amount of light.? … That is to say, the scattering of water in lumps of N molecules each is N times more intense than the scattering of the single atoms. So as the water agglomerates the scattering increases. Does it increase as infinitum? No! When does this analysis begin to fail? How many atoms can we put together before we cannot drive this argument further? Answer: If the water drop gets so big that from one end to the other is a wavelength or so, then the atoms are no longer all in phase because they are too far apart. So as we keep increasing the size of the droplets we get more and more scattering, until such a time that a drop gets about the size of a wavelength, and then the scattering does not increase anywhere nearly as rapidly as the drop gets bigger. Furthermore, the blue disappears, because for long wavelengths the drops can be bigger, before the limit is reached, than they can be for short wavelengths. Although the short waves scatter more per atom than the long waves, there is a bigger enhancement for the red end of the spectrum than for the blue end when all the drops are bigger than the wavelength, so the color is shifted from the blue toward the red.”
The following are excerpts from Sutcliffe’s book. “It would be difficult to overstress the importance of clouds as the necessary intermediary between invisible vapour and falling precipitation upon which all land-life depends, but their importance by no means ends here. Clouds which do not give rain, which never even threaten to give rain but which dissolve again into vapour before the precipitation stage is ever reached, have a profound effect on our climate. This is obvious enough if we only think of the difference between a cloudy and a sunny day in summer or between an overcast and a clear frosty night in winter. Taking an overall average, about 50 per cent of the earth’s surface is covered with cloud at any time whereas precipitation is falling over no more than say 3 per cent. Non-precipitating clouds are thus the common variety, rain clouds are the exception. The climatic importance of clouds lies in their effectiveness in reflecting, absorbing, transmitting, and emitting radiation, … Long-wave radiation from the earth, the invisible heat rays, is by contrast totally absorbed by quite a thin layer of clouds and, by the same token, the clouds themselves emit heat continuously according to their temperatures, almost as though they were black bodies.” [pp 33,34]
You have a choice: Do clouds reflect and absorb electromagnetic radiation (light) or do they scatter it?
Best wishes, Jerry
Clouds absorb and emit IR, reflect and slightly absorb visible. Don’t know what your point is. I have a long history of advocating that clouds are probably the biggest uncertainty in climate change forecasts.
Roy,
Second time you have stated: “Don’t know what your point is.” Are you saying that Feynman wrongly taught Caltech students? If high, thin, cold clouds can nearly totally absorb the IR being emitted from a much warmer earth surface, how do they totally emit this absorbed radiation as if they were near black-bodies at their significantly colder temperatures? I see some inconsistency.
Jerry
Jerry. It’s not just all about radiation. At the surface of Venus, and especially at the base of the nominal Uranus troposphere there is virtually no direct solar radiation getting through. Likewise, a region on Earth may have many days of intense cloud cover. How then does the Earth’s surface stay at a reasonable temperature? The answer lies in the non-radiative transfer of thermal energy which is restoring thermodynamic equilibrium, as the Second Law of Thermodynamics says will happen. This is the 21st century new paradigm in understanding temperatures in all planetary tropospheres, surfaces and sub-surface regions. There’s much more to climate than meets the eye. And there’s much more than the false GH “fissics” promulgated even to young school children. If that’s not brainwashing, what is?
Doug,
Can you deny that there most be some sort of balance between solar energy absorbed by the earth-atmosphere system and that eventually emitted from the earth-atmosphere system to space?
Jerry
No – what’s your point? All this is acknowledged and used in the hypothesis in my book. Get back to me when you understand what I’ve written therein.
Roy
the single day , the 21st is forecasted to be 4 above normal in NYC on GFS and ECMWF This is a 10day forecast, a product of the major cold several days before, but the day of the parade single day temps are quite warm. As you know in any given cold or warm period, there can be a a day or two of opposite. Would not push this issue, as it should warm quickly in ne after 19th or 20th
Polar vortex does not move with so fast.
http://www.cpc.ncep.noaa.gov/products/stratosphere/strat_a_f/gif_files/gfs_z70_nh_f240.gif
Blockade ozone would last.
http://www.cpc.ncep.noaa.gov/products/stratosphere/strat_a_f/gif_files/gfs_toz_nh_f00.gif
Dr Spencer said, “might be [cold]” – typical weatherman caution.
Joe, yes, except…a 12 day forecast can easily be off a day or 2, right? So, that far out it’s useful to look at the general trend, whether it’s a cool or warm pattern. In the days before and after the day of interest.
It will be fun if the Emergency Services have to wrap them in aluminium-foil, rescue-blankets.
So Roy, here’s a question you can’t answer:
In the afternoon of a warm sunny day the surface temperature at some location on Earth may well cool by, say, 2 degrees per hour. Let’s say the next three days have intense cloud cover all day long, so not a ray of sunshine strikes the surface for 72 hours. Does the surface cool by 72 x 2 degrees? Of course not. But, suppose the clouds are 3Km above at a temperature that is initially 20 degrees colder than the surface. No amount of radiation from the clouds is going to stop the surface cooling down to the same temperature as the clouds. But it doesn’t. The 20 degree temperature difference is maintained. But how does the surface receive an energy input to offset the energy losses which we know it could experience and cool by 2 degrees per hour? The answer is in my book.
I live right in the middle of the large green spot centered on Indiana on the Weather Bell map where temps are forecasted to be about -6 under average. Though at this time the corn and soya beans look great here I’m wondering what would be the effect on yields this late in the season cold snap will have.
In my little corner of the earth we’re in the tomato harvest time. Red Gold, one of the countries larger producers of tomato products seems to be taking a little bit of hit. Fewer trucks. I guess the problem is simply not enough warm days for a premium crop. I notice my neighbors large garden still has a whole lot of good sized tomatoes that are green as can be even though they’ve been well cared for and have had plenty of water. Normally they would be done by this time.
If the weather becomes really nasty, this huge march will turn into only a few pathetic souls in parkas waving weather soaked global warming signs and looking ridiculous..
no matter what the weather and no matter how small the gathering you can be sure that some talking heads will hype it.
Thanks, Dr. Spencer, for showing this CSF model plot.
I think it was mentioned in Joe Bastardi’s Saturday Summary September 6, 2014, at http://www.weatherbell.com/saturday-summary-september-6-2014 (free).
Polar vortex at an altitude of about 17 km. Forecast on 15.09.2014.
http://earth.nullschool.net/#2014/09/15/1800Z/wind/isobaric/70hPa/orthographic=-85.84,62.50,419
This is now exactly the pressure distribution in the lower stratosphere over the polar circle. Current increase in solar activity will accelerate the jet streams in the stratosphere.
http://oi62.tinypic.com/2mrd36q.jpg
Low pressure pattern is similar to the previous year.
And yet global ssta are smashing records. Weatherbell CFS shows a 0.212C+ anomaly. A couple posters on americanwx have found that GISS is typically 0.55C higher then CFS.
So that means so far September is running roughly at a 0.77C+ pace on GISS.
The warmest September on GISS is from 2005 at .74C.
For the year Hadley, GISS, and NCDC are on pace to tie or break their records.
As well as crush their records for a neutral enso year.
Even more impressive is that we started the year with ONI index in weak nina territory.
This is why UAH is only on pace to be 4th warmest on it’s record. Which will dethrone 2013 as the warmest neutral ENSO year on UAH records. But we can all see that most of the last 20 months have been closer to a weak nina than a neutral ENSO. Now we are looking at a weak to moderate nino. Hmmmm.
http://i174.photobucket.com/albums/w109/frivolousz21/RFlIj0L_zps55d4d502.png?t=1410430641
A kelvin wave is currently pressing across the West Central pacific and is forecasted to be decently strong the next 7-10 days as it pushes thru ENSO 3-4. It won’t be long before significant warming over the ENSO region takes place.
So even though a part of NA and Russia have been well below normal the Earth as a whole is running at record warmth.
http://www.cpc.ncep.noaa.gov/products/analysis_monitoring/ocean/weeklyenso_clim_81-10/wkteq_xz.gif
http://www.livefromiceland.is/webcams/bardarbunga-2/
Clouds of sulfuric acid. SO2 + H2O.
I remind you that last year a great snowstorm in South Dakota was at the beginning of October.
continuously i used to read smaller posts that also clear their motive,
and that is also happening with this piece of writing which I
am reading at this place.