
 Home/Blog
The validity of the satellite record of global temperature is sometimes questioned; especially since it shows only about 50% of the warming trend as do surface thermometers over the 36+ year period of satellite record.
The satellite measurements are based upon thermal microwave emissions by oxygen in the atmosphere. But like any remote sensing technique, the measurements include small contaminating effects, in this case cloud water, precipitation systems, and variations in surface emissivity.
A new paper by Weng et al. has been published in Climate Dynamics, entitled “Uncertainty of AMSU-A derived temperature trends in relationship with clouds and precipitation over ocean”, which examines the influence of clouds on the satellite measurements.
To see how clouds and precipitation can affect the satellite temperatures, here’s an example of one day (August 6, 1998) of AMSU ch. 5 data (which is used in both our mid-tropospheric and lower-tropospheric temperature products), and the corresponding SSM/I-derived cloud water for the same day:
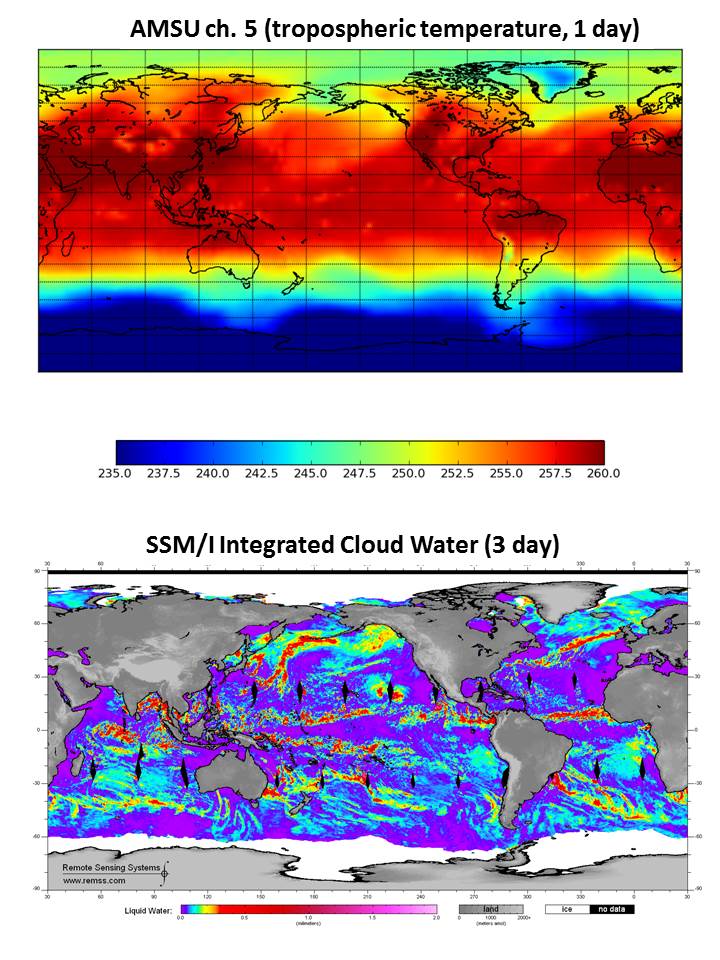
Fig. 1. One day of AMSU limb-corrected ch. 5 brightness temperatures (top), and the corresponding SSM/I cloud water retrievals centered on the same day (August 6, 1998).
As can be seen, the contamination of AMSU5 by cloud and precipitation systems is small, with slight cooling in deep convective areas, and no obvious cloud water contamination elsewhere (cirrus clouds are essentially transparent at this microwave frequency).
And even if there is contamination, what matters for tropospheric temperature trends isn’t the average level of contamination, but whether there are trends in that contamination. Below I will discuss new estimates of both the average contamination, as well as the effect on tropospheric temperature trends.
The fact that our monthly gridpoint radiosonde validation shows an extremely high level of agreement with the satellite further supports our assumption that such contamination is small. Nevertheless, it is probably worth revisiting the cloud-contamination issue, since the satellite temperature trends are significantly lower than the surface temperature trends, and any potential source of error is worth investigating.
What Weng et al. add to the discussion is the potential for spurious warming effects in AMSU ch. 5 of cloud water not associated with heavy precipitation, something which we did not address 18 years ago. While these warming influences are much weaker than the cooling effects of precipitation systems (as can be seen in the above imagery), cloud water is much more widespread, and so its influence on global averages might not be negligible.
The Weng et al Results Versus Ours (UAH)
I’m going to go ahead and give the final result up front for those who don’t want to wade through the details.
Weng et al. restrict their analysis to 13 years (1998-2010) of data from one satellite, NOAA-15, and find a spurious cooling effect from cloud contamination in the middle latitudes, with little effect in the tropics. (They don’t state how they assume their result based upon 13 years, even if it was correct, can be applied to 35+ years of satellite data.) I’ve digitized the data in their Fig. 8, so that I can compare to our results (click image for full size):
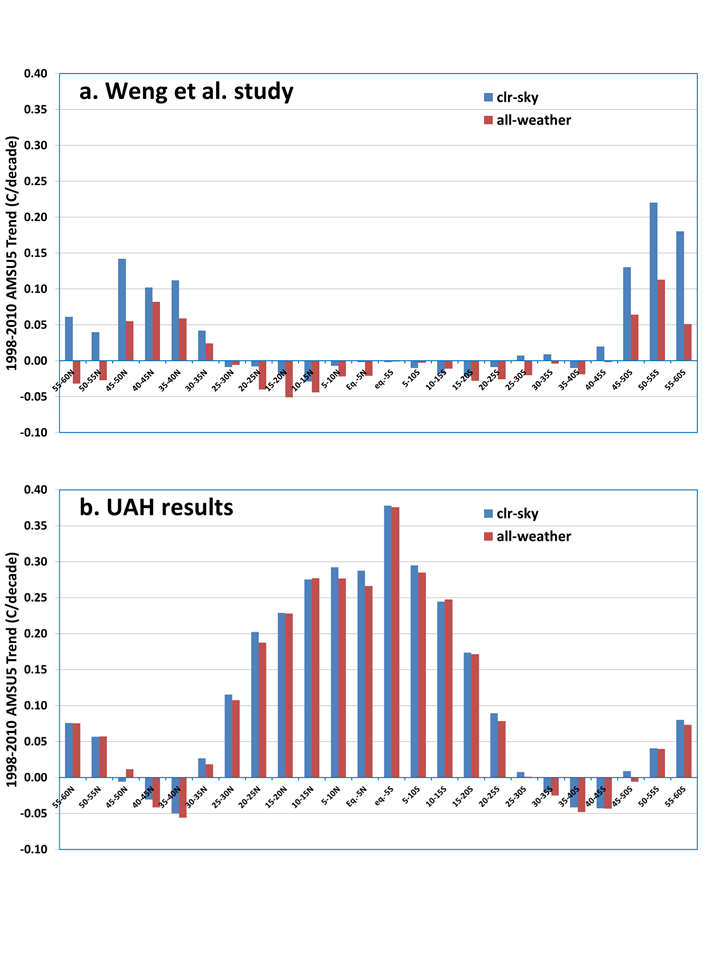
Fig. 2. Oceanic trends by latitude band in AMSU5 during late 1998 to mid-2010 in the Weng et al. study (top) and our own calculations (bottom), for “all-weather” and “clear-sky” conditions.
There are two main points to take away from this figure. First, the temperature trends they get at different latitudes for 1998-2010 are VERY different from what we get, even in the “all-weather” case, which is simply including all ocean data whether cloud-contaminated or not. The large warming signal we get in the tropics is fully expected for this limited period, which starts during a very cool La Nina event, and ends during a very warm El Nino event.
I have spent most of this week slicing and dicing the data different ways, and I simply do not see how they could have gotten the near-zero trends they did in the tropics and subtropics. I suspect some sort of data processing error.
The second point (which was the main point of their paper) is the difference in “clear-sky” versus “all-weather” trends they got in the middle latitudes, which is almost non-existent in our (UAH) results. While they estimate up to a 30% spurious cooling of warming trends from cloud contamination, we estimate a global ocean average spurious cooling of only -0.006 deg. C/decade for 1998-2010 from not adjusting for cloud-contaminated data in our operational product. Most of this signal is probably related to the large change in cloud conditions going from La Nina to El Nino, and so it would likely be even less for the 36+ year satellite record.
While I used a different method for identifying and removing cloud contamination (I use localized warm spots in AMSU ch. 3, they use a retrieval scheme using AMSU ch. 1 & 2), I get about the same number of data screened out (40%) as they do (20%-50%), and the geographic distribution of my identified cloud and precip. systems match known regional distributions. So I don’t see how different cloud identification methodologies can explain the differences. I used AMSU prints 10-21 (like our operation processing), as well as their restricted use of just prints 15 & 16, and got nearly the same results, so that can’t explain the discrepancy, either.
I have many more plots I’m not showing relating to how cloud systems in general: (1) do indeed cause a small average warming of the AMSU5 measurements (by up to 0.1 deg. C); (2) less frequent precipitation systems cause localized cooling of about 1 deg. C; (3) how these effects average out to much smaller influences when averaged with non-contaminated data; and most importantly (4) the trends in these effects are near zero anyway, which is what matters for climate monitoring.
We are considering adding an adjustment for cloud contaminated data to a later version of the satellite data. I’ve found that a simple data replacement scheme can eliminate an average of 50% of the trend contamination (you shouldn’t simply throw away all cloud-influenced data…we don’t do that for thermometer data, and it could cause serious sampling problems); the question we are struggling with is whether the small level of contamination is even worth adjusting for.


Using this old thread to test posts that aren’t making it through this sites weird filters.
DREMT: “barry just doesn’t understand reference frames… he seems to think it comes down to where the axis is!”
Bill: “for our moon there can be only one rotation. spinners say its on the moons local axis and non-spinners say its on the axis in the com of earth.”
Saying this isn’t a contradiction doesn’t make it true. You need to explain why.
I’m also curious why Bill insists there can be only one “rotation”. Clearly the Earth/Sun system proves that there can be an orbit and a spin at the same time.
Perhaps if he named the discipline within which he makes this pronouncement it would become clear.
Jupiter indeed revolves in respect to the fixed stars in 9 hours and 56 minutes, Mars in 24 hours and 39 minutes. Venus in approximately 23 hours, Earth in 23 hours and 56 minutes, the Sun in 25 and a half days, and the Moon in 27 days, 7 hours, and 43 minutes.
The principle behind MLI is radiation balance. To see why it works, start with a concrete example – imagine a square meter of a surface in outer space, held at a fixed temperature of 300 K, with an emissivity of 1, facing away from the sun or other heat sources. From the StefanBoltzmann law, this surface will radiate 460 W. Now imagine placing a thin (but opaque) layer 1 cm away from the plate, also with an emissivity of 1. This new layer will cool until it is radiating 230 W from each side, at which point everything is in balance. The new layer receives 460 W from the original plate. 230 W is radiated back to the original plate, and 230 W to space. The original surface still radiates 460 W, but gets 230 W back from the new layers, for a net loss of 230 W. So overall, the radiation losses from the surface have been reduced by half by adding the additional layer.
More layers can be added to reduce the loss further. The blanket can be further improved by making the outside surfaces highly reflective to thermal radiation, which reduces both absorp.tion and emission.
Do you understand what is being said here, DREMT?
The first paragraph is describing the insulation concept and applying blackbodies. This is, in fact, a perfect description of the GPE.
For a one metre square plate with emissivity of 1 (blackbody):
“The new layer receives 460 W from the original plate. 230 W is radiated back to the original plate, and 230 W to space. The original surface still radiates 460 W, but gets 230 W back from the new layers, for a net loss of 230 W. So overall, the radiation losses from the surface have been reduced by half by adding the additional layer.”
Exactly what I’ve been saying.
“The blanket can be further improved by making the outside surfaces highly reflective to thermal radiation”
Exactly what I said in the last post. The insulative function is more efficient with reflective material than with blackbody material.
But the insulative function works with both.
Why do you deny this? The math is patently obvious.
“So it doesn’t appear from nowhere. You say it “bounces off” the BP and returns to the GP, from where it came. This is the obvious consequence of the vector of radiation from GP to BP not violating 2LoT.”
Aha! You have now landed back on something you once asserted.
So now you have a blackbody acting like a mirror? An object with emissivity 1 absorbs all incident radiation.
If BP were a perfect mirror it would radiate zero emissions to GP.
As I said, you cannot describe the mechanism that satisfies your vision of the plates at equal temperature. You have to invent an unheard of material that defies the laws of physics.
No, I was being sarcastic when I said GP radiation “apparently” bounces off blackbody BP. But this is what you are forced to argue.
So, how do you rationalise a surface with emissivity 1 also having an emissivity of 0? I’m intrigued to know how you do it.
malarkey
revolution
revolves
23 hours 56 minutes
testing
option
depths
dpt
absor.ption
SUN 400 W/m2 –> <– 200 W/m2 BP 200 W/m2 –> <– 200 W/m2 GP 200 W/m2 –>
SUN 400–> <–200 BP 200–> <–200 GP 200–>
The difference that led to the cooling is that the heat flow going from BP to GP is now zero.
You’ve never responded to that specific point. The input from BP to GP is now matched by the radiation flowing out of GP towards BP. NET exchange is zero.
Do you or do you not agree that if GP sends 200 W/m2 to the BP, there is no more heat flow from BP to GP?
As I said, that is fine. That is the difference that LED to the cooling. Your argument is that it is ALSO the direction of cooling. That’s what I disagree with.
“Not in the least. All vectors are considered before and after separation. The GP to BP vector is the difference.”
No, you think a process of elimination determines the heat flow. You eliminate the vector from BP to GP, your reasoning completely ignores 2LoT, and establishes a brand new definition, which you are not owning.
Regular definition: heat flows warmer to cooler object.
DREMT definition: change a system to create a new energy vector from cool object to warm object and the direction of heat flow is cold to hot if cool object gets cooler and warm object gets warmer and there are no other changes.
Yep, that’s your definition of heat flow. I’ve asked you to state it, but you just can’t do it for some reason.
And if I remind you of the IR from BP to GP, you tell me I’m ignoring the vector I should be looking at.
You are banking on a brand new definition of heat flow that you have minted, and you are excluding the real definition to make your case.
“It’s absurd that the only way you can think of for there to be a 2LoT violation in terms of radiative heat transfer is if the SB Law is also violated. Sorry you can’t see that.”
Repeated claim of absurdity with no explanation. Pure assertions that the answer must have “nuance” or not violate some other law, but no explanation why and no actual rebuttal. You appeal to reason but apply none here. Assertion, incredulity and faux regret are not argument. Make a cogent case or let this go.
“You can dress it up any way you want. The GP is not cooling to space on separation, because it was already emitting the exact same amount to space, before separation.”
The GP was not cooling at all before separation. After separation it is now able to do so, and it is “cooling to” space, where it was already radiating when it was not able to cool.
The new vector permits the GP to cool. It does not ESTABLISH the direction of heat flow.
never-before-seen
2LoT establishes the direction of heat flow. From hot to cold. This is always satisfied in the split plate scenario I endorse.
But with your brand new, never-before-seen definition of heat flow, you can claim that by a process of elimination, the flow of heat is from GP to BP, because the vector of radiation between them is all there IS.
I beg pardon… all there is LEFT.
So you are rejecting the standard definition of heat flow to make your case. You are rejecting ‘which is the hotter and which the cooler object’, in favour of ‘which is the COOLING object and what is the new change’.
I’m not going along with your invented definition of heat flow.
Gordon,
“I am not questioning what Newton said, I am questioning the interpretation of what he said by translators.”
I am going to prove to you once and for all that Newton saw the Moon rotating on its own axis. Please read carefully, and especially the stuff towards the end of this post.
“Jupiter utique respectu fixarum revolvitur horis 9. 56′, Mars horis 24. 39′. Venus horis 23. circiter, Terra horis 23. 56′, Sol diebus 25 1/2, et Luna diebus 27. 7 hor. 43′.”
This is not a translation. This is directly from the 3rd edition of the Principia, which he published shortly before his death. I’ve spent today looking up old copies from the 18th Century to confirm this.
This is a list of the rotational movements of the planets, the Sun and Moon. Look at the periods!
Are you really going to argue that, without differentiating the Moon from the others, he is speaking of the 24 hour rotations of the Earth and Mars, the 10 hour rotation of Jupiter, the 25 hour rotation of the Sun, and included the Moon in that list but instead, without mentioning it, switched to speaking of orbit?
Newton was not that sloppy.
If you want further proof, I went to some trouble to find 1st and 2nd editions, where in the same section, he writes this:
“Quoniam vero Lunae, circa axem suum uniformiter revolventis, dies menstruus est: hujus facies eadem ulteriorem umbilicum orbis ipsius semper respiciet”
The translation is clear – suum means “his own” in Latin.
“Since, indeed, the Moon, revolving uniformly around his own axis, has a monthly cycle: its face always looks toward the furthermost point of the orbit itself”
underline
https://cudl.lib.cam.ac.uk/view/PR-ADV-B-00039-00002/847
This book is kept at Cambridge University, his alma mater.
Newton is a spinner. It takes some mighty sophistry to deny it.
There is even a link to a photocopied 2nd edition with Newton’s own handwriting in the margins and interleaves, as he made annotations for the 3rd edition. He does not correct “suum” in that quote, content to leave the phrase as is. “Revolving around his own axis.” He corrects one word in that section, changing ‘orbit’ to ‘ecliptic’. Have a look.
https://cudl.lib.cam.ac.uk/view/PR-ADV-B-00039-00002/847
This book is kept at Cambridge University, his alma mater.
Newton is a spinner. It takes some mighty sophistry to deny it.
Gordon,
A quick walk through the history of NOAA’s global temperature product.
1) The land-based part of that global temp record has always been GHCN monthly.
https://www.ncei.noaa.gov/access/monitoring/dyk/ghcnm-transition
https://www.ncei.noaa.gov/news/noaa-updates-its-global-surface-temperature-dataset
2) The 1st version (1992) of GHCN monthly included 6039 stations, and data only went up to 1990. All stations included have at least 10 years of continuous data. There was no monthly update of data at this time.
https://www.osti.gov/servlets/purl/10178730 [huge file size]
W/m2 is a vector quantity. It is “the power transferred per unit area, where the area is measured on the plane perpendicular to the direction of propagation of the energy.”
You are trying to remove the vector component from the physics, DREMT.