Sea ice floes originating in the Arctic Ocean swirl in the currents off of the northeast coast of Greenland today (click for full size):

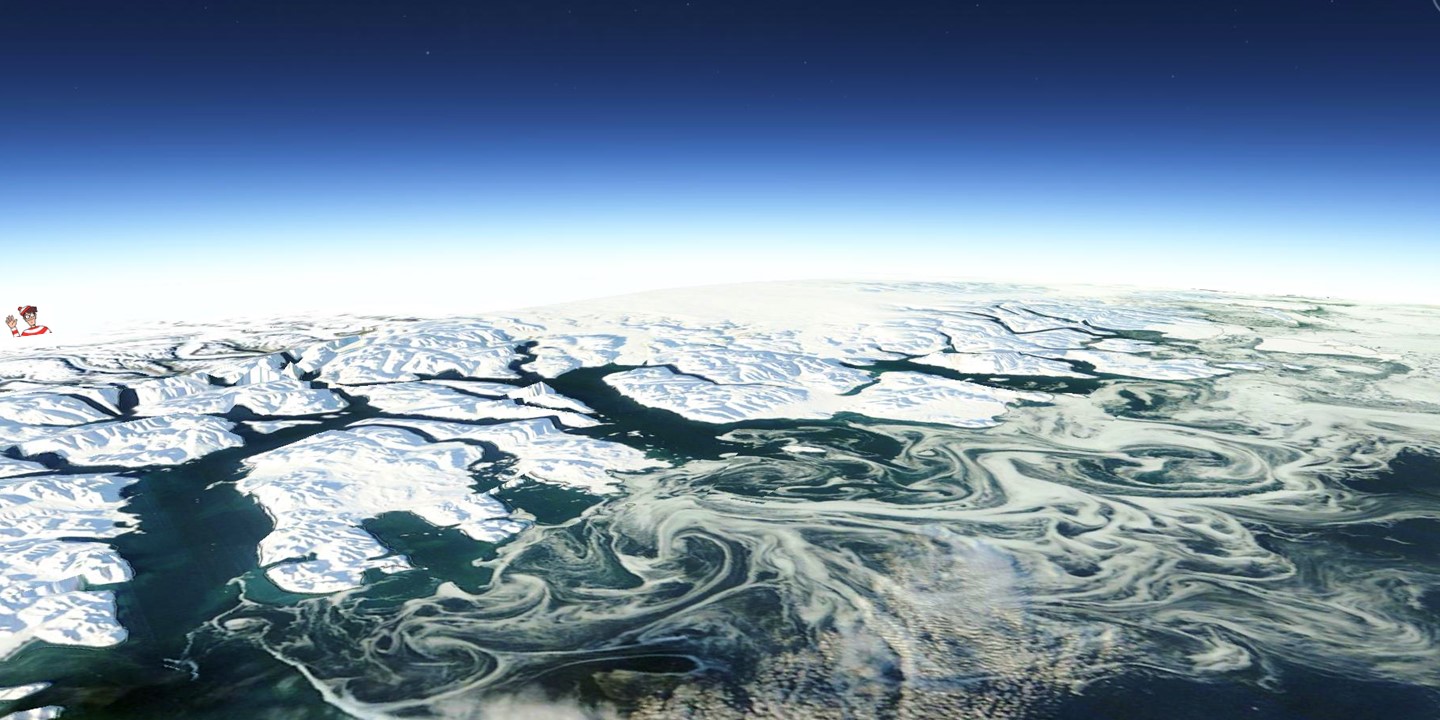
Ice swirls in currents off the northeast coast of Greenland (NASA Terra MODIS image, October 11, 2014, remapped into Google Earth).
The ice sheet of Greenland can no longer be distinguished from fresh snow which has fallen on what was bare ground only a few weeks ago along the coast.
Love the UFO!
The Arctic is such a dynamic place as compared to most others including it’s sister at the other end of the earth. The ice, winds, weather, and seas are ever changing and I guess when it isn’t is the time to start getting worried about catastrophic climate change. (And I didn’t say a thing about man being involved to a significant extent.) When it is possible to forecast with reasonable accuracy what the arctic ice will do a year or two in advance, then I might start to believe that it is possible to model and forecast the earths climate. Till then? Pfuuuuuuuuuut!
This is really fantastic! What a picture!
Thanks, Dr. Spencer.
All those ice floes swirling around, this is nature doing its thing.
@JohnKl
First of all thank you Dr. Spencer for the nice Google Earth mappings.
I apologize to be off topic, but I would post a reply to JohnKl post http://www.drroyspencer.com/2014/10/why-dont-more-people-care-about-global-warming/#comment-136957 and successive.
I reply here because the article went into the old entry repository.
It’s always a pleasure read your posts John, even if I disagree in this case.
The martian atmosphere is very different from our one, as you correctly pointed out, but not only for the concentration of CO2, in fact the pressure at martian ground is very tiny. So, for higher grounds where the martian pressure falls below 3 mbar, the THEMIS instrument channel 10 (the only one which is tuned on the CO2 absorption band at 15 um with a bandwidth of +/-500 nm), is used to complete the martian ground radiance analysis.
See this link:
http://www-mars.lmd.jussieu.fr/granada2003/abstract/smith_THEMIS.pdf
On page 2 you can read “If the surface pressure is less than about 3.0 mbar, then the contribution function is not zero at the surface, which means that there is a contribution in
band # 10 from the surface.”
And the figure 3 (even on page 2) shows how the atmospheric transmittance falls steep at 3 mbar, from a even minuscule 0.025 to 0.007 at 6 mbar.
Here on Earth instead the pressure is much higher, and at 1000 mbar the broadening of the CO2 15um absorption band lines make the transmittance almost zero just few meters above the ground.
Note that that doesn’t means that there is no radiation from the ground on that wavelength, it just means that it escapes to the outer space from other altitudes by molecular emission of the same CO2 gas, but just that it impedes the use of that band for any thermal imaging of the ground.
Have great day.
Massimo
Hoops.
My: “but just that it impedes the use of that band for any thermal imaging of the ground.”
must be: “AND just that it impedes the use of that band for any thermal imaging of the ground.”
Sorry, it’s 32 past midnight here and I’m very tired.
Who added Waldo?
Being an expert on world geography, I hear Waldo was recently hired to work on Google Earth.
The swirls remind me of fetal ultrasounds. If you closely enough and long enough you can count at least three or four fetuses (and that’s without that certain herbal supplement), although it’s difficult to make out the gender. Maybe Waldo’s having triplets or quadruplets.
Who would have thought — the Arctic as a uterus/womb. No wonder it’s called Mother Earth.
NASA is out with September global surface Temps. September is hottest on record at .77 anomaly beating .73 for September 2005. The .77 is from the LOTI data set. Have to wonder what NOAA and JMA will show for September but it seems very very likely now that they will at least show 2014 as hottest on record.
Hoy cr*p, Bassman,
You’re carrying on about 0.04 degrees, from back t6o 2005, 9 years ago ? !? !?
Yes, the earth, from temperature records ( and only a few hundred years out of a few BILLION years, is at a ‘relative high point’. I just don’t care.
LET’S SEE WHAT THE NEXT 10-20 years bring. We’ve already seen 15+ years (depending on the data set) of a PAUSE in temperature rise. STOP THE ALARMISM ! ! ! !
And they were so afraid.
To borrow from Tisdale, Burrrrrr!
Giant slushie.
Look at the sun. Showing you the direction of the air flow over the Bering Strait. Them weaker the sun, the further southeast it reaches the cold air.
http://www.cpc.ncep.noaa.gov/products/stratosphere/strat_a_f/gif_files/gfs_o3mr_05_nh_f00.gif
Let’s see pressure anomalies over the Arctic. Low solar activity.
http://www.cpc.ncep.noaa.gov/products/intraseasonal/z200anim.gif