UAH Global Temperature Update for October, 2014: +0.37 deg. C

November 3rd, 2014 by Roy W. Spencer, Ph. D.

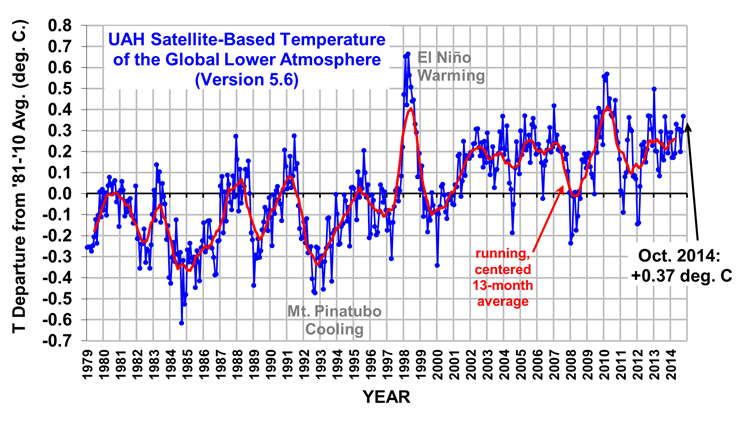
The Version 5.6 global average lower tropospheric temperature (LT) anomaly for October, 2014 is +0.37 deg. C, up from the September value of +0.29 deg. C (click for full size version):

UAH_LT_1979_thru_October_2014_v5

The global, hemispheric, and tropical LT anomalies from the 30-year (1981-2010) average for the last 22 months are:

YR MON GLOBAL NH SH TROPICS
2013 1 +0.497 +0.517 +0.478 +0.386
2013 2 +0.203 +0.372 +0.033 +0.195
2013 3 +0.200 +0.333 +0.067 +0.243
2013 4 +0.114 +0.128 +0.101 +0.165
2013 5 +0.082 +0.180 -0.015 +0.112
2013 6 +0.295 +0.335 +0.255 +0.220
2013 7 +0.173 +0.134 +0.211 +0.074
2013 8 +0.158 +0.111 +0.206 +0.009
2013 9 +0.365 +0.339 +0.390 +0.190
2013 10 +0.290 +0.331 +0.249 +0.031
2013 11 +0.193 +0.160 +0.226 +0.020
2013 12 +0.266 +0.272 +0.260 +0.057
2014 1 +0.291 +0.387 +0.194 -0.029
2014 2 +0.170 +0.320 +0.020 -0.103
2014 3 +0.170 +0.338 +0.002 -0.001
2014 4 +0.190 +0.358 +0.022 +0.092
2014 5 +0.326 +0.325 +0.328 +0.175
2014 6 +0.305 +0.315 +0.295 +0.510
2014 7 +0.304 +0.289 +0.319 +0.451
2014 8 +0.199 +0.244 +0.153 +0.061
2014 9 +0.294 +0.187 +0.401 +0.181
2014 10 +0.367 +0.335 +0.399 +0.191

It should be remembered that during ENSO, there is a 1-2 month lag between sea surface temperature change and tropospheric temperature changes, so the tropospheric temperature anomaly will take a month or two to reflect what recent global SSTs have been doing.

The global image for October should be available in the next day or so here.

Popular monthly data files (these might take a few days to update):

uahncdc_lt_5.6.txt (Lower Troposphere)
uahncdc_mt_5.6.txt (Mid-Troposphere)
uahncdc_ls_5.6.txt (Lower Stratosphere)


301 Responses to “UAH Global Temperature Update for October, 2014: +0.37 deg. C”

Toggle Trackbacks

  1. Locke says:

    You can add 30% to that for the spurious cooling inherent in the satellite record.

    • TedM says:

      Do you suggest we apply that 30% to the radiosonde data as well.

      • Locke says:

        If the radiosonde data below precipitation bearing clouds is giving the same temperatures as satellites above I am prepared to concede the point. However, I think you would also have to concede that this comparison is not that easy to do. Radiosondes measure a pocket of air at a specific altitude at specific point in time. Satellites do not have this resolution, if they did, we wouldn’t be using radiosondes any more.

      • Fonzarelli says:

        Ted, I would think that just as significant as the comparison to balloon data (if not more so) is the comparison with the carbon growth data:
        http://members.westnet.com.au/jonas1/deltaCO2vsTemp.JPG
        The correlation is so close that one can even see that UAH is a better fit than RSS. David Apple is no friend to the UAH data set and had this to say about Dr Spencer: DavidA February 19, 2014 9:50pm ‘He keeps one of the major temperature data bases- one that has often been found to be in error and still may be’ And yet had this to say about the close fit of UAH over RSS (after quoting me): DavidA October 23, 2014 1:41pm ‘ “there is a near perfect correlation with the satellite data and carbon growth” Not for RSS’s satellite data’
        I have yet to see a decent argument as to how the UAH data set can be in lock step with carbon growth and not be accurate. The above graph not only confirms the accuracy of the UAH data but also confirms that carbon growth is driven by temperature and not by the growth of human emissions…

        • David A. says:

          “I have yet to see a decent argument as to how the UAH data set can be in lock step with carbon growth and not be accurate.”

          What do you mean by “lock step?” And whoever gave you the idea it was necessary?

          • Fonzarelli says:

            “whoever gave you the idea it was necessary?”

            Ferdinand Engelbeen 1/9/11 5:07am WUWT: “if there is no connection between the rise of CO2 and the emissions, then AGW fails completely”

            David, my apologies for having misspelled your last name. (I know full well that it is Appell) If carbon growth confirms the UAH record, then in turn the UAH record confirms that carbon growth is driven by temperature and NOT the growth of human emissions…

          • Kristian says:

            David A. says, November 3, 2014 at 8:34 PM:

            “What do you mean by “lock step?” And whoever gave you the idea it was necessary?”

            I wonder too. How would such a comparison prove UAH to be ‘better’ than RSS? Why does it have to be such a tight fit?

            BTW, RSS fits better than UAH with the ToA (All Sky) OLR data from CERES.

          • David A. says:

            Fonzarelli says:
            > “whoever gave you the idea it was necessary?”
            “Ferdinand Engelbeen 1/9/11 5:07am WUWT: “if there is no connection between the rise of CO2 and the emissions, then AGW fails completely”

            Frankly, I wouldn’t believe anything on WUWT, including the words “and” and “for.”

            Again: CO2 isn’t the ONLY influence on climate change. There are a host of others: CH4, NO2, other GHGs, ENSOs, ocean cycles (PDO, AMO, etc), solar variability, volcanic eruptions, etc., and then a suite of feedbacks.

            You have to include all of these if you want to dig out the CO2 signal.

          • Fonzarelli says:

            Kristian, when David made his (october 23) comment, I assumed it was based on more than the linked graph which ends with 2010. In the last few years carbon growth has been high which is more consistent with UAH than RSS…

            AND David, no need to equate ferdinand with watts; he was just posting a comment there… I assume you know of him. Fascinating man to watch, quite a powerful intellect he has…

          • David A. says:

            Sorry, I don’t know who Ferdinand Engelbeen is. I hardly ever read WUWT.

          • Fonzarelli says:

            GOOGLE HIM, DAVID !!! (you won’t be disappointed…)

          • John says:

            This is what Ferdinand Englebeen had to say about the origin of the increase in CO2 in the atmosphere http://www.ferdinand-engelbeen.be/klimaat/co2_origin.html :

            “All observed evidence from measurements all over the earth show with overwhelming evidence that humans are causing the bulk of the recent increase of CO2 into the atmosphere.”

            As you implied, Ferdinand was a diligent intellect.

          • I do not know who David A(ppel?) is or his qualifications but it is clear from his comments that he has no understanding of heat transfer (which is an engineering subject) He probably will not understand most of what is written in chapter 5 (heat & mass transfer) of the Chemical Engineering Handbook but on page 5-35 and in table 5-9 one will find that the radiation emissivities (and absorptivities) of the gases CO, CH4 and NO are insignificant . Greenhouse gas is a stupid term that has no physical relevance. The only gas that has an effect on radiation into and out of the atmosphere is water vapor because a) it can absorb & emit radiation across a significant wavelength range b) the partial pressure within the total pressure at heights through the atmosphere is significant (ie the path length times the partial pressure is significant)and c) it can condense to form clouds which contain droplets of water and particles of ice both of which have greater absorptivity and emissivity than the gas. Page 5-36 of the Chemical Engineering Handbook mentions cloud emissivity but the so-called climate scientists do not read the vast amount of experimentation carried out by engineers and seem to want to remain ignorant.

  2. bassman says:

    So 2014 will be 3rd warmest on UAH, NOAA,JMA,Hadcrut warmest on record, NASA, Cowtan and Way 2nd warmest or warmest on record. We may me shifting back into a warmer phase of ocean surface warming/PDO etc. An El Niño could really shatter records in 2015.

    • Francisco says:

      We already shattered a whole bunch of records this year, on the opposite side of the scale. Actually… ‘WE’ did not shatter any records, momma nature did. Just look at the poles. I wonder if the North will follow its southerly sister and break ice coverage records this year.
      Same thing applies to lows outnumbering highs by a far reach. We will see if ENSO spurs any more media hype or makes them shut their mouths and look for ‘siiiigns’ in the skies and depths (well, troposphere and oceans)

    • Temperatures usually peak around an El Nino or El Nino like conditions. But at the end of the day current temperatures look about the same as they were 10 years ago. BTW, the so called PDO phases run for about 30 years. They don’t shift because you want them to. 😉

    • Stephen Richards says:

      Only if the crooks keep manipulating the temps.

  3. TheFinalNail says:

    Ties with 2012 as the warmest October on record in UAH. Don’t mention that though. Play it cool.

    Steady.

  4. D o u g  C o t t o n   says:

     
    And there’s still no net warming, Roy since 1998, and nor will there be until at least 2028. Everything in Earth’s climate pattern is still following the two main natural cycles which correlate beautifully with the 934 year and 60 year cycles in the inverted plot of the scalar sum of the angular momentum of the Sun and all the planets. I hope some of the lukes and warmists live to see the start of 500 years of cooling after the next 60 year maximum in 2058. Carbon dioxide has nothing to do with it.

    OF VITAL IMPORTANCE:

    All the models calculate sensitivity based on the false assumption of “33 degrees” of warming from about 255K to 288K. That claim is clearly spelled out in the glossary on the IPCC website from which I’ve quoted in my book and you can read free with the “Look Inside” feature on Amazon. I have shown that the 255K figure is false for a nitrogen only atmosphere where the surface temperature would be around 290K to 310K for a realistic emissivity range for a rocky planet without water or vegetation.

    Incredible as it is, the IPCC discussion of the 255K figure “forgets” that about twice as much solar radiation would be reaching the surface because there would be no clouds reflecting radiation back to space and no absorption of incident solar radiation. This glaring oversight, if corrected for, leaves no warming to be done because the existing mean temperature of 288K is actually cooler than that for the nitrogen atmosphere.


    • David A. says:

      Doug Cotton says:
      “And there’s still no net warming, Roy since 1998”

      That’s not true. The UAH LT data show +0.23 C of warming (linear_trend*interval) since Dec 1998, and it’s easily statistical significant.

      • D o u g  C o t t o n   says:

        Yes December 1998 – conveniently cherry picking out the impact of the full 1998 year. Roy’s temperature data goes back further and clearly shows that data fits with the above-mentioned plot of angular momentum, which reference you choose to ignore because it’s yet another inconvenience, as is what I mention in the rest of the comment. No one pulls wool over Cotton’s eyes, my friend.

      • tonyM says:

        Yes David, absolutely brilliant accounting just don’t ask for a job, certainly not one with any statistical needs.

        If a doctor manages to reduce your T from 41C on a Monday to 39C for Tues you will argue he has not done much as your last recorded T for Mon was 38.5 at 11:55hrs; bad doctor.

        • tonyM says:

          correction: 38.5C at 23:55hrs on Mon

        • David A. says:

          I don’t understand at all what you’re trying to say.

          How would YOU define the amount of temperature change over a given interval?

          • tonyM says:

            The issue is not simply a T change over an interval that suits you – that is called cherry picking, which can result in ANY trend one wants.

            Surely the issue is that T is a measure (might be a bit crude as we are focused on surface T) of how much heat is in the system we are observing (I guess atmosphere). Annual average numbers are usually used to try and dampen outliers and reduce error levels.

            In any case the peak anomaly was mid year not Dec 1998. If you intend to see what is happening to a pot of water with heat being applied intermittently at different spots one doesn’t go and pick a T below its peak T to see if it is still warming as a whole.

          • David A. says:

            Again, I didn’t pick 1998, Doug Cotton did. I think intervals less than 30 years or so aren’t indicative of climate.

            Peak years are (extreme) noise; trends are what are important. Because the impact on society doesn’t depend much on one particular year, except as a extreme event. But society is built around the long-term trend (of about zero), and it’s the long-term trend that will influence society long after the single extreme event is gone.

          • tonyM says:

            OK but Doug was not talking about a specific month.

            Don’t disagree that we would like to understand if there is a real trend but I doubt whether any society really believes in a constancy given the history of the earth.

            If we are looking for trends at the moment it would appear that, certainly for the last decade, we have not seen much of a change in T (allowing for errors in measurement). Will it continue? Who knows.

          • David A. says:

            “Don’t disagree that we would like to understand if there is a real trend but I doubt whether any society really believes in a constancy given the history of the earth.”

            You don’t need to believe in constancy to figure out what causes climate change. CO2 is (and always has been) a big part of that picture.

            “If we are looking for trends at the moment it would appear that, certainly for the last decade, we have not seen much of a change in T (allowing for errors in measurement).”

            For the most part. But 10 years is a very short time period to draw conclusions about climate change, because other significant (in the short-term) factors affect temperature change too, especially ENSOs. In the last 10 years we’ve had more La Nina conditions than El Ninos:

            http://www.cpc.ncep.noaa.gov/products/analysis_monitoring/ensostuff/ensoyears_1971-2000_climo.shtml

          • D o u g  C o t t o n   says:

            If you want to see an analysis of the long-term trend (showing 0.05 degree per decade) see the Appendix of the paper which is cited as reference [3] here.

    • tonyM says:

      Doug,
      I came across this paper which may be useful to you:
      http://faculty.washington.edu/dcatling/Robinson2014_0.1bar_Tropopause.pdf

      Common 0.1 bar tropopause in thick atmospheres
      set by pressure-dependent infrared transparency.

      Perhaps Dr Roy may have the patience to let you have your own page so that you don’t jump into every topic with the same story.

    • David A. says:

      “All the models calculate sensitivity based on the false assumption of “33 degrees” of warming from about 255K to 288K.”

      No, they don’t — the 288 K figure was first calculated by Manabe and Wetherald (1967) with their radiative convective equilibrium model, in which they do have a parametrization for cloud feedbacks. 33 K certainly isn’t “assumed” for the greenhouse effect — it’s a result of the science.

  5. Christian says:

    @ Spencer

    “It should be remembered that during ENSO, there is a 1-2 month lag between sea surface temperature change and tropospheric temperature changes, so the tropospheric temperature anomaly will take a month or two to reflect what recent global SSTs have been doing.”

    Statement is false, for Surface meassurments is between 2-4m, in Satdata is arround 5m.

    See also Foster & Rahmstorf (2011) Table 1.

    On the other Hand, the ocean record heat is not very compareable to an El-Nino which is more complex on global scale

    • Roy Spencer says:

      I have no idea what you are talking about….

      • Christian says:

        The Best-Lag (The Point where Correlation is the highest) or tell it Time Delay between ENSO Events and the Temperature.

        I think now it should be clear 🙂

        • Roy Spencer says:
          November 3, 2014 at 4:34 PM
          I have no idea what you are talking about….

          = = = = = =

          Oh, and there was I hoping someone could explain

          • D o u g  C o t t o n   says:

            I’ve explained above Roy that ALL climate correlates compellingly with the inverted plot of the scalar sum of the angular momentum of the Sun and all the planets. I’ve also pointed out that the surface temperature would not necessarily have been colder than the present in the absence of all greenhouse gases in a nitrogen only atmosphere, because that surface would have received twice as much direct solar radiation and it would have had lower emissivity also.

            So what I’m talking about Roy is that carbon dioxide and water vapour have no warming effect what-so-ever and that all climate change is regulated by planetary orbits, and you can’t prove otherwise because the basic assumption of 255K in the greenhouse conjecture has been smashed, along with the greenhouse.

          • D o u g  C o t t o n   says:

            Just to reiterate what I’ve demonstrated on other threads:

            Without greenhouse gases the surface would receive the full blast of 1360W/m^2 of solar radiation when the Sun is overhead. That (using Stefan-Boltzmann calculations) would raise a rocky surface (without water or vegetation) with emissivity 0.85 to nearly 410K. If we spread the radiation over a sphere using a quarter of 1360, namely 340W/m^2 we get nearly 290K which is warmer than the existing temperature.

          • D o u g  C o t t o n   says:

             
            By the way, Roy climatologists (with their own peculiar brand of “fissics”) love to argue the surface temperature of that nitrogen only planet would equal the “radiating temperature” of the planet, namely 255K. That’s garbage, Roy, because the definition is really that of the effective temperature which is “the temperature of a black body that would emit the same total amount of electromagnetic radiation.[1] Effective temperature is often used as an estimate of a body’s temperature when the body’s emissivity curve (as a function of wavelength) is not known.”

            Well we do have a reasonable idea of the emissivity of various substances that would make up the surface of a rocky planet, and all indications are that 0.85 is higher than would be the weighted mean emissivity of such substances. So that actual surface temperature would be higher than 290K for a pure nitrogen atmosphere.

            As I’ve shown from real world temperature data, water vapour cools because it lowers the temperature gradient and so the whole thermal profile rotates and lowers at the surface end. The introduction of water vapour also roughly cuts in half the solar radiation reaching the surface due to 30% albedo (mostly from clouds) and absorption of about 20% of incident solar radiation. So water vapour cools in the first place, and of course also has negative feedback.


            So the whole greenhouse conjecture is smashed, Roy.


          • David A. says:

            “Without greenhouse gases the surface would receive the full blast of 1360W/m^2 of solar radiation when the Sun is overhead.”

            No, it wouldn’t. That amount is (1-albedo)*S/4

            which equals 239 W/m2, implying a S-B temperature of 255 K.

          • D o u g  C o t t o n   says:

            Blimey David, would you kindly read all of a comment before responding to the first line.

          • D o u g  C o t t o n   says:

             
            David, in calculating your 255K you made the glaring mistake of dividing 1360 by 4 and getting 239 instead of 340. Then you used emissivity 0.9969 to get 255K in Stefan Boltzmann calculations.

            Well here are some emissivity values for some of what we might expect on that rocky planet without water or vegetation …

            Basalt: 0.72
            Clay: 0.39
            Shale: 0.69
            Granite: 0.45
            Limestone: 0.95
            Soil: 0.38

            Do you want to argue that the weighted mean could be higher than 0.85? Even 0.90 would give nearly 286K which leaves barely a couple of degrees of warming, not that “33 degrees” of IPCC notoriety. I doubt that one molecule of carbon dioxide in 2,500 air molecules (that hold 99.96% of the thermal energy in the atmosphere) will make much difference, whether there’s total warming of 2 degrees or cooling of 2 degrees.

          • David A. says:

            No, I didn’t, Doug. I took the solar constant (1365 W/m2), divided it by 4 (the ratio of the Earth’s surface area to its maximum cross sectional area), and multiplied it by 0.7 (the albedo — not emissivity — of the Earth being 0.3).

            This is a pretty standard calculation included in Chapter 2 of all climate textbooks.

          • D o u g  C o t t o n   says:

            Once again, read ALL my comment before putting you foot in it David A.

            There are no clouds in a pure nitrogen atmosphere and so no albedo worth mentioning you clot. Besides, a rocky waterless Earth without vegetation could not possibly have emissivity 0.9969.

            Again – go back and read all my comment. Checkmate!

          • D o u g  C o t t o n   says:

            And if you think you understand planetary tropospheric and surface temperatures, David A, then show me your calculations for the temperature at the base of the nominal Uranus troposphere. I got it right within 3%. Let’s see what you can do. Then explain the temperature in the core of the Moon. Then explain how the required thermal energy gets into the surface of Venus to raise its temperature from about 732K to 737K over the course of its 4 month day. (Back radiation cannot raise a temperature because it cannot deliver net thermal energy to a hotter surface.)

            Who’s next to take me on?

          • Doug. C says:

            In case you haven’t quite picked up on it yet, David A, the whole thrust of my book, my papers and my articles over the last four years or so has been to use valid physics to completely and utterly refute the false “fissics” promulgated by the IPCC and finding its way into the climatology textbooks you cite. They are wrong, David A, do you get it? Totally and utterly wrong, claiming, for example, that water vapour warms the planet when temperature data shows it cools, claiming back radiation can help the Sun raise the surface temperature, etc etc. All wrong David A, and you can’t prove a word of what I present as being incorrect physics in any way shape or form. I’m no “amateur” when it comes to understanding the physics of all planetary atmospheres, surfaces, crusts, mantles and cores. You could learn a lot from my sites earth-climate and climate-change-theory dot com and my book.

          • David A. says:

            If you’re going to start name-calling Doug, then goodbye. Good luck living in your fantasy climate.

          • David A. says:

            Doug. C says:
            “In case you haven’t quite picked up on it yet, David A, the whole thrust of my book, my papers and my articles over the last four years or so has been to use valid physics to completely and utterly refute the false “fissics” promulgated by the IPCC and finding its way into the climatology textbooks you cite.”

            I know that’s what you think you’ve done. But I (and most others I’ve seen comment) see you as a crackpot:

            http://math.ucr.edu/home/baez/crackpot.html

  6. Many of us are of the opinion that the chances of cooling going forward are near 100%.

    CO2 is a non player in the global climate picture as past historical data has shown.

    CO2 and the GHG effects are a result of the climate not the cause in my opinion.

    I maintain these 5 factors cause the climate to change and they are:

    Initial State Of The Climate – How close climate is to threshold inter-glacial/glacial conditions

    Milankovitch Cycles – Consisting of tilt , precession , and eccentricity of orbit. Low tilt, aphelion occurring in N.H. summer favorable for cooling.

    Earth Magnetic Field Strength – which will moderate or enhance solar variability effects through the modulation of cosmic rays.

    Solar Variability – which will effect the climate through primary changes and secondary effects. My logic here is if something that drives something (the sun drives the climate) changes it has to effect the item it drives.

    Some secondary/primary solar effects are ozone distribution and concentration changes which effects the atmospheric circulation and perhaps translates to more cloud/snow cover- higher albebo.

    Galactic Cosmic Ray concentration changes translates to cloud cover variance thus albedo changes.

    Volcanic Activity – which would put more SO2 in the stratosphere causing a warming of the stratosphere but cooling of the earth surface due to increase scattering and reflection of incoming sunlight.

    Solar Irradiance Changes-Visible /Long wave UV light changes which will effect ocean warming/cooling.
    Ocean/Land Arrangements which over time are always different. Today favorable for cooling in my opinion.

    How long (duration) and degree of magnitude change of these items combined with the GIVEN state of the climate and how they all phase (come together) will result in what kind of climate outcome, comes about from the given changes in these items. Never quite the same and non linear with possible thresholds.. Hence the best that can be forecasted for climatic change is only in a broad general sense.

    In that regard in broad terms my climatic forecast going forward is for global temperatures to trend down in a jig-saw pattern while the atmospheric circulation remains

    THE CRITERIA

    Solar Flux avg. sub 90

    Solar Wind avg. sub 350 km/sec

    AP index avg. sub 5.0

    Cosmic ray counts north of 6500 counts per minute

    Total Solar Irradiance off .15% or more

    EUV light average 0-105 nm sub 100 units (or off 100% or more) and longer UV light emissions around 300 nm off by several percent.

    IMF around 4.0 nt or lower.

    The above solar parameter averages following several years of sub solar activity in general which commenced in year 2005..

    IF , these average solar parameters are the rule going forward for the remainder of this decade expect global average temperatures to fall by -.5C, with the largest global temperature declines occurring over the high latitudes of N.H. land areas.

    The decline in temperatures should begin to take place within six months after the ending of the maximum of solar cycle 24.

  7. bassman says:

    Holy cow Salvatore, give it up and just go with the CO2 will only warm us 1C and it might even benefit society argument. Totally false but it some how sounds more legitimate.

    • Good one bassman.
      But why these scientific people nail themselves to the “woodwork” by putting a definite – or probable – value to their estimates – is beyond me.

      I know that they all think “Atmospheric CO2 Concentration” will enhance/increase the “Global Temperature” but if you ask any one of them: how this temperature increase will be brought about, then you are in for many different answers.

      Now then, Dr. Spencer’s explanation is – in my opinion – the best one there is. But it is relying, it seems to me, on the false assumption that CO2 absorbs IR radiation.

      Well, it does not. According to the experiments of Melony, Tyndall and myself, “CO2 Blocks” the irradiative path of IR radiation. – I.E no “Back Radiation” happens

      • TedM says:

        I’d be interested in more info on that. Do you have a link to a paper essay or presentation.

        Thanks

      • D o u g  C o t t o n   says:

        ““Atmospheric CO2 Concentration” will enhance/increase the “Global Temperature”” No it won’t and you can’t prove it will. Read my comments on this thread to see why.

        • Doug, I wrote: “I know that they all think “Atmospheric CO2 Concentration” will enhance/increase the “Global Temperature” but if you ask any one – – – – -”

          i.e. I am not the one claiming that “Atmospheric CO2 Concentration” will enhance/increase the “Global Temperature”. My claim is quite the opposite.

          Please calm down, we are on the same wave-length. Well, nearly.

  8. Christian says:

    @ Doug

    Jeah Jeah, but not real. Correlation is nothing without causality. So can you give me this?

    Give me a little bit time, i correlate Temperature to GDP of a Land or with my Age or with killed Animals

    And if you tell true you be wrong, because observed Sunspots and other Parameter are wrong and ongoing to be corrected.

    See also: http://ssnworkshop.wikia.com/wiki/Presentations_4

    • D o u g  C o t t o n   says:

      Yes, well if you want to claim Earth’s climate might be the cause of planetary orbits then you may have an argument. But given that it’s obviously the other way around, your remark shows pathetic lack of understanding of statistics when all you can do is repeat oft-quoted generalisations that aren’t really always correct anyway.

      • David A. says:

        Dividing by four is required by the physics. The amount of solar radiation the Earth receives is pi*R^2*S, and, after reflection, it’s distributed over an area of 4*pi*R^2. Hence (1-albedo)*S/4.

  9. bassman says:

    Breaking!!

    Bigger story today,

    This paper is a big breaking event. I would read this right away. Negative volcanic forcing post 2000 way underestimated. A BFD.

    http://onlinelibrary.wiley.com/doi/10.1002/2014GL061541/abstract

    • It’s big breaking event like the other couple of dozen other papers that all claim to explain ‘the pause’ but for different reasons. Glad you managed to find one of them, anyway. 😉

  10. This video in the above based on the data which shows a clear cut relationship between the sun and the climate. About 31 minutes into the video it shows the graphs which show a good correlation between solar/climate. One of many data sources which all show the same kind of data over and over again. I choose to believe this data due to the fact it has been in existence for many years and reached by many independent studies.

    As far as cloud cover versus solar again their is noise in the climate system and items such as the atmospheric circulation, volcanic activity, and the magnetic field strength of the earth ,in addition to primary changes on the sun itself are all going to impact cloud cover.

    It is not just cosmic rays and to take it further if it were just cosmic rays the sun’s variability is not the only factor in modifying the amounts of cosmic rays entering the earth’s atmosphere. One has to consider the strength of the earth’s magnetic field and the concentrations of galactic cosmic rays out in space in the vicinity of the earth.

    It is and will never be straight forward and this is why GIVEN solar changes will not give GIVEN climate results.

    The ice dynamic (initial state of the climate) having a major influence on given solar variability and the effect or lack of an effect it may have on the climate.

    I have listed at length all the factors that can cause given solar variability to have a different given climate result. That said if GIVEN solar variability is EXTREME enough (the criteria I have mentioned) then it will be enough to influence the climate in a general direction of cooler or warmer over the long term as was the case during the Little Ice Age as this video confirms. It will at a point be able to over come the noise in the climate system.

    I will leave with this why the YD period end so abruptly? Where was the climate governor?

    I say there is no such thing as a climate governor out there rather it is the initial state of the climate which determines the stability or lack of stability of the climate and how much or little it may be influenced by factors which may impact the climate.

  11. Christian says:

    Bassman

    Not so new, so also:

    http://www.nature.com/ngeo/journal/v7/n3/full/ngeo2098.html
    http://www.nature.com/ngeo/journal/v7/n3/full/ngeo2105.html

    Last one has showed up, that discrepance between Model and Overservation mainly a cause of ENSO, undereastimate vulcanic Forcing and aersol Forcing and solar Forcing.

    Also look here: http://3.bp.blogspot.com/-ng9NwfRTl50/Uw9Vn7eV_oI/AAAAAAAAFQE/9MZiN168pzo/s1600/Schmidt14Fig1.png

  12. the reality Baseman.

    ES says:

    April 25, 2014 at 10:32 am

    They say that the color of the lunar eclipses is an indication of how clear the stratosphere is.

    ALL-CLEAR IN THE STRATOSPHERE:
    Earth’s stratosphere is as clear as it’s been in more than 50 years. University of Colorado climate scientist Richard Keen knows this because he’s been watching lunar eclipses. “Since 1996, lunar eclipses have been bright, which means the stratosphere is relatively clear of volcanic aerosols. This is the longest period with a clear stratosphere since before 1960.”

    http://spaceweather.com/archive.php?view=1&day=19&month=12&year=2010

  13. The above chart says it all.

  14. Volcanic eruptions that don’t reach up to the stratosphere have never impacted the climate in a major way.

  15. bassman says:

    Christian, this paper is saying that volcanoes have had a much bigger neg forcing post 2000 than those papers suggested.

    • Christian says:

      Hi Bassman,

      Is not so clear to say, because the Forcing Deltas in the Schmidt et al (2014) are in relation to RCP_Runs. Or in other Word, it is in compare to CIMP5-Forcing after Hindcast.

      Greets

  16. Thanks, Dr. Spencer.
    I have updated your UAH – Global lower tropospheric temperature anomalies, 1979 thru October 2014 in my pages. I’m glad to see a big chill hasn’t already started. The “pause” goes on and global warming stopped after the big El Nińo in ’98.

    • David A. says:

      Andres Valencia says:
      “the ‘pause’ goes on and global warming stopped after the big El Nino in ’98”

      I find the UAH LT data show +0.23 C of warming (linear_trend*interval) since Dec 1998, and it’s easily statistical significant. How does that jive with your claim about the ‘pause?’ Do you have some other calculation that shows differently?

      • tonyM says:

        What you find and what is reality are two different worlds.

        You might try a mid year 1998 T to see how it squares with your nonsense trend. You might even try comparing the full twelve month to date values.

        The 1998 is still king and seems to be so beyond the error levels of measurement.

        If Dr Roy sees this I wonder if he would comment on what the error level is with these measures – useful to compare with other measures.

        • David A. says:

          From 6/1998 the change in UAH LT is +0.17 C.
          From 1/1998 the change is +0.11 C.

          But those dates are cherry-picked as well.

          How about this: over the entire UAH LT record, the warming is +0.14 C/decade ==> +0.49 C of change.

          • tonyM says:

            David,
            Trends are whatever trends you wish them to be – meaningless statistical nonsense unless you wish to say the hypothesis is a linear trend of T as a time series.

            Then declare your hypothesis – clear and falsifiable.

            If that is the case why not apply it to the mid nineteen forties to mid seventies and see negative trends which would certainly disprove any CO2 forcing hypothesis.

            The issue isn’t simply what was in the past but is it continuing. This throws into question whether CO2 is really the forcing cum feedback as proposed.

            What is very clear is that within error levels there has been hardly any change in peak T for nearly two decades. The thrust of alarmist proposals is nonexistent if one takes longer time frames.

            There are now numerous papers showing that the sensitivity is well below the alarmist IPCC. J Curry et al showed about 1.3C and that assumes it is all due to GHG.

            Most of us would genuinely like this whole issue resolved and it won’t happen by torturing stats.

          • David A. says:

            “Trends are whatever trends you wish them to be – meaningless statistical nonsense unless you wish to say the hypothesis is a linear trend of T as a time series.”

            A trend by linear regression has a precise mathematical definition (we usually use the method of least squares). After you calculate it, the relevant question is what is the probability of it being statistically significant, which you can also calculate (depending on your assumptions).

            That’s all al linear trend is — a number describes the trend to a certain probability.

            “If that is the case why not apply it to the mid nineteen forties to mid seventies and see negative trends which would certainly disprove any CO2 forcing hypothesis.”

            You could certainly derive a linear trend from the mid-1940s to the mid-1970s, and your could calculate the probability p for which it is a statistically significant.

            But it’s not a test of the CO2 forcing hypothesis, because other things are happening during that time period that also influences temperature.

            “What is very clear is that within error levels there has been hardly any change in peak T for nearly two decades. The thrust of alarmist proposals is nonexistent if one takes longer time frames.”

            Which isn’t at all relevant to whether the climate is changing — it’s a statement about noise, not climate. Most of us are interested in climate.

            It’s like saying a pot of water quickly heated to 99 C and then quickly chilled to 1 C is not warming if its temperature then increases steadily by 1 C per minute. It’s absurd to claim the water wasn’t heating until it reached 100 C and surpassed the earlier brief peak.

            “There are now numerous papers showing that the sensitivity is well below the alarmist IPCC. J Curry et al showed about 1.3C and that assumes it is all due to GHG.”

            Lewis and Curry was a piece of junk, in which they purposely didn’t use (or even mention) the most recent data available and newer methods. That borders on scientific fraud, if not crossing over into it, and the science community knows that, so they will not (and are not) taking it seriously. It seems to have been written for PR purposes, to get it into the WSJ.

          • tonyM says:

            David,

            If it does not suit your narrative it is junk; if it does it is not junk. That must make the IPCC report a pristine document worthy to be called science. It is junk to me.

            You seem to be caught up in statistical processes and assume it reflects real physics. That is nonsense.

            You claim twenty years is noise; ask the likes of NOAA they have a different interpretation. So did Jones. Selective use of data again.

            Sure, take longer time frames the answer is basically the same. Whether we take the last 17 years or the last 70 years or the last 140 years the sensitivity is nowhere near the IPCC alarmist proposal. This assumes that all of the T change is due to CO2. That is a very noisy assumption indeed, given we emerged from the LIA.

            What caused that? More noise? Who says it isn’t noise now?? Surely not you, David.

            I note you have not defined a clear, quantifiable, falsifiable hypothesis. The models fail so they can’t be right. Hansen failed so he can’t be right. I guess that only leaves you!

          • David A. says:

            “You seem to be caught up in statistical processes and assume it reflects real physics.”

            Statistics are statistics, with nothing to do with physics. Physics is physics, but the physics is too complex to lead to precise projections; hence its conclusions are given as probability distributions.

            “You claim twenty years is noise; ask the likes of NOAA they have a different interpretation. So did Jones.”

            So? I’m not bound by anything anyone else says (or once said).

            Huffington Post:
            “Dr. Gavin Schmidt, a climatologist and climate modeler at NASA’s Goddard Institute for Space Studies, told The Huffington Post last month that although these temperature records are significant, they are just one piece of the data that “point[s] towards the long-term trends” of warming. He cautioned against focusing too intently on any one month or year, but rather the broader scope of human-caused climate change.”
            http://www.huffingtonpost.com/2014/10/13/warmest-september_n_5978678.html

            “Sure, take longer time frames the answer is basically the same. Whether we take the last 17 years or the last 70 years or the last 140 years the sensitivity is nowhere near the IPCC alarmist proposal. This assumes that all of the T change is due to CO2.”

            No, 17 years isn’t the same as 170 years — over the latter short-term oscillations tend to cancel out, which is not the case over 17 years.

            Nor does the IPCC assume all of the T change is due to CO2. Not at all:

            http://www.ipcc.ch/publications_and_data/ar4/wg1/en/figure-ts-5.html

            You might try reading their documents before dismissing them.

            “I note you have not defined a clear, quantifiable, falsifiable hypothesis.”

            Climate science isn’t an experimental science — you can’t do experiments with the only climate you have. (You also can’t do that in many areas of geology, ecology, evolutionary biology, epidemiology, medicine, astronomy, and more.) No one has defined a clear, quantifiable, falsifiable hypothesis about whether smoking causes lung cancer. Yet the evidence that it does is overwhelming. It’s the same with climte science:

            http://climatechangenationalforum.org/teaching-climate-change-through-six-questions/

          • tonyM says:

            David,
            You now have me in stitches. You wish to hang on to the “science” label but not subject it to testing. What you claim is not science, by definition. Feynman has some really nice colourful ways to talk about the scientific method and cargo cult science.

            Pointless taking it any further.

            And you are wrong that it can’t be tested. Every quantifiable prediction ever made based on whatever ephemeral, fairy land hypothesis you have in mind is a test of that elusive hypothesis. Even stating we are going to warm by X is a test. The only difference is you don’t wish to be subjected to hypothesis testing.

            I will give Hansen his dues; he did have the guts to subject his hypothesis to testing.

          • lewis says:

            I suggest using June of 1980 to Jan of 2000.

  17. The papers are full of nonsense and excuses to try to keep soon to be obsolete AGW from becoming obsolete which it will be before this decade ends.

    How many false reasons have come out of AGW camp?

    • Christian says:

      See:
      Christian says:
      November 3, 2014 at 5:32 PM

      And:

      Christian says:
      November 3, 2014 at 5:27 PM

      I think why talking some people about climate and dont know about Basics, like a variable hight of Tropopause…

  18. You forgott, the higth of Tropoause is not stabil and is low and high latitudes, arround 8km near the polar caps, also see

    If that was for me no I did not forget that.

    • Christian says:

      Then you have to agree that Sat based constrains of AOD could be wrong, because the didnt meassure under 15km.

      In that way, not the Work but what you telling before is nonesens

  19. bassman says:

    Just wait a few years Salvatore.

    Christian, Robert Way seems to think its a really big deal on twitter. It will be interesting to see what other scientists think.

    • Christian says:

      Hi Bassman,

      I could mean, that Models not went wrong to Climate Sensivitiy, more incorrect Imput-Forcing. This is not only a Impact to this, all newer Works with lower Climate-Sensivity could be also wrong, because overeastimating Forcing in recent Hiatus.

      Greets

  20. It is not a big deal now nor has it been in the past. If it were there would be data to show this to be the case.

    I don’t have to wait a few years one can see AGW is not happening already.

  21. Then you have to agree that Sat based constrains of AOD could be wrong, because the didnt meassure under 15km.

    In that way, not the Work but what you telling before is nonesens

    Show us the data. That is the trouble with AGW enthusiast they can’t provide data aLl they provide is BS.

    • Christian says:

      ??? Just look to new work or are you to angry about? In Fact, you are to fanatic to me, you sorted people in classes like AGW enthusiast and that tells me, that it never be a serios discuss with you.

      It that way, belive what you want to belive but i am not in a Church like you

  22. As was just mentioned 56 excuses so far.

    • David A. says:

      Why does the pause have to have just one cause? Why can’t it have many contribuing factors?

      These aren’t “excuses” — they are hypotheses. That’s what scientists do when theory doesn’t match observations — they poke all around to see what they missed. They have to poke though the observations, too, to verify the correctness of the models that give the data. You’re seeing science in action.

      P.S. The “pause” only appears in one of seven datasets: RSS LT. It is absent or a slowdown in UAH LT, GISS, NCDC, HadCRUT4, C&W, HadSST3, and global ocean heat content.

      Why are you focusing on the one and ignoring all the others? (No need to answer; it’s a rhetorical question.)

  23. look at excuse number 6 it is debunked.

    • Christian says:

      And Then?

      1. Single Studie Syndrom?
      2. What they looking for? look they also under 15km or uses only AOD?

      I think you not understand what the Paper is saying.

  24. bassman says:

    Christian, not sure what you are saying completely. The abstract seems to suggest well read it…

    “incorporating these estimates into a simple climate model, we determine the global volcanic aerosol forcing since 2000 to be −0.19 ± 0.09 Wm−2. This translates into an estimated global cooling of 0.05 to 0.12 °C. We conclude that recent volcanic events are responsible for more post-2000 cooling than is implied by satellite databases that neglect volcanic aerosol effects below 15 km.”.

    This could account for over half of the slowdown. Throw in negative PDO or missing Arctic temps alone and it suggests that rapid warming will return in ver short order. It means that low sensitivity models as you suggest are really unrealistic.

    • Christian says:

      Hi Bassman,

      Its very simple, Papers like Otto et al. (2013) constrain ECS by:

      ECS=2xC02*(dT/(df-dQ) where 2xCo2 is a Forcing of Co2 (arround 3.7W/m^2), dT the Change of Temperature, dF change of Forcing and dQ the chance of System Heat Uptake.

      If vulcan Forcing was undereastimate for recent period, means that, increased Forcing was overeastimate for recent period.

      This would cause a increase in the ECS (Eqibrilimum Climate Sensivtity)

      i hope you now better understand.

      Greets

  25. http://www.warwickhughes.com/hoyt/scorecard.htm

    Here is the performance of AGW models . What can you say wrong on everything.

  26. Christian just go on believing. The blind leading the blind.

  27. bassman says:

    If at this point anyone suggests that CO2 isn’t a main driver of longterm climatic changes it is a safe assumption that they are crazy or lying.

    Temps are breaking records month after month, ocean warming is now relentless, I am just arguing over sensitivity. Most of the wacky theories on here are just unhelpful to anyone reading them.

    • JohnKl says:

      Hi Bassman,

      You accused:

      “If at this point anyone suggests that CO2 isn’t a main driver of longterm climatic changes it is a safe assumption that they are crazy or lying.”

      Define long-term. We’ve been in an ice-age for several thousand years, do you believe it’s due to excess CO2?

      Thanks and have a great day!

      • bassman says:

        Orbital forcings, see below. Its also useful to point out one of the most important GW graphs available. See link:

        http://www.ncdc.noaa.gov/indicators/

        • JohnKl says:

          Hi bassman,

          You stated:

          “Its also useful to point out one of the most important GW graphs available. See link:”

          You link to a Noaa site. Which one of the GW graphs do you find “most important” among all the ones on the site?

          Thanks for the reply and have a great day!

      • David A. says:

        JohnKl says:
        “We’ve been in an ice-age for several thousand years”

        No, we’ve been in an interglacial period for about 10,000 years, not the glacial phase of an ice age.

        • JohnKl says:

          David A,

          You state:

          “No, we’ve been in an interglacial period for about 10,000 years, not the glacial phase of an ice age.”

          Really? Then why do the glaciers continue to exist when the Geological evidence quite clearly indicates they have not in the past? We have undergone a warming period for several thousand years, just ask Charles Lyell and Louis Aggassiz, but we continue to experience a glacial period even if the glaciers have been reduced enormously in size over the last few thousand years.

          Btw, you suffer from cognitive dissonance. An interglacial period occurs during an ice-age!!! Even Wikipedia apparently understands this:

          “An interglacial period (or alternatively interglacial) is a geological interval of warmer global average temperature lasting thousands of years that separates consecutive glacial periods within an ice age. The current Holocene interglacial has persisted since the end of the Pleistocene, about 11,700 years ago.”

          Thanks, and have a great day!

        • David A. says:

          Come on — the term “ice age” depends on what time period you’re talking about. In the ice ages of the last 2-3 Myrs, the glacial interval of the most recent oscillation was about 100,000-20,000 years ago, and now we’re in an interglacial period. There can certainly be glaciers in an interglacial period.

          Over tens of millions of years, we’re in a glacial period.

          “We have undergone a warming period for several thousand years, just ask Charles Lyell and Louis Aggassiz…”

          That’s not what paleoclimatology says:

          http://skepticalscience.com//pics/regemcrufull.jpg

          from Marott et al, Science (2013).

          “An interglacial period (or alternatively interglacial) is a geological interval of warmer global average temperature lasting thousands of years that separates consecutive glacial periods within an ice age. The current Holocene interglacial has persisted since the end of the Pleistocene, about 11,700 years ago.”

          That’s exactly what I said.

          • JohnKl says:

            Hi David A,

            So much silliness, so little time. You asserted:

            “In the ice ages of the last 2-3 Myrs, the glacial interval of the most recent oscillation was about 100,000-20,000 years ago, and now we’re in an interglacial period. There can certainly be glaciers in an interglacial period.”

            Hmmh! This at best expresses speculative fancy as to ice-ages 2-3 million years ago. As I’ve mentioned on many past threads the permafrost remains trapped in the ice are CARBON DATABLE!!! If the remains of once living organisms contain the carbon 14 isotope the must be something less than 30-40k years old, because the carbon 14 half-life is only 5700 years. As to the interglacial period we’ve already established that this occurs during an ICE-AGE!!! Please read the previous post.

            Regarding your claim:

            “That’s not what paleoclimatology says:

            http://skepticalscience.com//pics/regemcrufull.jpg

            Thanks, but no thanks! Your dubiously named skeptical science link to a SPECULATIVE graph doesn’t represent the limits of paleoclimatology by a long shot.

            Thanks for the reply and have a great day!

          • JohnKl says:

            Hi David A,

            Excuse me I almost forgot you mentioned:

            ““An interglacial period (or alternatively interglacial) is a geological interval of warmer global average temperature lasting thousands of years that separates consecutive glacial periods within an ice age. The current Holocene interglacial has persisted since the end of the Pleistocene, about 11,700 years ago.”

            That’s exactly what I said.”

            Not really. You suggested the interglacial period was not part of the ice-age. Please re-read your previous post.

            Thanks again and have a great day!

    • Fonzarelli says:

      Bassman, was CO2 the main driver of warming a century ago?

      • bassman says:

        Fonzarelli, Even Matt Ridley suggests human influence of GHG goes back that far (The Rational optimist). It was one factor among others., nothing like the change in atmospheric levels going on right now. Look at the ice cores, orbital forcings initiate the change but CO2 in the past can be viewed as a secondary factor (positive feedback) in response to the orbital forcings of the past ice ages and interglacials. Right now of course, CO2 is the initial and I should say incredibly abrupt forcing driving warming at present and well into the future. Absolutely nothing in current scientific literature comes close to the abrupt energy balance we are not experiencing except anthropogenically induced GHG levels.

      • Christian says:

        Hi Bassman,

        Your Statement is oversimplefied, you see on the comments, that will be missunderstood. Its more clear if you say, human emissions are main driver.

        Another approach is to testing it by using a EBM (Energy-Balance-Model) and a while ago i ve written one. The results shows cleary, that radiative Forcing(includes also natural Forcing) is very good but less good before 1900 because Uncertainy in Forcing and Temperature is large before then.

        Greets

    • “If at this point anyone suggests that CO2 isn’t a main driver of longterm climatic changes it is a safe assumption that they are crazy or lying.”

      I doubt many climate scientists believe a statement like that. Ice ages caused by CO2? 😉

      Of course it depends what one means by “longterm” but I’d suggest that such a word be left undefined so that the claim is too vague to mean anything and therefore cannot be disproved.

  28. bassman says:

    Christian, more papers would help of course. This paper does seem both novel and important. Further confirmation can only help. Do you know the authors?

  29. bassman says:

    Yes, I understand Christian. Thanks. I guess we will see who talks about this paper in the next week or so to see its relevance in the research world. It seems like it could be just as important as the Cowtan and Way paper from this time last year. All that being said, variations like this may not matter in another decade or so with GHG forcing reaching such a high level.

  30. Not being a “linguistic” I maybe fail to understand large parts of the conversation. So,– I shall leave, — May be back when I am ejjacted ennuff.

  31. D o u g  C o t t o n   says:

    To prove the greenhouse conjecture is wrong you need nothing more than what is in my comments starting here above. Take me on anyone!

    To explain what really supplies the necessary thermal energy to raise the surface temperature of Venus by 5 degrees in its day, to keep the base of the Uranus troposphere hotter than Earth, to keep the core of the Moon hundreds of degrees above its maximum surface temperature and to explain all Solar System (including Earth’s) temperatures you need an understanding of the “heat creep” process so far documented and explained by only two researchers, Teofilo Echeverria and myself.

    Try to explain these any other way, anyone! No one has qualified for the $5,000 reward yet for proving the content of my book “Why It’s Not Carbon Dioxide After All” to be substantially incorrect.

    • Christian says:

      Ok, can i have now the $5.000?

      You say:

      “The assumption is made that so-called “backradiation” from a cold atmosphere is able to transfer thermal energy to a surface which is warmer than the source of the radiation. This is a physical impossibility”

      http://www.climate-change-theory.com

      Are u kidding?

      ” Scattering occurs when a photon Electromagnetic radiation of all wavelengths is made up of photons, massless particles which, mathematically, behave more like waves. impinges on an obstacle without being absorbed. Scattering changes only the direction of travel of that photon. Gas molecules, with small sizes relative to the wavelength of the incident radiation cause scattering in all directions, both forwards and backwards, known as Rayleigh scattering.”

    • jimc says:

      Doug, a thermodynamist invented a parlor riddle to test his math and physics friends with. He proposed two glasses of wine; one with red and one with white; otherwise identical in all ways. He then transferred a spoonful of white to the red glass, and then a spoonful of the mixture from the red to white. He then asked his friends to tell him which glass had the most impure mixture in it. To him, the answer was trivial; they were equally impure. But there was enough algebra and chances for slipups that his friends first asked questions about how well the first mixture was stirred, and then came up with a variety of answers; some right, some wrong; but all obtained the hard way.

      Joe Loschmidt (JL) was a thermodynamist who likewise tested his contemporaries with a riddle of a different sort, intentionally or not. He proposed that there is a “gravito-thermal effect” (that in a column of gas, liquid or solid at equilibrium, gravity alone would cause the matter at the bottom to be warmer than that at the top), and came up with a mental experiment based on particle motion to demonstrate it. The demonstration was subtle enough that he could easily hide a fallacy in it, wittingly or unwittingly. His conjecture didn’t fool most of his contemporaries, just a few. In the ensuing decades, a few others have been taken in. JL was a clever man. I don’t claim to know where he hid his fallacy (I haven’t even read his demonstration – he wrote in German); but hide it he did. My scheme uses only the 0th and 1st laws in a direct manner with only a brief reference to the 2nd law. His was a more roundabout excursion. But, as Einstein said, things should be kept as simple as possible.

      I’ve already shown earlier that merely applying gravity to a flat rigid adiabatic box of gas does not change its temperature. Next I’ll show that there is no equilibrium temperature gradient in a vertical rod due to gravity. I’m an amateur so it’ll be awkward; not as elegant as others could do or undoubtedly have already done. But it does the job. Then, after that, I’ll extend that to a vertical column of gas.

      • jimc says:

        We begin with a vertical rod and cut it into two half-rods of equal length. Each is placed in a thermally insulating enclosure; with a slight modification. The ends of the enclosures can be opened temporally so that the bottom end of the top half-rod can touch the top end of the bottom half-rod, and so thermally communicate with it. The enclosures are joined by a wire over a pulley so that the upper/lower positions of the rods can be swapped with no expenditure of work. At the position of the top half-rod is a mechanism that can be attached via insulating arms to the ends of that rod and convert the force and the displacement of contraction of the rod as it cools to work. Likewise at the position of the bottom rod for expansion as it heats.

        Initially, we have the two halves and their containers touching and behaving thermally as a full rod. If there is an equilibrium gradient, wait for it to establish itself. Then separate the half rods, seal the containers, swap the rod positions, connect each to its work mechanism, and joint them thermally. The top half-rod now being hotter, heat will flow from it to the lower – for two reasons; thermal conductivity equalizing temperature differences and the reestablishment of the gravity induced temperature gradient. The mechanisms extract work from each half-rod – presumable at the expense of heat energy and temperature of full rod system. When the gravity caused gradient is reestablished, repeat the process of swapping and waiting for a new equilibrium until the rods reach absolute zero and all their heat energy has been converted to work. By assuming a thermal gradient, I’ve violated the second law – big time. Therefore there is no temperature gradient.

        Ah, I can see that “I’ve-found-a-loophole” look in your eye. Potential energy (PE) is being shifted around when the two containers and their contents are being swapped. Not so fast. The two half-rod/containers had their positions swapped with no net work into their combined system, yet work was removed via the mechanisms. The wire does exert work, positive or negative, on each half-rod/container system, but externally to them. Each half-rod does not know what’s going on externally to its container. It only feels the force of gravity through the container wall. To it, there is no displacement though. And no work is passing through the container wall via the lumineferous aether or any other spooky means either. PE and KE, like height and velocity, have to be with respect to a reference to have meaning. You can choose the coordinate reference that makes the calculations simplest. For each half-rod, I choose its container. For the overall system, I chose the earth/pulley/post-holding-the-pulley-up reference. You can’t have PE change within the world of half-rod/container and within the world external to it. That would be double accounting. The rod receives none to the PE change that it is free to convert to heat or whatever. This alone refutes JL’s conjecture. The swap occurs with no energy transfer to or from the half-rods. In their adiabatic containers, where would they find the energy?

      • jimc says:

        So, now we have that applying gravity alone to a flat box of gas does not change its temperature, and that there is no equilibrium temperature gradient induced in a vertical rod by gravity alone.

        Now we have a vertical column of gas in a uniform gravitation field. JL’s conjecture was that the gas would have an equilibrium temperature gradient; being hotter at the bottom than the top. Open the box containing the gas column and toss in a rod of length equal to the height of the column. The rod has no equilibrium thermal gradient, and so its thermal conductivity equalizes the temperature profile of the gas. In fact the conductivity of the gas alone would do it. Or, cut the rod into two equal halves again, insert a thermopile in the break and conduct the work produced to the outside. Let the system run until all the heat energy of the gas is converted to work and removed. It would be a nice trick; I could occasionally open the box, let a little more heat in, and eventually convert all the heat in the universe to work. But there is no induced temperature gradient.

        So, now we have that applying gravity alone to a flat box of gas does not change its temperature, and there is no equilibrium temperature gradient induced in matter by gravity alone.

      • jimc says:

        Don’t forget that charity.

      • jimc says:

        Just as an aside, since the gradient JL came up with was the same as the adiabatic lapse rate, one would suspect that he simply didn’t wait long enough for the temperature to reach equilibrium. He let the gas in his idealized column slump, creating a higher pressure at the bottom and thus (temporarily) a higher temperature (via ideal gas). But that’s neither here nor there.

  32. Christian says:

    To get it rigth for you:

    Co2 and other Stuff dont warms the Planet, but make the Planet less to cool and and this less cooling and stabil solar imput cause “global warming”.

  33. D o u g  C o t t o n   says:

    I have debunked the greenhouse “33 degrees of warming” (as in the IPCC website) because the 255K is totally wrong for the nitrogen only atmosphere. The incident mean radiation is 340W/m^2 and the mean emissivity of the rocky planet is certainly not 1.00 and if it is 0.85 then the temperature would be 290K and if 0.90 then the temperature would be 286K – these being just 2 degrees either side of the existing mean of 288K, so there’s nothing like 33 degrees of warming, and most probably there’s cooling because emissivity for the rocky planet is fairly sure to be less than 0.85. I’m just using Stefan Boltzmann calculations. What does anyone think is wrong with my input data or the calculations?

    • David A. says:

      Doug is known to be a serious amateur prankster. He’s tried to pull this prank a few times before.

      • D o u g  C o t t o n   says:

        Yes – as I said 340W/m^2 comes through a pure nitrogen atmosphere free of GHG and back radiation. In your link NASA shows 342W/m^2 so poor David A is proven wrong by NASA and I am proven right – within 2W/m^2 anyway. But then David made a faux pas when he divided 1360 by 4 and got … wait for it … 239W/m^2 n a comment above.

        • David A. says:

          Doug, do you understand algebraic notation? It seems not. S/4 is not equal to 239 W/m2, but this is:

          (1-albedo)*S/4 = 239 W/m2

    • John says:

      255K

      Take a planet with no atmosphere and 255K surface temperature. Add a Nitrogen atmosphere whose bottom is 255K. Result: no net heat transfer of any form between atmosphere and surface or space => no change in surface temperature. QED.

  34. Werner Brozek says:

    With respect to how long the warming is not statistically significant for UAH, from
    http://moyhu.blogspot.com.au/p/temperature-trend-viewer.html
    and going to September:
    May 1996 to Sep 2014 
    Rate: 1.124°C/Century;
    CI from -0.024 to 2.272;
    This is 18 years and 5 months.

    • David A. says:

      Werner, you keep deflecting the question of how you’re determining statistical significance. What model are you assuming for the noise? Without that information, “statistical significance” is meaningless.

      • Werner Brozek says:

        Please go to the indicated site and ask Nick Stokes for further information. He can give you the answers that I can not give.

        • Nick Stokes says:

          The model is conventional Ar(1). Discussion here.

          The reason UAH has such a long period without significant uptrend is that the month-month autocorrelation is quite high, so reduced d.o.f, a,d wide CI’s. The trend itself is not very much less than model predictions.

          • David A. says:

            Thanks Nick. Have you thought about trying to extend calculation of the autocorrelation to the ARMA(1,1) used by Foster and Rahmstorf ERL (2011)?

            http://iopscience.iop.org/1748-9326/6/4/044022

            (see their Appendix)

          • Nick Stokes says:

            David,
            Yes, that’s what I consider in the discussion linked above. ARMA(1,1) seems to better express short-lag autocorrelation. But as lag increases, the autocorrelation drops below ARMA, then below Ar(1), then goes negative. Ar(1) doesn’t go negative, but may be a better approx overall.

            Put another way, part of the variation is random, part periodic. The periodic actually creates less uncertainty in the trend than random. The ARx aproxs overstate the effect of random variation – ARMA(1,1) more so. On the other hand, the periodic part does contribute some uncertainty.

            Upshot – unclear, but Ar(1) is more standard.

        • David A. says:

          You need to know, Werner, instead of blindly plugging numbers into someone else’s calculator with no understanding of what you’re doing.

          • Nick Stokes says:

            David,
            Werner and I have discussed it quite a lot. He was inclined toward ARMA, as used by the SKS calculator. I think he has made reasonable inquiry.

  35. Aaron S says:

    David A and Bassman et al., I recently spoke to a well published agw expert and he could not answer this question and neither can you bc it exemplifies how half baked and incomplete the IPCC models are. “Why isnt there a range for solar variability forcing climate considered in the models?” There is plenty of data to justify a potentially stronger solar impact on climate (even based on IPCC review of cosmic rays, and the relationship between climate events like the little ice age and solar activity) and we know that last century the sun transitioned into an abnormally active phase from 1950 to 2000 before returning to normal maybe low activity levels. The facts are the feedbacks dominate the warming in the IPCC models not CO2 so if part of the warming until 1998 was natural and related to the sun then the removal of this forcing mechanism will greatly impact the models accuracy. All models even simple ones are hypotheses not solutions. I dont know how science got so misguided, but i think politics has a big role. (For example the construction of departments like atmospheric science with diverse, like-minded faculty and the NSF funding so one- sided). So you dont have to throw out CO2 as a ghg or even some feedbacks to confidently say the models are potentially wrong and based on the comparison between data and predictions the models are almost certainly wrong. So why are we even holding on to this fantasy that they can predict climate?

    • D o u g  C o t t o n   says:

      It’s all natural Aaron. We don’t need models based on false assumptions like 255K surfaces without GHG. Ignore David A. who can’t even divide by 4 correctly to get 1360 / 4 = 340W/m^2. That flux raises a rocky surface (with emissivity 0.85) to about 290K as we deduce with standard physics. So there’s no “33 degrees of warming” because the surface would have to be hotter than 255K with no GHG in the atmosphere and would in fact be close to the current temperature anyway, and poor David A doesn’t have a hope of proving that wrong.

      As I also explained in a comment above, the natural climate cycles are caused by planetary orbits (via magnetic fields that reach to the Sun) and we can predict climate from the inverted plot of the scalar sum of the angular momentum of the Sun and all the planets. (It’s on my site earth-climate dot com)

      • Christian says:

        Doug,

        Again, are you kidding us? Scattering is needed, or ask your self, why is the clear sky blue? If you cant get exepts simple physics there is no more a way to talk with you

      • bob droege says:

        You need to use the correct value for the emmisivity of earth.

        hint: it isn’t 0.85

    • Christian says:

      @ Aaron S.

      1. Solar Variability is a Imput to Climate Models
      2. Abnormally active phase isnt real, because there are many Bias in our Observations of SSN or look here: http://ssnworkshop.wikia.com/wiki/Presentations_4 there is no more support for a abnormally aktive phase and Scientist in Solarphysics are build a new Sunsport-Series which corrects a few bias in Observations
      3. You fully missunderstood what Climate Models do and whats Imputed and whats Outputed, because solar Forcing is a Imput in Model which or just looking for GISS ModelE-Forcing: http://data.giss.nasa.gov/modelforce/RadF.gif
      4. There a many doubts about Little Ice Age and Solaractiviy, because LIA has coolder and warmer episodes and it could be, that onset was due vulcanic activity, see also: http://onlinelibrary.wiley.com/doi/10.1029/2011GL050168/abstract;jsessionid=D118E7BFEF41A24E6C0DF7B1F7B75F65.f03t04

      You see, its not so simple like you talk

    • David A. says:

      Aaron wrote:
      “Why isnt there a range for solar variability forcing climate considered in the models?”

      Because it is very low — lower than the error bars on several other forcings. From the IPCC 5AR WG1 Ch8 Executive Summary pg 662:

      “Satellite observations of total solar irradiance (TSI) changes
      from 1978 to 2011 show that the most recent solar cycle minimum
      was lower than the prior two. This very likely led to a small
      negative RF [radiative forcing] of –0.04 (–0.08 to 0.00) W/m2 between 1986 and 2008. The best estimate of RF due to TSI changes representative for the 1750 to 2011 period is 0.05 (to 0.10) W/m2.”

      You can compare that to other forcings:

      http://en.wikipedia.org/wiki/Radiative_forcing#mediaviewer/File:Radiative-forcings.svg

  36. Tim says:

    The icelandic Volcano has been pumping out CO2 and Sulphur the last six months or so, the last time an Icelandic Volcano went off we ended up with a severe winter in the UK. Even though this volcano hasn’t been so head line, it is the biggest eruption in 200 years. Expect this to seriously effect temperatures in the Northern Hemisphere and cause a phase of serious global cooling.

    • Christian says:

      Strong cooling is very unlikly. Because the Icelandic Volcano Emissions went to troposphere, where is cooling effect is much less Powerfull because residence time is only a few days.

      And its weak to he human emissons of So2, just compare:

      Icelandic Volcano: 20.000-60.000 Tons/day
      Human: 183.000-254.000 Tons/day

  37. Salvatore, you are a broken record impervious to data:

    “Salvatore Del Prete wrote (July 13, 2013): “”I think the start of the temperature decline will commence within six months of the end of the solar cycle maximum and should last for at least 30+ years.””
    http://www.drroyspencer.com/2013/07/uah-v5-6-global-temperature

    My reply to David

    Exactly and guess what David the solar maximum has not ended therefore there is no way to know if I am correct or not at this juncture.

  38. This was almost 4 years ago:

    “…here is my prediction for climate going forward, this decade will be the decade of cooling.”
    – Salvatore del Prete, 11/23/10

    From David and I have not changed my mind. Where I have been wrong is with how long the solar maximum has lasted, not the climate. In the long run however this is probably an indication of how weak this solar cycle will be and once it declines it should stay that way for many years. This could be one of the longest solar cycles ever.

    I am only wrong if my solar criteria is met and the climate does not respond to cooler conditions.

    One of my criteria has been met which is several years of sub-solar activity. However not until this solar maximum ends and solar conditions return to the criteria I have mentioned on this site many times will we know if I am correct or not correct.

    • David A. says:

      30-day TSI peaked in April. Sunspots peaked in February.

      I bet a year from now you’ll still be making the same predictions you always do, or finding an excuse why they haven’t come true. In fact, I bet you’ll be doing that 10 years from now.

  39. Note that the peak sunspot number was in Feb 2014.

    “Temperatures in response to this will decline in the near future, in contrast to the steady state of temperature we presently have,or have been having for the past 15 years or so
    David says I said. I was wrong the peak was not Feb. 2014 it is still going on. So we will have to wait and see.

  40. What proves AGW theory to be wrong is simply the climatic historical record which shows climate variations to be many times more abrupt and greater in degree of magnitude then the some .7 c degree warming that took place from 1850 -1998 .

    The climate from 1850-1998 was very stable in comparison to other intervals of that length over the past 20000 years, when man had no influence.

    Not that he does now.

  41. Let’s assume that Anthropogenic Greenhouse Era began Thousands of Years Ago if it did why did the temperatures reverse many times? Why did it not sustained itself?

    According to AGW once this starts it should keep going because of all the positive feedbacks and it should not only sustain itself but probably accelerate.

    When one looks at the historical climatic record going back 1000’s of years there is no such occurrence. In fact the climate has been in an overall cooling trend since the HOLOCENE OPTIMUM some 6000 years ago, not to mention the Little Ice Age from approximately 1350-1850 ad.

    How could that possibly happen if AGW theory is correct? What mechanism could cause a reversal of the effects of GHG once they had got started? What is over powering them? It must be something.

  42. The Paleocene–Eocene Thermal Maximum (PETM), alternatively “Eocene thermal maximum 1” (ETM1), and formerly known as the “Initial Eocene” or “Late Paleocene
    Another example. If GHG theory is correct why did this reverse once it had started some 55 million years ago? Answer that one for me Christian.

    Thermal Maximum” refers to a climate event that began at the temporal boundary between the Paleocene and Eocene epochs. The absolute age and duration of the event remain uncertain, but are thought to be close to 55.8 million years ago and about 170,000 years of duration[1][2][3] The PETM has become a focal point of considerable geoscience research because it probably provides our best past analog in which to understand impacts of global warming and massive carbon input to the ocean and atmosphere, including ocean acidification.[4]

    The onset of the PETM has been linked to an initial 5 °C temperature rise and extreme changes in Earth’s carbon cycle.[5] The PETM is marked by a prominent negative excursion in carbon stable isotope (δ13C) records from around the globe; more specifically, there was a large decrease in 13C/12C ratio of marine and terrestrial carbonates and of organic carbon deposited on ocean basins.[5][6][7]

    • David A. says:

      Salvatore wrote about the PETM:
      “If GHG theory is correct why did this reverse once it had started some 55 million years ago?”

      The PETM lasted about 200,000 years. (Some of our emissions will last about as long in the atmosphere.) In that time the normal carbon cycle of the Earth, including weathering, has taken up the extra carbon in the oceans and atmosphere, with volcanoes resuming as the only source of CO2.

      Really, Salvatore, if you’re going to ask basic questions, and base your AGW stance on thinking no one has ever asked them before, you need to be more familar with what is already known. I recommend the papers of David Archer and James Zachos.

  43. Have them explain why the Paleocene -Eocene Thermal Maximum ended.

    How could it end if GHG cause positive feedbacks which keep the temperature rising . What ended it?

    Why was there an Ice Age during the ORDOVICIAN PERIOD when CO2 was over 4000 ppm?

  44. They have no explanation and neither do you.

  45. http://www.americanthinker.com/2009/01/co2_fairytales_in_global_warmi.html

    The data the facts which do not support their idiotic article in the least. Especially their dumb explanation for the Little Ice Age.

  46. Christian says:

    First i am not a Library, then if you looking million years ago, you have to accounting continental drift. And for you: http://www.sciencedaily.com/releases/2012/02/120201094923.htm

  47. Christian what ended the Paleocene–Eocene Thermal Maximum (PETM), alternatively “Eocene thermal maximum 1″ (ETM1),?

    Something ended it right. Maybe solar/geomagnetic field strength variations(primary and secondary effects) along with Milankovitch Cycles. That is my guess. What is yours?

    • Christian says:

      The beginning was the end, there was (in discuss methane hydrate and perma frost) a anormal release of GHGs which has caused the warming in a very short (on geological) time and reach then near eqibrilium but can not hold because other factors do not support this temperature level and temperature and GHC begun to normalise (delayed).

      The same would happen if we stop increase GHG-Level, the Climate would (between 100 and 1000 of Years) increase after begin to decline, if other factor be on cool side.

      So whats the Problem?

    • David A. says:

      The carbon cycle ended the PETM, just like it will (eventually) end the AGW (unless we take CO2 out of the atmosphere.)

      “The PETM lasted more than 150,000 years, until the excess carbon was reabsorbed.”
      – National Geographic, Oct 2011
      http://ngm.nationalgeographic.com/2011/10/hothouse-earth/kunzig-text

      • david dohbro says:

        “take CO2 out of the atmosphere”…. Are you insane?? We’ll all be dead within 2yrs, even with levels below 150ppm! Plants’ stoma will not be able to take up CO2 at levels much below that due to passive uptake that requires a certain partial pressure.

        NO CO2 NO LIVE…

        A planet that doesn’t change is a dead planet. Everything changes, constantly, always. From the moment it is conceived to the moment it dies, and even when it’s dead it still changes. Get over your fear of change, look in the mirror to see how much you change even on a daily basis (unless you look exactly the same when you wake up, as when you went to bed)… Embrace it and let go of your ungrounded fears.

        CO2 IS LIVE!!

  48. David pay attention below is my parameters for solar activity in order for solar to promote a cooling effect upon the climate.

    Solar activity right now is way above this criteria hence the jury is still out.

    THE CRITERIA

    Solar Flux avg. sub 90

    Solar Wind avg. sub 350 km/sec

    AP index avg. sub 5.0

    Cosmic ray counts north of 6500 counts per minute

    Total Solar Irradiance off .15% or more

    EUV light average 0-105 nm sub 100 units (or off 100% or more) and longer UV light emissions around 300 nm off by several percent.

    IMF around 4.0 nt or lower.

    The above solar parameter averages following several years of sub solar activity in general which commenced in year 2005..

    IF , these average solar parameters are the rule going forward for the remainder of this decade expect global average temperatures to fall by -.5C, with the largest global temperature declines occurring over the high latitudes of N.H. land areas.

    The decline in temperatures should begin to take place within six months after the ending of the maximum of solar cycle

  49. http://www.swpc.noaa.gov/SolarCycle/

    The current state of solar activity and recent activity.

    As you can see it is above my criteria since solar cycle 24 maximum came about around 2011.

  50. According to my thinking a solar flux reading of 90-150 is neutral for the climate while an Ap index between 5 -12 is neutral.

  51. The beginning was the end, there was (in discuss methane hydrate and perma frost) a anormal release of GHGs which has caused the warming in a very short (on geological) time and reach then near eqibrilium but can not hold because other factors do not support this temperature level and temperature and GHC begun to normalise (delayed).

    MY REPLY

    The problem is the GHG’s are suppose to cause a positive feedback with water vapor and this should not only feed upon itself but accelerate going forward not come to a sudden halt much less a reversal according to AGW theory.
    Further if you look at historical CO2 concentrations versus temperatures there is no correlation and even worse CO2 ALWAYS follows the temperature it never leads it.

    • David A. says:

      Salvatore wrote:
      “The problem is the GHG’s are suppose to cause a positive feedback with water vapor and this should not only feed upon itself but accelerate going forward not come to a sudden halt much less a reversal according to AGW theory.”

      You are hardly the first person to ask this question. GO READ THE LITERATURE for the answer.

  52. The PETM lasted about 200,000 years. (Some of our emissions will last about as long in the atmosphere

    MY ANSWER
    You have to be kidding the life time of co2 in the atmosphere is nothing near that value.

  53. Paper finds lifetime of CO2 in atmosphere is only 5.4 years

    hockeyschtick.blogspot.com/2013/08/paper-finds-lifetime-of-co2-in.html

    Aug 9, 2013 – Contrary to the above findings on the concentration of fossil CO2 and its residence time in the atmosphere, in the Fourth Assessment Report of …

    The residence time of CO2 in the atmosphere is …. 33 years …

    euanmearns.com/the-residence-time-of-co2-in-the-atmosphere-is-33-years/

    Sep 3, 2014 – By Roger Andrews. An important consideration in estimating future greenhouse warming risks is how long CO2 remains in the atmosphere.

    • David A. says:

      It’s a presentation at a conference. Let’s see it pass peer-review and get into a journal. Archer’s work has.

      • david dohbro says:

        flawed argument of authority. just because it passes peer-lit review doesn’t mean it’s correct and valid (e.g. wakefield’s retracted autism study in the Lancet, Hwang Woo-suk retraced stem-cell papers in Science).

    • David A. says:

      This graph is a cartoon. The distant CO2 numbers come a climate model — the actual data points are about 10 million years apart.

      Read:

      “CO2-forced climate thresholds during the Phanerozoic,”
      Dana L. Royer, Geochimica et Cosmochimica Acta 70 (2006) 5665–5675
      http://droyer.web.wesleyan.edu/PhanCO2(GCA).pdf

      Also, remember that solar radiance decreases by 1% every 110 Myrs you go back in time.

  54. Where is the correlation where is the co2 rise at the Paleocene/Eocene climatic event period?

  55. david dohbro says:

    Thanks for the update Roy!

    The linear trends (I shiver when applying such a tool on none-linear, stochastic data… but for us simple fools linear will have to do…) are over the

    past 5 yrs: -0.017 C/yr (not stat. sign.)
    past 10 yrs: 0.006 C/yr (not stat. sign.)
    past 15 yrs: 0.012 C/yr (stat. sign.)
    since the 1998 El Nino peak: 0.009 C/yr (not stat. sign.)
    past 20 yrs: 0.012 C/yr (stat. sign.)
    entire data set: 0.014 C/yr (stat. sign.)

    That’s all there is to it. Draw your own conclusions, but not that GW is accelerating. Instead the opposite is true.

    • David A. says:

      The statistical significance depends on the model you choose for noise. Most at least use a model that includes lag-1 autocorrelation.

      I found that for HadCRUT4 over its entire record since 1850, the percentage of times the HadCRUT4 linear temperature trend is statistically significant (with lag-1 autocorrelation) not as often as you’re think.

      http://davidappell.blogspot.com/2014/06/more-on-significance-of-temperature.html

      For 15-year trends, less than 50% have been statistically significant.

      For 30-year trends, less than 60% have been statistically signifianct.

      • david dohbro says:

        I prefer to use a stochastic none-linear exponential moving average converging diverging indictor for long term time trend analysis of this type of data. the more data the better; no need to cherry pick any start or end dates. These type of trend analysis tools are highly successfully and been for decades used in the financial industry which deals with equally if not more complex data then GSTA. (luckily stock prices are not constantly adjusted and homogenized like surface temperature thermometer data…)

        However, albeit the simplicity of stochastic indicators, most people prefer and can more easily comprehend linear regressions, hence why i present this, with the caveat that it’s a totally wrong way of presenting temporal trends in GSTAs. In addition, and of course, we all know nothing in nature is linear, but everything is cyclical. stochastic CD analysis deals with this periodicity elegantly. LR doesn’t.

        due to the variability because of periodicity in monthly GSTA, correlation issue (i.e. low R2) are to be expected, hence longer term data sets are needed to find significance for linear test. But since GSTA are none-linear, stochastic, and cyclical, is doesn’t matter how much data there is. applying such linear regression is plane wrong: basic statistics. hence, it is irrelevant how much data supposedly is needed to find a statistical significant linear trend in none-linear data. You are simple using the wrong tool. You should have thought about that before doing your study and saved yourself a lot of time and effort abd be able to focus on something that scientifically and statistically is correct.

        it’s BS=Bad Science.

        Use the right tools for the right job!

  56. D o u g  C o t t o n   says:

    People can argue all you like about Earths without GHG or atmospheres, but empirical data (30 years of real world temperature data from three continents) has been used to prove with statistical significance that moist regions have lower daily maximum and minimum temperatures than drier regions at similar latitudes and altitudes. Water vapour cools because its radiation properties reduce the effect of the gravitationally-induced temperature gradient, thus lowering the thermal profile at the surface end.

    It is ludicrous to think that people can be so gullible as to believe that water vapour jacks up the temperature at the surface end by about 30 degrees whilst at the same time we know it reduces the temperature gradient by nearly a third in magnitude. What on Earth would happen to radiative balance if both these really did occur simultaneously? Are you one of the gullible people, or do you think?

    The radiative greenhouse conjecture is completely and utterly false and the sooner Roy and all lukes and warmists realise this the better.

    • David A. says:

      The greenhouse effect is easily measured by satellites:

      http://www.giss.nasa.gov/research/briefs/schmidt_05/curve_s.gif

      • D o u g  C o t t o n   says:

        Garbage. I have refuted that claim in my book. You are so naive regarding thermodynamics. Energy in CO2 molecules can be transferred by non-radiative molecular collision to water vapour molecules and then exit the atmosphere with water vapour wavelengths.

        You’re a beggar for punishment dishing up all the standard IPCC garbage which I’ve spent thousands of hours studying, thinking about, discussing and rebuking. Which of their standard garbage junk science claims do you want to give me next?

        • JohnKl says:

          Hi Doug Cotton,

          You correctly noted:

          “Energy in CO2 molecules can be transferred by non-radiative molecular collision to water vapour molecules and then exit the atmosphere with water vapour wavelengths.”

          Exactly! Moreover, water vapor emits in a much broader IR spectrum than the narrow CO2 one allowing for rapid atmospheric emission of IR to space. In fact, ten to hundred times faster than their supposedly ideal diatomic gas compound brethren such as oxygen which emits in the microwave range. In addition, the supposed CO2 lid on radiation within it’s emission range say 15 microns must be understood with discernment. Other planetary atmospheres like Mars emit a great deal of IR in the 15 micron range as observed by JPL satellites. Thanks for the post and …

          Have a great day!

          • JohnKL says:

            Please accept a Minor correction to my post. Compound should be substituted with element, in that an oxygen (O2) molecules are elements an CO2 molecules are compounds.

          • Jerry L Krause says:

            Hi JohnKl,

            Glad you have endorsed what Doug wrote. From the beginning I have noticed that he, at times, call attention to what I consider very fundamental scientific principles which I have not generally seen any one else doing. Think about those three lines because there might be more there than even Doug has discovered. Also, scroll down to another of Doug’s quite astute comments.

            Have a good day,

            Jerry

          • JohnKl says:

            Hi Jerry L Krause,

            Thank you for the reply. Doug makes many claims consistent with scientific knowledge. My previous dispute regarding Venus doesn’t detract from that fact. Aw you probably know, when one deconstructs the CAGW meme terms like CRACK-POT, DENIER, INDUSTRY SOCK-PUPPET and many more will fall from the fetid remains of once active minds.

            Btw, you may have read that Mercedes Benz developed a concept solar powered vehicle that uses photo-voltaic paint to capture light energy and power the vehicle. Marry the concept with something like a Nissan Leaf and/or Tesla electric vehicle (preferably with the battery technology available from Tesla) & it’s quite apparent humanity will not be using the internal combustion engine as extensively for a whole lot longer. So why the continued infantile statist push by the left to seize citizen access to hydrocarbons? It has nothing to do with the environment. Science and technology has long ago made their paranoia obsolete!

            Have a great day!

            “The most dangerous man to any government is the man who is able to think things out… without regard to the prevailing superstitions and taboos. Almost inevitably he comes to the conclusion that the government he lives under is dishonest, insane, intolerable.”
            H. L. Mencken

            “The whole aim of practical politics is to keep the populace alarmed (and hence clamorous to be led to safety) by menacing it with an endless series of hobgoblins, all of them imaginary.”
            H. L. Mencken

            “The urge to save humanity is almost always a false front for the urge to rule.”
            H. L. Mencken

            “War is the continuation of politics by other means.”
            Carl von Clausewitz

  57. David A. says:

    No one says water vapor causes a 30 C greenhouse effect. See:

    Lacis, A.A, G.A. Schmidt, D. Rind, and R.A. Ruedy, 2010: Atmospheric CO2: Principal control knob governing Earth’s temperature. Science, 330, 356-359, doi:10.1126/science.1190653.
    http://pubs.giss.nasa.gov/docs/2010/2010_Lacis_etal_1.pdf

    especially Figure 2.

    • D o u g  C o t t o n   says:

      Excuse me, David A. but it is very clear in the glossary section of the IPCC website that they claim all GH gases cause in total 33 degrees of warming. Water vapour is 1% to 4% in the lower troposphere; carbon dioxid eis 0.04%. The IPCC is the official advocate of GH “science” not your linked authors.

      If you looked at the whole Earth+atmosphere from a point in space you would calculate its effective temperature based on a mean of one quarter of the total solar flux it receives, that is, a quarter of 1,365W/m^2. Because you don’t know anything about its emissivity, or its albedo, you assume its emissivity is 1.0000 and its albedo 0.000 for this purpose and you get an effective temperature of 278.53K which is about 9 degrees cooler than the existing mean surface temperature. But that is not to say that a world without an atmosphere, or with an atmosphere but no GH gases, would have a surface temperature of 278.53K because the emissivity of that surface is sure to be less than 1.0000. If it were 0.90 the temperature would be 285.96K and if it were 0.8 the temperature would be 294.51K and if it were 0.7 the temperature would be 304.51K.

      The IPCC would like you to believe that adding water vapour to a dry atmosphere causes the surface to warm by about 30 degrees. So if the emissivity were 0.9 that would be around 315K. But the IPCC wants you to forget that if we add water vapour we also get clouds that reflect about 30% back to space, and we get an atmosphere which also absorbs about 20% of incident solar radiation, leaving just 48% reaching the surface. Let’s say, without carbon dioxide, 50% reaches the surface, so we have about an eighth of that 1365W/m^2 entering a surface which might now have emissivity 0.95 because the oceans would increase the emissivity. So, if we trust our simplistic radiation calculations we now have 170.625W/m^2 producing a mean temperature of – wait for it – 237.24K. Did I mention water vapour cools? Did I mention that you can’t work out surface temperatures using radiation? Oh, you say, there’s all that back radiation now delivering into the surface more thermal energy than the Sun from the colder atmosphere. Sorry, I can’t count that because it does not penetrate the oceans by any more than 10 microns and its electro-magnetic energy is not converted to thermal energy in anything that is warmer than its source.

      • Tim Folkerts says:

        “you assume its emissivity is 1.0000 and its albedo 0.000”
        No, you don’t. Well, maybe you do, but a clever & competent scientist would not.

        If someone indeed “looked at the whole Earth+atmosphere from a point in space”, they would see it reflecting sunlight, and figure out that its albedo was ~ 0.7. So they would calculate the effective temperature as ~ 255 K

        Furthermore, they see the IR spectrum and note that the spectrum is NOT a blackbody curve, so they know that it is not a BB with emissivity = 1.0000 and temperature 255 K. But it is also not like a gray-body with emissivity = 0.7 and temperature of 304.51 K — for one thing the peak power is at the wrong wavelength.

        • JohnKl says:

          Hi Tim Folkerts,

          You responded to Doug by claiming:

          “No, you don’t. Well, maybe you do, but a clever & competent scientist would not.”

          Doug referred to his belief that David A made that assumption. He didn’t make the assumption himself. You went on to state:

          “But it is also not like a gray-body with emissivity = 0.7 and temperature of 304.51 K — for one thing the peak power is at the wrong wavelength.”

          Nice point.

          Have a great day!

        • D o u g  C o t t o n   says:


          Tim and others:

          But an Earth without water vapour would have no clouds, so your clever scientist would work out that there is no albedo and so the surface receives a mean of one quarter of the solar radiation of 1.365W/m^2. And a surface receiving such a flux and having emissivity 0.88 (not unrealistic, but probably on the high side) would have temperature 287.5K which is the same temperature that we estimate it does have with existing GH gases. So GH gases have absolutely no warming effect, and probably cool if that emissivity were less than 0.88 as it would be without water and vegetation.

          Support your claim that “the peak power is at the wrong wavelength.” A surface usually emits with a standard Planck function and the Stefan-Boltzmann calculations are based on the integral of that function because, in general, all frequencies are represented. With a transparent atmosphere and no oceans the Earth’s rocky surface would indeed be a good approximation for a grey body, as is the Moon. That is not the case with radiation from a gas like carbon dioxide, which has less effect per molecule than water vapour, though both reduce the temperature gradient because of their radiating properties, and water vapour very clearly cools (contrary to IPCC claims) as empirical evidence proves with statistical significance.

          • JohnKl says:

            Hi Doug Cotton,

            You stated:

            “Support your claim that “the peak power is at the wrong wavelength.”

            Tim Folkert will have to explain it, I’m not sure what he meant. However, his skepticism over simple comparisons with gray/black body concepts seems reasonable.

            Thanks and have a great day!

          • D o u g  C o t t o n   says:

            There are times when Wikipedia gets it right ….

            “The effective temperature of a body such as a star or planet is the temperature of a black body that would emit the same total amount of electromagnetic radiation.[1] Effective temperature is often used as an estimate of a body’s temperature when the body’s emissivity curve (as a function of wavelength) is not known.

            When the star’s or planet’s net emissivity in the relevant wavelength band is less than unity (less than that of a black body), the actual temperature of the body will be higher than the effective temperature.”

            There’s no mention of albedo, and we have no clue as to such with distant stars. The effective temperature does not vary with variations in albedo (eg due to cloud cover) except perhaps in Climatology Carbonland.

            The 255K figure is meaningless and the surface would be close to (or warmer than) the existing temperature if all GH gases (and thus water also) were removed.

        • D o u g  C o t t o n   says:

          By the way, Wien’s Displacement law (if that’s what you’re thinking of) has a “peak” frequency that is proportional to absolute temperature, not peak power. So what? You have no evidence that the peak frequency in radiation from a dry, rocky planet would not correspond to a temperature of 287.5K whilst the total intensity corresponds to that from a black body receiving a quarter of 1.365W/m^2. The figure of 255K is quite irrelevant for an Earth without water vapour because, as you conveniently forget, there would be no clouds.

          The radiating temperature for Earth without GH gases should be based on 341.25W/m^2 and emissivity 1.0000 which gives a temperature of 278.53K. But the surface temperature with assumed emissivity of 0.88 for that rocky, water-less surface would be 287.58K.

        • D o u g  C o t t o n   says:

          There is no connection between albedo and emissivity Tim. For example, if albedo is 0.3 (mostly because of clouds, not the surface itself) this has no connection with surface emissivity which could be 0.9 for example.

  58. Aaron S says:

    PETM is a perfect example. You cite zachos how about this 07 nature paper that shows warming predated co2 influx by 3000 yrs. The co2 was likely from releasing methane from the release of gas hydrates on ocean floor whereas the warming was from something else. Causation and correlation are not the same… Im starting to think there are some slow learners and biased thinkers on the other side of this debate.

    Christian… in a meeting in Malaysia will get back to you later.

    http://adsabs.harvard.edu/abs/2007Natur.450.1218S

  59. David and Christian , will not accept the reality of the data past and present which shows the climate for the past 100 years has been stable in comparison to earlier periods, that there is no correlation between co2 and the temperature and that co2 follows the temperature.

    All of there arguments are empty and hollow.

  60. Nov 04, 2014
    Embarrassing Predictions Haunt the Global-Warming Industry

    It is often said that non-scientists must rely on “expert opinion” to determine whether claims on alleged “catastrophic man-made global warming” are true. Putting aside the fact that there is no global-warming “consensus” among experts, one does not have to be a scientist, or even proficient in science, to be able to review past predictions, and then form an informed opinion regarding the accuracy of those predictions.

    Suppose, for example, you regularly watch a local TV weatherman forecast the weather for your area. Would you need a degree in meteorology in order to decide for yourself how reliable, or unreliable, the weatherman’s forecasts are?

    Warnings have been issued for many decades now regarding catastrophic climate change that forecasted certain trends or occurrences that we should already have witnessed. Yet such predictions have turned out to be very, very wrong. This was certainly the case with the alarmist predictions of the 1960s and ‘70s that man’s activities on Earth were causing a catastrophic cooling trend that would bring on another ice age. And it is also the case with the more recent claims about catastrophic global warming.

    What follows is a very brief review of these predictions compared to what actually happened.

    Global Cooling?

    Americans who lived through the 1960s and ‘70s may remember the dire global-cooling predictions that were hyped and given great credibility by Newsweek, Time, Life, National Geographic, and numerous other mainstream media outlets. According to the man-made global-cooling theories of the time, billions of people should be dead by now owing to cooling-linked crop failures and starvation.

    “If present trends continue, the world will be about four degrees colder for the global mean temperature in 1990, but 11 degrees colder by the year 2000,” claimed ecology professor Kenneth E.F. Watt at the University of California in 1970. “This is about twice what it would take to put us in an ice age.” Of course, 2000 came and went, and the world did not get 11 degrees colder. No ice age arrived, either.

    In 1971, another global-cooling alarmist, Stanford University professor Paul Ehrlich, who is perhaps best known for his 1968 book The Population Bomb, made similarly wild forecasts for the end of the millennium in a speech at the British Institute for Biology. “By the year 2000 the United Kingdom will be simply a small group of impoverished islands, inhabited by some 70 million hungry people,” he claimed. “If I were a gambler, I would take even money that England will not exist in the year 2000 and give ten to one that the life of the average Briton would be of distinctly lower quality than it is today.” Of course, England still exists, and its population was doing much better in 2000 than when Ehrlich made his kooky claims. But long before 2000, Ehrlich had abandoned global-cooling alarmism in favor of warning that the Earth faced catastrophic global warming. Now he is warning that humans may soon be forced to resort to cannibalism.

    To combat the alleged man-made cooling, “experts” suggested all sorts of grandiose schemes, including some that in retrospect appear almost too comical to be real. “Climatologists are pessimistic that political leaders will take any positive action to compensate for the climate change, or even to allay its effects,” reported Newsweek in its 1975 article “The Cooling World,” which claimed that Earth’s temperature had been plunging for decades due to humanity’s activities. Some of the “more spectacular solutions” proposed by the cooling theorists at the time included “melting the arctic ice cap by covering it with black soot or diverting arctic rivers,” Newsweek reported.

    Of course, the big alleged threat hyped in recent decades has been global warming, not global cooling. But the accuracy of the climate-change predictions since the cooling fears melted away has hardly improved.

    United Nations “Climate Refugees”

    In 2005, the United Nations Environment Programme (UNEP) warned that imminent sea-level rises, increased hurricanes, and desertification caused by “man-made global warming” would lead to massive population disruptions. In a handy map, the organization highlighted areas that were supposed to be particularly vulnerable in terms of producing “climate refugees.” Especially at risk were regions such as the Caribbean and low-lying Pacific islands, along with coastal areas.

    The 2005 UNEP predictions claimed that, by 2010, some 50 million “climate refugees” would be frantically fleeing from those regions of the globe. However, not only did the areas in question fail to produce a single �climate refugee,” by 2010, population levels for those regions were actually still soaring. In many cases, the areas that were supposed to be producing waves of “climate refugees” and becoming uninhabitable turned out to be some of the fastest-growing places on Earth.

    In the Bahamas, for example, according to the 2010 census, there was a major increase in population, going from around 300,000 in 2000 to more than 350,000 by 2010. The population of St. Lucia, meanwhile, grew by five percent during the same period. The Seychelles grew by about 10 percent. The Solomon Islands also witnessed a major population boom during that time frame, gaining another 100,000 people, or an increase of about 25 percent.

    In China, meanwhile, the top six fastest growing cities were all within the areas highlighted by the UN as likely sources of “climate refugees.” Many of the fastest-growing U.S. cities were also within or close to �climate refugee� danger zones touted by the UN

    Rather than apologizing for its undisputable mistake after being first exposed by reporter Gavin Atkins at Asian Correspondent, the global body responded in typical alarmist fashion: with an Orwellian coverup seeking to erase all evidence of its ridiculous predictions. First, the UNEP took its “climate refugees” map down from the Web. That failed, of course, because the content was archived online prior to its disappearance down the UN memory hole.

    Then the UNEP tried and failed to distance itself from the outlandish claims, despite the fact that the map was created by a UNEP cartographer, released by UNEP, and repeatedly hyped by the outfit in its scaremongering campaigns. Eventually, as more and more media around the world began picking up the story, a spokesperson for the UN agency claimed the map was removed because it was “causing confusion.”

    It was hardly the first time UN bureaucrats had made such dire predictions, only to be proven wrong. On June 30, 1989, the Associated Press ran an article headlined: “UN Official Predicts Disaster, Says Greenhouse Effect Could Wipe Some Nations Off Map.” In the piece, the director of the UNEP’s New York office was quoted as claiming that “entire nations could be wiped off the face of the earth by rising sea levels if global warming is not reversed by the year 2000.” He also predicted “coastal flooding and crop failures” that “would create an exodus of ‘eco-refugees,’ threatening political chaos.”

    Other UN predictions were so ridiculous that they were retracted before they could even be proven wrong. Consider, as just one example, the scandal that came to be known as “Glaciergate.” In its final 2007 report, widely considered the “gospel” of “settled” climate “science,” the UN IPCC suggested that Himalayan glaciers could melt by 2035 or sooner. It turns out the wild assertion was lifted from World Wildlife Fund propaganda literature. The IPCC recanted the claim after initially defending it.

    Pentagon Climate Forecasts

    Like the UN, the Pentagon commissioned a report on “climate change” that also offered some highly alarming visions of the future under “global warming.” The 2003 document, entitled “An Abrupt Climate Change Scenario and Its Implications for United States National Security,” was widely cited by global-warming theorists, bureaucrats, and the establishment press as evidence that humanity was facing certain doom. It also served as the foundation for the claim that alleged man-made “climate change” was actually a “national security concern.” However, fortunately for the taxpayers forced to pay for the study, the Pentagon report turned out to be just as ridiculous as the UN “climate refugees” forecasts.

    By now, according to the “not implausible” scaremongering outlined in the report for a 10-year time period, the world should be a post-apocalyptic disaster zone. Among other outlandish scenarios envisioned in the report over the preceding decade: California flooded with inland seas, parts of the Netherlands “unlivable,” polar ice all but gone in the summers, and surging temperatures. Mass increases in hurricanes, tornadoes, and other natural disasters were supposed to be wreaking havoc across the globe, too. All of that would supposedly spark resource wars and all sorts of other horrors. But none of it actually happened.

    The Pentagon report even claimed there was “general agreement in the scientific community” that the extreme scenarios it envisioned could come to pass, and reporters treated it as if it were a prophecy delivered to climate sinners by God Himself. However, when interviewed by the Washington Times for a June 1, 2014 article, consultant and report co-author Doug Randall expressed surprise at how often the now-debunked forecasts were parroted. Yet he still defended the hysterical fear peddling. “When you are looking at worst-case 10 years out, you are not trying to predict precisely what’s going to happen but instead trying to get people to understand what could happen to motivate strategic decision-making and wake people up,” Randall said. “But whether the actual specifics came true, of course not. That never was the main intent.”

    The first article about the climate report appeared in early 2004, when the report was leaked to the U.K. Observer, under the sensationalistic title: “Pentagon tells Bush: climate change will destroy us.” In a bullet-point summary at the top of the Observer article, journalists Mark Townsend and Paul Harris added: “Secret report warns of rioting and nuclear war” and “Britain will be ‘Siberian’ in less than 20 years.” The rest of the article was just as outlandish, going even beyond what the now-discredited Pentagon report claimed. Other reporters took their cue from the Observer article, which in retrospect would have been a hilarious piece of writing if it had not been taken so seriously at the time.

    No More Snow?

    For well over a decade now, climate alarmists have been claiming that snow would soon become a thing of the past. In March 2000, for example, “senior research scientist” David Viner, working at the time for the Climatic Research Unit (CRU) at the University of East Anglia, told the U.K. Independent that within “a few years,” snowfall would become “a very rare and exciting event” in Britain. “Children just aren’t going to know what snow is,” he was quoted as claiming in the article, headlined “Snowfalls are now just a thing of the past.”

    The very next year, snowfall across the United Kingdom increased by more than 50 percent. In 2008, perfectly timed for a “global warming” legislation debate in Parliament, London saw its first October snow since 1934 or possibly even 1922, according to the U.K. Register. “It is unusual to have snow this early,” a spokesperson for the alarmist U.K. Met office admitted to The Guardian newspaper. By December of 2009, London saw its heaviest levels of snowfall in two decades. In 2010, the coldest U.K. winter since records began a century ago blanketed the islands with snow.

    In early 2004, the CRU’s Viner and other self-styled “experts” warned that skiing in Scotland would soon become just a memory, thanks to alleged global warming. “Unfortunately, it’s just getting too hot for the Scottish ski industry,” Viner told The Guardian. Another “expert,” Adam Watson with the Centre for Ecology and Hydrology, told the paper that the skiing industry in Scotland had less than two decades left to go. Yet in 2013, too much snow kept many Scottish resorts closed. “Nevis Range, The Lecht, Cairngorm, Glenshee and Glencoe all remain closed today due to the heavy snow,” reported OnTheSnow.com on January 4, 2013. Ironically, by 2014, the BBC, citing experts, reported that the Scottish hills had more snow than at any point in seven decades. It also reported that the Nevis Range ski resort could not operate some of its lifts because they were “still buried under unprecedented amounts of snow.”

    The IPCC has also been relentlessly hyping the snowless winter scare, along with gullible or agenda-driven politicians. In its 2001 Third Assessment Report, for example, the IPCC claimed “milder winter temperatures will decrease heavy snowstorms.” Again, though, the climate refused to cooperate. The year 2013, the last year for which complete data is available, featured the fourth-highest levels on record, according to data from Rutgers University’s Global Snow Lab. Spring snow cover was the highest in a decade, while data for the fall indicate that it was the fifth highest ever recorded. Last December, meanwhile, brought with it a new high record in Northern Hemisphere snow cover, Global Snow Lab data show.

    Blame Global Warming?

    After the outlandish predictions of snowless winters failed to materialize, the CRU dramatically changed its tune on snowfall. All across Britain, in fact, global-warming alarmists rushed to blame the record cold and heavy snow experienced in recent years on – you guessed it! – global warming. Less snow: global warming. More snow: global warming. Get it? Good.

    The same phenomenon took place in the United States just last winter. As record cold and snowfall was pummeling much of North America, warming theorists contradicted all of their previous forecasts and claimed that global warming was somehow to blame. Among them: White House Science “Czar” John Holdren. “A growing body of evidence suggests that the kind of extreme cold being experienced by much of the United States as we speak is a pattern we can expect to see with increasing frequency, as global warming continues,” he claimed.

    That assertion, of course, is exactly the opposite of what the UN “settled science” IPCC predicted in its 2001 global-warming report, which claimed that the planet would see “warmer winters and fewer cold spells, because of climate change.” Ironically, perhaps, Holdren warned decades ago that human CO2 emissions would lead to a billion deaths due to global warming-fueled global cooling – yes, cooling, which he said would lead to a new ice age by 2020.

    Ridiculous forecasts have been made by other “climate scientists” who, like Holdren, continue to reap huge amounts of U.S. taxpayer dollars in salaries, grants, and benefits despite being consistently wrong. James Hansen, for instance, who headed NASA’s Goddard Institute for three decades before taking a post at Columbia University, is one of the best known “climatologists” in the world – despite his long and embarrassing record of bad forecasting spanning decades.

    In 1988, Hansen was asked by journalist and author Rob Reiss how the “greenhouse effect’ would affect the neighborhood outside his window within 20 years (by 2008). “The West Side Highway [which runs along the Hudson River] will be under water,” Hansen claimed. “And there will be tape across the windows across the street because of high winds. And the same birds won’t be there. The trees in the median strip will change…There will be more police cars …. [since] you know what happens to crime when the heat goes up.” In 1986, Hansen also predicted in congressional testimony that the Earth would be some two degrees warmer within 20 years. In recent years, after the anticipated warming failed to materialize, alarmists have cooled on predicting such a dramatic jump in temperature over such a short period of time.

    Separately, another prominent alarmist, Princeton professor and lead UN IPCC author Michael Oppenheimer, made some dramatic predictions in 1990 while working as “chief scientist” for the Environmental Defense Fund. By 1995, he said then, the “greenhouse effect” would be “desolating the heartlands of North America and Eurasia with horrific drought, causing crop failures and food riots.” By 1996, he added, the Platte River of Nebraska “would be dry, while a continent-wide black blizzard of prairie topsoil will stop traffic on interstates, strip paint from houses and shut down computers.” The situation would get so bad that “Mexican police will round up illegal American migrants surging into Mexico seeking work as field hands.”

    When confronted on his failed predictions, Oppenheimer, who also served as former Vice President Al Gore’s advisor, refused to apologize. “On the whole I would stand by these predictions – not predictions, sorry, scenarios – as having at least in a general way actually come true,” he claimed. “There’s been extensive drought, devastating drought, in significant parts of the world. The fraction of the world that’s in drought has increased over that period.” Unfortunately for Oppenheimer, even his fellow alarmists debunked that claim in a 2012 study for Nature, pointing out that there has been “little change in global drought over the past 60 years.”

    Arctic Ice

    Perhaps nowhere have the alarmists’ predictions been proven as wrong as at the Earth’s poles. In 2007, 2008, and 2009, Al Gore, the high priest for a movement described by critics as the “climate cult,’ publicly warned that the North Pole would be “ice-free” in the summer by around 2013 because of alleged “man-made global warming.”

    Speaking to an audience in Germany five years ago, Gore – sometimes ridiculed as “The Goracle” – alleged that “the entire North Polarized [sic] cap will disappear in five years.” “Five years,” Gore said again, in case anybody missed it the first time, is “the period of time during which it is now expected to disappear.”

    The following year, Gore made similar claims at a UN “climate” summit in Copenhagen. “Some of the models… suggest that there is a 75 percent chance that the entire north polar ice cap, during some of the summer months, could be completely ice-free within the next five to seven years,” Gore claimed in 2009. “We will find out.”

    Yes, we have found out. Contrary to the predictions by Gore and fellow alarmists, satellite data showed that Arctic ice volume as of summer of 2013 had actually expanded more than 50 percent over 2012 levels. In fact, during October 2013, sea-ice levels grew at the fastest pace since records began in 1979. Many experts now predict the ongoing expansion of Arctic ice to continue in the years to come, leaving global-warming alarmists scrambling for explanations to save face – and to revive the rapidly melting climate hysteria.

    Gore, though, was hardly alone in making the ridiculous and now thoroughly discredited predictions about Arctic ice. Citing climate experts, the British government-funded BBC, for example, also hyped the mass hysteria, running a now-embarrassing article on December 12, 2007, under the headline: “Arctic summers ice-free by 2013″.” In that piece, which was still online as of July 2014, the BBC highlighted alleged “modeling studies” that supposedly “indicate northern polar waters could be ice-free in summers within just 5-6 years.” Incredibly, some of the supposed “experts” even claimed it could happen before then, citing calculations performed by “super computers” that the BBC noted have “become a standard part of climate science in recent years.”

    “Our projection of 2013 for the removal of ice in summer is not accounting for the last two minima, in 2005 and 2007,” claimed Professor Wieslaw Maslowski, described as a researcher from the Naval Postgraduate School who was working with co-workers at NASA to come up with the now-thoroughly discredited forecasts about polar ice. “So given that fact, you can argue that may be [sic] our projection of 2013 is already too conservative.” (Emphasis added.) Other “experts” quoted in the BBC article agreed with the hysteria.

    In the real world, however, the scientific evidence demolishing the global-warming theories advanced by Gore, the UN, and government-funded “climate scientists” continues to grow, along with the ice cover in both hemispheres. In the Arctic, for example, data collected by Europe’s Cryosat spacecraft pointed to about 9,000 cubic kilometers of ice volume at the end of the 2013 melt season. In 2012, which was admittedly a low year, the total volume was about 6,000 cubic kilometers.

    Indeed, in 2007, when Gore and others started making their predictions about imminent “ice-free” Arctic summers, the average sea-ice area extent after the summer melt for the month of September was 4.28 million square kilometers. By 2013, even on September 13, the minimum ice-cover day for the whole year, ice levels were way above the 2007 average for the month – by an area almost the size of California. The lowest level recorded on a single day during 2013 was 5.1 million square kilometers. By late July 2014, Arctic sea-ice extent was almost at its highest level in a decade, and scientists expect even less melting this summer than last year.

    Despite parroting the wild claims five years ago, the establishment press has, unsurprisingly, refused to report that Gore and his fellow alarmists were proven embarrassingly wrong. No apologies from Gore have been forthcoming, either, and none of the “scientists” who made the ridiculous predictions quoted by the BBC has apologized or lost his taxpayer-funded job. In fact, almost unbelievably, the establishment press is now parroting new claims from the same discredited “experts” suggesting that the Arctic will be “ice-free” by 2016.

    Antarctic Ice

    Even more embarrassing for the warmists have been trends in the Southern Hemisphere. Of course, all of the “climate models” and “climate experts” and “scientists” predicted that rising CO2 emissions would increase global temperatures, which would melt the ice in Antarctica – by far the largest mass of frozen H2O on the planet. Indeed, the forecasts were crucial to many of the other predictions about surging sea levels and related gloom and doom.

    The problem for global-warming theorists is that the opposite happened. Indeed, sea ice in Antarctica is off the charts, consistently smashing previous record highs on a near-daily basis. Sea-ice area in the south is now at the highest point since records began by a lot and the warmists are searching frantically for an explanation. Some are, incredibly, considering their past forecasts, trying to blame global warming. But the fact remains: Their predictions for Antarctica were as wrong as they possibly could be. Instead of melting as forecasted, ice levels are surging to new and unprecedented heights. As of early July, an area of the southern oceans the size of Greenland is frozen that, based on the average, should currently be open waters. If both poles are considered together, there is about one million square kilometers of frozen area above and beyond the long-term average.

    Even UN warmists have been forced to concede that they do not know what is going on or why their “climate models” that predicted melting have been proven so wildly off the mark. “There is low confidence in the scientific understanding of the observed increase in Antarctic sea ice extent since 1979, due to…incomplete and competing scientific explanations for the causes of change,” the IPCC admitted in its latest report. For now, the warmists have simply been trying their best to keep the public from noticing or examining the phenomenal growth in Antarctic ice.

    As The New American reported earlier this year, the desperation and denial among warmists was illustrated perfectly in December. A ship full of global-warming alarmists led by a “climate scientist” went on a mission to study how “global warming” was melting Antarctic ice. Instead of completing their mission, they ended up getting their vessel trapped in record-setting levels of sea ice.

    Obama Claims

    In his second-term inaugural address, Obama also made some climate claims, saying: “Some may still deny the overwhelming judgment of science, but none can avoid the devastating impact of raging fires and crippling drought and powerful storms.” Ironically, all three of the examples he provided of what he called the “threat of climate change” actually discredit his argument.

    As Forbes magazine pointed out last year, the number of wildfires has plummeted 15 percent since 1950, and according the National Academy of Sciences, that trend is likely to continue for decades. On “droughts,” a 2012 study published in the alarmist journal Nature noted that there has been “little change in global drought over the past 60 years.” The UN’s own climate alarmists were even forced to conclude last year that in many regions of the world, “droughts have become less frequent, less intense, or shorter.”

    Regarding hurricanes and tornadoes, it probably would have been hard for Obama to choose a worse example to illustrate the alleged threat of man-made warming. Contrary to predictions by global warmists, hurricanes and tornadoes have been hitting in record-setting low numbers. “When the 2014 hurricane season starts it will have been 3,142 days since the last Category 3+ storm made landfall in the U.S., shattering the record for the longest stretch between U.S. intense hurricanes since 1900,” noted professor of environmental studies Roger Pielke, Jr. at the University of Colorado, who last year left alarmists who had predicted more extreme weather linked to alleged global warming silent after pointing out the facts in a Senate hearing. “The five-year period ending 2013 has seen two hurricane landfalls. That is a record low since 1900.” After adjusting the data for trends such as population growth and better reporting, it appears that 2013 also featured the lowest number of tornadoes in the long-term record.

    In June 2008, Obama declared: “I am absolutely certain that generations from now, we will be able to look back and tell our children… this was the moment when the rise of the oceans began to slow and our planet began to heal.” He was referring, of course, to his own election, as if he were some sort of savior here to save humanity from its carbon-climate sins. In the real world, though, despite his grandiose and bombastic view of himself as global climate messiah, Obama has no more power to stop the “climate” from changing than his legions of discredited “experts” have demonstrated to successfully predict it.

    Also ironically, perhaps, is that there had been no global warming since long before he took office. Worldwide, the disastrous forecasts by climate alarmists have proven to be similarly embarrassing. By now, anybody who follows “climate” news knows that “global warming” has been on what alarmists call “pause” for 18 years and counting, despite ongoing increases in CO2 concentrations in the atmosphere. The stubborn refusal of temperatures to rise (and accelerate) as forecasted by all of the UN’s 73 “climate models” has discredited the models, the UN, and the alleged “science” behind the computer forecasts. Every single model predicted more warming than has occurred, an atrocious record that defies explanation. Even a monkey rolling the dice or a scam artist pretending to read the future from a crystal ball would have a better record, based only on the laws of probability.

    Of course, alarmists have come up with at least a dozen excuses for the failure of temperatures to rise in accordance with their debunked models. The Obama administration’s favorite: the theory of “The Ocean Ate My Global Warming.” Last year, the Associated Press, citing leaked documents, reported that the U.S. government had pressured the UN IPCC to incorporate that excuse, for which there is not a scintilla of observable evidence, into its most recent global-warming report.

    A Prediction

    The website Watts Up With That (WUWT), run by meteorologist and climate researcher Anthony Watts, highlighted the embarrassing record in late 2013 following a particularly devastating year for “climate” predictions. “It seems like every major CAGW [Catastrophic Anthropogenic Global Warming] prediction has failed in 2013,” the article explains, citing a vast trove of scientific data debunking alarmist forecasts. “Regardless of efforts to nebulize CAGW to explain all forms of climatic and weather variation, in 2013 every loosely falsifiable prediction of the CAGW narrative seems to have failed. The apparent complete failure of the CAGW narrative in 2013 could make the most fundamentalist agnostic wonder if Mother Nature sometimes takes sides, aka the Gore Effect.” Perhaps the Almighty has a sense of humor.

    Few people would make an important decision based on next week’s weather forecast. When it comes to “climate,” though, the $360 billion-per-year climate establishment is telling humanity that civilization must be reorganized from top to bottom based on failed models purporting to make predictions decades and even centuries in advance. Flawed predictions aside, a great deal of evidence suggests accuracy or truth was never the intent – generating fear to seize more money and power was (and is). Many top alarmists have admitted as much, with some responding to the implosion of their theories with calls for censorship or, more extreme still, the imprisonment, re-education, and even execution of “climate deniers.”

    The Earth’s climate has always changed, and very likely will continue to change, regardless of what humans do. What is now clear, though, is that the establishment has no idea what those changes will be – much less what drives the changes or how to control them.

    Nov 01, 2014
    An adventure by a real hero with two dying networks

    • jimc says:

      Love it. Only one very tiny point though. Embarrassment requires shame. And the political left at the core of this stuff has no shame.

    • Fonzarelli says:

      Another very tiny point, this is NOT a “very brief review”!!! (i felt like i was reading a Michener novel here) Well done, Salvatore, very well done…

  61. stevek says:

    The agw crowd us either wrong or extremely unlucky.

  62. numberer says:

    ‘Remote Sensing Systems’ has issued its global temperature anomaly number for October 2014. Here it is, prefaced by the anomalies for Octobers of the last 10 years:

    October 2005 + 0.38

    2006 + 0.31

    2007 + 0.20

    2008 + 0.17

    2009 + 0.29

    2010 + 0.29

    2011 + 0.08

    2012 + 0.29

    2013 + 0.21

    OCTOBER 2014 + 0.27 C

    • Entropic man says:

      Numberer

      UAH shows October 2014 as equal warmest in the satellite record, with 2012.

      Is UAH overreading or RSS under reading?

      The seemed to agree for a while; are they diverging again?

      • numberer says:

        “…record high…”

        It equaled the 2012 October number and was 0.01 higher than the October 2005 number. It was lower than the all-time high for any month in this series, which was +0.66 in April 1998.

        In the RSS series of October numbers which I reproduced above, it was not a record number. It was 0.02 below October 2012.

        • numberer says:

          Therefore, over the last two years (Oct 2014 compared to Oct 2012) there is a difference of one fiftieth of a degree C between UAH and RSS. If you want to call that “diverging again”…

          • nigel says:

            “October”, “April”. Why is anybody interested in the figures around the time of the EQUINOXES? The earth is in a middling state then as regards temperatures. A few tenths of a degree more or less means little in practical terms during Spring and Autumn.

            The temperature of the whole earth as measured from space naturally rises about 2.3 C every Northern summer, because of the concentration of land in the Northern hemisphere. Again, a few tenths of a degree more or less on that 2.3 would not seem likely to upset the stability of “Gaia”.

  63. http://www.solen.info/solar/images/comparison_similar_cycles.png

    Solar cycle 24 still on rise (but still weak)unlike any other previous solar cycles.

    Which is why my climate prediction is in a wait and see mode. Solar has not fallen off as of yet.

    • numberer says:

      Financial markets often seem impervious to growing dangers while solar up-phases are in last-gasp mode. Or so my pet monkey (a.k.a. investment adviser) says.

  64. http://www.solen.info/solar/images/comparison_similar_cycles.png

    With more recent solar cycles . Look at how different this one is to al the other solar cycles past and present.

  65. D o u g  C o t t o n   says:


    Roy and silent readers:

    All alarmist comments are based on IPCC documentation, and that documentation says the Earth’s surface would be 33 degrees colder without greenhouse gases. Water vapour is thus meant to be doing most of that warming from about 254.5K to about 287.5K to the nearest half degree.

    But in calculating the 254.5K temperature they fail to alter the albedo which, according to their energy diagrams includes 30% of solar radiation reflected back to space by those clouds which would only exist if the greenhouse pollutant, water vapour actually existed. But they have assumed it doesn’t in this scenario. So they incorrectly use only 70% of a quarter of the solar flux (1365W/m^2) and then they also assume incorrectly that emissivity is 1.0000, and so then then incorrectly get that temperature of 254.5K in Stefan-Boltzmann calculations.

    The ramifications of this enormous oversight are huge, because if they had not reduced the radiation by 30% due to the clouds that don’t exist. and if they had used a more realistic emissivity for a dry, rocky planet – say 0.88, then they would have got a temperature of 287.58K which is close enough to what is the existing mean temperature with GH gases that are thus doing no warming at all.

    • numberer says:

      “…enormous oversight…”

      That is absolutely right. I think it was “torontoann” pointed out this exact same thing, a couple of years ago on this blog, but the point seemingly went completely unappreciated then – as yours is likely to be now.

      It is possible that it was just sloppy thinking by IPPC; but it is also possible that it was deliberate craftiness. The statement that “natural GHG causes + 33 C” insidiously implants in peoples’ minds the idea that GHG are very “powerful” and obscured the possibility of stabilising feed-backs.

    • Jerry L Krause says:

      Hi Doug:

      Very glad to see that someone else recognizes that some of which you write is right on. While some details might not be precisely accurate, everything you wrote is generally true. I will be composing a longer reply to your comment but hopefully others, silent or not, will recognize that the simple facts you referred to are correct and write their support for what you wrote.

      Have a good day,

      Jerry

      • JohnKl says:

        Hi Jerry L Krause,

        Doug makes an excellent point. In the past I’ve pointed out that the albedo levels chosen by the CAGW alarmists to arrive at their bogus 33 degree colder without GHG’s conclusion seems completely arbitrary and a small adjustment in the ASSUMED albedo makes the entire paranoid CAGW phantasm completely unworkable. Doug did a great job of illustrating this and other facts and pointing it out.

        Have a great day!

        • Jerry L Krause says:

          Hi JohnKl,

          I was trying to encourage readers to postively respond to Doug as Numberer had done, so you should have addressed your comments to him. Doug has obviously worked hard in his scholarship and is actually trying to better understand our atmospheric system. And regardless of how complete and accurate Salvatore Del Prete review of the CAGW crowds’ phantasm (had to look up its meaning in a dictionary) was, the fact is it did little to nothing to move our understanding of weather and climate forward.

          I have reviewed my participation on this blogsite since 8/13/14 at 2:29PM and I was reminded that Doug had asked me to read his book, which I have not done. But I have encouraged him, you, and others to look at actual observations and maybe, by quoting what others have written, tried to encourag you to read more of what these authors have written. And it seems evident that no one has done what I have suggested. So rather than repeat what I have already said, I am going to purchase Doug’s book and read it. For I have no ideal of what I might find. And I want to establish a more ‘friendly’ dialogue with Doug because I do recognize the importance of what he writes from time to time.

          Have a good day,

          Jerry

          • JohnKl says:

            Hi Jerry L Krause,

            Doug should be pleased if you read his book. Some time ago I read a portion of a paper Doug linked to on one of his posts. Frankly, I don’t consider myself virgin to Doug’s concepts. However, if there’s a specific work of his you consider perusing let me know which one. A dialogue concerning the claims therein could be useful. In addition, while you did write at length about Feynman and other scientists I don’t recall pledging to read any of his works in the near future. Currently I plan to pursue other lines of investigation, I may pursue him in the not to distant future. Moreover, if you seriously plan to read up on scientists of his ilk you may consider reading John Von Neumann a polymath and scientist difficult to parallel in the last century and yes that includes Feynman. In all, thanks for your continued presence and contributions to the blog and as usual…

            Have a great day!

          •  D o u g   says:

            Many thanks for your encouragement, numberer, Jerry and John – much appreciated.

          •  D o u g   says:

            It’s all in my book which also cites my March 2012 paper “Radiated Energy and the Second Law of Thermodynamics” – the book giving a brief outline of that paper and much more.

          • Jerry L Krause says:

            Hi JohnKl,

            Just a quick note. I only wrote that I encouraged others to look at what Feynman, Sutcliffe, etc, but I never asked anyone to make a pledge to so. That is to my memory. I will reply a bit later about the fundamentals that Doug has mentioned.

            Have a good day,

            Jerry

          •  D o u g   says:

            It would be better if Roy and everyone here spent an hour reading my book first. I’m happy to post a free copy to you, Roy, if you email me a postal address.

          • Jerry L Krause says:

            Hi JohnKl, Doug, numberer, silent readers, not so silent readers:

            We are responding to Doug’s response in which he identified the albedo, the emissivity of the earth’s surface, and the clouds as factors in any energy balance calculation. And he drew attention to the critical importance of the 33K temperature difference of the simple, but bogus, energy balance calculation (first done by Arrhenius near the end of the 19th Century) to the AGW crowd.

            I have only been a not so silent reader since Aug 13, so I do not know what Spencer might have written about this 33K temperature difference before. But it seems evident that he strongly supports the fundamental hypothesis of the greenhouse effect in some way. I have read that Verner Suomi stated that the observation of downward longwave IR radiation from a cloudless atmosphere was proof of the greenhouse effects existence. No one can doubt the existence of this radiation, but the unanswered question is what is the consequence of this downward radiation.

            I do not know if you know who Verner Suomi was and/or did (he put meteorology into space). But he was a big big deal at the University of Wisconsin where Spencer earned his doctorate. I learned about Suomi because in a published interview he admitted he was troubled about the fact that the earth’s albedo was observed from space to be about 0.30 whereas before it was about 0.36 on the basis careful observations of the ’reflection’ of solar radiation from various surfaces.

            Because he was a doubter, I contacted him and he agreed to give me some of his busy time if I wanted to travel down to Madison. My most pressing question at the time was “what was the emissivity of a water surface?” For it seem most radiation balance calculations were assuming the liquid water surface had an emissivity of one. When we met he first assured me that it most have been observed instead of assumed, but he immediately went to his reference books and could not find that which he thought he would. So, he gave me whatever it was needed for me to use UW’s library resources to see if I could find any reference to its observation. Which I did not. I did learn about various methods used to observe the emissivities of non-volatile solids such as those to which Doug referred. Which clearly would not work for a volatile liquid. So I forgot about the issue of emissivity of the oceans and seas and lakes because one can only argue what it might be. Doug, (this is not to be critical of your scholarship) but you likely did not consider earth’s liquid water surfaces because no emissivity for their surface still has not been made.

            But a fact is that a little less than 70 per cent of the earth’s surface is liquid water and we should never overlook this. So relative to the issue of the earth’s albedo, this surface seems to be an important factor in any energy balance calculation. I have on my wall a cloudless image of the earth’s surface produced by Tom Van Sant’s Biosphere Project. I assume most are familiar with it and therefore know the ocean surfaces from space appear to be dark, navy-blue. And I am sure most are familiar with what is seen when one observes a water surface which is between you and the sun. What I see is not a dark, navy-blue color. I leave this as a puzzle to think about.

            Another important (my conclusion) fundamental issue that Doug has drawn attention to is the action of gravity on individual atmospheric molecules’ movement between their collisions with each other or with surfaces. So, I ask: How do you imagine their motions are altered by the earth’s gravity in this case?

            It seems there is another fundamental issue to which Doug has drawn attention, but I cannot remember what it is.

            Have a good day,

            Jerry

          • Jerry L Krause says:

            Hi JohnKl, Doug, numberer, silent readers, not so silent readers:

            Here are two more fundamentals to which Doug has referred. They are the exchange of energy between atmospheric molecules during their collisions with each other and his reference to what he considers a fact that the downward longwave IR radiation emitted by atmospheric water molecules does not significantly penetrate the surfaces of oceans, seas, lakes, etc. And I must admit that I had totally forgotten this second likely fundamental fact. Think about it and don’t dismiss it simply because Doug stated it.

            Have a good day,

            Jerry

          • Arfur Bryant says:

            Jerry, Doug et al,

            In my opinion, the ‘fundamental’ concept which should be emphasised in this discussion, and which Doug has written about before, is the inability of so-called ‘backradiation’ to contribute any thermal energy gain to the surface of the planet (except in those rare occurrences when the surface is cooler than the atmosphere).

            Any radiation emitted by the ‘cooler’ CO2 molecules toward the surface will not be absorbed for energy gain. Hence the classic IPCC theory is fundamentally flawed (as Doug keeps saying), and even the contemporary luke-warmist thinking that backradiation ‘slows down the rate of cooling’ is equally flawed. The radiation from the cooler atmosphere simply does not have the ability to bridge the molecular ‘energy gap’ required to elevate the surface temperature. Of course, the shorter wavelength radiation from the Sun has this ability, hence its radiation IS absorbed for energy gain.

            If the surface is warmer than the atmosphere, any radiation emitted by CO2 is irrelevant to the surface temperature. There is no ‘absorbed by the surface’ at the bottom of the K&T big arrow downwards.

            It doesn’t matter how many cooler objects you place next to a warmer object, the warmer object does not get even warmer. Until the supporters of the CO2=cAGW belief realise this, no progress will be made in this debate.

            Just my penny’s worth. It is a shame that

          • Arfur Bryant says:

            ,,, such fundamental physics cannot be debated without deflection toward the more personal arguments.

  66. Dave says:

    Roy,

    It’s been reported elsewhere that last month was a record high according to your data set. I did not see any mention of this in your release. Can you confirm or deny? Thanks.

  67. numberer says:

    More evidence of the association between prolonged minima in sunspot cycles and decreased cosmic-ray shielding of the earth.

  68. Mark BLR says:

    For the stratosphere (V5.6) numbers, why does the latest (OCTOBER 6th) file end with September 2013 (14 months ago instead of 2) ?
    URL : http://www.nsstc.uah.edu/data/msu/t4/tlsglhmam_5.6.txt

    NB : The V5.4 file goes to September 2014, can you get UAH to check why the V5.6 file was truncated before posting the figures including the month of October (2014 !) ?

    • numberer says:

      Those figures are hard to read on the screen. The files that are there now seem to go up to September 2014.

      • Mark BLR says:

        When I click on my link above the file ends with :

        2013 8 -0.235 -0.172 -0.299 0.013 …
        2013 9 -0.341 -0.466 -0.217 -0.359 …
        2013 10 -0.335 -0.649 -0.021 -0.489 …

        DECADAL TREND= -0.351 -0.356 -0.345 -0.315

        It now goes up to October twenty-thirteen instead of September twenty-thirteen.

        The T4-V5.6 file appears to be the only one affected.
        T4-V5.4, T2LT-V5.5 and T2LT-V5.6 files all now go up to October twenty-fourteen (as expected).

  69. TimeFliesWhenYou'reHavingRum says:

    Test one, two…

  70.  D o u g   says:

    There are several serious errors in the “physics” of the radiative greenhouse conjecture. As discussed in a comment above, there is not necessarily any significant difference between what the surface temperature would be without all greenhouse gases and what it is today. The issue comes down to whether the emissivity of a rocky dry planet would be greater or less than 0.88 and, given that many rocks, as well as soil, have a lower emissivity than that, then we can deduce that it would have been warmer without GH gases. That really should not surprise you, because you know that water vapour is what forms clouds (even though the IPCC authors thought the oceans and clouds would still be there without water vapour on the planet) and we know that there is 30% reflection by clouds (well at least that’s what NASA et al tell us) and we are also told that the atmosphere absorbs about 20% of incident solar radiation.

    What maintains the surface temperature is thus not radiation from GH gases, because it would have been hotter without them, rather like the Moon that reaches temperatures around 130C. But Earth would not cool down as quickly as the Moon does if it had the same atmosphere but no GH gases, because nitrogen and oxygen would then hold 100% of the energy in the atmosphere – even more than the 98% they currently hold.

    What does maintain the surface temperatures of Earth and Venus (and that at the base of the nominal troposphere of Uranus) is the gravitationally-induced temperature gradient which a correct understanding of the Second Law of Thermodynamics let’s us deduce is in fact the very state of thermodynamic equiilbrium which that law says will evolve autonomously.

    And that’s why it doesn’t matter how much back radiation slows that small portion of surface cooling which is by radiation. All the cooling by radiation and non-radiative processes (unaffected by back radiation) slows down and possibly stops in calm conditions in the early pre-dawn hours because the gravito-thermal effect is maintaining the supporting temperature. Then, especially when there is excessive cloud cover over the oceans, ths Sun’s energy absorbed above the clouds can actually make its way down to the ocean surface (and below) warming the oceans by non-radiative processes, not by direct solar radiation which mostly passes through the thin surface layer and could barely raise the mean temperature of an asphalt paved Earth above -35C.

    • Jerry L Krause says:

      Hi Doug,

      Haven’t gotten your book yet, but I and the others need to give what you just wrote more thought than it seems we usually do.

      Have a good day,

      Jerry

  71.  D o u g   says:

    Thanks again to all for your encouragement.

    I hope Roy is reading because this is the best and most accurate discussion of the critically important climate issues that there has ever been on any climate blog to my knowledge.

    Firstly let’s consider the thin surface layer of the oceans. The emissivity of ocean water surfaces has been measured and is discussed here where they deduce it is 0.984 ± 0.004. But emissivity only tells you about what is being emitted and it does not tell you how a water surface got to the observed temperature in the first place. Because the thin surface layer is not a black or grey body (being fairly transparent) the absorptivity is not necessarily the same as the emissivity. It’s pretty obvious that, since the solar radiation passes on down to perhaps a 20 metre depth or more, that only a small portion of it is absorbed in, say, the first 10cm. Climatologists counter this by saying the whole 20 metres all gets mixed up by waves and turbulence. Perhaps it does, but I would suggest that there still must be a considerable amount of thermal energy that conducts downwards from that warmer layer to the colder thermocline in non-polar regions. But anyway, we know none of the back radiation penetrates more than about 10 microns (because it is actually pseudo scattered and only slows radiative cooling) so to what temperature can the Sun’s radiation warm that 20 metres of the ocean? There’s only 163W/m^2 so, using the above 0.984, that gives a mean temperature of 232.5K. Clearly something’s wrong here.

    So we have two major problems with what climatologists claim. Firstly they don’t calculate correctly the surface temperature for a GH free atmosphere because they still leave non-existent clouds shading the surface in their calculations, and they don’t reduce the emissivity to a realistic value for a dry rocky planet. My best estimate is that the emissivity would be in the vicinity of 0.75 and that would give a temperature of about 299.3K though there are too many significant figures in there. None-the-less it gels with the amount of cooling which I found water vapour provides in my study of temperature data. It also gels with about 12 degrees of total cooling that I calculate as being due to water vapour reducing the temperature gradient.

    It really would be best if you read my book which explains the “heat creep” process which is deduced from the Second Law of Thermodynamics. The fundamental thing to understand is that the Second Law says thermodynamic equilibrium evolves and this is not an isothermal state in a gravitational field. When molecules are in motion they interchange kinetic energy and gravitational potential energy. All forms of energy affect entropy and thermodynamic equilibrium. That is why thermodynamic equilibrium includes mechanical equilibrium, and so it stuns climatologists when I tell them that the density gradient is there because of the Second Law and it is the state of thermodynamic equilibrium. It also has a temperature gradient because at every altitude the mean sum of molecular (KE+PE) is constant. Because only KE affects temperature, and PE has a gradient, it follows that temperature has a gradient opposite to that of PE. This fact is inescapable and it is fundamentally important to understand that the temperature gradient is the state of thermodynamic equilibrium.

    You see, once you understand this, then you can understand why newly absorbed thermal energy disturbs the equilibrium and there is thus a propensity for it to be restored. But this restoring process happens with the new thermal energy being dispersed by conduction, diffusion and convection in all accessible directions, including downwards. So, for example, when there has been extensive cloud cover for several days in any particular region, the downward non-radiative heat transfer still happens during the day, transferring thermal energy absorbed in and above the clouds down to the surface. So the surface temperature still rises by day and falls by night despite the cloud cover blocking virtually all solar radiation. And that’s why the oceans are at the temperatures we observe (and likewise the base of the tropospheres of Venus and Uranus etc) and why radiation into the surface is not the primary determinant of the surface temperature.

    • Jerry L Krause says:

      Hi Doug,

      Thank you for directing my attention to the article reporting the experimental observations made to conclude that the emissivity of a sea surface is 0.984 +/- 0.004. Relative to article and this result I have three comments.

      Even though nothing of the determination had anything to with the determination of the sea surface temperatures from satellites, even its abstract mentioned the determination of the sea surface temperature from satellites. And if what I understand is correct, it seems these satellite temperature are based on the assumption that the surface’s emissivity is 1.00000, if you are going to assume why not go all the way. I want to draw attention to the fact there is a 2 per cent difference between 0.98 and 1.00. Imagine a 2% change in the ’solar constant’. And the uncertainty of albedo is reasonably a greater percentage than 2.

      I am an experimentalist and for my thesis research I spent more time, than any other phase of my research, massing sets of 14 small screw top vials consecutively to a millionth of a gram until I the masses of each vial of consecutive massing cycles agreed within 3 millionths with that of the previous cycle. And this was done with many sets of 14. So, when I see basic experimental observations, such as temperature or relative humidities being determined with dry-wet bulb thermometers, being reported with extreme precision I am skeptical, very skeptical.

      The third comment is it stated, or strongly implied, that the sea surface temperature is being determined by the observation of the longwave IR radiation being emitted from said surface. There was a reference to atmospheric attenuation, without any further explanation of what its magnitude might be or how such magnitude had been determined. If this is only a small, nearly insignificant factor, doesn’t this refute the idea that the greenhouse gases attenuate the passage of this radiation to space. And if this factor is significant, how has it been observed (determined)?

      Doug, I am now going to describe what I understand that you have just written, so if I have misunderstood, you can point out where I have misunderstood. So, there is no confusion as to what I am referring, I will briefly quote you.

      Heat creep process to which you have frequently referred in the past. “The fundamental thing is to understand the Second Law says thermodynamic equilibrium evolves and this is not an isothermal state in a gravitation field.” I first assume the thermodynamic equilibrium to which you refer is an adiabatic case. And if there were no gravitation field the system would evolve to an isothermal state. But since there is a gravitation field, a temperature and density gradient will evolve with the greater temperature and density at the base.

      “You see, once you understand this, then you can understand why newly absorbed thermal energy disturbs the equilibrium and there is thus a propensity for it to be restored. But this restoring process happens with a new thermal energy being dispensed by conduction, diffusion, and convection in all accessible directions, including downward.” First, I must ask: In your list of conduction, diffusion, and convection did you forget radiation? Second, I assume that thermal energy may be also removed from the system to disturb the equilibrium. Are you familiar with the famous principle of Le Chatelier? Sienko and Plane, chemists wrote the word famous and I wonder if it is famous outside the discipline of chemistry? These authors in their text Chemistry wrote: “In 1884 Le Chatelier stated that, if a stress is applied to a system at equilibrium, then the system readjusts, if possible, to reduce the stress.” So, I, a chemist, must conclude that your statement is on very firm ground.

      Cloud cover– “So the surface temperature still rises during the day, transferring thermal energy absorbed in and above the clouds down to the surface. So the surface temperature still rises by day and falls by night despite the cloud cover blocking virtually all solar radiation.” I would add that the cloud cover also blocks virtually all the longwave radiation being emitted below it as clearly stated by the meteorologist R. C. Sutcliffe. You have accurately described what is routinely observed when there is the cloud cover you specify. You refer to thermal energy absorbed in and above the clouds. Now I know that Roy stated that clouds absorb solar radiation. But I have not yet come to the point where I can accept this. For I know water vapor does absorb a portion of solar radiation’s invisible IR radiation. And I know that the atmospheric environment of cloud droplets should be nearly saturated with water vapor. And I can point to observed atmospheric phenomenon that, on occasion and at specific locations, occurs very shortly after direct sunlight reaches the earth’s surface, which I can only explain by the fact that water vapor absorbs a portion of the solar radiation. I only call attention to it at this point because I have never read that water vapor absorbs solar radiation, I have only read that clouds do.

      “And that’s why the oceans are at the temperatures we observe … and why radiation into the surface is not the primary determinant of the surface temperature.” You slip the qualifier, primary, into your statement and I have to assume that you consider the thermal energy absorbed in an above the clouds to be the primary determinant of the surface temperature. But I must remind you that the situation you defined was three days of heavy overcast. For simplicity, can I assume three days of clear skies, followed by three days of overcast, followed by three days of clear skies, followed by three days overcast, etc? Because somewhere, as you noted, sunshine (at least the visible portion) through cloudless skies will penetrate tens of meters into the oceans and seas and lakes, etc.

      One more question. R. C. Sutcliffe, Weather and Climate, wrote: “… it is the sun and only the sun that keeps us warm.” Please do not be offended by the question: Can you agree with Sutcliffe?

      Have a good day,

      Jerry

      •  D o u g   says:

        In the book I explain that inter-molecular radiation has a temperature levelling effect that works against the gravitationally induced temperature gradient. The magnitude is decreased …

        (a) on Earth by water vapour – by about a third

        (b) on Uranus by methane by about 5% by my calculations

        (c) on Venus by carbon dioxide by about 20% to 25% – though it’s hard to be precise because specific heat also varies with temperature quite a bit in the Venus troposphere.

        The overall environmental temperature gradient (and thus overall state of thermodynamic equilibrium) does indeed take into account the effect of this radiation. Remember it is only a small percentage of molecules involved.

        Weather conditions may “remove” more thermal energy than would be radiated, leaving a kind of pot hole in the thermal plane that would then be filled in again in calm conditions. It’s just like adding water in the middle of a lake, or taking some out with a fire-fighting helicopter.

        Basically I’m on “firm ground” because it is the process described in statements of the Second Law that I am depending upon.

        In general, clouds and water vapour expedite the passage of thermal energy upwards in the troposphere (even through clouds) because of this inter-molecular radiation which can only ever transfer thermal energy from warmer to cooler regions. Moist air in the space between double glazed window panes reduces the insulating effect. For best insulation they use argon, or at least dry air. So disregard “meteorologist R. C. Sutcliffe.”

        There’s a graphic in my book (and the March 2012 paper) showing the “notches” where water vapour absorbs solar energy. Even CO2 does in the 2.1 micron range. NASA energy diagrams show about 20% absorption of insolation by the atmosphere.

        The downward “heat creep” is not restricted to cloudy days. It’s just easier to be sure it must happen then. There are certainly situations where the Sun is nearly directly overhead (on a clear day) when it delivers something like 550W/m^2 which would cause the solid surface (though not water surfaces) to rise to about 313K (40C). That’s likely to happen here in Sydney this Friday. But even that solar flux does not have a warming effect on the oceans. In general, hail, rain or shine, I believe most thermal energy into ocean surfaces must be by the “heat creep” process. It is mostly solid surfaces (not being transparent) that get warmed by the Sun, but oceans and solid surfaces are kept warmer at night by the supporting temperature at the base of the troposphere which slows and stops cooling in calm conditions in the early pre-dawn hours.

        Yes the Sun keeps all planets and moons at their current temperatures, but not always by direct radiation to a surface if there is one. On Uranus all the Sun does is maintain the methane layer near top of atmosphere at a very cold 60K. But heat creep then maintains temperatures all the way down to the 5,000K solid core thousand of kilometres below. Solar energy has been trapped over the life of each planet under the thermal profile whose temperature gradient is maintained by gravity.

      • Jerry L Krause says:

        Hi Doug and Others,

        Doug, you directed me to the article (Measurement of the Sea Surface Emissivity by Masanori Konda, et. al., Journal of Oceanography, Vol 50, pp 17 to 30, 1994 and I read it and have commented upon it. And you did not refer to my serious omission of what they wrote. I had remembered that I had not referred to the most important fact of the article, which was peer reviewed. As I understand what seems clearly written is that the research was undertaken to separate the actual emission of the surface from the total emission that is observed by a downward facing radiometer during the night. For these authors clearly state that the total emission is the sum of the surface’s actual emission plus the reflection of the downward longwave emission from the atmosphere. And Doug, I had credited you with stating somewhere in the past that this downward emission from the atmosphere did not penetrate the surface of the sea where it could be absorbed if it did. So, we (you) have conformation (the support of others) that nearly 70 percent of the earth’s surface does not absorb any of the downward radiation from the atmosphere. So, no greenhouse effect heating there.

        So, I’ll have to admit that I am bothered by your continued reference to the emissivity of a dry, rocky, planet, which the earth is not.

        Have a good day,

        Jerry

        • Jerry L Krause says:

          Hi Arfur Bryant and Doug:

          Arfur, wrote (11/10/14 at 1:09 PM): “(Except in those rare occurrences when the surface is cooler than the atmosphere).” I do not recognize your name so I repeat. I have encouraged people to go to the University of Wyoming website and to study the actual data of atmospheric soundings which can be accessed there. To begin I would advise one to begin in the USA Pacific
          Time Zone because radio-sondes are launched there at 4:00 AM and 4:00 PM. I advise this because by 4:00 AM the surface temperature has dropped to near the day’s low temperature and by 4:00 PM the temperature has risen to near the day’s high temperature. And during the summer, in this time zone, the temperature differences between the high and low, at several launch sites, are about 30 F or greater. And note the fact that during summer at the higher latitudes the night, during which the surface cools, is relatively brief. And it seems it is useful to supplement the sounding data with the NWS observations (reported on the hour) being made at many more airports than the sounding sites. If you study actual data such as this, it seems one must conclude that it is not a rare occurrence when the surface is cooler than the atmosphere. If the surface is not being illuminated by direct sunshine, its temperature is likely less than the atmosphere’s temperature only 1.5 meters above the surface.

          Consider what Doug wrote (11/11/14 at 4:15 AM): “It is mostly solid surfaces (not being transparent that get warmed by the Sun, but oceans and solid surfaces are kept warmer at night by the supporting temperature at the base of the troposphere which slows and stops cooling in the early pre-dawn hours.” But I did not call your attention to Doug’s comment relative to your statement, I did so because I am not sure what Doug has actually stated.

          I like to call attention to the wisdom of the past. Elzevir, the publishers of Galileo’s book, Dialogues Concerning Two New Sciences, wrote (as translated by Crew and de Salvio): “For, according to the common saying, sight can teach more and with greater certainty in a single day than can precept even though repeated a thousand time; or, as another says, intuitive knowledge keeps pace with accurate definition.” A definition of intuitive is “without thinking”. Before I continue I draw attention to the fact that Elzevir did not write: “sight can teach more with absolute certainty.” Richard Feynman has empathized that a scientist should never be absolutely certain and I accept this conclusion. But if we accurately define (describe) what we do see, we can eliminate a lot of reasoning.

          Doug, in referring to the cooling (of the portion of atmosphere in which most people live) which very commonly occurs most nights, does not state what is the relationship between the temperature of the surface and the temperature, as commonly observed, of the atmosphere 1.5 meters above the surface. The general lack of clearly reported observations of this relationship, which it seems should be observable, is the reason you (Arfur) wrote that which you did.

          While I have used what Doug wrote as an example of less than accurate definition, and what Arfur wrote as an example of a lack of sight, it was not to find fault. I have the same problems as Doug and Arfur and we all need to work to eliminate them as much as possible.

          And the purpose of dialogue is to question, clarify, exchange experiences and thoughts. That is how we gain knowledge. But a problem I have is I often cannot find what others have written and what I have written in reply

          For example: Somewhere Doug wrote: “conduction, diffusion, convection” relative to an adjustment to an established equilibrium situation and to which I remember replying: “what about radiation?” Diffusion is a mechanism of transport that seems to be seldom considered in meteorology. Doug (11/11/14 at 4:15 AM) wrote: Moist air in the space between double glazed window panes reduces the insulating effect, For best insulation they use argon, or at least dry air.” Now, I know there is a diffusion issue involved but I do not know if it is the only issue. Theorists have reasons that the temperature of a gas is directly proportional to the average kinetic energy of the gas molecules. And the average kinetic energy of a collection of molecules is proportional to its molecular mass times its average velocity squared. Now if we have a collection of water molecules, a collection of say nitrogen molecules, and a collection of oxygen molecules at the same temperature, each collection should have the same average kinetic energy. But the average velocity of the different molecules while be different because the different molecules have different masses. So, it is easy to see that the average velocity of the lighter molecules should be greater that than that of a heavier molecule. So if we imagine a single molecule of water (mass of 18 amu) bouncing between the two panes of glass it is obvious it can make more round trips than say a single nitrogen molecule (mass of 28 amu) in a given interval of time. Thus, we would expect the water molecule to transfer more energy (via conduction) from the warmer pane to the cooler pane in a given interval of time. Now, since an argon atom (mass of 40 amu) it seems easy to reason that the nitrogen molecule could transfer more energy between the panes than could an argon molecule. Now, carbon dioxide (mass of 44 amu) has even a greater mass than an argon atom and I have found tables of thermal conducties of gases which show that indeed carbon dioxide has a slightly lower thermal conductivity than argon.

          Now I am sure carbon dioxide is a less expensive gas than argon. So, a question is: Why isn’t carbon dioxide used instead of argon? It cannot be that carbon dioxide might condense as water vapor might because carbon dioxide, at 1 atm pressure, sublimes at -78.5 C. Is it because carbon dioxide could absorb the longwave emission of the warmer pane? Don’t know the answer but the question prompts me to consider the transfer of energy from the warmer pane to the cooler via radiation. But, evidently there is experimental evidence that the inclusion of argon improves the insulating property of the window, strongly suggest that the primary energy transfer mechanism is conduction by the gas molecules and any transfer via radiation is a secondary mechanism.

          Hence, might I conclude that the primary energy transfer mechanism between the earth’s surface and a centimeter, or more, layer of atmosphere above the surface is via the conduction mechanism?

          Is this an example of how intuitive knowledge keeps pace with accurate definition based upon common observations?

          Have a good day,

          Jerry

          •  D o u g   says:

            Jerry (and others) – sorry about the delay in replying as I just back from a couple of days in hospital – no big problem.

            It would save time if you read my book.

            Very briefly (and from the book) …

            The overall state of thermodynamic equilibrium includes mechanical and radiative equilibrium. This is why my hypothesis explains that radiating molecules (water vapour, carbon dioxide, methane etc) reduce the magnitude of the gravitationally induced temperature gradient. Their radiating properties have a temperature levelling effect and also help energy to leap frog the slower moving energy that is crossing the gap (or moving up the troposphere) by conduction, diffusion, advection (or the all-embracing term “convection”) and so we don’t use WV or CO2 in double glazing.

            Regarding the rocky Earth, I was talking about an Earth without greenhouse gases, and thus without water or vegetation.

            Pierrehumbert made the enormous error of reducing the solar intensity by the 30% that is reflected by clouds in the real world, forgetting there would be no clouds shading that rocky dry planet.

            Hence his 255K figure is wrong and the radiating temperature of the surface of the rocky planet would be more like 278K which wipes out about 70% of the IPCC’s “33 degrees of warming” if it were correct to calculate such from radiation.

          • Arfur Bryant says:

            Jerry,

            You talk a lot of sense and I was guilty of using vague language.

            However, taken globally, the lapse rate is always cooling lapse rate as opposed to a warming or neutral lapse rate! My point about the inability of the ‘backradiation’ to add energy to the surface remains valid on a global scale and we are talking about ‘global’ warming.

            At the local level (and I am well aware of meteorological observations) if the ground is cold but the air is warm, then there can equally be no warming of the local atmosphere due to outgoing LWIR. Hence the standard IPCC warming mechanism cannot be true. It was this point which was the focus of my comment. It remains impossible for a cooler object (eg atmospheric CO2) to provide a warmer object (eg the surface) with additional thermal energy.

            But thanks for keeping it objective:)

          • D o u g   says:

            Arfur wrote above

            “It remains impossible for a cooler object (eg atmospheric CO2) to provide a warmer object (eg the surface) with additional thermal energy.”

            That’s true for radiation, but not true for non-radiative “heat creep” as proved in my book.

            You still haven’t explained how the Venus surface temperature rises by day. The above is a hint.

          • Jerry L Krause says:

            Hi Doug,

            You remind me of Buckministerfuller of whom it has been said to have had a significant problem of communicating his ideas to others. One knew, after listening to one of his lectures that he knew something, but one did not know what it was.

            I have started reading your book and if I work hard I can see that what initially seems to be nonsense does make sense. Case-in-point: Water vapor and clouds cool instead of warming. My first instinct is that water vapor and clouds are not the same, they are different. My second instinct is when the day is cloudy I expect the high temperature to be less than if the day were to be clear and sunny. So, why would I expect clouds to cause warming? And if I had not read Donald Ahrens’ popular textbook, Meteorology Today 9th Ed, I would not know because, Doug, you did not tell me that it is being taught that clouds act just as greenhouse gases do, they actually do hinder the transmission of longwave radiation (energy) to space. And, of course, we know that these gases cause the earth’s surface temperature to be 33 C warmer than it would be without these gases.

            Doug, you gave a tight reasoning theoretical reasoning why this 33 C temperature difference does not exist and you were applauded. But it was theoretical because the planet you proposed does not exist. So your theoretical reasoning is really no different than that of Joseph Fourier nearly two centuries ago, who looked at the warmth of the greenhouse (when the sun shone) and concluded that the earth must be as warm as it is because of its atmosphere acts as the glass of the greenhouse. I am sure the early modern science, who defined what a good hypothesis must be, would reject both the hypothesis of the greenhouse effect and your reasoning because neither can be tested by observation.

            Now, before going forward, I must remind you and others of what Galileo understood so long ago. “We cannot teach people anything; we can only help them discover it within themselves.”
            So, I only present information; not knowledge or understanding, that you must supply.

            If this were a classroom and a teacher, I would only ask questions, as Socrates is said to have done. This because he said he did not know anything and was only trying to learn. Relative to your artificial planet that you proposed: I would ask: Doug (class), do you know of a heavenly body, which does exist, that has some of the characteristics of your artificial planet, which does not exist? And I wait until I got from the class the answer that I was thinking of. When this happened I would ask: How is this heavenly body different from the artificial planet that Doug has proposed. After getting the answer I was looking for, I would ask: Do these differences present an insurmountable problem relative to the type of reasoning you have applied to the artificial planet? And I would expect the class would be off and running without any further questions to focus their attentions on what is important and what maybe is not. Yes, I would have more questions in my bag of questions if the class needed further direction. This would work because I know the class knows more than they think they do.

            So, I like to experiment to see what actually will happen if I do this or that.

            While I wait to see what you might write, I will work on composing a response to frequent references to Venus and Uranus.

            Have a good day,

            Jerry

          • Jerry L Krause says:

            Hi Doug,

            I have read extensively about Venus, so I am familiar with what is has been generally observed although I have not read about the 5 C diurnal surface temperature oscillation. But I accept it is must be an observed fact. In the spirit of what I have just written I will ask questions which I will in turn give my answer, be it right or wrong. And I will include Uranus which you frequently do.

            We agree that Venus, Earth, and Uranus have clouds. First, I ask: How are Venus and Earth, as planets different from Uranus? I am sure we can agree that Venus and Earth are solid planets whereas Uranus is a gaseous planet composed primarily of hydrogen. What difference does this make? Uranus has no clearly defined surface. Wait maybe it does because I read there is a question if the gaseous planets have a ’liquid’ hydrogen core.

            Now a fact is I have made a magnetic model of planetary atmospheres. I did this by acquiring magnetic disks with holes in their centers and placing these disks on a glass tube so the poles of the adjacent disks repelled each other. In one stack of disks there were only 6 disks and in the other 14. First, as you might anticipate, the weight of the upper disks compress (reduce) the spacing between adjacent disk at lower levels. Just as is the case of gas molecules in a planet’s atmosphere. And in the case of the 14 disks, toward the bottom the spacing is reduced to near zero, if not zero. This, while the spacing the top 6 disks of the 14 stack is identical to that of the spacing of the 6 disk stacks. So? What is my point? Normally we think of a gas as a compression fluid. But in the gaseous planets whose mass, hence gravity, is sufficient to retain the gas molecules at its top, the weight of the molecules above compresses, at some point, the molecules below, regardless of their temperature, to the density of liquid hydrogen at its boiling point of 19 K. At which point the gas basically becomes an incompressible fluid. But because of what you, Doug, term heat creep, we expect temperatures at this point to be amazingly great. So as the density of hydrogen molecules asymptotically approach the density of liquid hydrogen, there is no clear, sharp boundary. Hence, there is no clearly observable base of the troposphere (atmosphere). Now, the reason I constructed the models is the fact that the mass of the carbon dioxide atmosphere far, far exceeds the well known nitrogen-oxygen atmosphere of Earth which has a mass similar to that of Venus.

            Moving on. All three atmospheres are known to have clouds. I might ask: What is the importance of clouds? While answering this question is our goal, it is too general at this point. So, I first ask: how are the clouds of Venus and Uranus different from those of Earth beyond their clear difference in composition? Earth is partially cloudy and Venus and Uranus are totally cloudy. So? Well, one thing it is difficult to see what is beneath the cloud decks of Venus and Uranus whereas I have an image, observed from space, of a cloud free Earth on my wall. And Spencer has taught us how we too can call up, hour old, images of the earth from space and see the Earth in living color at those locations where there are no clouds.

            I could ask a really stupid question: How do we know clouds exist? Another thing we can agree upon because we see it, is that clouds strongly scatter (or reflect, at this point which actual mechanism does not seem critical) much solar radiation back to space. So? Which in turn means only a much smaller portion solar radiation penetrates to the base of the cloud. So? I think we can agree we do not know of any case where absolutely no solar radiation penetrates a cloud.
            What has this to do with Venus and your (Doug’s) concern? Doug focuses on the little amount of solar radiation that reaches Venus’s surface and has not, to my knowledge, considered where the greatest portion of the solar radiation that is absorbed by the Venus-atmosphere system has been absorbed. It seems it is generally accept that this system’s albedo is about 0.75. Which means 25 percent of the solar radiation intercepted by this system is absorbed in some way by it and I assume that Doug does not believe that most of the 25 percent is absorbed at the surface. And because Venus is much closer to the sun this 25 percent or radiation is significantly greater than 25 percent of this radiation which is intercepted by the Earth-atmosphere system, which actually is accepted to absorb about 70 percent of the solar radiation it intercepts.

            Where, or how, is radiation (energy) absorbed? I really do not know how the bulk of the energy is absorbed, but I believe (speculate) it is absorbed above and within the cloud layer. What is evidence for this speculation? or what is the result of this absorption? are questions which are intertwined. But before tackling them I need ask: Are the composition of Venus’s cloud the same as those of Earth? No! We are all clearly aware that the Earth’s clouds are condensed water vapor, but I suspect far fewer are aware Venus’s clouds have been observed to be sulfuric acid droplets. Now, a question not commonly asked is: Do these sulfuric acid droplets sometimes precipitate as the water droplets do? Or, do they evaporate as they fall into an ever increasing warmer (hotter) atmosphere? Doug knows the lower atmosphere of Venus has the temperature gradient, due to heat creep, expected for an atmosphere of carbon dioxide molecules. And he knows the temperature of Venus’s surface, which oscillates over only a 5 C range during Venus’s long diurnal period of about 40 earth days is very hot (465 C). So, if some sulfuric acid droplets do begin to fall from the clouds, they will decompose at the 281 C level, into compounds of molecules of water and sulfur-oxides. So at the sharp atmospheric altitude the energy necessary to accomplish this decomposition will be removed from the atmospheric molecules and perhaps strongly cool the atmosphere at this point.

            Now, to be honest, I must share what William K. Hartmann (Moons and Planets 2nd) wrote: “An extraterrestrial example of condensate clouds occurs on Venus, where the clouds are made from droplets of sulfuric acid … Pioneer Venus’ 1978 parachute probes confirmed early evidence that Venus’ clouds are sulfuric acid, and showed that the clouds are concentrated in a layer from 48 to 58 km above the surface. The sulfuric acid droplets in this region have diameters of about 1 to 10 microns. Above this cloud deck a haze of 1 to 3 micron droplets extends upward to at least 68 km. Below the cloud deck a haze of 1-2 micron droplets extends downward to a sharp cutoff at 31 km. Below that the atmosphere is dense but clear. At altitudes of around 80 km, under the influence of solar ultraviolet, chemical reactions among minor atmospheric constituents produce small droplets of sulfuric acid, which then begin to fall slowly. Between 48 and 58 km is a region with convective updrafts and downdrafts; thus the particles are likely to be caught there, growing slowly during a lifetime of a few months. Droplets that get too big eventually drop out of this layer into the warmer region below. While temperatures range between 15 and 91 C in the cloud deck, they reach 220 C about 20 km below the clouds and so the droplets rapidly evaporate as they fall out of the cloud. This explains both the smaller particle size observed in the sulfuric acid “drizzle” falling out of the cloud and the termination of the drizzle below 31 km. Condensation and movement of the cloud particles involve a heat flux about one-fourth of the solar flux at that altitude.” I must ask in the interest of accurate definition: What specifically is that altitude? And relative to the sulfuric acid totally evaporating at 31 km, I, a chemist, would trust the Handbook of Chemistry and Physics published by Chemical Rubber Publishing more than what Hartmann wrote.

            Note worthy is that the temperature at the top of the convection layer, cloud deck, is 15 C. And I cannot find (I think my reference articles about Venus’s atmosphere is still in Minn.) the information I remember that atmospheric pressures of the convection lay is similar to that of the earth’s troposphere.

            Doug, you have suggested that I disregard R. C. Sutcliffe, but I cannot because it is my opinion that no respected meteorologists would be inclined to disregard of what he wrote. For Roy Spencer parroted back to me what Sutcliffe had generally written about 50 years earlier. Which was (The effects [of clouds] are complicated because clouds are neither ’black’ nor ’gray’ but react to different parts of the spectrum differently. To the sun’s visible radiation they are efficient reflectors, throwing up to as much as 80 per cent back to space, and so shining white in the eyes of the space traveler. What is not reflected mostly penetrates and is absorbed in clouds of sufficient vertical depth [is the 10 km cloud deck of Venus a sufficient vertical depth even though the cloud itself is thin, visibility of more than a km?] so the amount of light reaching the earth is then quite small, as every photographer know. Long-wave radiation from the earth, the invisible heat rays, is by contrast totally absorbed by quite a thin layer of clouds and by the same token, the clouds themselves emit heat continuously according to their temperatures, almost as if they were black bodies.”

            Doug ,since you seem to like to calculate, see, given these altitudes and a few temperatures, see if the temperatures and their altitudes are consistent with your heat creep process. And calculate how much of the about 25 percent of the solar radiation intercepted and absorbed by the Venus system could be emitted from the top of the cloud deck at 15 C. This only if you want to.

            Now back in the seventies the super-rotation of this cloud deck was a hot topic. While the planet it self has a retrograde rotational period of 224.7 earth days, The top of the cloud deck has been observed to have retrograde rotational period of 5-7 depending upon what one reads and where the rotation is observed to be occurring. Another fact is that according to NASA data the maximum and minimum temperature of Venus’s surface are the same. There is not even a 5 C temperature difference. But I trust Doug, wherever he read this, more than I do NASA. And it is even more difficult to explain no change.

            Another fact, as I tried to refresh my memory of the details of Venus’s atmosphere, is that I read that the cause of the atmospheres superrotation still is unknown. Except I can say with confidence that it is due to the absorption of solar radiation within the cloud deck regardless of the mechanism.

            And I can say with confidence that the equilibrium condition of the temperature gradient which is the result of heat creep is adiabatic. And I am confident that Doug is correct when he states the very high temperature of the Venus surface is not the primary result of solar radiation being absorbed at the surface, that it is instead the primary result of solar radiation being absorbed within the cloud deck which fixes the temperature of the cloud deck base.

            But Doug’s question, I believe he wanted me to address is: What happens to the longwave radiation being emitted by Venus’s surface at 465 C (723 K)? First, it needs to be recognized that once the temperature gradient is established, it is a near equilibrium situation due to Venus gravity and the long ‘day‘. But the cloud deck is rotating more rapidly so its ’day’ is not as long. And it needs to be recognized that the dense carbon dioxide atmosphere is going to be absorbing and emitting. And it is important to recognize that it is emitting in all directions, including horizontally. Think twilight. But the upward emission is blocked from escaping by the base of the most dense cloud deck which is 55 km above and much colder than the surface below. Relative to by which mechanism this radiation is blocked and ‘trapped’ beneath the cloud deck, it does not matter. Observation dictates what must exist.

            But, how can the base of the cloud deck, emitting as if it were a black body, begin to radiate the energy being emitted upward from the planet surface at its much lower temperature. So what is observed dictates the cloud deck must be blocking by some mechanism which does not involve the absorption of the longwave radiation. So by default the mechanism must be scattering. And sight teaches more in a single day than precept repeated a thousand times.

            Uranus seems similar to Venus except we do not actually know as many details about it as we do about Venus.

            What do you think?

            Have a good day,

            Jerry

          • Atmospheric.Physicist says:

            Jerry, you wrote: “clouds act just as greenhouse gases do, they actually do hinder the transmission of longwave radiation (energy) to space. And, of course, we know that these gases cause the earth’s surface temperature to be 33 C warmer than it would be without these gases.”

            Jerry you should have known that water vapour is by far the most dominating “greenhouse gas” in our troposphere: the IPCC says so in the cited quotes early in the book.

            I’ve written in more detail about how thermal energy passes through clouds in comments posted today further down in this thread. (I had missed this comment of yours.)

            The surface temperature would have been about 278K (not 255K) in the absence of water vapour and thus clouds. Hansen and Pierrehumbert seem to have “forgotten” that the clouds which reflect 30% of incident solar radiation would not have been there in the absence of all greenhouse gases including water vapour. This is the most obvious error, and one which I hope to explain to Australia politicians because even they should understand that it’s cooler in the shade.

            In Climatology Carbonland they invent their own “Super Second Law” which supposedly only considers the end result of any sequence of totally independent processes. You might as well say a siphon would keep on sucking up water if you cut the hose at the top.

            Having then invented this Super Second Law they then assume that back radiation helps the Sun to achieve higher surface temperatures. It doesn’t. The gravitationally induced temperature gradient would exist with or without radiating gases. Once we have an Earth with water vapour, the extra 0.04% of carbon dioxide would not raise the radiating altitude by more than 2 metres at the absolute most – maybe not even 0.2m. But it also reduces the temperature gradient, just as does water vapour, and both have a net cooling effect. Jump to the Appendix of my book to read the study that proves water vapour cools, not warms.

          • Atmospheric.Physicist says:

            Jerry, then you wrote …

            “Doug, you gave a tight reasoning theoretical reasoning why this 33 C temperature difference does not exist and you were applauded. But it was theoretical because the planet you proposed does not exist.”

            But the whole “33 degrees of warming” cited by the IPCC is also based on the lower temperature (255K) being for a planet which does not exist. Furthermore, they assumed that the radiation reaching this imaginary planet’s surface would be mysteriously reduced by 30% due to even more imaginary clouds (that certainly would not exist in the absence of water vapour) reflecting that much back to space.

            You can’t ignore the fact that increasing the percentage of water vapour (from say 1% to 4%) in a region leads to more clouds reducing the radiation which gets to the surface by reflecting perhaps 10% to 40% of the solar radiation back to space.) It also reduces the temperature gradient (aka dry to wet lapse rate) from say 8.5C/Km to 6.5C/Km and that causes the whole thermal profile in the troposphere to rotate downwards at the surface end – which is another way of saying that the supporting temperature at the surface interface is lowered.

  72. Jerry L Krause says:

    Hi Aufur, Doug, and anybody else,

    Oops!! Great lesson here. Sight and Accurate Definition Got to see everything!! Forgot about low-e-glass when I concluded that conduction was the primary heat transfer mechanism in double pane windows and the radiation transfer mechanism secondary and therefore could be ignored. Read about low-e-glass from PPG and the special reflective coating is said to reduce the emissivity of the normal glass surface from 0.85 to 0.02.

    My oversight reminded me of a couple of other properties of glass. The greenhouse effect is based on the fact that glass strongly absorbs longwave radiation so that it is opaque to this ‘invisible‘ (to our eyes) radiation. So the only mechanism to transfer longwave energy (heat) through the solid glass is conduction. The thermal conductivity of glass is quite low. So when it is cold outside and warm inside, the temperature of the outer side the pane was significantly less than the temperature of the inside which was probably less than the air temperature inside the room. And the thermal conductivity of the atmosphere is quite low. That is why simple, inexpensive, storm windows significantly reduced heat lost through single pane windows. For the second pane not only provided another insulating reduction which could be conveniently opened for ventilation during hot summer days and closed when it rained etc. But these simple, inexpensive, storm windows evolved because they had to be put up in the fall and taken down in the spring. These So, they evolved when

    Just saw that you both have just responded to my last comments. I terminate the last thought because I want to correct (update) what I had just previously written before anyone corrects me.

    The bottom line relative to Sight and Accurate Definition is I do not yet know which mechanism, conduction or radiation, contributes most to the heat (energy) loss through windows. Pella, at one time went to three pane windows before argon and low-e-glass. And I know I have read comments about the spacing between double pane windows. Would believe there is experimental data which suggests the ultimate design but I have no idea what such experimental result might be.

    Have a good day,

    Jerry

    •  D o u g  C o t t o n   says:

      Yes Jerry, but I’m not talking about the properties of the glass – just what happens in the gap between, which in many ways emulates the troposphere. Both non-radiative and radiative process help thermal energy across the gap. Take out the radiating molecules and the whole process is slower. Likewise, the radiating molecules help thermal energy to move up the troposphere and eventually to space.

      Here’s a couple of comments I just posted elsewhere …

      The hiatus is explained by the fact that, whilst the 934-year cycle in the inverted plot of the scalar sum of the angular momentum of the Sun and all the planets is still rising for another half century, the superimposed 60 year cycle is in the middle of its 30 year downward trend, so there’s a slight net cooling until we get about half a degree of warming between 2029 and 2058. Thereafter the world will experience 500 years of long term cooling with superimposed 60 year cycles as always.

      Carbon dioxide has nothing to do with it. Pierrehumbert’s “explanation” of warming from 255K to 285K is wrong because he forgot that a planet without water vapour would have no clouds reflecting 30% of the insolation. Without clouds or GHG the Earth’s surface would receive 341W/m^2 for which the radiating temperature is 278K not 255K.

      Furthermore, empirical evidence from 30 years of temperature data from three continents shows that the most prolific GH gas, water vapor, cools rather than warms. That completely debunks the GH conjecture.

      We have …

      “climate science” instead of “atmospheric physics”

      “lapse rate” instead of “temperature gradient”

      “hydrostatic equilibrium” instead of “thermodynamic equilibrium”

      “convection” instead of “wind” in some cases

      and those mysterious “pockets of air” which cannot possibly hold together whilst molecules dart about at 500 metres a second between collisions.

      It’s all a world of its own with “fissics” that cannot possibly explain why the base of the nominal troposphere of Uranus is hotter than Earth’s surface, despite being 30 times further from the Sun. The whole paradigm of radiative forcing is wrong; it is the gravitationally-induced temperature gradient which props up the surface temperature, not back radiation from the colder troposphere.

  73. D o u g. C o t t o n  says:

    At TOA the solar constant is about 1,362W/m^2. On average 30% is reflected by clouds, but not on a clear day of course. Then 21% is absorbed by the atmosphere. So on a clear day with the Sun directly overhead in the tropics we could get 1,076W/m^2 which has a radiating temperature of 371.15K – almost the boiling point of water. But so what? In reality the Sun does not have sufficient time to reach that temperature during the day, and much of the energy is being lost immediately by non-radiative processes.

    What we learn from this is that, whatever radiative flux we use, the actual surface temperature will not be as high as the radiative temperature and could be 50 degrees less in cases like this. The mean flux reaching the surface is only 163W/m^2 which is obviously far less, and this flux could not raise the surface temperature even to the radiating temperature of 231K.

  74. Doug Cotton says:

    Jerry

    Firstly read http://en.wikipedia.org/wiki/Uranus#Troposphere

    I always refer to the “nominal” troposphere of Uranus which is only 350Km deep and is 320K at the base with a gravitationally induced temperature gradient -g/Cp reduced only about 5% (by my calculations) due to inter-molecular radiation involving methane. There is thought to be a small solid core (55% the mass of Earth) thousands of kilometres further down, and that makes Uranus very different from Neptune and also different from Jupiter which is collapsing and thus converting molecular gravitational potential energy to kinetic energy. So yes Jerry I’ve already done the calculations and published them last year on several climate blogs. I’ll get back on other other points later but am running late for church right now.

    Doug

  75. D o u g  C. says:

    Jerry

    Checkout the info here first please ….

    http://en.wikipedia.org/wiki/Uranus#Troposphere

  76. Atmospheric.Physicist says:

    Jerry

    Sorry about the duplication with my previous comment as it seemed the first one disappeared, but then did appear.

    It doesn’t matter where in a planet’s troposphere the solar energy is absorbed. However, we do know that on Uranus it must be mostly absorbed in the methane layer which is near TOA and is at roughly the radiating temperature around 60K. So that methane layer acts as a heat source for the rest of the planet. The Sun keeps it at that temperature, albeit rather a cold temperature because the radiation is less than 1/900th of what Earth receives.

    Under no circumstances will the electro-magnetic energy in radiation be converted to thermal energy in a target warmer than the source. That’s explained briefly in my book and in far more detail in the cited paper. So radiation only ever transfers thermal energy to cooler regions.

    Rather than blocking that radiated upward transfer of thermal energy, all radiating (“greenhouse”) molecules (including those in clouds) assist the upward transfer in the troposphere and eventually to space. Hence there is a mass exodus of thermal energy by radiation. To balance this there must be a downward flow of thermal energy by non-radiative processes, and this is mostly in the sunlit hemisphere of course. Hence it is probably more than twice as much as the upward radiative flow that happens day and night. It would be more, because there is also some upward convective heat transfer at night.

    The solar radiation can only raise the temperature within the limitations of the Stefan Boltzmann equation. Below the sulphur clouds on Venus there is less solar intensity than reaches our Moon, and we know the Moon can only reach temperatures around 400K. So that’s why I say the absorption takes place on Venus in regions that are cooler than 400K, but that thermal energy is then transferred by “heat creep” (non-radiative heat transfer that is restoring thermodynamic equilibrium as the Second Law says will happen) to the 700K plus regions, including the surface.

    Hans Jelbring published a paper on Gravitational Mass in Energy and Environment which mentions the 5 degrees, though his paper does not explain the “heat creep” process. He makes the common mistake of thinking pressure induces and maintains high temperatures. It doesn’t. Pressure does not act on molecules: gravity does. The temperature and density of molecules causes pressure, not the other way around. Gravity forms a density gradient (and the Second law explains why) and likewise gravity forms a temperature gradient. The pressure gradient is a corollary because pressure is proportional to the product of density and temperature.

    I hope what I’ve written helps you think about and work out answers to your own questions.

  77. Atmospheric.Physicist says:

    Footnote:

    Jerry – the issues of condensation (like water phase changes in our own troposphere) cannot negate the Second Law. My response is that, when considering what the Second Law says about entropy increasing to a maximum, you have to take all forms of energy into account, including any released or absorbed in phase changes, and also gravitational potential energy.

    We can only deduced the “hot to cold” corollary of the Second Law if we hold other forms of energy (apart from kinetic energy) constant. So we can only say heat always transfers from hot to cold in non-radiative heat transfer for a situation in a horizontal plane without phase changes or chemical reactions.

    I have cited the example of a lake with (a) new water being added by rain on some portion of the lake, and (b) water being removed such as by a fire-fighting helicopter. Gravity repairs the damage and the surface “levels out” again. So too does the thermal plane in a planet’s troposphere when thermodynamic equilibrium is disturb by local warming or cooling. If there is a permanent aberration (such as in the stratosphere) it is because the conduction/diffusion process cannot keep up with the rate of new warming or cooling. The laws of physics are not being violated.

    • Jerry L Krause says:

      Hi Doug,

      You confused me with your aliases and I have not studied what you wrote under them. For first I have something I want to check out with you. I need direct answers to my questions to determine what we seem to agree upon and what difference remain.

      From your various comments, I conclude, in the case of Venus or Uranus, there are two potential atmospheric equilibriums that might exist–a thermal equilibrium where the temperature of a planet’s atmosphere containing molecules capable of absorbing and emitting longwave radiation comes to some isothermal state or a dynamic equilibrium where, because of gravity, the atmosphere of similar composition comes to an equilibrium state in which there are two atmospheric gradients formed. The density gradient in which the density of the atmosphere increases with decreasing altitude and the temperature gradient in which the temperature of the atmosphere increases with decreasing altitude.

      Now, it is my position that to achieve the stable dynamic equilibrium state below the cloud deck, which has been obviously observed in the case of Venus, it needs to be assumed that the cloud deck effectively blocks the transmission of the longwave emission of the 465 C surface plus the upward emission of the atmospheric molecules to space.

      This is not all I want to check, but as I went further it seemed I might unnecessarily confusing what I want to learn about what you reason.

      Have a good day,

      Jerry

      • .Atmospheric physicist. says:

        Jerry

        If you look up the definition of “thermal equilibrium” in physics you will find that you cannot prove what you claim about “thermal equilibrium” and, in any event, I don’t use the term. Nor do I talk about a “dynamic equilibrium.” What I talk about can happen in an insulated sealed cylinder. It is what the Second Law of Thermodynamics tells us will be approached as entropy approaches its maximum.

        So I am not interested in discussing some imaginary “dynamic equilibrium” because there can only be one state of maximum entropy. You are still too much influenced by the false propaganda circulated in Climatology Carbonland.

        But I will say that it has nothing to do with blocking surface emission. There’s no surface at the base of the Uranus troposphere where it’s 320K. As I keep asking you, how does the necessary thermal energy actually get into the Venus surface in order to raise its temperature from 732K to 737K during its day?

        Thermodynamic equilibrium is a far more embracing concept which leads to an explanation of the density gradient as a corollary of the Second Law of Thermodynamics. You will learn (and hopefully understand) this physics more quickly if you read my book.

        “Hydrostatic equilibrium” (presumably your “dynamic equilibrium”) is identical to thermodynamic equilibrium and that is fundamentally important to understand if you really want to understand the “heat creep” process which is a corollary of the Second Law of Thermodynamics. That non-radiative heat transfer mechanism downwards is what obviates any need for assumed (though impossible) heat transfer from a colder troposphere to a warmer surface. You have to explain how the surface gets to the temperature it is at, before you worry about rates of cooling.

        Now, please save my time by reading the book and discussing the physics in there if you feel it needs further explanation.

        • .Atmospheric physicist. says:

          PS In “thermal equilibrium” there is no net transfer of thermal (kinetic) energy across any internal boundary. However, because of the gravitationally induced temperature gradient, this does not necessarily imply that the mean temperature of the top half of (for example) a tall insulated sealed cylinder of gas will b ethe same temperature as the mean temperature of the bottom half of the system. The bottom half will be warmer, but there will be no net thermal energy transfer either way across an imaginary boundary between the two halves.

        • .Atmospheric physicist. says:

          However, the Second Law is not talking about thermal equilibrium. It is about thermodynamic equilibrium and it is fundamentally important that you understand the difference.

  78. Atmospheric.Physicist says:

    PS

    Jerry – clouds do not act as a complete barrier to upward or downward radiation, be it light or IR. The molecules either transmit the radiation, scattering it by refraction, or re-emit it. We know of course that the sunlight is scattered, because clouds cannot emit visible light. So when I look out my window now at some low level clumps of cloud in the distance, roughly the top two-thirds looks quite bright because some sunlight has been scattered in the almost horizontal direction towards my eyes. The bottom of the cloud is a light grey because it does not receive the full intensity that the top does because of the scattering happening above it. The water vapour in the atmosphere also scatters radiation and so, if I stand in the shadow of a building or a hovering helicopter it is not dark like a total solar eclipse.

    Upward IR radiation can also be absorbed and re-emitted in all directions by molecules in the cloud, so some will be re-absorbed by molecules higher up and will warm a group of those molecules if they are colder than the emitting group of molecules.

    Furthermore, conduction and diffusion processes can also transfer thermal energy right through clouds, just as conduction does through the glass in the windows of your car, so there is a maximum temperature the inside of the car reaches when parked in sunlight.

    The radiation that goes downwards from those clouds gets a second chance, because it is reflected or “pseudo scattered” by the warmer surface and does not transfer thermal energy from the cooler cloud to that surface. On the way back up the radiation will only warm anything that is colder (as so probably higher) than the cloud that emitted it.

    The Second Law applies to every single independent process (such as every passage of radiation in one direction) and that is why back radiation does not help the Sun to achieve a higher maximum surface temperature each day. Heat creep does that.

  79. Atmospheric.Physicist says:

    I’m not sure why people have difficulty understanding that the air or gas in the gap between double glazing acts just like that in a planet’s troposphere. The hotter pane of glass is the surface and the colder pane is the tropopause. Let’s imagine that at the tropopause radiation to space can happen, rather like happens from the methane layer near the top of the nominal troposphere of Uranus. If the rest of the troposphere (or the gap) were totally dry air (or some non-radiating gas like argon) then thermal energy would transfer trough the troposphere by (stationary) conduction and diffusion processes. By the process is slow. If we add water vapour (or carbon dioxide) then (as with moist air in the double glazing) the insulation effect is reduced because intermolecular radiation (and radiation direct to the tropopause or beyond) helps the thermal energy to leap frog (at the speed of light) over the slower moving energy going up by non-radiative processes. No thermal energy can be transferred back by radiation to lower, warmer regions. Yes the radiation can go downwards, but it is immediately re-emitted by electrons in any and all regions that are warmer than the source of the radiation. Its electro-magnetic energy is not converted to thermal energy and so it does not raise the temperature of whatever it strikes.

    • jerry l krause says:

      Hi Doug,

      Please be patient with me. The more I read what you have written, the more I understand what you have written. This has been coupled with what I thought I knew about Venus and its atmosphere, which I have finally confirmed. Either my former references to this information are still in Minnesota or I have burned the past because I thought it was over. Anyway, finding the information I knew that existed has slowed me down.

      And relative to the Venus, last week we, at Salem OR USA, had at our house a constant temperature, 31 F, for at least 24 consecutive hours. And the weather service at the airport, only a few miles away, but at a elevation about 300 ft less than our home. Their constant temperature was 33 F. We had ice because during this period there was continuous precipitation and a cloud cover whose depth was about 8 km at the beginning of the period and decreased during the period. I have just completed plotting the atmospheric sounding data (temperature vs. altitude) from soundings launched from our airport. I would suggest it might be profitable for you to plot the data from the soundings 12Z13 Nov 2014, 00Z14, 12Z14. University of Wyoming website.

      I will try to get some thoughts about what I am beginning to understand for you to review if I am coming to what you understand.

      Have a good day,

      Jerry

      • Atmospheric.Physicist says:

        Jerry

        Anecdotal “evidence” proves nothing. Just see the study I have already done showing water vapour cools.

        To all:

        Beware – global warming starts again in the year 2029, so CO2 will be blamed again unless and until you realise that there is absolutely no valid physics supporting the conjecture that it helps the Sun to raise the daily maximum temperature anywhere on Earth – or Venus for that matter.

        • Jerry L Krause says:

          Hi Doug,

          To what anecdotal “evidence” are you referring?

          Have a good day,

          Jerry

          • .D o u g. says:

            Temperatures at your home and the nearby airport are anecdotal evidence and I don’t even know what point your are making anyway.

            “The expression anecdotal evidence refers to evidence from anecdotes. Because of the small sample, there is a larger chance that it may be unreliable due to cherry-picked or otherwise non-representative samples of typical cases.[1][2] Anecdotal evidence is considered dubious support of a generalized claim;” [source]

            What is surprising about there being about 1 C degree warmer temperatures at about 0.1Km lower altitude? The normal temperature gradient is about 0.7 C degree in 0.1Km and your single significant figure values don’t tell me anything I would not expect.

  80. John Parsons says:

    Dr. Spencer’s and Dr, Christy’s work show that the Globe is warming. JP

    • Alex H says:

      Yes John the world is warming (long-term) because we are just short of the next maximum in the 1,000 year natural cycle. But I thought the main issue was about whether carbon dioxide can do any warming, or whether, like water vapor it just helps to cool by radiating energy out of the atmosphere. There’s no valid physics which would suggest that carbon dioxide can warm Earth’s surface. There is valid physics which explains Earth’s surface temperature (and temperatures on other planets) but it has little to do with radiation into a planet’s surface.

  81. Ook ik wist niet waar ik vrouwen kon ontmoeten.

Leave a Reply