
 Home/Blog
Brace yourself for more “polar vortex” news stories by the middle of next week.
An unusually widespread and persistent cold air mass will grip all but the U.S. Southwest and Florida by late in the week.
It’s origins can be traced back to eastern Siberia a week ago, then it crossed the Arctic Ocean and northwest Canada. It will enter Montana and the Dakotas on Sunday, then gradually sink south and east as the week progresses.
The latest forecast for 7-day average temperature departures from normal shows widespread 10 to 15 deg. F below normal over much of the nation for the seven days starting next Wednesday (click for full-size, graphics courtesy of Weatherbell.com):
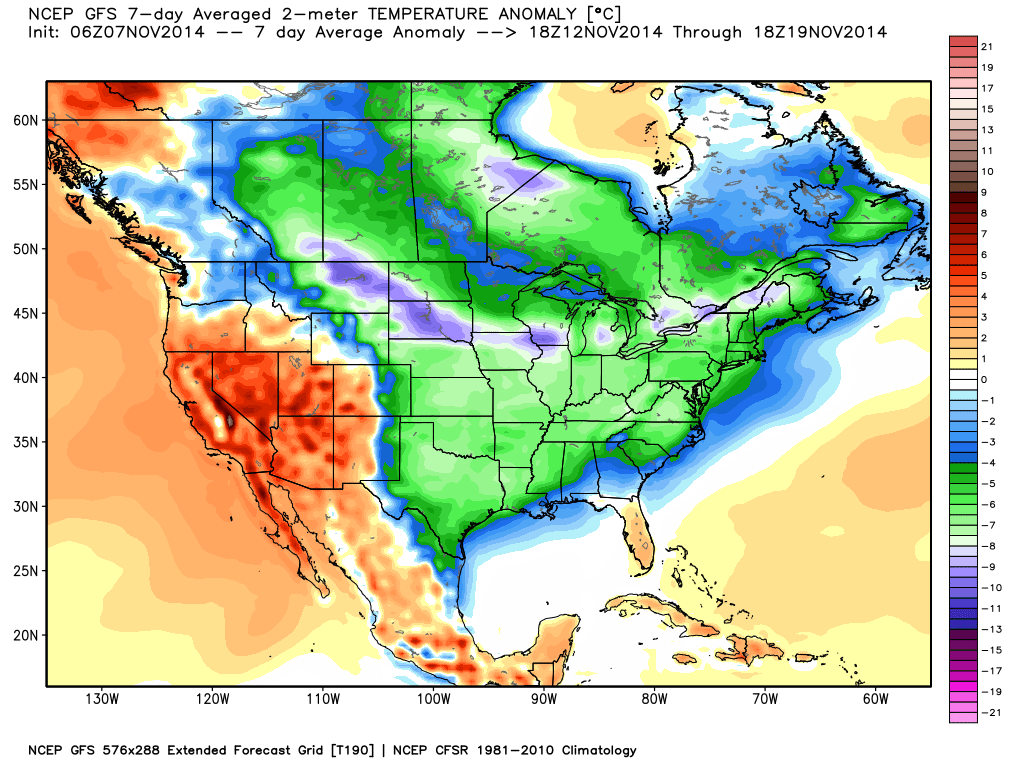
GFS model forecast of 7-day average departures from normal temperature for Nov. 12-19.
That’s a whole week of unusually cold weather, folks. Recent cold events have been very short-lived, sweeping through rapidly, lasting not much more than a day or so. This one is going to stick around.
The Arctic intrusion will be accompanied by a swath of snow across the Northern Plains and Great Lakes on Monday, then snow for Virginia and D.C. by Friday:
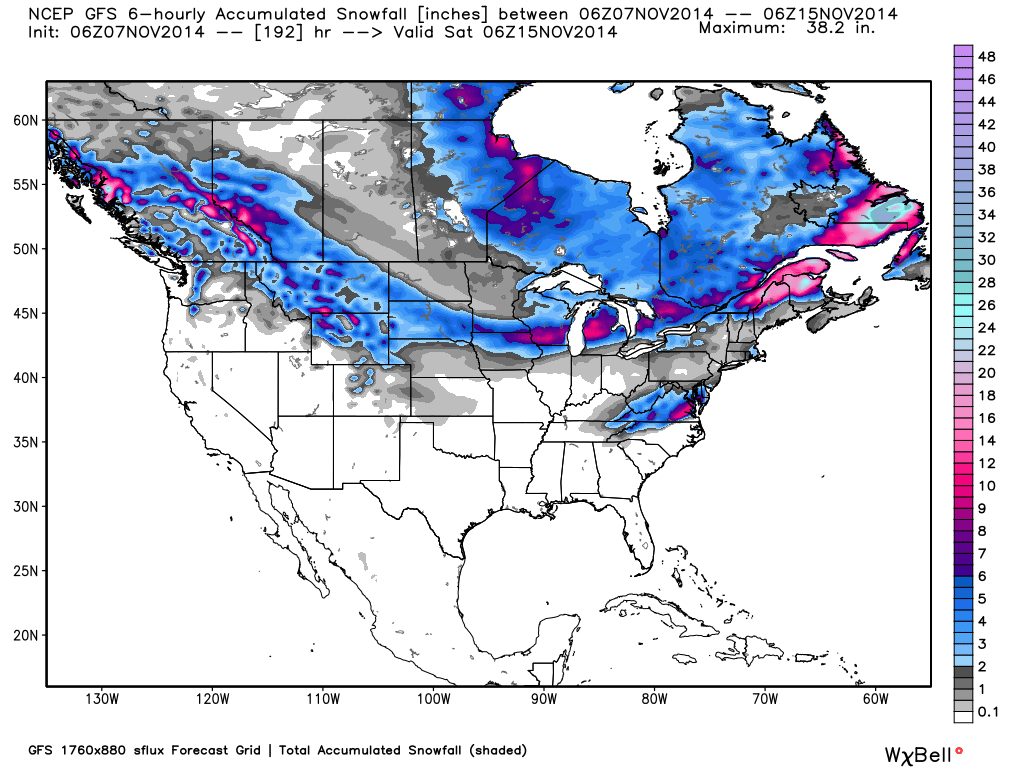
Eight-day total forecast snowfall from Friday Nov. 7 to Saturday Nov. 15.
My friend Joe Bastardi at WeatherBell tells me the ocean temperature and weather patterns right now are reminiscent of the epic winters of 1976-77 and 77-78. I remember those winters. I was taking graduate meteorology courses at UW-Madison at that time, and the meteorology professors were all saying the early cold air outbreaks we experienced would surely end.
Except they didn’t.


