UAH Global Temperature Update for December, 2014: +0.32 deg. C

January 6th, 2015 by Roy W. Spencer, Ph. D.

2014 was Third Warmest Year Since 1979, but Just Barely
(with input from John Christy and Phil Gentry)

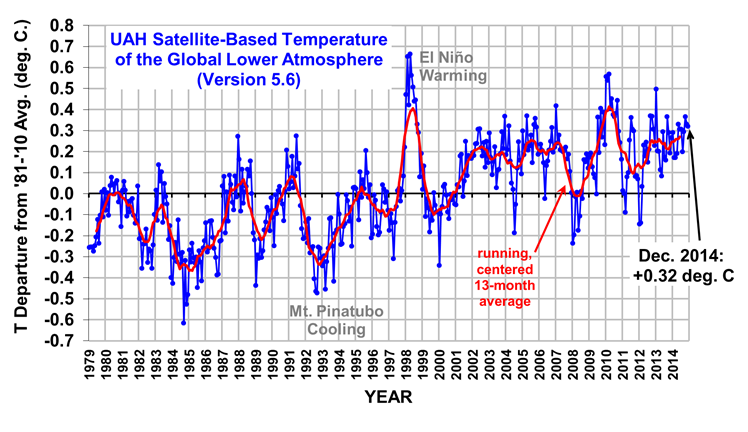
The Version 5.6 global average lower tropospheric temperature (LT) anomaly for December, 2014 is +0.32 deg. C, essentially the same as the November value of +0.33 deg. C (click for full size version):
UAH_LT_1979_thru_December_2014_v5

The global, hemispheric, and tropical LT anomalies from the 30-year (1981-2010) average for the last 12 months are:

YR MON GLOBAL NH SH TROPICS
2014 1 +0.291 +0.387 +0.194 -0.029
2014 2 +0.170 +0.320 +0.020 -0.103
2014 3 +0.170 +0.338 +0.002 -0.001
2014 4 +0.190 +0.358 +0.022 +0.092
2014 5 +0.326 +0.325 +0.328 +0.175
2014 6 +0.305 +0.315 +0.295 +0.510
2014 7 +0.304 +0.289 +0.319 +0.451
2014 8 +0.199 +0.244 +0.153 +0.061
2014 9 +0.294 +0.187 +0.401 +0.181
2014 10 +0.365 +0.333 +0.396 +0.189
2014 11 +0.329 +0.354 +0.303 +0.247
2014 12 +0.320 +0.464 +0.177 +0.298

Notes on data released Jan. 6, 2015:

2014 was the third warmest year in the 36-year global satellite temperature record, but by such a small margin (0.01 C) as to be statistically similar to other recent years, according to Dr. John Christy, a professor of atmospheric science and director of the Earth System Science Center at The University of Alabama in Huntsville. “2014 was warm, but not special. The 0.01 C difference between 2014 and 2005, or the 0.02 difference with 2013 are not statistically different from zero. That might not be a very satisfying conclusion, but it is at least accurate.”

The 2014 average temperature anomaly is also in keeping with temperatures since late 2001, when the global average temperature rose to a level that is generally warmer than the 30-year baseline average. The most recent 13 complete calendar years, from 2002 through 2014, have averaged 0.18 C (about 0.33 degrees Fahrenheit) warmer than the 30-year baseline average, while the global temperature trend during that span was a warming trend at the rate of +0.05 C per decade — which is also statistically insignificant.

Compared to seasonal norms, the coldest annual average temperature on Earth throughout 2014 was just south of Wilmar, Minnesota. The average 2014 temperature there was –1.27 C (about 2.29 degrees F) colder than normal. The ‘warmest’ place throughout 2014 was just south of the North Pole along the International Date Line. Temperatures there averaged 1.65 C (about 2.97 degrees F) warmer than normal for the year.

Annual Global Temperature Anomalies, ranked

1. 1998 0.42
2. 2010 0.40
3. 2014 0.27
4. 2005 0.26
5. 2013 0.24
6. 2002 0.22
7. 2009 0.21
8. 2007 0.20
9. 2003 0.19
10. 2006 0.19
11. 2012 0.17
12. 2011 0.13
13. 2004 0.11
14. 2001 0.11
15. 1991 0.02
16. 1987 0.01
17. 1995 0.01
18. 1988 0.01
19. 1980 -0.01
20. 2008 -0.01
21. 1990 -0.02
22. 1981 -0.05
23. 1997 -0.05
24. 1999 -0.06
25. 1983 -0.06
26. 2000 -0.06
27. 1996 -0.08
28. 1994 -0.11
29. 1979 -0.17
30. 1989 -0.21
31. 1986 -0.24
32. 1993 -0.25
33. 1982 -0.25
34. 1992 -0.29
36. 1985 -0.31
37. 1984 -0.35

With a global average temperature that was 0.32 C (about 0.58 degrees Fahrenheit) warmer than seasonal norms, December 2014 trailed only December 2003, which averaged 0.37 C (about 0.67 degrees Fahrenheit) warmer than seasonal norms, among the warmest Decembers in the satellite temperature record. While December 2014 ranked second warmest for both the globe and the Northern Hemisphere, it was only the sixth warmest December in the tropics despite an El Niño Pacific Ocean warming event that seems to be forming there.

Warmest Decembers (1979-2014)
(Global average, warmer than seasonal norms)

1. 2003 +0.37 C
2. 2014 +0.32 C
3. 1987 +0.27 C
2013 +0.27 C
5. 2009 +0.24 C
6. 2012 +0.23 C
7. 1997 +0.22 C
2006 +0.22 C
9. 1998 +0.19 C
2005 +0.19 C

Compared to seasonal norms, the coldest place in Earth’s atmosphere in December was in northwestern Greenland, where temperatures were as much as 2.70 C (about 4.86 degrees Fahrenheit) colder than seasonal norms. Compared to seasonal norms, the warmest departure from average in December was in central Russia, north of the town of Yeniseysk. Temperatures there were as much as 2.75 C (about 4.86 degrees Fahrenheit) warmer than seasonal norms.

The global image for December should be available in the next day or so here.

Popular monthly data files (these might take a few days to update):

uahncdc_lt_5.6.txt (Lower Troposphere)
uahncdc_mt_5.6.txt (Mid-Troposphere)
uahncdc_ls_5.6.txt (Lower Stratosphere)


62 Responses to “UAH Global Temperature Update for December, 2014: +0.32 deg. C”

Toggle Trackbacks

  1. coldInLA says:

    But, but, but, all the weather persons on southern california television are crowing about 2014 being the hottest year ever. How can they be wrong? Especially as the year ended with all of them wearing Ugg boots in the ‘extreme cold’…

    • It’s California trendsetting. Cold is the new warm.

      • Dr. Mark H. Shapiro says:

        Dr. Spencer,

        When I look at the data in your plot, I notice that most of the points plotted after the El Nino year are above the average, while most of the points plotted before the El Nino year are below the average. That suggests to me that even though the data are quite noisy, there is an unmistakeable trend in the data.

        So, just for grins, I took the table of the annual average deviations that you posted below the graph and fit a straight line to it by linear least squares regression. The result was a positive slope of 0.014 deg C/yr. If the trend were truly linear, that would suggest a long-term temperature increase of about 1.4 deg C/century. That’s about twice the rate of temperature rise shown in the JMA data (http://ds.data.jma.go.jp/tcc/tcc/products/gwp/temp/ann_wld.html)

        Now, of course, deriving a slope from a fairly short data set such as yours is going to have a fairly large uncertainty compared to the longer JMA data set. Granting that, I think it’s reasonable to conclude that the satellite temperature data aren’t all that different from the surface global temperature data. If anything they seem to suggest that the atmosphere is warming somewhat faster than the surface.

        I’d enjoy reading your response. Dr. S.

    • JohnKl says:

      Hmmh! Definitely a balmy December as the period of daytime sunlight shrank right through to the Solstice. Then as the daytime sunlit periods grew longer the temperatures dropped into the New Year! Fascinating weather wouldn’t you say?

      Have a great day!

    • sky says:

      SoCal is one of the most intensely urbanized regions of the world. As long as station data from fast-growing cities are relied upon exclusively for tracking climate, there will be “hottest years ever” reported quite regularly for this region. On the other hand, the unusually persistent highs over the adjoining Great Basin throughout this year did push the annual average to the highest levels in many decades. The Christmas cold snap in SoCal was merely a temporary whim of weather, brought about by a typical winter cold-front passage.

      • Dr. Mark H. Shapiro says:

        I’m a southern California resident. The news reports about 2014 being the warmest on record were not based on local measurements, but on the global data recently reported by JMA.

        • Dr. Mark H. Shapiro says:

          While the urban heat island effect certainly is real, it contributes only insignificantly to global surface temperature averages. Part of the reason is that weather stations that measure official temperatures are sited in locations where the effect is minimized whenever possible, and the data from those that can’t be so sited is filtered out. But even if that were not true the contributions from urban heat islands still would be quite small simply because a very small fraction of the earth’s surface is occupied by these islands.

          Careful studies were carried out in China where urbanization has been very rapid in the past 30 years comparing temperature data from urban and rural areas. The results showed that the magnitude of the temperature anomalies in urban areas were only very slightly larger than those from rural areas – barely noticeable. In other words, the notion that the UHI effect is a major contributor to long-term climate trends is simply a myth.

  2. Aphan says:

    Oh my word Roy! You need to trademark that! I want a t-shirt and a bumper sticker immediately!

  3. basssman says:

    So 2014 is the third warmest ENSO neutral year on record. Take the average of the last 5 of the 5 year periods and this is what you get.

    2014 ave of .27(+.10)
    2009 ave of .17(+.06)
    2004 ave of .11 (+.06)
    1999 ave of .05( +.18)
    1994 ave of -.13

    I don’t think its wise to pay too much attention to short term trends. Either way, the negative PDO has run its course, the rate of warming is picking up again. When was the last time a neutral year was warmest on record for surface temps such as JMA, NOAA, NASA or HADcrut? The influence of the PDO very likely enhanced warming from the 70’s to 2000 and also held back (sequestered heat in the upper 2000m of the ocean) warming since 2000. The are other natural influences of course, but the background rate of GHG warming is now overwhelming them.

    • basssman says:

      Sorry that should read “warmest enso neutral year on record” not third warmest as it is compared to the 2 el nino years 1998 and 2010.

      • lewis says:

        Bassman, I certainly hope you’re right and not Salvatore. I’d much rather deal with warmer than colder. Just think, if it actually got colder, which seems to be the ambition of some people, northern wheat fields and similar farmland would not be able to produce. What then for the millions of people crying about saving the planet from CO2? Can they live on snow and ice?

    • Aaron S says:

      Bassman, you refer to this as el nino neutral but the process for an el nino started and tropical waters moved eastward, which is why 2014 was assigned a high chance for a significant el nino. It didnt go all the way but there was 0.5 C warming in pacific related to the reversal of the currents non-the-less. El nino is more of a continuum and does not fit into 3 boxes of neutral, positive, and negative. So again it is not that simple and el nino did cause warming in 2014.

      • Aaron S says:

        Bassman,
        We are just entering a negative PDO. The statement “the negative PDO has run its course” is just wrong. The cycle is typically 15 to 30 years… so we might have a short term positive phase but the trend should continue much longer for a negative PDO. Just like the previous positive phase persisted from about 1978 to 2005, or during most of the satellite record.

    • sky says:

      Bassman:

      You must be looking at the data chart in Rorshach fashion. The evidence that “GHG warming is now overwhelming” natural variations is wholly underwhelming.

    • Fonzarelli says:

      Bassman, but still, ’14 is no warmer than ’05 and that’s nearly a decade ago… (in a nod to appell here, this is not cherry picking by comparing to ’98 or ’10)

      • Steve+Ta says:

        Fonzy, 14 is warmer than 05 – proving that the pause is over, and by 2100 we’ll be nearly 0.1C HOTTER than today!

    • Mike Maguire says:

      Bassman,

      Recent higher(positive) PDO values are similar to the late 1950’s(start of the 60’s), when in the middle of the previous -PDO regime, there were a few years with the PDO monthly values spiking higher, which was followed by the PDO settling back lower into negative territory that lasted thru the 60’s thru much of the 1970’s.

      http://jisao.washington.edu/pdo/PDO.latest

      http://jisao.washington.edu/pdo/

      Is that happening again now or does last years +PDO in every month mean the -PDO regime has prematurely ended?

      I’ll guess that the El Nino and +PDO last year went hand and hand and a departing El Nino, will result in the PDO dropping.

      We’ll just have to wait to see.

      That period in the late 1950’s also featured ENSO values that were higher, along with the temporary +PDO shown earlier:
      http://www.esrl.noaa.gov/psd/enso/mei/

      BTW,
      You and others may not think of 2014 as an El Nino year as Pacific Ocean water temps were not warm enough in the right place(s) to use the term “El Nino” but plenty warm enough to effect global temps and weather similar to an El Nino, starting in the Spring by my assessment.

  4. As I have maintained and will continue to maintain unless PROVEN wrong the climate system has a tremendous amount of noise in it, it is non linear and subject to thresholds. These factors make it next to impossible to get a strong correlation with factors that influence the climate despite the fact that they do influence the climate.

    This is why thus far not one climate forecast for future conditions has been correct on a consistent basis. I take that back not even one seasonal forecast in advance for climate conditions has been correct on a consistent basis much less the climate.

    What I have come across in this field are people that try to justify what they say and using any means to show they are right while everyone else is wrong. The truth is they are also wrong and have yet to show otherwise. It is getting old and most of the material is the same arguments with just a different spin.

    My argument is if solar parameters reach extreme enough values and stay at those values for a sufficient amount of time they will over come the noise in the climate system and exert an influence on the climate in general terms.

    I am also of the opinion that given solar changes will never result in the same climatic out come due to the beginning initial state of the earth in regards to present climate, land /ocean arrangements ,random terrestrial or extra terrestrial events and so on. The best that can be done is to forecast a general climatic trend.

    This is why when I hear the climate will do this or that because of this or that to a point of exactness I just shake my head. Another annoying point is so many try to relate the climate to one particular item which will rule the vast climatic system which is ridiculous with the exception of the sun. Which we know that if it is variable enough it will exert an influence on the climate, The argument here however is, is it variable enough.

    • David Appell says:

      “salvatore del prete says: (July 13, 2013) “”I think the start of the temperature decline will commence within six months of the end of the solar cycle maximum and should last for at least 30+ years.””
      http://www.drroyspencer.com/2013/07/uah-v5-6-global-temperature-update-for-june-2013-0-30-deg-c/#comment-84963

      For solar cycle 24, the sunspot number peaked in Feb14. TSI peaked a month or two after (LASP is missing some data for Aug13-Feb13).

      But the UAH LT temperature hasn’t started to decline — just the opposite.

      • Fonzarelli says:

        David, i think i’m with you on this one. The current solar cycle looks very similar to the one back in the 20’s and it was not enough to stop the rapid warming a century ago…

      • Aaron S says:

        Plus there are so many leads and lags in the system. I calculated a 7 yr lag between solar changes and tropical pacific temperature (max correlation occurred between ssn and enso running averages at a 7yr lag). It will take a decade until we can say what if any role cosmic rays have in global temperatures imho.

        however the evidence is getting stronger and stronger that there is more to the sun than tsi. Take an hour watch these videos. The data is real but mostly ignored by the ipcc.

        http://cdiac.ornl.gov/trends/co2/graphics/SIOMLOINSITUTHRU2008.JPG

         http://cdiac.ornl.gov/trends/co2/ice_core_co2.html

  5. http://www.bing.com/search?q=indroduction+.Piocene+climate+processes+and+problems&src=IE-TopResult&FORM=IETR02&conversationid=

    Until the past known climate changes can be explained which they can’t no model is going to have any clue on the future climate.
    The Pliocene warm period 3 to 4 million years ago is such a great example of our lack of knowledge when it comes to the climate. Why was it so much warmer then (some 3.0C warmer) in contrast to today when CO2 concentrations were only slightly higher then today at around 425ppm? What were the reasons for the climate to go from the warm Pliocene to the cold Pleistocene?

    Until climate models can simulate this ,they have no business in being used to predict future climatic conditions going forward based on CO2 increases.

    Anthony a possible topic for future discussion could be why did the climate change from the warm Pliocene to the glaciated Pleistocene. Reason being how can a future forecast be made when even in hindsight no explanations or model simulations can be produced to explain why the climate did what it did in any comprehensive adequate fashion.

    • michael hart says:

      Maybe the closing of the isthmus of Panama? I would have thought that could be quite an exciting model ‘experiment’: Poke a large hole through central America so that the Atlantic/Pacific waters could mix more freely. Of course there’s always the risk that it might contradict the accepted wisdom and doom a researcher’s career.

      nb Perhaps you meant “Roy” or “Dr Spencer”, not “Anthony”?

    • Aaron S says:

      If you google “pliocene paradox” then you will get connected to literature about this subject by Federov. One possibility was that ENSO was stuck into a permanent or continuous El Nino phase causing warmer temperatures. The idea was popular 5yrs ago bc there was evidence that the east to west pacific ocean temp gradient was less (Ravello i believe). I actually dont think the hypothesis stuck bc subsequent people showed evidence for an in tact el nino during the Pliocene.

  6. The above post I just posted on WUWT website brings home my points.

    To know the future one has to be able to explain the past.

  7. ren says:

    Thank you, Dr. Spencer. Respect for the realism.

  8. David Appell says:

    What are the error bars on the annual average (say, 2-sigma)?

  9. Ansgar John says:

    The “since 1979” and “hottest year ever” got me thinking. Hottest “ever” is just ridiculously wrong. The earth has had periods that were MUCH warmer or not?

    http://en.m.wikipedia.org/wiki/Greenhouse_and_icehouse_Earth

    • lewis says:

      Dear Mr. A. John,

      We’ll have no historic comparisons here. You should know by following the politically correct IPCC and sycophants, that the only climate that counts is what they tell you. History, you see, started in 1979. (Which makes me, and others, I’m sure, prehistoric :))

    • David A says:

      Most such claims I read say “warmest in the record”; everyone knows it’s not the warmest the Earth’s surface has ever been.

  10. Thanks, Dr. Spencer.
    I have updated your graphic in my pages.

  11. http://www.meltdata.com/articles/pliocene-epoch-climate.html

    If one would read this one would understand how asinine the climate models/AGW theory is. The climate models can’t even predict how /why the climate changes in the future even if they know how the climate changed into the future. Example the Pliocene to Pleistocene climate change.

    CO2 versus climate change is the WRONG way to go when trying to piece the climate puzzle. It is an exercise in futility and my approach is much better. Read below.

    The four factors as to why the climate changes are

    Initial state of the earth- In regards to how close the climate is to glacial/inter-glacial thresholds(THE ICE DYNAMIC), land /ocean arrangements, land elevation levels ,random terrestrial events such as a mega volcanic eruption or random extra terrestrial events which played a role at times although minor in the scheme of things.

    Earth Magnetic Field Strength- which will moderate or compound solar effects in regards to galactic cosmic ray /other charged particles being able to penetrate the earth’s atmosphere and in turn influence cloud formation/geological activity. Also at times of magnetic excursions galactic cosmic rays may be concentrated in lower latitudes where moisture is more abundant causing a greater impact in cloud formation.

    Milankovitch Cycles – Which will favor a colder climate when obliquity is at a minimum, earth’s orbit is most elliptical and aphelion in the orbit of the earth occurring during the N.H. summer.

    Solar Variability and Secondary Effects- Although solar variability(solar irradiance) may be on the order of .2 to .3 percent (from Grand Maximum to Grand Minimum conditions) it is the secondary effects associated with this solar variability which could have an impact on the climate ranging from changes in atmospheric circulation patterns, to an increase in volcanic activity , to more clouds, ocean heat content lowering etc.

    Solar Parameters and possible effects.

    Solar Irradiance Changes .1 to .3% lower- Effects ocean heat content /sea surface temperature distribution and actual sea surface temperatures which effects Enso /Ocean currents. An example being the Thermohaline circulation or Atlantic Meridional Overturning Circulation, the AMOC .

    Solar Wind Changes to lower then 350 km/sec- Will effect concentrations of galactic cosmic rays entering the atmosphere and increase low cloud amounts. Cosmic Ray Counts north of 6500 units per minute should achieve this. Also at times of low solar wind speed the AP index will be very low which shows a correlation to volcanic activity according to data in that during prolonged minimum solar conditions going back to 1600 ad-present, 87% of all major volcanic eruptions took place at such times.

    EUV Light Changes– very low levels(100 units or less) will effect ozone distributions in the atmosphere in both a vertical/horizontal sense which will in turn impact the atmospheric circulation pattern by warming the polar regions more then the mid-latitudes causing a more meridional atmospheric circulation pattern This type of atmospheric circulation pattern at the unset should result in more clouds, precipitation ,more cloud cover causing an increase in earth albedo hence cooler temperatures.

    In addition EUV light in the near visible range and visible light will penetrate the ocean surface waters to significant depths(up to 50m) there by effecting ocean heat content /sea surface temperatures.

    One must remember that factor one, Initial State Of The Earth, factor two, Earth Magnetic Field Strength and factor three, Milankovich Cycles will cause factor four Solar Variability/Secondary Effects to have different climatic outcomes even if the given solar changes are the same.

    In addition at times of limited solar variability although it is still impacting the climate noise in the climatic system can obscure the solar climatic signal.

    In summary I will take my theory over AGW theory any day of the week, it is a 1000x better as an explanation as to why/how the climate changes and why it has in the past.

    • David A says:

      Salvatore Del Prete says:
      “If one would read this one would understand how asinine the climate models/AGW theory is. The climate models can’t even predict how /why the climate changes in the future even if they know how the climate changed into the future. Example the Pliocene to Pleistocene climate change.”

      The dynammics of transitions that may be nonlinear does apply to today:

      “Plio–Pleistocene climate evolution: trends and transitions in glacial cycle dynamics,” Lorraine E. Lisiecki, Maureen E. Raymo,
      Quaternary Science Reviews 26 (2007) 56–69
      http://lorraine-lisiecki.com/LisieckiRaymo2007.pdf

      or rather, everyone admits the possibility of abrupt change that today’s climate models cannot handle. But such nonlinear changes seem rare, and until one happens the GHG model of warming has some skill.

  12. David if you would look at the solar data you would see that it is still at/near maximum levels for this cycle so the solar parameters have yet to materialize that I say will impact the climate to some degree.

    And yes David I still think within six months of the end of this solar cycle maximum (another words let me be specific) within six months of the solar flux returning to sub90 levels (currently running around 150 by the way)the global temperature trend will be in a down trend.

  13. ossqss says:

    .05C per decade……. Then it is going to take longer than I thought to get my farmland in South Greenland back into production like it was 1,100 years ago. Dangit! /sarc

    Thanks for the info Doc. Good luck with the modifications!

  14. ren says:

    Wintry weather strikes Middle East, bringing cold, sandstorm.
    http://jordantimes.com/wintry-weather-strikes-middle-east-bringing-cold-sandstorm

  15. Exponential
    trends in obliquity and precession sensitivity in
    conjunction with a linear trend in mean d18O suggest that
    climate sensitivity to a range of forcings may be
    exponentially dependent on mean climate state.
    Quantitative descriptions of glacial cycle

    The above from the great stud below which is on the correct path . I especially agree with the statement I printed from this study in the above, which is EXPONENTIALLY DEPENDENT ON THE MEAN CLIMATE STATE.

    lorraine-lisiecki.com/LisieckiRaymo2007.pdfo2007.pdf

  16. Thanks for that study I have printed it out and will look into it over the coming weeks.

  17. Doug Cotton    says:


    FUTURE CLIMATE

    Those who are interested in learning why long-term (~500 year) cooling will start after the year 2059 can see my new website whyitsnotco2.com.


  18. david dohbro says:

    thanks Roy,

    and the beat goes on, month by month, with no accelerate GW, and in fact no GW at all over several different time frames. The linear trends for the following time periods are

    past 5 yrs: -0.011C/yr
    past 10yrs: 0.006C/yr
    past 15yrs: 0.012C/yr
    since 1998 el nino peak: 0.009C/yr
    past 20yrs: 0.012C/yr
    all years: 0.014C/yr

    Hence, over the past 5 yrs GTA are decreasing; over the past 10yrs GTA have neither increased nor decreased; over the past 15-20yrs GTA have increased.

    It will be interesting to see once this weak el nino has come and gone, to be followed by a la nina, how GTA will hold up.

  19. There is something else going on besides Milankovitch Cycles which I feel are not a necessary player in changing the climate when the initial state of the climate is close to glacial/inter-glacial thresholds, such as it was 20000-10000 years ago.

    Solar variability alone may be enough in this case.l threshold not at other times OWEVER

    Implications of multiple Younger Dryas and Inter-Allerød climatic fluctuations

    The multiple nature of YD moraines in widely separated areas of the world and in both hemispheres indicates that the YD consisted of more than a single climatic event and these occurred virtually simultaneously worldwide. Ice sheets and alpine glaciers were sensitive to the multiple YD phases.

    What can we learn from all of this?

    (1) The ice core isotope data were hugely significant because they showed that the Younger Dryas, as well as the other late Pleistocene warming and cooling events, could not possibly be caused by human emissions of CO2 because they occurred thousands of years before such emissions had any effect on atmospheric CO2.

    (2) The magnitude and intensity of multiple climatic fluctuations has been up to 20 times larger than warming during the past century.

    (3) Single events, i.e., volcanic activity or cosmic impacts, cannot have caused the abrupt Dansgaard/Oerscher warming and cooling events because of the multiplicity of warm/cold events over periods of thousands of years.

    (4) The absence of a time lag between the N and S Hemisphere glacial fluctuations precludes an oceanic cause and is not consistent with the North Atlantic Deep Ocean Water hypothesis for the cause of the Younger Dryas.

    (5) The abruptness of the climate changes and their multiplicity could not have been caused by slow, Croll-Milankovitch orbital forcing, which occurs over many tens of thousands of years. Since fluctuations to and from full glacial climates occurred over short periods of time, clearly a cause other than the Croll-Milankovitch theory is capable of causing the Ice Ages .

  20. From reading an article titled Plio- Pleistocene climate evolution: trends and transitions in glacial cycle dynamics, I think the following is the problem facing climate science and why theories all seem to falter.

    THE PROBLEM

    Climate sensitivity to various forcings is exponentially dependent on the mean state of the climate and earth dynamics ( state of the earth) which results in so many different climate outcomes and correlations not holding up over periods of time.

  21. Dave I have not made excuses I have stuck to my original prediction. What has gone wrong for lack of a better word in solar activity is staying at near maximum conditions much longer the expected but my prediction is about the climate /solar relationship (which I think always is present but lost to noise more often then not unless extreme solar conditions occur for a long duration of time.

    I listed my guess of what those extreme values of solar conditions are needed many times over this web-site that should have an impact upon the climate if duration holds up.

  22. Arctic stratospheric ozone depletion is closely linked to the occurrence of low stratospheric temperatures.

    I think lower stratospheric temperature changes can be linked to volcanic activity and solar activity/ozone link.

  23. “The law that entropy always increases holds, I think, the supreme position among the laws of Nature. … if your theory is found to be against the second law of thermodynamics I can give you no hope; there is nothing for it but to collapse in deepest humiliation.”
    —Sir Arthur Stanley Eddington, The Nature of the Physical World (1927)

    Until readers recognize that all forms of energy (including gravitational potential energy) play a role in entropy and thus in determining the state of thermodynamic equilibrium (which the Second Law tells us will evolve) then you are barking up the wrong tree with radiative heat transfer theory as your only concept in your beliefs about temperatures on all planets and satellite moons.

  24. Thank you a lot for sharing this with all of us you actually know what you are talking about!
    Bookmarked. Please additionally discuss with my website =).
    We may have a link change contract between us

Leave a Reply