As part of a DOE grant we are testing climate models against satellite observations, particularly regarding the missing “hotspot” in the tropics, that is, the expected region of enhanced warming in the tropical mid- and upper troposphere as the surface warms. Since 1979 (the satellite period of record), it appears that warming in those upper layers has been almost non-existent, despite some surface warming and increases in low-level humidity.
For years I have claimed that the missing hotspot could be evidence of neutral or even negative water vapor feedback, which would also help explain weaker than expected surface warming.
Climate modelers are all but certain that water vapor feedback is positive. I have discussed elsewhere (e.g. here) how that might not be the case, even as lower atmospheric water vapor increases, and it’s related to how precipitation efficiency might change with warming leading to drying of the troposphere above the boundary layer. This is also part of Lindzen’s “Iris Effect”. While water vapor at the lowest altitudes over the ocean is strongly tied to surface temperature, free-tropospheric humidity is controlled by precipitation microphysics, and we have little information on how that changes with warming.
So, I’ll get right to the subject of this post. We have analyzed 11 years of water vapor channel (183.3 GHz) data from the AMSU-B instrument on the NOAA-18 satellite, and compared it to the mid-tropospheric temperature data from AMSU channel 5 (the “MT” channel). Specifically, we computed monthly gridpoint anomalies in all channels over the 11 year period, and regressed the 183.3 GHz brightness temperature (Tb) anomalies against the channel 5 Tb anomalies. This should give information on how much the free troposphere moistens or dries when it changes temperature.
The following image shows the gridpoint regression coefficients for the monthly anomalies during June 2005 through May 2015:
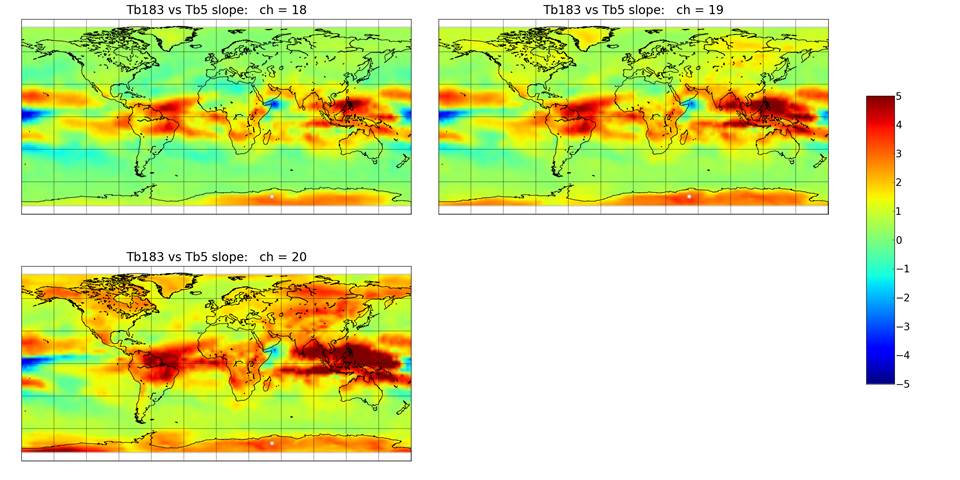
Fig. 1. Gridpoint regression coefficients between the NOAA-18 AMSU-b 183.3 GHz channels Tb and AMSU-A channel 5 Tb during June 2005 through May 2015. Ch. 18 is 183.3+/-1 GHz, generally peaking in the upper troposphere; ch. 19 is 183.3+/-3 GHz peaking in the upper-mid troposphere, and ch. 20 is 183.3 +/-7 GHz peaking in the lower mid-troposphere.
Yellow to red colors are where absolute humidity decreases with warming; green is humidity increasing to roughly maintain constant RH, and blue is where humidity increases even more than constant RH. The signal of El Nino/La Nina is clear over the Pacific Ocean, where the features represent a regional rearrangement of deep convection (upward motion) and subsidence (sinking motion) patterns.
But what really matters for water vapor feedback is the net effect of these patterns…how they average together. The following graph (left panel) shows latitude band averages of the gridpoint regression coefficients in the above imagery, while the right panel shows the same computations from 15 years (2006-2020) from the GFDL ESM2M climate model:
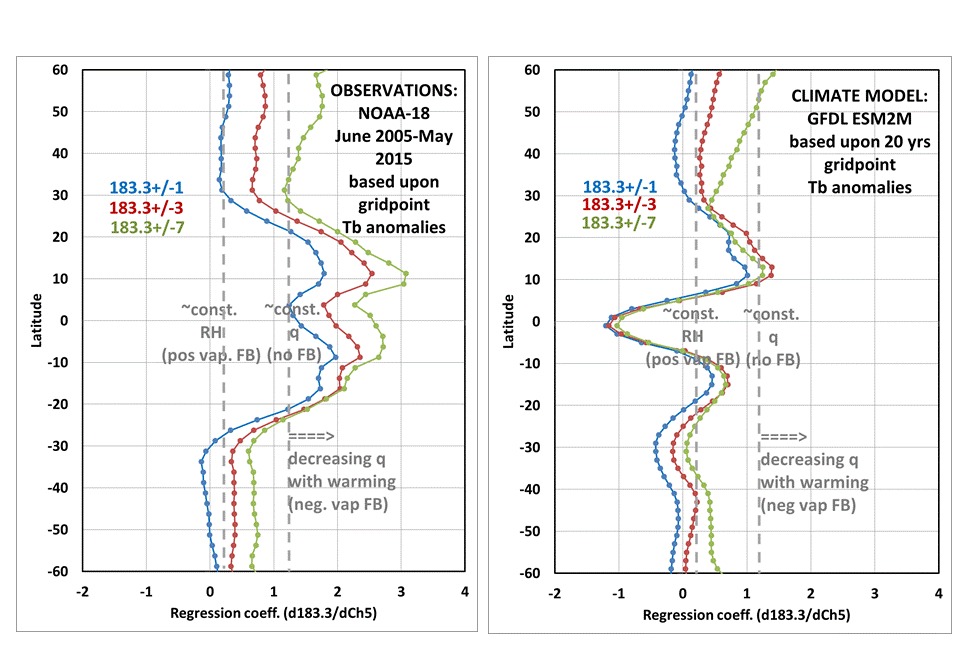
Fig. 2. Zonal averages of the patterns seen in Fig. 1 (left panel), and similar computations made from the GFDL ESM2M climate model (right panel).
The vertical dashed lines in Fig. 2 are based upon computations made from the AFGL tropical and mid-latitude radiosonde profile data; values of about 0.2 correspond to constant relative humidity (RH) with warming, while values of ~1.2 correspond to constant specific humidity, q (no water vapor increase). Values over 1.2 would be water vapor (q) actually decreasing with warming, and potentially indicative of negative water vapor feedback.
Note that in the tropical observations portion of the left panel in Fig. 2, all three 183.3 GHz channels (corresponding to different free-tropospheric layers) suggest decreasing water vapor with warming. (I don’t know how cirrus clouds might also be affected, but Lindzen has argued as part of his Iris Effect hypothesis that vapor and cirrus cloud cover should change together, and the 183.3 GHz data are affected somewhat by thick cirrus).
The mid-latitudes seem to be mostly in the realm of positive water vapor feedback, although maybe not constant RH (which is what the models tend to do). It would take more work to determine just what these extratropical humidity channel changes really mean in terms of broadband infrared radiative feedback.
Comparison of these same metrics to CMIP5 climate model data has been slow, since the necessary humidity and temperature profile data have been unavailable from the CMIP5 archive for months. Nevertheless, we were able to download data for two GFDL models (from the GFDL website), and I’m showing one of those in the right panel above, where we used a radiative transfer model to compute the same satellite microwave channels from the model temperature and humidity profiles. Note that in the tropics (say, 25N to 25S) the model tends to keep approximately constant RH when all those latitude bands are taken together.
This is pretty typical behavior for climate models, which are tuned to act this way. The models don’t actually contain the necessary precipitation microphysics, something even their convective parameterizations can’t fix because we really don’t know how detrainment from convection changes with warming anyway. In other words, you can’t parameterize something that you don’t even understand and can’t measure.
One curious clue from the above plots of models versus observations is how the three 183.3 GHz channel curves separate in the tropical observations, but not in the model. This would occur if convection detrains at higher altitudes with warming, with the mid-tropospheric humidity getting depressed even more as that very dry air descends from aloft, while mid-tropospheric detrainment and mixing from convection into the surrounding environmental air decreases.
Presumably, the primary source of variability in the observations is El Nino/La Nina (ENSO), which many climate models do not mimic very well. But the GFDL model we chose to compare to in Fig. 2 also produces very strong ENSO activity, so we think this is a pretty valid comparison between a model and observations.
This is all very preliminary, and we await the CMIP5 archive coming back online again late this month so that we can analyze more models. But if this discrepancy between models and observations holds across most or all models, we might have some important insight into how the models might not be accounting for increasing precipitation efficiency during warming, and in turn why the hotspot hasn’t developed… and why global warming in general is weaker than programmed into the climate models.
The missing hot spot really does AGW theory in, because that is basic to the whole theory.
At this late date to still have no definitive sign says to me it is never going to occur.
Many facts should have finished the CAGW theory years ago, but strong faith in a factually conflicted theory by many can overcome reason if allowed to.
Have a great day!
“…should have finished…”
I am reminded of a “film noir,” of many years ago.
A crook has been shot and another gang member has kidnapped a doctor and forced him to extract the bullet and bandage him. The doctor says to the wounded man, “You must stay still!” The man snarls, heaves himself from the bed, and starts to the door. The other gang member says to the doctor, “What now?” The doctor sneers, and says, “He’s dead. He just hasn’t noticed it yet!”
Roy, you say
“While water vapor at the lowest altitudes over the ocean is strongly tied to surface temperature, free-tropospheric humidity is controlled by precipitation microphysics, and we little information on how that changes with warming.”
###
Could you explicate a little bit on what the “precipitation microphysics” are? Just list a few, that would be enough.
In rainfall systems, the amount of condensed cloud water that falls out as rain involves processes occurring on a tiny scale…the scale of cloud droplets and ice crystals. This is called “precipitation microphysics”. Entire textbooks have been written addressing the forces involved…growth of ice crystals from vapor, the combining of cloud droplets to form rain drops, etc. The processes are complex and highly variable. But the humidity of the free-troposphere, and therefore most of the Earth’s greenhouse effect, is governed by these processes since the free-tropospheric air (even in clear regions and high pressure zones) originated in those precipitation systems.
Yes, thanks, Roy- I now recall some of my readings from years back. An area of study, exceedingly complex, originating many years ago and apparently not very well resolved even today.
So the answer is in the removal of the atmospheric humidity by the processes of condensation and precipitation, which processes have been acted upon in an indeterminate way, thus the evolution of the humidities of the mid to upper troposphere.
Exactly.
Hi Roy,
“the free-tropospheric air (even in clear regions and high pressure zones) originated in those precipitation systems.” Truer words were never written.
However, “The processes are complex and highly variable.” is of questionable truth. Einstein is said to have stated: “If you can’t explain it simply, you don’t understand it well enough.” You like the word ‘complex’ because it implies the systems being studied can not be understood by anyone but a superior mind, or even, cannot be understood even by a superior mind. The first rule of reasoning purposed by Newton was: “We are to admit no more causes of natural things than such as are both true and sufficient to explain their appearances.” and added this commentary: “To this purpose the philosophers say that Nature does nothing in vain, and more is in vain when less will serve; for Nature is pleased with simplicity, and affects not the pomp of superfluous causes.”
Have a good day, Jerry
OK, so should I say “the processes are actually simple, but we don’t understand them well enough to put them in a climate model.”? Hmmm.
Hi Roy,
“OK, so should I say “the processes are actually simple, but we don’t understand them well enough to put them in a climate model.”? Hmmm.”
No, the mistake is not understanding that some simply understood natural phenomenon, like tides, cannot modeled. Yet, Newton considered his theory of universal gravitation was validated by them even though he had no idea what the cause of gravity might be.
A commonly observed fact is that a climate of a given location depends upon local factors just as a tide at a given locations depends upon local factors.
Have a good day, Jerry
I would say it this way, the Big Bang theory sounds pretty simple, but in it’s details it is not.
But the Greenhouse Effect Theory which does not function as a greenhouse, and some trace gases cause the world to be 33 C warmer, begins off in hopelessly stupid manner. And does not get any better.
jerry l krause wrote: “If you can’t explain it simply, you don’t understand it well enough.”
I doubt that Einstein was saying that we ought to be able to provide simple explanations of the details of complex processes. I suspect he was more likely talking about fundamental ideas.
Of course, from what I have heard about Einstein, he would not be impressed by arguments based on appeal to authority, even his.
Hi Mike,
“I suspect he was more likely talking about fundamental ideas.”
Exactly! Should we not get a firm handle on the fundamental ideas before progressing to details? Again, we can often grasp why a tide at one location is quite different from that of another nearby location, but the fact is we (people who predict future tides for tide tables), as I understand it, predict tides at a specific location on the basis of the historical data of tides at that location.
When we know that we cannot come close to such predicable weather at a specific location on the basis of historical data at that location, why does anyone pretend that a ‘world’ climate can be modeled?
Have a good day, Jerry
–When we know that we cannot come close to such predicable weather at a specific location on the basis of historical data at that location, why does anyone pretend that a ‘world’ climate can be modeled?
Have a good day, Jerry–
Probably the same reason psychics try to predict the future-
make money from idiots who imagine they can.
That sums up Al Gore, who was very successful at finding enough idiots.
In general I am interested in global climate rather then local weather because I am interested in space exploration- and global climate is related to terraforming and habitable zones in solar system [and there current “climate”].
I think idea of making Venus and Mars habitable planets is an interesting puzzle. One could have human civilization on Venus and Mars without terraforming them, but it’s sort of like space elevators, harvesting solar energy from Space, and/or traveling to a different star- economically impossible at the moment though could be practical in the future.
As for terraforming Mars, it seems the first practical effort would related to reducing dust levels- do things to prevent the global dust storms.
And as far as I know, most ideas of terraforming mars to make it warmer- wouldn’t work. Economically there are impossible, and impractical to think about, but even if this wasn’t the case, if it could be done they wouldn’t do what people expect they would do- because the greenhouse effect theory is wrong.
Einstein’s thought experiments offered reasonably simple explanations for time and gravity, but when it came to describe the processes mathematically, somehow all that simplicity seemed to disappear.
One thing I’ve learned over many decades is that you inevitably make a fool of yourself if you attempt to apply broad philosophical principles to scientific practicalities.
Do precipitation microphysics potentially have a relationship to Svensmark’s research on cosmic rays and changes to the atmosphere with cosmic ray flux?
Decreasing relative humidity sounds to me like the cloud albedo feedback is positive.
…except that boundary layer humidity has been increasing, and low clouds are the biggest potential source of cloud feedback.
Come on. You sound like the pulsar core man.
What determined your choice of 2005 as a cutoff date?
2005 is the beginning of the NOAA-18 satellite data, which has the longest period of AMSU-B data without obvious spurious trend issues in any of the channels, plus it covers the 2009-2010 El Nino event.
“Climate modelers are all but certain that water vapor feedback is positive.”
______
I would go a step further and say they ARE certain. That is their “belief system”, and you could not get them to change, even using “water boarding” torture!
I would say they are very certain of something which is impossible.
Or is plausible if you ignore time.
Or if you have warmer oceans one can get an increase in water vapor, but it’s not causal, rather it’s the effect of the warmer oceans.
Exactly. It’s as if they’ve never heard of the “water cycle”.
A minor typo … ‘we little information” should read “we have little information”.
fixed, thanks.
It seems to me that the effect of cloud formation is not just on albedo, but the condensation of vapor into droplets should also decrease the surrounding vapor pressure of water and thus its IR absorption.
Very exciting work. I’ve been reading dozens of climate papers lately trying to understand certain aspects of models. I’ve also read some of the cloud parametrization work.
It seems to me that this work would allow for re-parametrization of climate cloud models. They break down to something very simple in the final equations, would you agree that it might be doable?
yes, they can always parameterize the net effect of some complex process…if they know what the net effect is. Oops…I used the C-word again….
Roy,
OT, but relevant to this page (and seemingly every page), you have a bad meta tag:
meta http-equiv=”Content-Type” content=”text/html; charset=Roy Spencer, PhD.”
Unless you’ve branched out and created an eponymous charset. 🙂
This causes some font rendering problems on some browsers.
I have found the definitive water feed back-
https://www.google.co.uk/search?q=esher+cascade&source=lnms&tbm=isch&sa=X&ved=0CAcQ_AUoAWoVChMIzY3MmvuwxwIVyD7bCh1orwBo&biw=1015&bih=674#imgrc=vHNRqYQQRhcu3M%3A
Simple. Complex. I say “COOL”.
We see a lot of this where I live: https://en.wikipedia.org/wiki/Virga
Roy,
It is really nice to see tests of model fundamentals against observational data.
A question: Isn’t the “hot spot” due to the negative lapse rate feedback, since that it what causes T to increase by different amounts at different altitudes? Without the lapse rate feedback, wouldn’t the water vapor result in an altitude independent T increase?
The models give water vapor feedback results over a fairly wide range and lapse rate feedback results covering about a factor of four (e.g., AR5 Fig. 9.43 and Table 9.5). But the sum is quite consistent between models since models with a large water vapor feedback have a very negative lapse rate feedback and ones with small water vapor feedback have near zero lapse rate feedback. So it sounds like the results are saying that the models closest to the truth are the ones with both feedbacks small.
You wrote: “It would take more work to determine just what these extratropical humidity channel changes really mean in terms of broadband infrared radiative feedback.”
That would be a fascinating result to see. But in the end, the real test is the combined lapse rate and water vapor feedback.
I believe the proper chain of causation is:
1. surface warming
2. increased convection detrains more water vapor into the free troposphere
3. more water vapor increases the greenhouse effect, warming the entire troposphere, and keeping it from cooling as efficiently
4. the higher temperatures (hotspot) causes increase IR loss to space, but not enough to counteract the increase greenhouse effect
Positive water vapor feedback is, on average, 2x the negative lapse rate feedback in the CMIP5 models. They are pretty strongly negatively correlated in the models…but water vapor FB is only reduced 50% by the lapse rate FB. Modelers do indeed like to talk about their net effect.
Someone was asking why the equatorial El Nino region did not reflect a maxima in the MSU data to match the maxima in the SSTs.
After reflecting for a while, it occurs to me that the ITCZ is still far north, currently. So even though the ENSO waters are anomalously warm, the lack of deep convection means there is no way to transmit that anomalous warmth to the LT or MT levels.
Convection over the southern portion of the El Nino signature waters maximizes in April, so I would expect the MSU signals to maximize then as well.
http://judithcurry.com/2015/08/14/week-in-review-science-edition-17/#comment-724877
— Roy W. Spencer says:
August 17, 2015 at 5:58 PM
I believe the proper chain of causation is:
1. surface warming
2. increased convection detrains more water vapor into the free troposphere
3. more water vapor increases the greenhouse effect, warming the entire troposphere, and keeping it from cooling as efficiently
4. the higher temperatures (hotspot) causes increase IR loss to space, but not enough to counteract the increase greenhouse effect—
Why does higher temperature cause increase IR?
Does it have to do with air density. Or if had 2 atm rather
than 1 atmosphere, would one need higher temperatures?
Everything emits IR, and as temperature rises the intensity of IR emission rises. It does depend on air density since the more air present, the greater the IR absorption/emission.
I tend to think 2 atm earth would be cooler, but that is mot really related to what asking about, instead it about this hot spot in tropics. Or it seems one could have 2 atm world which cooler and have it have this hot spot warmer. Or in comparison to rest of atmosphere the hot spot would be in comparison warmer.
In general I would say everything emits if it absorbs, and gases don’t adsorb much radiant energy. Or an atmosphere holds a lot energy in terms of kinetic energy, but in a given day or hour the atmosphere does not absorb and radiate much much radiant energy. Obviously all radiant energy of sun passes thru it and one say could all the radiant energy is altered in some way.
Or why 2 atm would cooler than 1 atm atmosphere is less sunlight would reach the surface where it can be absorbed.
Now if one has twice the atm, roughly one will have twice the kinetic energy of the atmosphere- this would even be true were the average temperature was 50 K cooler. But I would think that twice atmosphere would be in range of 10 K cooler- though one might not have a polar ice caps [maybe] and therefore one might think that is a warmer world- or it’s got more GHE.
And the 2 atmosphere would reflect more sunlight. Or instead of about 400 of the 1360 watts, it could be say 500 watt- so about .37 rather than about .3.
So, if atmosphere reflected more sunlight, most people could assume Earth would be cooler. And if cooler one could think that less radiant energy is emitted by the atmosphere despite the atmosphere having twice the total kinetic energy.
The main reason I think a 2 atm world would be cooler, is because I think the tropics would be cooler. But do have significant amount of uncertainty about this assumption.
And this hot spot a factor, though I don’t think it’s a big factor.
Now another factor, is I would say the least amount of sunlight is reflected by the atmosphere in the tropics- that factor makes doubling the atm less significant in the tropics. Or conversely most of sunlight reflected by the atmosphere occurs outside the tropics.
There is no doubt that harvest solar energy would be far worse in a 2 atm world, as it would be far better in 1/2 atm world.
So in terms of reflected light and the tropics, clouds have larger effect, or if somehow a 2 atm could cause less clouds in the tropic, the net result could less sunlight reflected at the tropics.
And more atmosphere gives more power for heat transport via atmosphere from the tropics. And with more atmosphere the tropics can hold more cm of water in column of air- which points to the tendency to have less clouds in the tropics.
Anyways, clear skies in tropics with 2 atm compared to clear skies with 1 atm, will result in less solar power one can harvest in the tropics [and make the rest of world far worse]. So in tropics direct sunlight will diminish and ratio of indirect sunlight increase, and total amount decrease.
Of course even if more heat from the transported from tropics, the movement could be slower. And the speed could effect cloud formation in tropic.
Anyways, there also the bit about the hot spot.
The vertical averaging is critically important because for the greenhouse effect, a change in the amount of a greenhouse gas, especially water vapor, in the upper troposphere is much more important than a change near the surface.
The following image is a bar chart showing how a change in water vapor by atmospheric pressure layer changes the outgoing longwave radiation, using a line-by-line radiative code program.
The chart shows that a water vapor change in the 500-300 mb layer has 29 times the effect on OLR than the same change in the 1013-850 mb near-surface layer. A water vapor change in the 300-200 mb layer has 81 times the effect on OLR than the same change in the 1013-850 mb near-surface layer. Therefore, as small reduction in upper atmosphere water vapor overwhelms an increase in the lower troposphere.
Dr. Spencer’s results shows a reduction in mid to upper troposphere water vapor with warming in the all-important tropics, causing a negative water vapor feedback.
The bar chart did not appear. Here is the link:
http://www.friendsofscience.org/assets/documents/FOS%20Essay/OLR_PWV_bar.jpg
Where’s this been published? I’d like to read the paper….
a variety of places. In our case, look at Fig. 1b and 2b here:
http://www.drroyspencer.com/Spencer-Braswell-97-BAMS.pdf
I meant this new evidence — has it been published yet?
Yes, because peer review hasn’t been tampered with as well.
http://wattsupwiththat.com/2015/08/19/peer-review-is-broken-springer-announces-64-papers-retracted-due-to-fake-reviews/
Nothing but a convenient excuse for those whose work isn’t publishable….
Your peer review shield ain’t gonna save the faithful from the truth any longer, David.
Roy,
This should be no surprise. Precipitation efficiency generally must go up with increased evaporation since in the aggregate there has to be an equal amount of water coming out of the atmosphere as is going in over fairly short time periods.
Precipitation emanates from clouds, which on global average reflect significantly more solar energy back to space than is delayed beneath them (about 20 W/m^2 more is reflected than delayed).
The so-called water vapor feedback doesn’t operate in isolation, but is intertwined with the effects of clouds.
don’t confuse precipitation efficiency with precipitation rate, which is what you are referring to. Renno, Emanuel, and Stone showed theoretically that high precipitation efficiency leads to a cool, dry climate with less precipitation:
http://eaps4.mit.edu/research/papers/renno_etal_94a.pdf
OK, I guess precipitation efficiency isn’t the right word use. The point is if aggregate evaporation increases, aggregate precipitation must increase as well. Precipitation emanates ultimately from clouds. More precipitation means more cloud cover, which means more solar energy reflected, which should dampen the effect of any induced warming.
It’s not valid physically or logically to arbitrarily separate the effects clouds and precipitation have in maintaining the planet’s energy balance from the forcing of the Sun, from the effects they will have on incremental warming. This is the assumption made by mainstream climate science and accepted by many skeptics that isn’t valid and makes no sense. The Earth climate is a highly dynamic, chaotic, and mostly already physically manifested equilibrium system — not a static equilibrium system, from which a change in the energy balance is unknown or a big mystery. Yet this is the way the whole net feedback question is posed or assumed to be.
RW says,
“More precipitation means more cloud cover, which means more solar energy reflected, which should dampen the effect of any induced warming.”
###
The global warmers dismiss that stumbling block by claiming that clouds, overall, are a positive feedback. There have been papers published purporting to show this, but Dr. Roy has debunked those in his own studies. There is a story here that should not be forgot, involving Trenberth and the editor of the journal that published one of Roy’s papers. It is a disgusting story of alarmist militancy and foul spite.
I have degrees in Physics and Mathematics, and run a small measurement laboratory. I know a little something about measuring stuff. I dont know that much about atmospheric science though.
Saying all that –
In all the readings I have done on Climate papers – going back to Hansen 1981 – (where he doesnt demonstrate jack-squat) I keep reading that people use the same solar irradiance (something like 170 W/m^2) …and I cant figure out why.
Since the sun produces a blackbody curve – you can have the same irradiance if the curve is 6000K color temperature or 1000K CCT.
BUT with regard to spectral irradiance – its MASSIVELY different.
The blackbody curves would look EXTREMELY different at all wavelengths – I only ever found 1 paper that “sort of” described differences in the UV spectrum from the sun with regard to irradiance, and it didnt seem to understand why that happened- just said “nearly all changes to irradiance occured in the UV region” – yeah no crap – thats what happens when the Color temperature lowers. The overall irradiance didnt need to change that much though just shift which wavelengths it saw.
Given that CO2 has such a small spectral absorption bandwidth to begin with- how come no one seems to have studied the differences in SPECTRAL irradiance from the sun. If the actual irradiance in the IR region changes with activity – then it could dramatically change how much actual irradiance the atmosphere could observe.
If the sun simply shifts color temperature it could have the same irradiance – but the amount water vapor and CO2 experiences – would change.
Like I said though – I dont know that much about atmospheric science –
Im sure there is a simple explanation as to why I cant find info on that – and I never seem to get a response from “climate alarmists” when I ask them.
‘…and I never seem to get a response from “climate alarmists” when I ask them.”
___________
This is the sort of thing they do not want to discuss because it leads to a complete “bust” of their IPCC CO2/AGW/GHE nonsense.
Draven,
“Im sure there is a simple explanation as to why I cant find info on that – and I never seem to get a response from “climate alarmists” when I ask them.”
Maybe you need to ask a clear question.
Maybe you need to take a look at: https://en.wikipedia.org/wiki/Earth's_energy_budget
But I’m only guessing, in which case I might be unintentionally offending you.
That would work, but different models over the years use different numbers- I think as recall in various models it ranges from 164 to 173. It’s similar to saying earth global temperature is about 15 C- which was first guesstimated at 15 C over a century ago. And one is suppose worry whether it’s 14 or 16 though don’t know what it was or what it is now and .3 C increase is suppose the end of the world and have caused mass extinctions, etc
Maybe I am not being clear enough.
Im talking about this – https://en.wikipedia.org/wiki/Solar_constant
The irriadiance of the sun at the plane of the earth. It is said that the there is only minor fluctuations in the total solar irradiance.
Which is fine. What I am trying to ask about is this…https://en.wikipedia.org/wiki/Color_temperature and here http://casa.colorado.edu/~ajsh/colour/Tspectrum.html
The color temperature of the sun is approximately 5780K on a clear day. Is this also considered a constant? with no fluctuations at all?
*IF* the color temperature changes – it can change the irradiance at specific wavelengths – without changing the total solar irradiance. Thus a measurement that ONLY measures Total solar irradiance – (like this http://acrim.com/TSI%20Monitoring.htm) would see only minor differences what so ever.
Especially if the measurement system they use contains different sensitivities at different wavelengths. (which they all do – whether using a silicon or germanium photodiode – a photomultiper- or a cyrogenic radiometer)
BUT atmospheric gases would not experience the same irradiance with in its specific absorption spectrum.
So my question is – Has there been a research or study done comparing fluctuations in SPECTRAL irradiance (based on variations in the color temperature of the sun) to temperatures.
Draven,
“Has there been a research or study done comparing fluctuations in SPECTRAL irradiance”
Of course. Astronomers have been doing that for maybe 150 years.
I am afraid I still don’t see your point.
“So my question is – Has there been a research or study done comparing fluctuations in SPECTRAL irradiance (based on variations in the color temperature of the sun) to temperatures.”
There has been apparently wider fluctuation of UV. And what you talking about is suppose to related to sunspot activity.
Roughly, I would say it has not been studied enough, though I can’t say I have looked at the topic much.
E.g:
– That is why Krivova’s model SATIRE (Spectral And Total Irradiance Reconstruction) also takes the fluctuations in the UV light into account. “Although the UV light makes up just 8 percent of the total solar irradiance,” she says, “the fluctuations are considerable, and if the effect of the UV changes amplifies solar influence on the atmosphere, we have to account for this in our models.” –
Read more at: http://phys.org/news/2015-03-fluctuations-solar.html#jCp
“Given that CO2 has such a small spectral absorption bandwidth to begin with- how come no one seems to have studied the differences in SPECTRAL irradiance from the sun.”
Of course, many have. Google harder.
You might want to start here, and its references to past work:
“Any reduction in global mean near-surface temperature due to a future decline in solar activity is likely to be a small fraction of projected anthropogenic warming. However, variability in ultraviolet solar irradiance is linked to modulation of the Arctic and North Atlantic Oscillations, suggesting the potential for larger regional surface climate effects.”
— S. Ineson, A.C. Maycock, L. J. Gray, A.A. Scaife, N.J. Dunstone, J.W. Harder, J.R. Knight, M. Lockwood, J.C. Manners and R.A. Wood,” Regional Climate Impacts of a Possible Future Grand Solar Minimum,”
Nature Communications, 6, Article number 7535, doi: 10.1038/ncomms8535, 2015
http://www.eiscat.rl.ac.uk/Members/mike/publications/pdfs/2015/319_Ineson_etal_ncomms8535.pdf
The hot spot is absent for a simple reason. The anchor point for the lapse rate is at the equivalent emissions height which coincides with the location where people are searching for the “hot spot.” They are looking for variability where conditions are essentially fixed.
I believe there are a few different descriptions of mechanics that would lead to this type of result. The one I like is from Dr. William Gray.
https://stevengoddard.wordpress.com/2015/05/09/dr-bill-gray-explains-why-climate-models-dont-work/
It describes negative feedback from clouds and convection overshoot. Seems to match Roy’s data nicely.
It would be nice to see seasonal data as well. While I would generally expect a N-S shifting of the curves, there might be some interesting variation due to the land-ocean influences.
Richard M, good read.
From the post:
“Author’s Background. The author holds an MS (meteorology) and Ph.D. (geophysical sciences) from the University of Chicago. He has been a weather-climate forecaster, researcher, and university graduate school professor for 60 years. He has supervised 50 MS and 20 Ph.D. students. He originated and has been involved with Atlantic basin seasonal hurricane forecasting for the last 31 years.
Gray has never received any research funding from any fossil-fuel source. His position on the global warming issue has led in recent decades to loss of all federal research support he had previously received. His research on this topic continues only through his own funding.”
Once again we see that the earth’s atmospheric processes respond with homeostasis in response to changes,i.e., increase in surface temperature.
Are you eventually looking at publishing a paper on this?
yes, we’d like to, but we need to compare to many more CMIP5 models, and the model archive at PCMDI has been offline for many weeks now. Supposed to be back online in about a week, but I’m not holding my breath. The KNMI Climate Explorer doesn’t have the required vertical profile data of temperature and humidity.
UPDATE: We’ve been told the model archive is down due to a hacking event. The model data archive is fine, but the tools to access the data were fried. Doesn’t sound hopeful to me.
Must be the Chinese or the IPCC :o)
Then publish what you do have. Let the modelers publish their own results.
I don’t think you ought to be blogging this until it’s appeared in a good peer reviewed journal. (Same with your version 6.) Science isn’t done on blogs….
Karl et al didn’t announce their data revisions until they appeared in Science….
I seriously doubt that anyone much cares what you think.
Dr. Spencer is clearly moving science forward. Your worship of ancient ritual, corrupt as it is, isn’t doing anything for science.
Roy, you say
“This would occur if convection detrains at higher altitudes with warming, with the mid-tropospheric humidity getting depressed even more as that very dry air descends from aloft, while mid-tropospheric detrainment and mixing from convection into the surrounding environmental air decreases.”
###
A natural consequence of adding more latent energy to the lower troposphere?
yes, maybe.
One other aspect to consider.
The MSU era begins around 1979.
Sea surface temperature trends in the tropical Eastern Pacific actually indicate cooling for this period:
http://climatewatcher.webs.com/SatelliteEraMap.gif
At least for this region, one would not expect a ‘Hot Spot’ not because of precipitation parameterization, but rather because the surface is not anomalously warm to support a ‘Hot Spot’.
Hi Roy,
Very interesting post. It will be even more interesting to see what happens when the CMIP 5 model data becomes available.
I have one small suggestion. On your figure 2 graphic, the y-axis is in degrees of latitude. A more accurate representation of the total surface area would be the y axis being the sine of the latitude, rather than the latitude. This would make the graph accurately represent the contribution of each latitudinal region, and would further clarify the contribution of the tropics toward the total. The per degree surface area at 60° latitude is only half of the area per degree near the equator. In fact, the contribution of the equatorial region will be dominant when the total area is taken into account.
I do hope that you have an opportunity to update this post when the CMIP 5 data becomes available.
It seems a problem is that water vapor causing most of this 33 K increase in average temperature is rather vague.
It seems to me that having the planet covered mostly by water has the net effect of increasing the planet average temperature. But there also other ways to make the average temperature increase or decrease.
I think the value of using an ideal blackbody as starting point has limited usefulness, but it can serve as a reference point, and that is that a planet at Earth distance were it a ideal blackbody, it would be about 5 C.
And that what I mean when say various factors can cause an average temperature to be warmer and cooler [warmer or cooler than uniform temperature of 5 C].
As example I think it’s quite possible that a blackbody [rather than an ideal blackbody] could have a average temperature higher than 5 C. So a blackbody without any atmosphere could be warmer at Earth distance than an average
global temperature of 5 C.
I also think by added any kind of atmosphere to some kind of blackbody could increase the average temperature higher than the blackbody without the atmosphere. Though it depends upon how it’s constructed.
But generally speaking the best material I could imagine using to make the planet the warmest- and because it’s cheap and widely available is a factor in terms of best materials- is water.
So in terms of cheapest and best way to make a planet is to cover it with water. And it doesn’t matter much what kinds of impurities are in the water, but salt is helpful.
Water needs an atmosphere but it also can make it’s own atmosphere- so strictly speaking all you need is H2O.
So if you going to use a single material, water would be a planetary object at Earth distance from the sun the warmest planet. But if add things and design a system, one could make it warmer than just water.
But just a planet of water as simplest form, also has factors related to it’s average temperature which are relate to it’s planetary mass- the force of gravity should have some effect upon the average temperature.
So, I think an Earth mass, at Earth distance from the Sun, which is covered with deep ocean would have an average temperature of 20 to 30 C.
And probably the warmest one make it, regardless of how much atmosphere or greenhouse gases or whatever you want to add to it, is about 40 C.
Or if put Venus at Earth distance and I would think it should become quite cold. Or the main warming mechanism of Venus doesn’t work, if the planet is receiving 1/2 as much sunlight.
Of course with Venus or Earth with their massive thermal energy, it would could not change in temperature much- Venus put at earth distance could take thousands of year to cool, and Earth put at Venus distance also require thousands of years to warm. Though in terms of billions of of year [and not getting a large impactor] earth could never warm anywhere near Venus temperature, it’s limit in terms of 1 billion years could be say about 100 C average temperature, whereas in a billion years Venus could have average temperature below 15 C.
“But generally speaking the best material I could imagine using to make the planet the warmest- and because it’s cheap and widely available is a factor in terms of best materials- is water.”
The problem is that water vapor is a feedback, not a forcing.
That is: the saturation pressure of water vapor depends on temperature (see: Clausius-Claperyon equation).
Air cannot hold more water vapor unless its temperature first increases.
That temperature increase has to come from somewhere else — in our present case, from GHG heating, especially from manamde CO2.
Don’t you just love the “climate clowns”?
Davy “teaches”:
“That temperature increase has to come from somewhere else — in our present case, from GHG heating, especially from manmade [I corrected his typo] CO2.”
I need to get one of those “GHG heaters” for my house this coming winter. They just use your own breath to heat your house. What a great invention!
You think the laws of thermodynamics are “clowns?? They are not.
People that misapply the laws are the clowns.
David Appell,
I did look at your resume and it does seem to be quite impressive. I have only attained a B.A. in Chemistry and later to computer programming at a community college.
With such advanced studies and well rounded knowledge of physics and math you are a strong believer in the CAGW hypothesis. I am wondering how you hold such a strong belief when carbon dioxide levels were much higher in the past. The coal we burn today was from forests ages ago.
http://edberry.com/blog/climate-clash/b-temperature-and-co2-history/b-temperature-and-co2-history/
Looking at the first graphic you can maybe conclude a few things. Either we really can’t determine ancient temperatures and atmospheric conditions as well as we think or there is not much real correlation of Carbon Dioxide and global temperatures. Like around 50 million years ago, the carbon dioxide levels dropped considerably but the temperatures did not (and this is a period of millions of years). Also the world has been much warmer and does not seem to be a major threat to life. I am not sure what the fear is. Linking a 1 C global warming to all types of severe weather events amounts to mental manipulation on an ignorant public mind. You must be very intelligent to generate your resume certainly as a science minded person you would object to using severe weather events that span the globe as a means to scare the public to action on a problem that may not even be real.
Norman: The Sun was weaker in the past. Its intensity is increasing by 1% about every 110 M years.
Cotton: substituting ad homimen attacks for science won’t make your junk science any truer — just further expose you for the pseudoscientist you are. And one afraid to try to publish in real journals.
False, Cotton. The correct statement is exactly what I said, and it’s expressed by the Clausius-Claperyon equation, a fundamental and important consequence of the fundamental laws of thermodynamics.
“And that, folks, is how you calculate planetary surface temperatures correctly. You’ll find it works for all planets if you follow in detail the hypothesis I have presented.”
It seems quite wrong to me. let’s go over first bit:
“A planet without water and clouds would have lower albedo and the 255K figure (based on clouds reflecting 20% and other reflection 10%) would be about 271K without the clouds.”
Does clouds include dust clouds? Or clouds like on Venus?
Earth is volcanically active planet, also, so is Venus:
“In April 2010, Suzanne E. Smrekar et al. published that Venus Express observed three volcanoes that have had eruptions about 250,000 years ago or less, which suggests that Venus is periodically resurfaced by lava flows.”
https://en.wikipedia.org/wiki/Volcanology_of_Venus
Earth has dust storms, and with land area one should expect more.
But let’s imagine it has no clouds. And we will also assume it’s similar to earth. Also assume oceans are replaced with dark sand [which is stuck together with crazy glue to prevent raging dust storms].
So it’s suppose to be about 271. I would think it would be warmer. And would expect and planet with 1 atm to be a lot more reflective than the Moon-
“Bond albedo: 0.11 [Moon] 0.306 [Earth]”
http://nssdc.gsfc.nasa.gov/planetary/factsheet/moonfact.html
I would expect it to be 20% or more. Or compare Mars vs Earth:
“Bond albedo: 0.250 [Mars] 0.306 [Earth]”
http://nssdc.gsfc.nasa.gov/planetary/factsheet/marsfact.html
So maybe it’s less than .250 since I covered 70% with dark sand [crazy glued together].
But I don’t think the Bond albedo would as much in tropics as compared to rest of the planet, so why said 20% or more, rather than 25% or more. Or in regards to most of the sunlight hitting this earth mostly covered with dark sand [stuck together with crazy glue] it would about 20%. And such an earth from space would be much darker, but not a dark as the Moon:
http://www.space.com/30168-moon-crosses-earth-face-nasa-video.html
I put so many links that I thought better to make separate
post. Continuing.
Ok, daytime high air temperature in tropics should be around 50 C, and night time lows around 20 C- 30 C average.
Half world either side of equator: 25 C. Other half of world
around 0 C [or less]. So at least 10 C average global temperature [283 K]. So that not clouds, which you say “271K without the clouds”
And go on to say:
“But the “dry” temperature gradient would be close to 9.8K/Km assuming we still have some IR-active gases, ozone etc. If we apply that gradient over 5Km we get a surface temperature of about 271 + 49 which is 320K”.
I guess I was assuming the air would be dry. No ocean then it would be dry- or all moisture would end up at the poles.
Now if you removed the ocean rather fill them with dark sand [glued together], and but put the sand glued together crazy glue at bottom of ocean. This would be warming effect. Or most of earth surface would be about 4 km lower in elevation. One can’t simply times 9.8 C times 4. But maybe +20 C to tropics [or half the world] giving about 283 + 10 K, average global of 293 [20 C]. And ocean basins near tropics would be rather hellish. And it seems these basins might add factors [mainly thinking of winds] would could result in warmer the other half of the world [increasing average global temperature] of course such wind might rip up my crazy glue sand. Though it could be argued that these ex-ocean basin could also be quite calm. Of the course the other factor is you put all the continental land masses at fairly high elevation- obviously making them colder, and it seems they would be quite interesting during their summers.
Dr Spencer says:
“Everything emits IR…”
Au contraire.
The non-hetero-polar gases oxygen and nitrogen, which make up the bulk, of our atmosphere do NOT emit or absorb IR in the region 1-30 microns.
See ‘Heat Transmission by Radiation from Gases’ by Robert E Egbert, Doctoral Dissertation at MIT, 1941, pp. 5-6.
Nitrogen absorbs and emits between 4 and 5 microns and oxygen between 6 and 7 microns.
Test it yourself
http://vplapps.astro.washington.edu/vplselectmicro.php
Hi MikeB.
Yes, you are right, but they are very very less active than CO2 or H2O.
If you plot N2 and O2 with CO2 and H2O the first twos absorbers are practically invisible, because their line intensities are about 10^10 times smaller than the second twos.
For that, even considering the different concentrations of the gases in our atmosphere, I believe that we should accept Dave point of view when he wrote:
“The non-hetero-polar gases oxygen and nitrogen, which make up the bulk, of our atmosphere do NOT emit or absorb IR in the region 1-30 microns.”
Don’t you agree?
Have a nice day.
Massimo
Err…. NO
We have just both agreed that they do?
Hi Mike,
evidently I was not clear.
IMHO Dave is formally wrong, but practically right.
And since climatology is thought as an holistic science, I think Dave assertion should be accepted.
For example potatoes are slightly radioactive, so formally you can say they are radioactive indeed, but practically nobody consider potatoes as radioactive pollutant.
Get my point?
Anyways (this for Doug), in this case I don’t enter the discussion whether the radiation is so much determinant for the surface temperature or not.
My point was just a consideration meant to itself.
Have a great weekend.
Massimo
The following lik provides further evidence that CAGW is man-made even if completely imaginary.
Have a great day!
Oops! Here’s the link:
http://www.realclearpolicy.com/blog/2015/08/20/the_latest_climate_kerfuffle_1397.html
Have a great day!
Green and red are complimentary colors. Just ask Naomi.
Have a great day!
Hi JohnKl,
just to say, in early nineties an famous Italian statesman and politician name Giulio Andreotti wrote about the greens something like that:
“greens are like apples, when they grow up they became reds!!!”
Have a great weekend.
Massimo
Hi Massimo PORZIO,
Thank you for Giulio’s comment. You don’t need to be color blind to see that the Red’s and Green”s prove to be the same.
Have a great day!
Dave should have adjusted Roy’s comment,
“Everything emits IR…” –
taking account of the context that it is a reply to a comment of gbaiki about the effects of temperature and pressure – to,
“Everything emits [thermal] IR…”
Then his contradiction is strictly correct, because homonuclear diatomics do not have an allowed vibration-rotation transition. The infinitesimal amounts of IR they do emit arise from extraordinarily rare ELECTRONIC transitions, and are not related to temperature.
The whole of the nitrogen and oxygen in the atmosphere above the United States, is about the same, in radiating terms, as a one-bar electric fire.
It was lost, try again:
— D says:
August 20, 2015 at 3:45 AM
It seems gbaikie’s world is all about “It seems … “
It seems I need to remind you that my hypothesis is based on the Second Law of Thermodynamics and, it seems gbaikie, you don’t understand the relevant physics.–
It seems quite obvious that your hypothesis is wrong, but
with assumption it’s not,I will attempt to go over it.
You think it’s based upon Second Law of Thermodynamics, though it seems to me, it seems to be based upon some perversion of the Greenhouse Effect theory.
Sort of inverted in sense that rather than warm, the major greenhouse gas, H20 is doing a lot of cooling.
In addition it seems to have some perverted Slayer stuff.
Or it seems you think that with more atmosphere mass it increases temperature. Plus the unique madness of solar energy heating the interior [over 6000 degrees] but that seems to me too be a bit irrelevant.
So it appears according to your hypothesis that for instance if Earth had twice the mass of it’s atmosphere this would cause a higher average temperature.
And likewise if atmosphere were 4 times greater mass it would even warmer.
Earth atmosphere has mass of 5.1 x 10^18 kg. So if instead it was 10.2 x 10^18 kg, it be warmer, and were it 20.4 x 10^18 kg, it would have even higher average temperature.
Yes?
And if it had 1/2 1 atm of mass, it would be cooler?
Assuming the air was dry.
I am assuming twice or 1/2 atmosphere could hold more and less water vapor?
There few ways this would be the case, simply a warmer atmosphere if there was ocean or bodies of water, hold more water. And if you thought 1/2 atmosphere would be cooler, the cooler air could hold less water. Plus the shallower atmosphere of 1/2 atm would also hold less water vapor, and the higher atmosphere of 2 atm could hold more water vapor.
But to keep it simple, if dry then and more atmosphere, it’s warmer, and less atmosphere is cooler.
So would twice Earth atmosphere if it were dry it would be warmer, and if so how much.
And if with Earth with it’s ocean [and so wasn’t dry] and had twice the atmosphere mass, what does your hypothesis indicate the average temperature would be?
I don’t know if Greenhouse Effect theory would provide an answer. It might be confusing because if double the atmosphere, one could have have same ppm of all the gases, but would double the total quantities of them.
So not certain what the believer of GHE
would give an answer [or more importantly whether they would give consistent answers]
But I suppose the whole idea of your hypothesis is to be better- and easier to use get consistently the right answers.
So have the two questions
Double atmosphere but it’s atmosphere without water.
And double earth atmosphere with it water vapor.
What average temps for both these circumstances?
And how warm the equator would be would also be a detail
o interest.
And I think it would be somewhat remarkable is if someone reading our hypothesis and using it would able give a similar answer that you arrive at.
Or seems there is a problem with greenhouse effect theory is everyone gives different answers, which adds support to the idea that it’s pseudo science.
–You got one bit nearly right: if Earth’s troposphere was still the same composition as we have, even without carbon dioxide, but as high as the troposphere on Venus, then the Earth’s surface temperature would be in the vicinity of 300°C to 400°C.–
I did not ask about earth with 100 times or more atmosphere, rather the two question regarded twice Earth’s atmosphere.
But I have said that Venus, at Earth distance would cool down
and be as cool or cooler than Earth’s average temperature, but such cooled world would not continue to have it’s large atmosphere.
Generally speaking, I believe most people would assume that if Venus were further away from the sun so that it receives
half as much sunlight, that Venus would cool down by some amount.
This is about as obvious as were Earth closer to sun so that it received twice as much sunlight, that Earth’s average temperature would increase.
Now, were Venus to become cool enough the CO2 of the atmosphere would become a liquid, thereby transformed the large atmosphere into oceans of liquid CO2. And I think this is what would happen.
Venus has about 3 atm of nitrogen, and nitrogen would not liquefy, but some could be become mixed within the CO2 oceans.
Were earth to have a mere 10 atm, one could have CO2 as liquid and CO2 would be like H2O, in Earth’s atmosphere- having solids, liquid, and gas states. So CO2 would not longer be an ideal gas, and were there enough CO2 in the atmosphere, it could rain CO2- and as condensing gas, CO2 would like H2O, could alter the lapse rate.
So for Earth to have an atmosphere as high as Venus at Earth distance, is a bit problematic, and not sure one could do it, without using large amount of hydrogen, Helium, or Methane.
You could just add 100 atm worth of nitrogen, but not sure whether it would liquefy.
One could add enough heat so it did not liquefy- using nuclear reactors, or maybe the geothermal heat of earth would be enough [or “mine” enough Geothermal heat].
Anyhow were one to have 100 atm of N2 then the sun would shine dimly aupon the Earth surface, or one could possibly get sunlight when the sun was 45 degrees of higher above the horizon. And instead of 10 tons of atmosphere per square meter one has 1000 tons per square meter, the air density would depend on the temperature of the air.
Convection would work well, even if you had enough oxygen [20%] it might be hard to light a fire- due to
convection loss.
Humans need different gas mixture when deep diving at more than 100 atm.
Anyhow lava should cool quicker. Water would not evaporate like it does on Earth and boiling temperature is much higher.
But were a 100 atm earth as warm as you said it were to be
it seem earth would have a complete global coverage of clouds [making things even dimmer at the surface]. And were the clouds to rain, the rain would not reach the surface.
And generally speaking one would get some really weird stuff happening.
An interesting thing about the clouds is their height would
depend upon the air temperature. They would seem to be unlike Earth clouds which can have variety of height at any location.
Or the clouds should be flatter, and they would the surface.
And this flat surface would like earth flat surface upon a sphere.
So accordingly the tropics would still receive more than 1/2 of total energy of the sunlight.
Now where would the clouds be?
On Earth they are 1 atm to above 1/4 atm.
If Earth had 2 atm, one could assume clouds would be
2 atm to 1/4 atm. And were continue, 3, 4, 5,….100 atm
at some point one could expect there not to be surface fog.
Or the surface should progressively should become drier.
Or as said if the world was warmer, rain would not reach the surface [huge chunk of hail might reach the surface].
Of course this could be related to the actual topic of the post [how refreshing!!:)].
And goes back to my first question in regards to this post, how would 2 atm atmosphere affect the mythical hot spot.
So have 100 atm world [somehow warmed] at earth distance from the sun, the clouds are the surface which is warmed by sunlight, the tropics receive most of the energy of the sunlight, the droplets of water would be evaporated by the sun, and H20 gas created rises. The tropics would have warmed air from Sunlight, the rising H20 gas, makes it a higher troposphere- and have a global convection cell.
And if it’s a warmed world with 100 atm, it doesn’t get water from ocean, it gets water from the rest of the atmosphere.
So higher cloud flowing out of tropics and lower clouds flowing into tropics. And rotation and night/day cycle complicating it.
The tropics (between 20N &. 20S) is more than one third of the planetary surface (34.2%). Incoming shortwave radiation flux at ToA (Top of Atmosphere) is also much higher than average.
If NOAA surface temperature dataset is compared to UAH 6.0 beta lower troposphere temperatures in this region, it is clear that bulk troposphere rate of warming in the 36 years and 8 months since December 1978 is considerably lower than that of the surface.
The effect is much more pronounced over oceans than over land.
rate of warming in mK/decade
tropics land ocean
NCDC 114 203 87
UAH 99 209 67
Over land the lapse rate is unchanged, but over oceans it is increasing with time. In drier air the lapse rate is higher. On the other hand, with increasing surface temperatures the boundary layer is getting more humid. The only possible solution is that precipitation is indeed getting more efficient, especially over oceans in producing more dry air in the upper troposphere.
That’s a strong negative feedback in two ways. While vertical distribution of water vapor is getting more uneven, its contribution to the greenhouse effect is decreasing. At the same time low level clouds are getting more abundant relative to high level ones, which increases albedo but does not hamper outgoing longwave thermal IR radiation.
The fact this effect is stronger over oceans than over land shows it is a water vapor feedback and not something else, because the only thing more abundant in oceans than on land is water.
Doug 5:50am: “..as (water vapor) increases, it causes the surface to be cooler, not warmer,..”
Proven wrong by experiment: as night time cirrus water vapor DW IR in view increased, the surface water pool a few inches deep recorded a concurrent increase in temperature over a control sample. Doug’s theory is falsified by tests.
http://www.drroyspencer.com/2015/06/can-infrared-radiation-warm-a-water-body-part-ii/
— August 22, 2015 at 5:50 AM
Water vapor at much colder temperatures than the surface does not make a “contribution to the greenhouse effect” because, as it increases, it causes the surface to be cooler, not warmer,—
The ideal blackbody which is part of the premise of greenhouse
effect theory, also cools a surface which otherwise would be
120 C to a temperature of 5 C. [Around noon in tropics would have surface temperature of 120 C which is heated by sunlight
other parts of the planetary sphere would not be warm as much and the ideal blackbody would cool this surface less- because it would be designed to maintain uniform temperature of 5 C.]
This feature though magically impressive, is not why would call this particular ideal blackbody a pretty good refrigerator, but rather it’s unique ability to transport heat without any time delay and emit a full blackbody spectrum
into space, which makes the planet cooler.
The evaporation of water is quite different than this, with water, energy is used to convert a liquid into a gas which at some latter part in time, is converted back into a liquid
whereupon the energy of the gas is released, and this heat can be radiated, or convective/conducted prior to being radiated into space. So it’s not instantaneous radiation of heat and thereby less like refrigerator in space.
–There’s other water vapor already up there doing its share of radiating.–
Say you had a 10 meter diameter balloon. And the balloon walls which are transparent to IR [or any spectrum of IR one could be concerned about].
The atmosphere temperature outside the balloon remains at some constant temperature- say 20 C.
The balloon has heated air which is heated by an electric heater.
The balloon is tied down [so it does not go anywhere].
And air inside the balloon is pure nitrogen with no water in it.
It’s heated until it’s 40 C it is maintained at this temperature and one records how much electrical power is needed to maintain the temperature at 40 C per hour.
This also done for 60, 80, and 100 C air temperature.
Next you add 1 kg of water vapor [H20 gas] into the balloon.
Does the addition of 1 kg of water vapor cause the balloon to cool faster- does it require more electrical power to maintain the air temperature at the various temperatures.
And how many watts of additional energy does it cost at 40, 60, 80, and 100 C?
Let’s also adds different gases, so rather than H20 gas, we add 1 kg of oxygen. And then try 1 kg of CO2. And try 1 kg of methane.
Do any of these added gases also require more electrical power per hour to heat the balloon as compare to pure nitrogen? And if so, which does the most?
And finally add all of them together, is there greater effect, and how much?
Computer programs can be designed to prove almost anything — even that white is really the absence of black.
It snowed in Calgary, Alberta Canada yesterday, August 21, 2013.
re snow in Calgary…
http://calgaryherald.com/news/local-news/summer-snow-hits-the-ground-west-of-calgary
Hi Gordon.
Just to say,
here in Italy (despite the hot July just passed), we got snow above 2700m on the Alps this week.
Have a great weekend.
Massimo
I wrote the above because the TV news trumpeted it as an another proof of the “climate change”, of course.
Hi Massimo Porzio,
Oh! my God Summertime snow in the Alps! Another extreme weather event even if a cold one. No, doubt the poor and minorities will be hurt the most! Further proof for the delusional that Western Civilization never cared for the world’s poor and CO2 must be some kind of gun pointed at the head’s of third world whiners everywhere even if they can’t survive without the gas (guffaw)! The late great Eddie Cochran may have sang it best:
“I’m gonna raise a fuss, I’m gonna raise a holler
About a workin’ all summer just to try to earn a dollar
Every time I call my baby, and try to get a date
My boss says, “No dice son, you gotta work late”
Sometimes I wonder what I’m a gonna do
But there ain’t no cure for the summertime blues
Well my mom and pop told me, “Son you gotta make some money,
If you want to use the car to go ridin’ next Sunday”
Well I didn’t go to work, told the boss I was sick
“Well you can’t use the car ’cause you didn’t work a late”
Sometimes I wonder what I’m a gonna do
But there ain’t no cure for the summertime blues
I’m gonna take two weeks, gonna have a fine vacation
I’m gonna take my problem to the United Nations
Well I called my congressman and he said quote:
“I’d like to help you son but you’re too young to vote”
Sometimes I wonder what I’m a gonna do
But there ain’t no cure for the summertime blues”
Have a great day!
“…too young to vote…”
That also originally came from a Hollywood movie of the 1930s.
In a Southern town, with complicated local affairs, a very young, wrongfully accused, is released from the local jail through the intercession of the Mayor. The boy says “I’d really like to help YOU, Sur” and the Mayor replies in a distracted way, “I know, but you’re too young to vote twice.”
Hi Massimo Porzio,
How far does the snow line typically fall in the Italian Alps in July?
Have a great day!
@Massimi…”here in Italy (despite the hot July just passed), we got snow above 2700m on the Alps this week”.
Good to hear from you in Italy, Massimo.
Calgary is on the western edge if the Canadian prairies, as the prairies transition into the Rocky Mountain foothills. It’s elevation is about 4000 feet and it’s about 100 miles west of the Rockies.
It is uncommon for Calgary to have snow in August although some people claim the province it is in, Alberta, is good for snow every month. Another saying out that way is: “if you don’t like the weather, wait 10 minutes and it will change”.
Calgary is known for chinooks in winter, which is a sudden warming from below zero temps to above zero temps. I recall one day on the main north-south road, the McLeod Trail, that it was about -15C on the west side of the Trail and about +5C on the other side. You could see a distinct weather pattern over the city right down McLeod Trail.
I don’t live in Calgary, I live near Vancouver, on the west coast, in a rain forest environment. We’ve had a drought since June and many people are being alarmist about it, however, that used to be a typical summer in Vancouver before global warming. 🙂
“It’s elevation is about 4000 feet and it’s about 100 miles west of the Rockies”.
Brain cramp. Calgary is about 100 miles EAST of the Rockies.
That cost me on an engineering exam once. I mixed up east and west in a question. On another exam, in second year differential equation theory, I ran through a 3 page Bessel function calculation and got the Bessel stuff ok. Then on the second last statement I mentally subtracted something like 74 – 35 and got it wrong.
I think my worst gaffe was mixing up a cosine wave with a sine wave. That was particularly galling since I have worked with sine waves all my life and can see them in my sleep.
AT last, some real science on the water vapour feedback issue.
This is similar to what I found by stacking temperature changes around six major volcanic eruptions and looking at cumulative integral of temperature ( degree.days for farmers ).
I found that tropics were very insensitive to the effect of volcanoes and recovered the initial deficit after about six years. Note, this does not mean they just got back to the pre-eruption temperature but actually warmed beyond that to recover the lost energy represented by the integral of temperature.
https://climategrog.wordpress.com/?attachment_id=285
There is a series of plots for land and sea , NH and SH that are linked in the text below the graphs. Take a look around. 😉
Thread Bombing:
No matter how much merit your ideas have, thread bombing trashes up the site, makes you look like a crank and the rest of look bad by association. Please don’t do it.
I agree; this is the worst yet.
Doug 3:57pm: “..(water vapor) effect is to cool, not warm, ..surface temperatures..”
Proven wrong by experiment: as night time cirrus water vapor DW IR in view increased, Dr. Spencer’s water pool on Earth surface a few inches deep recorded a concurrent increase in temperature over a control sample. Doug’s theory is falsified by these tests. If Doug’s theory doesn’t agree with the tests, then it is wrong. Doug’s video is thus error filled and should be avoided by the wary until corrigenda are issued.
http://www.drroyspencer.com/2015/06/can-infrared-radiation-warm-a-water-body-part-ii/
Hi ball4,
This remains old news. A sheet not Cyrus clouds supposedly results in a temperature differential. If clouds did indeed cover the water tanks (no clear photographic proof appeared on the thread) it should warm the water tank uncovered by the sheet more! Of course, this all assumes radiation and not convection produced the temperature differential! Your proof lacks.
Have a great day!
JohnKl: “it should warm the water tank uncovered by the sheet more!”
It did! The added DW IR from the cirrus wv and water ice did so per 1LOT which is missed by Doug, the one uncovered is the one in view of the clouds (black line trended down after 1:30am). The cirrus photo source was referenced in the link.
Hi ball4,
Thanks for the reply, but you appear to be incorrect and reaching. The uncovered tank appears cooler in the top graph and the 2nd graph temperature differential of covered tank over uncovered tank remains positive and rising. When the Cyrrus clouds appear the rise in temp differential levels off but remains positive.
Have a great day!
Hi Ball4,
After reviewing the data again I can see your point. The problem for you however is that the peak temp differential appears after the Cyrrus clouds appear and that differential increases for a time after the clouds appear. Btw I personally don’t deny that radiation reflected and or re-emitted to the surface by clouds can reduce the rate of cooling and I believe to have experienced it myself. Nevertheless, the data you provide proves inconclusive to me and you haven’t proved the net effect of water vapor not nighttime clouds is to warm.
Have a great day!
JohnKL – It is pretty simple, the water in view of the photographed cirrus has an increased T over the shaded control water sample because the black line trends down concurrent when the clouds come into view of that water, any convection from the clouds has not had time to reach the surface. Dr. Spencer’s analysis shows why due the 1LOT. The top post here is correct based on test. Doug does not have a test or analysis of this situation supporting his theory, the vortex tube operates to 1LOT also.
Hi Ball4,
Not to be a pest but…
1. What “photographed” Cirrrus?
2.. The downward trendin black-line does not fully trend with incoming clouds.
3. Good to know Dr. Spencer accepts the 1LOT. We all should.
You should direct comments about Doug’s theory to him. Thanks and…
Have a great day!
Doug: “Where’s your study of real world temperature and precipitation correlation, Ball4?”
Have you no memory Doug? Showed you on another thread. And even pinpointed your error in calculating the precipitable water over Singapore – with citation. The cited correct calculations are long in the literature for those interested, there are likely many sources. Doug ignored my help at the time in favor of his political purposes. I’m sure 100 Australian career politicians can see that. I never explained vortex tube Doug, just I’m sure it follows 1LOT & 2LOT. The $5000 purportedly on offer is simply a hoax Doug, the wary will avoid.
—
JohnKl: “1. What “photographed” Cirrrus?”
In the cited link see: “GOES satellite imagery”
2. I would guess a band of cirrus came by, then cleared out followed immediately by more potentially thicker cirrus, this seems typical of cirrus formations. The GOES should show what happened. Interesting how fast the water several inches deep detected that concurrently, no? NOAA ESRL daily does similar cloud detections all day & night long.
3. Dr. Spencer has also tried to help Doug based on tests, but evidence shows Doug’s politics are much stronger than good science.
Hii Ball4,
The post refers to GOES satellite imagery, but where can I find the link showing satellite cloud imagery for Roy’s back yard GPS coordinates, or wherever he located the water tanks during June 29-30 hour referenced.
Have a great day!
JohnKl – Backyard photos 1:30am would be at nighttime so of little use. Well, maybe unless there was a moon handy. The GOES satellite imagery can see cirrus much better.
Hi Ball4,
How do you get GOES satellite imagery of clouds over Roy’s water tanks at the time and locations mentioned.
Have a great day,
JohnKl 8:12pm – Use Dr. Spencer’s expertise to answer that or do your own GOES imagery research.
—
Doug – The link of my original work is from this site, you would just ignore it again because that is your politics. You will have to do the work to find it, I already did it once.
All I had to show was pinpoint your error calculating precipitable water in a column at one site as you used the same inaccurate method for all 30 sites. At any rate, the correct calculations are in the literature to research on your own, or anyone interested. And find the corroborating measurements on line too. Why not do some simple tests like Dr. Spencer? Replicate his even. Your politics are so strong I bet you you won’t. Pay yourself the $5,000.
Doug – “As explained in that paper, the one-way thermal energy transfer..”
The thousands of tests properly done by others demonstrate radiative energy transfer is 2 way per 1LOT and net energy transfer is 1 way per 2LOT. Doug has no test showing the “precise physical process at the molecular level which does indeed ensure that every one-way pencil of radiation obeys the Second Law of Thermodynamics.”
Dr. Spencer has done a test 6/30 which supports his top post here, Doug has completely failed to do so in support of any of his own theories.
“Do you seriously think Roy has proven something new in the field of physics?”
I seriously think his testing has proven your theory “..(water vapor) effect is to cool, not warm, ..surface temperatures..” is wrong so I did the work and found where your precipitable water calculations in the column over Singapore and everywhere else are physically incorrect. All of which relates to your incorrect hypothesis regarding surface temperatures. If your theory doesn’t agree with observed test, it is wrong. Issue your corrigenda immediately.
I would imagine that the dew point would have been a factor in the temperature behavior of the two coolers of water. I don’t have the dew point of that particular time, perhaps Dr. Roy can supply it; but the temperature decline of the water in the coolers should flatten as the air temperature approaches the dew point. Why? Because evaporative cooling slows as the humidity increases and then stops at dew point temperature, theoretically. That would explain the shrinking differential of temperature as dawn approached, the shielded cooler of water being slightly warmer than the un-shielded cooler and this meant a slight difference in the rate of evaporative cooling. Hence the temperature plot of the warmer water would flatten later than the other.
mpainter – I think that’s sound reasoning, the T at the surface and down a few inches would be interesting to observe in the next test. Shown by the planned saran wrapped surface investigation. Net though, even given evaporation modulation, the shaded water cooled faster than the water receiving the added energy from the cirrus so a T difference arose. Going to have to order clouds next time too, lol. And observe dew point.
Doug 4:14am: “…in fact both land and ocean surfaces are cooler in more moist regions, as in Singapore for example.”
9:39pm: “but instead we find Singapore rarely gets maximums above 33°C…”
5:54pm: “..still in winter, Jabiru (east of Darwin) is predicted to reach 36°C despite receiving far less solar radiation than Singapore…”
5:54pm: “It has less greenhouse gas (water vapour) above it than does Singapore.”
Falsified yet again Doug. Issue your required corrigenda immediately. Wary readers will avoid your video in the meantime.
Do you really believe no one hear is familiar with your heat creep theory?
Have a great day!
Hi Doug,
Please know I do not attack you, BigWaveDave or Heat Creep theory and I don’t have a PHD in climatology. Fast moving perimeter vortex tube gasses will be hotter than the relatively less mobile gasses in the center. The Earth’s atmosphere comprises among other often conflicting phenomenon centrifugal motion due to planetary rotation, centripetal action due to gravity and solar input which allows for atmospheric expansion away from the Earth’s center. Atmospheric potential energy becomes actualized as kinetic energy upon descent. My post simply suggested that ignorance may not be the only reason some have dismissed you and heat creep theory. Empirical evidence has reduced Global Warming to a reduction in the rate of cooling. Spinning scare scenarios of imminent glacial ice-sheet collapse, protein deficient wheat, massive famines from the the small tattered factual fragments remaining seems a herculean task for the increasingly beleaguered CAGW community, but a great deal of time, effort and expense has gone into mass public panic if not delusion. Someone wants a return on their investments.
Have an amazing day!
Hi Doug,
Please not I’ve made several attempt to respond to your posts and they have not appeared. It takes considerable time, patience and receptive effort to get a post on this blog now apparently.
Have an amazing day!
JohnKl,
I really liked this post of yours. It is similar to how I see things. But I do think a GHE does exist. I do not think CAGW is real.
Every bad weather event is blamed on CAGW. Even though the overall globe has warmed maybe a degree in 100 years that is enough to spur heat waves for months that are 20 degrees above the normal.
Hi Norman,
Thank you for the kind words. After trying to reply unsuccessfully, please know I will follow up with you on a later thread.
Have a great day!
D*VG C*++*N: Your desire to assuage your ego precludes you from being able to consider academic queries of your theories. There is much merit to some parts of your theories, but it’s not all about you. Truth is truth only if it holds up under rigorous inspection and challenge.
Rather than resort to shameless plugs of your book and web site, simply address the immediate topic of discussion without vectoring off into tangential areas.
Why don’t you start your own blog, and stop polluting this one with your unpublishable nonsense?
Hi David Appell,
Many CAGW alarmist cranks get published frequently. What have they achieved? Reduction in global atmospheric carbon (CO2)? No. Lower tropospheric temperatures? No. A sustainable planet? No more than before. If anything food productions has risen with rising atmospheric carbon even if you’ve convinced yourself that the bread in your cupboard lacks protein. Or have you and the CAGW ilk only encouraged governments to impose bogus environmental legislation on business and citizens to no effect other than re-distriburting wealth to those who couldn’t earn it themselves without panicking their fellow citizens to no useful purpose? Just asking…
Have a great day!
David Appell,
As far as I can determine you have never published anything in the peer reviewed science literature. Given your repeated focus on peer review as the only measure of technical veracity, why do you think that your opinion matters?
Hi Doug,
Thank you for the post. CO2 would have a similar effect to water vapor in this regard over a greater extent of atmosphere but a much lesser extent of spectral radiance and energy. Water vapor’s inter-molecular energy sharing would exist primarily from 0 to 10 km above the surface and a much smaller extent in the lower stratosphere. Above this point radiation emitted upward by water vapor but not absorbed by other atmospheric gasses would escape to space.
Many have criticized Loschmidt in the past for getting the physics wrong. What do you see as the greatest errors promulgated by those who dismiss him?
Have a great day!
Doug – Again, the thousands of tests properly done by others demonstrate radiative energy transfer is 2 way per 1LOT and net energy transfer is 1 way per 2LOT. Entropy can change in atm. horizontal plane too through the PV term. At Earth’s surface, the sun deposits way more energy than -40C, people demonstrate by cooking eggs on sunlit pavement at times. On avg. sunlight deposits about 235 W/m^2 near the surface budgeted per KT97.
“At Earth’s surface, on average, the Sun’s solar radiation has an effective Planck function similar to that of a black body at a very cold temperature of about -40°C…around the middle of the troposphere (where there has been less absorption than at the surface) the Sun’s mean radiation is equivalent to that of a black body at about 255K.”
So now Doug claims the surface sunlight makes -40C colder than the mid-troposphere sunlight at 255K (-18C)? You are really getting wound up Doug. Read a good intro. text. Wary readers will stay away from Doug’s video until corrigenda are issued.
Annual satellite global brightness temperature = 255K looking down on Earth as an IR sun; Earth surface thermometers thermodynamic T = 288K; do the math Doug. The atm. is in between.
Doug – “I have already proven above to silent readers that you are a liar, Ball4, in this comment….Singapore is not one of the locations..”
Which was falsified at 10:03am with these exact quotes showing Singapore IS one of Doug’s locations per DOUG!
Doug 4:14am: “…in fact both land and ocean surfaces are cooler in more moist regions, as in Singapore for example.”
Doug 9:39pm: “but instead we find Singapore rarely gets maximums above 33°C…”
Doug 5:54pm: “..still in winter, Jabiru (east of Darwin) is predicted to reach 36°C despite receiving far less solar radiation than Singapore…”
and Doug 5:54pm: “It has less greenhouse gas (water vapour) above it than does Singapore.”
QED. Issue your badly needed corrigenda immediately Doug, wary readers will avoid your video until then.
Hi Doug,
Thanks again for the post. However, my initial reaction seemed similar to Ball4 and your attempted correction that you meant to state “the sun transfers no thermal energy into the surface by way of solar radiation that reaches the surface” doesn’t appear to improve things a whole lot. Approximately 40 w/m^2 of IR makes it out from the Earth’s surface to space unobstructed by the atmosphere. Thermal imaging satellites rely on it. Still you claim none of the solar IR makes it to the Earth’s surface. Really?! Suppose at noon with the sun directly overhead I point an IR sensitive device directly at the sun and again point it directly at the sun when it sits on the horizon at day’s end. Do you imagine there to be little or no difference in reading? At noon the directly overhead sun penetrates an atmosphere approximately 50 miles thick at sunset solar rays travel through thousands of miles of atmosphere. Do you believe a ground based IR detection device pointed at the noontime sun and the sun when it sets will give the same reading? Please re-think your position or clarify it. Thanks and…
Have a great day!
Proper placement (maybe) Doug can’t find them otherwise.
Doug – “Take a look at an energy diagram like this showing mean solar radiation of 168W/m^2..
Incorrect, the diagram shows as I wrote 235 W/m^2 being deposited by sunlight.
“the surface is radiating 390W/m^2″
Yes. That is what it does show at surface Doug, Te=288K. See the TOA, 235W/m^2 for Te=255K IR sun. Do the math. Not that hard. Issue your badly needed corrigenda immediately Doug, wary readers will avoid your video until then.
Doug – “Not in any single experiment has it ever been possible to measure any warming by radiation supposedly delivering thermal energy from a cooler source, because it doesn’t happen.”
Let me once again remind Doug, that Dr. Spencer’s test 6/30/2015 linked here showed the opposite, demonstrated increased T in the warmer water viewing cirrus radiation delivering thermal energy from a cooler source (the black line trended down concurrently after about 1:30) over the control water shaded from, not viewing the cirrus, because it does happen just as in the thousands of other similar experiments including those that I’ve done personally. And NOAA ESRL shows daily, all day/night detecting clouds similarly.
Issue your badly needed corrigenda immediately Doug, wary readers will avoid your video until then.
http://www.drroyspencer.com/2015/06/can-infrared-radiation-warm-a-water-body-part-ii/
Hi Doug,
Just another point to echo Ball4 your attempt to compare a black body at -40C with the Suns solar radiation fails for the same reason you’ve attacked others in the CAGW alarmist community. Tell me Doug is a black body at -40C incandescent?! Do Norwegians pay to bathe themselves in the UV generated by -40C degree objects to replace the SUNLIGHT they missed throughout the year? The ability for radiation to warm depends on the energy content of the radiation itself which corresponds to frequency, amplitude and coherence. If you need additional explanation please let me know! Many seem to have problems understanding this point. The mere amount of energy emitted tells me little the form it takes tells me almost everything.
Have a great day!
Doug – “Take a look at an energy diagram like this showing mean solar radiation of 168W/m^2..
Incorrect, the diagram shows as I wrote 235 W/m^2 being deposited by sunlight.
“the surface is radiating 390W/m^2”
Yes. That is what it does show at surface Doug, Te=288K. See the TOA, 235W/m^2 for Te=255K IR sun. Do the math. Not that hard. Issue your badly needed corrigenda immediately Doug, wary readers will avoid your video until then.
The diagram shows 168W/m^2 + 67 W/m^2 = 235 W/m^2 reaching the Earth’s surface Doug, deposited by incoming sunlight not reflected, the 67 isn’t simply destroyed somewhere in the atm. as Doug seems to think. Doug is simply faked out by a cartoon.
Doug – “Where precisely on the energy diagram I linked above do you see the figure 67 indicated as going into the surface, Ball4? What you do see is 67W/m^2 absorbed by the colder atmosphere, not the warmer surface.”
Doug – Now that is an excellent question for once. I’m sort of stunned, good job Doug.
The cartoon is deceptive as there is no height scale, the atm. is a thin veneer on the globe. That arrow ending in 67 IS absorbed by the atm. as air both absorbs and emits as does all mass. The 67 arrow doesn’t just poof out though Doug, its journey continues within the air, 67 continues on down to the surface in the 324 as does the returning 24+78 thusly:
67+24+78+155=324
A better constructed cartoon with all the arrows divided into lots like that for the 324 would not have faked Doug out so badly, but the cartoon was meant for pros. Dr. Spencer’s test only picked up a small part of this 324, as it viewed a small section of sky with cloud, but there it is – proved by his test.
Doug – “What Hansen and Pierrehumbert have written proves nothing at all about why the mean surface temperature is about 288K.”
I checked their written words carefully Doug, and they did write about the 324, the 67 and the 390 (the 288K), and the 235 (the 255K) consistent with the KT97 cartoon, consistent with the test Dr. Spencer performed, and consistent with 1LOT and 2LOT.
And you are right, it is not that hard to understand 288K-255K=33K. It works exactly, I mean exactly, the same on Venus (737K surface-185K TOA = 552) higher because there are no windows past 3 microns there due the immense pressure & composition so find the opacity of the atm. much higher than that of Earth.
Doug – You can’t poof the 67 out of existence and you even wrote about the 390 correctly just a few minutes ago, then you miss it entirely, here is the proper KT97 arrow accounting correctly showing the 390 and 67:
(168+67+78+24)in – (390+78+24-155)out = 235in – 235out = balanced at surface w/Tmedian=288K (the 390), 255K at TOA (the 235).
Hi Doug,
Your last correction seems to make even less sense! You seem to support Ball4’s appraisal of your statement. If the sun imparts no thermal energy to the surface via direct solar radiation impinging the surface, how then can a magnifying glass or concave mirror heat an object by concentrating visible spectrum solar radiation on any given surface? Please explain your statement clearly and think your answer through so far you appear confused. Please clarify before any discussion of your paper.
Have a great day!
Hi DJC,
Thank you for further clarification. Your writings will no doubt provide even more. Thanks again.
Have a great day!
Hi Doug,
Thank you for responding. If you seriously claim that direct solar radiation impinging the Earth’s surface transfers no thermal energy to or as you say into the surface then how can a magnifying glass or concave mirror heat a surface by concentrating sunlight on any given surface. Or how did Sir William Herschel discover infrared energy using a prism and observing that the SOLAR radiation passing through the prism below the visible spectrum WARMED the surface of an object?
Have a great day!
JohnKl,
When your posts did not make it did you correctly type Doug’s name in your posts? I did this and neither of my posts went through. Doug gets them through by putting spaces between the letters. I think there is a blocking program for the correct combination of letters.
Hi Norman,
It’s good to communicate with you again. Thanks for the heads up it often seems difficult merely to leave a post around here.
Have a great day!
DJC,
test
DJC,
Question. Why do you believe your view of the atmospheric temperature anchor point is the correct view? It is backward from normal view so why is your view the right one?
You are assuming (not testing or verifying).
This article for pilots has actual proof you do not know what you are talking about.
https://avwxworkshops.com/etips/01-15-10.html
Read the article about lapse rate and you see that the surface sets the lapse rate and not the other way around. You believe that the top of the troposphere sets the surface temperature. Why do you believe this? Why does the upper troposphere have a given temperature? This is why you believe the wet lapse rate is cooling when actually it is warming. You should consider studying some meteorology since you have things so backward.
The surface sets the lapse rate and the cause of the lapse rate is expanding air as it rises losing energy because the molecules do work in pushing the surrounding air and cool. It DALR is equal to the gravity because gravity sets the hydrostatic pressure and it is the pressure difference that determines the rate of expansion and the energy lost in the expansion.
DJC,
The reason temperature drops near dawn is because it is reaching the dew point and at this point the water vapor in the air condenses releasing latent heat into the environment slowing the temperature drop.
DJC,
What evidence do you have, such as an experiment or proof that the 160 watt/m^2 solar energy will not be absorbed by the Earth’s surface. I need more than a mathematical theory, what test do you have to confirm the action of radiation and that it will just “bounce off…pseudo scatter…at the surface”? You can make these statements but what proof do you have for them?
Hi Norman,
By pseudo-scattering Doug apparently merely means absorption and immediate re-emission. From an energy balance standpoint it makes little difference as far as I can tell if a warm body absorbs radiation from a cooler one while simultaneously emitting the same quantum of internal energy or if it absorbs radiation from the cooler object and simultaneously emits it leaving internal energy unchanged. It seems you guys go on and on about something which for any practical purpose amounts to nothing. If on the other hand I’ve all this time missed some deep mystery of quantum micro relevance please let me know what it is. Thanks and…
Have a great day!
DJC
Yes Doug you refer to a math paper on the radiation hypothesis but no evidence is given only equations. Equations may or may not reflect reality, actual testing needs to be made available to confirm or reject the series of equations and none is given. What is science now to be a new belief system where supporting evidence is not required but only belief in the higher authority of one writing out equations?
Since you claim a physics degree (which I see no real evidence of in any of your posts) you should know Einsteins’s theory of Relativity was not accepted until confirming proof of light bending around an eclipse was actually observed.
Doug you do not seem to read posts. The incoming Solar radiation alone does not tell the story. If all the radiation could leave freely the Earth would be much colder, the atmosphere redirects the outward radiation flux. The NET RADIATION of the moon and Earth are different.
DJC,
Ball4 seems to have incredible patience. A trait to be admired in this hostile hurry world. You directly call him a liar and he just responds with factual posts you made at some point.
Anyway he is trying to help educate you.
I will also try with an different tactic. You do not understand radiation physics and many have tried to explain it to you, all attempts have failed so I will try a new approach.
You have this tank that can hold 10,000 gallons of water. At the start it is filled with 5000 gallons.
Here are some following cases. If you add 100 gallons/minute (GPM) how fast will the tank fill up? Maybe you would claim 50 minutes? This would be correct if no water was leaving. What if you have a drain valve open at the bottom of the tank, now how fast will the tank fill up? Would it not depend on how fast the drain valve was opened?
So if you have 100 GPM going in or another case of 10 GPM going in which will fill the tank the fastest? It would depend on the drain valve. If the drain valve was open to allow 100 GPM to drain in the first case but closed with the 10 GPM flow, the 10 GPM flow would fill the tank.
I think many people do not understand the concept Ball4 is claiming about NET RADIATION! They only look at how much energy is going into a surface and ignore how much is leaving.
With the Stefan-Boltzmann law to determine how warm a surface will get in a constant radiation flux. You use this equation backwards as I had done on another thread, and reach a wrong conclusion.
The temperature of a black-body in a 1300 watt/m^2 radiation flux reaches 120 C because a surface at that temp will radiate 1300 watt/m^2. But it will not determine the surface temperature if the outgoing radiation is redirected to the surface. The temperature of the surface will rise to the point that 1300 watt/m^2 can leave the system which can be above 120 C.
Hi Doug J Cotton,
How do you purport to know the temperature of Uranus at the surface? Please don’t tell me a thermometer.
Have a great day!
DJC,
I do perfectly understand Stefan-Boltzmann. You are the one lacking in physics here. You cannot comprehend NET RADIATION. My water tank example was given to help you understand NET but you still cannnot. Why? What is the mental block in your head that cannot see radiation is a two way event (IN and OUT). Like the water in and out of the tank. The radiation in will not help you understand the surface temperature until you also measure the outflow of radiant energy.
Can you answer why you do not understand NET RADIATION?
Doug I reread Ball4’s post on the 67 watts and he says it reaches the surface. It is absorbed in the atmosphere and becomes part of the downward flux of IR that you can see in these actual measured values. Something you avoid like doing a test is a disease below your pure reasoning mind.
http://www.esrl.noaa.gov/gmd/grad/surfrad/dataplot.html
click on Downwelling and upwelling IR and plot a graph to see the energy that Ball4 is talking about.
Doug – “Radiation from a cooler source only gets pseudo-scattered by a target that is already warmer. The computational proof..”
Computations can be wrong, proper tests are not. You will need to link, ref., and./or show the proper test results demonstrating pseudo-scattering exists. You know, just a simple test – like the one Dr. Spencer did which proves no psuedo-scattering as you describe exists in nature. The black curve trended down, raising the measured T of the warmer water viewing the colder cirrus over the shaded water sample, the pencil rays from the colder cirrus were demonstrated NOT psuedo-scattered by the warmer water.
No pseudo-scattering exists herein (there is emissivity, reflectivity, and transmissivity though):
http://www.drroyspencer.com/2015/06/can-infrared-radiation-warm-a-water-body-part-ii/
“There are ample examples of pseudo scattering..
There are no proper examples found in reading your writings Doug, pseudo-scattering as you describe was disproved by Dr. Spencer’s linked test when the black trended down not up.
Doug – “No, Ball4 responds with more lies, saying the 67W/m^2 in the diagram is absorbed by the surface, when the diagram shows it absorbed by the atmosphere.”
What I wrote is properly the air does absorb the 67 as shown, the air then emits the 67 to the surface in balance as shown. Pretty simple math Doug. Air emits incident radiation on surface per your KT97 cartoon link:
67+24+78+155=324
“..just like he lied about there being certain calculations about Singapore in my paper.”
Doug’s own writings contain Singapore site, right in this thread as I demonstrated:
Doug 5:54pm: “It has less greenhouse gas (water vapour) above it than does Singapore.”
“In many other comments he refers to fictitious citations which he never bothers to link..”
Already did, by non-fiction citation, page number, paragraph in another thread. It was a lot of work, go find the thread Doug. Sticking your head in sand is not the science method. The correct calculations are out there, freely accessible by wary readers doing the research, proving yours are incorrect at each site you pick following an incorrect template. Satellite observations of precipitable water in the column are available for actual measurement.
Wary readers will not go to your video until you issue your required written corrigenda to agree with observed tests.
DJC
Here is a great video to demonstrate to you how you do not understand the Second Law of thermodynamics at all.
https://www.youtube.com/watch?v=0qmO47–m6g
How hot do you think the surface of the mirror is? The man is touching the body of the mirror numerous times. Yet this cool mirror is boiling water or starting a fire. How can this be? How can this much colder mirror heat water to boiling?
DJC
The first thing is you have to overcome your delusion that you are a physics honor student. It is not possible that you could be this honor student at University level physics and not understand that expanding gases cool by pushing against the surrounding gas. No way so you might as well stop now.
The mirror is just to let you know you cannot determine how much radiation is being redirected by something based upon its own temperature. If you just measured the temperature of the mirror knowing nothing else how could you tell what is going on with the radiation? That is the point but you do not understand it I know it is a waste of time explaining it.
Carbon Dioxide is an individual oscillator. The molecule itself can absorb an IR photon and emit one. It is not like a black body or gray surface which are a conglomerate multiple oscillator. The CO2 or H2O are like a music string that will vibrate at certain frequencies. You have to start looking at these molecules like that. They can act much like a mirror in how they redirect energy.
As a Chemistry major we worked with IR spectrometers in our lab. The temperature of the absorbing media is not considered in the equation Beer’s law.
http://teaching.shu.ac.uk/hwb/chemistry/tutorials/molspec/beers1.htm
The molecules within the fluid you are testing absorb the incoming IR then of course they can reemit but it will be in all directions and so far less input energy will be hitting the photocell on the other end.
Not expecting much of understanding on your part or even an ounce of consideration.
DJC
Your test of the cylinder is not correct in understanding expanding gases. I do not know if it is possible to explain it to you as you will probably get it wrong.
Way back when in the age when a real scientist did experiments they took a compressed gas and released it into a vacuum and it did not cool. Why? It was not doing any work on the surrounding gas. This is why your example fails and shows you really do not understand the process and no one in this universe will be able to explain it to you. You have the high pressure cool gas expanding into a low pressure hot gas and wonder why it does not cool. It is not doing work against the low pressure gas to expand it, it is just expanding (similar to the earlier compressed gas into a vacuum flask test where no temperature change took place), so it is not doing work to move the molecules of the hot low pressure gas. Do you want to even try to understand??
On the other hand, if one were to expand the compressed gas by moving it vertically along a density gradient within a gravitational field would it cool?
The experiment referred to was in the horizontal plane and so no net work was done with or against gravity.
Stephen: “if one were to expand the compressed gas by moving it vertically along a density gradient within a gravitational field would it cool?”
Sure, if P down, density down, then compute mean T down along that adiabat. Gas law: P=density*R*T.
Wow, this thread looks different…
🙂
Well then, it seems to me that by observing the change in temperature of a gas as it moves into a region of lower pressure (no work done on surrounding molecules) along the adiabat and comparing that to the lack of change in the temperature of a gas as it expands into a region of lower pressure in the horizontal plane we have effectively demonstrated that the work done in adiabatic uplift is done against gravity and not against surrounding molecules.
Stephen – “the lack of change in the temperature of a gas as it expands into a region of lower pressure in the horizontal plane”
There is no lack of T change expanding horizontally in a horizontal pressure gradient: if P down, density down, then compute mean T down along that adiabat. Gas law: P=density*R*T.
If it expands horizontally there is no net movement along the adiabat.
Norman previously said:
“You have the high pressure cool gas expanding into a low pressure hot gas and wonder why it does not cool. It is not doing work against the low pressure gas to expand it, it is just expanding (similar to the earlier compressed gas into a vacuum flask test where no temperature change took place), so it is not doing work to move the molecules of the hot low pressure gas.”
There is horizontal movement if pressure gradient, take a look at the isobars on a weather map, find where it is more windy.
Stephen’s own words: “…of a gas as it moves into a region of lower pressure…it expands into a region of lower pressure in the horizontal plane..”
Ball4,
It is correct that out in the wider atmosphere there is always a height change associated with horizontal movement and so there is always a temperature change.
However if there is no height change there is no temperature change if expansion occurs into a region of lower pressure at the same height.
That is what the well known experiment shows you.
It is that essential difference that demonstrates that the temperature change is due to work against gravity and not work against surrounding molecules when upward convection pushes into a region of lower pressure above.
Stephen – If P down, density down, then compute mean T down. Gas law: P=density*R*T. Doesn’t matter if z changed or not, it’s the law. Presssure changes horizontally too. The wind magnitude and direction is deduced from isobars.
Stephen Wilde,
I think I am incorrect in what I stated. I think the reason the compressed gas temperature does not go up in the enclosed cylinder is there is nowhere for the low pressure gas to get moved out of the way of the higher pressure gas and no work is done in moving the low pressure gas. I think you might need a flexible material to blow your compressed gas into.
Stephen, a compressed gas will definitely cool if you release it to low pressure atmosphere and it has NOTHING to do with gravity. As I told Doug to try long ago, take a computer dusting can of compressed gas. When you release the gas it gets very cold in the stream and you can prove completely that it is not gravity by directing the stream downward (in which case gravity should warm it slightly) or facing it upward so that the stream moves against gravity. Measure both ways and see if you notice a difference. I strongly suspect you will not but I have not done this one yet. But the cooling effect of compressed gas released into lower pressure gas has nothing to do with gravity. I think the amount of cooling will be based upon the actual pressure difference. The higher the pressure of the can, the cooler the expanding stream will be since it will expand more, push out more air particles and have to do more work in moving them. I do get things wrong but I will keep thinking about them and try my best to get it right and learn along the way.
Norman,
I think this has become confused, partly my fault.
A movement into lower pressure will still involve molecules moving apart which involves cooling due to the increase in space between the molecules even if no height change is involved but that cooling is still work done against gravity because it is the compressive force of gravity that initially created the higher pressure.
If one is considering compressed air previously forced into a container by machanical means then that is different from adiabatic movement within an atmosphere because the initial compression involved work done by means other than gravity which is then reversed again when the release occurred.In that case the more violent expansion pushes surrounding molecules away further and faster than would be possible in a natural expansion due to adiabatic uplift or descent. That does involve work done against surrounding molecules but it is an articial diabatic process and not adiabatic as within atmospheric convection.
There is no work done against the surrounding molecules when air expands into a lower pressure region naturally and adiabatically without additional work being recovered from artificial mechanical compression.
What then do we make of the experiment that showed that a gas expanding into a vacuum with no height change involved did not show any change in temperature?
If the expansion was within a gravitational field then there should have been a temperature change shouldn’t there?
and see here:
https://en.wikipedia.org/wiki/Joule%E2%80%93Thomson_effect
“As a gas expands, the average distance between molecules grows. Because of the attractive part of the intermolecular force, expansion causes an increase in the potential energy of the gas. If no external work is extracted in the process and no heat is transferred, the total energy of the gas remains the same because of the conservation of energy. The increase in potential energy thus implies a decrease in kinetic energy and therefore in temperature.”
Since no adiabatic process is perfect one can have some work being done on surrounding molecules during uplift but that still leaves the adiabatic portion which is work done against gravity alone.
It may be a matter of free expansion (not reversible) as against reversible isothermal expansion:
http://web.mit.edu/16.unified/www/FALL/thermodynamics/notes/node33.html
In free expansion there is no temperature change and thus no work against either surrounding molecules or gravity.
However if one moves a gas up or down within a gravitational field then work is done in relation to gravity.
If one then moves the air into a region of equal or higher pressure then there is work done against surrounding molecules as well.
It remains the case however that expanding air into a region of lower pressure at a greater height involves work against gravity only.
Another way to look at it is this:
If one allows higher pressure air to flow adiabatically into a lower pressure region within a gravitational field whilst preventing any net vertical displacement then half the molecules will move upward and become less dense whilst half move downward and become more dense.
The net change in density and temperature being zero because no net work is then being done in relation to gravity.
Nor is there any work being done against molecules in the lower pressure region otherwise there would be a temperature change from that but we observe none.In order for work to be done against surrounding molecules the receiving region must be at the same or higher pressure than the donor region.
The free expansion illustration excludes any net work done against gravity because potential energy for an ideal gas is set at zero.
As soon as net work is done in relation to gravity then the number for potential energy becomes non zero and the temperature can then change along with volume and pressure.
Stephen Wilde
I believe your understanding is very similar to DJC. I can’t say for certain but I do think it is correct. I like new ideas as they promote thought.
Here is why I think your ideas are not right (although they could be testing to verify would be much better than endless debate but in the process learning takes place). I think your convection idea that would heat the Earth’s surface above S-B calculations has some mistakes. One I believe it is a zero sum process similar to a pulley system with a two weights opposite of each other. The energy gained by the falling weight is removed by the rising weight on the opposite side so no net energy gain takes place. If air is sinking and warming at one location, somewhere else air has to be rising to fill the hole or you would end up with vacuums in the atmosphere. The surface warmed by the sinking air would have another area cooling by the same amount from rising air removing heat from the surface.
Also your idea can in no way explain than why the surface would not cool very fast. If no GHE was taking place then the Earth’s surface emission of IR (averages around 390 watts/m^2) would rapidly cool the surface and your theory would make things worse as the compressed heated air would heat the surface causing it to radiate away at a faster rate and cooling.
I think maybe people on this blog have an incorrect view of kinetic energy of a bulk object and the kinetic energy of individual molecules (which indicates an object’s temperature). The kinetic energy of a bulk object like a cannon ball is described in the equation K.E.=mv^2 only the mass of the object and its velocity are relevant in the equation not its temperature.
You seem to believe (and I think incorrectly and experiments could prove or disprove your position)_ that the individual molecules of the bulk gas that is rising will cool as they move upward. I believe only the kinetic energy of the bulk mass is the one affected, the parcel of gas moving upward will slow down because of gravity and eventually stop rising but I fail to see why the individual molecules in this bulk of air will have their own energy changed. I think this is a flawed and incorrect view of kinetic energy. Here is a real easy test one could perform to see if there is validity to this concept. You could take two identical heated objects. One remains at level as a control, the other is rapidly moved upward (maybe by a long pulley on a tall building). Assume both objects are well insulated as to minimize the interaction with the environment. If your idea is correct the object that is moving upward will cool off since you believe the individual molecules are losing kinetic energy in moving upward. I am of the opinion that only the bulk object will lose kinetic energy and the individual molecular kinetic energy will not be changed by vertical motion in a gravity field.
Stephen Wilde says:
“…cooling due to an increase in space between the molecules…”
There is no cohesion in ideal gases* and hence no work is done against attractive forces between the molecules as they disperse; and YOUR COOLING PHENOMENON DOES NOT EXIST. Gay-Lussac (of Gay-Lussac’s Law)showed two hundred years ago that air expanding freely and without violence into a vacuum does not cool (Gilbert’s Annales, xxx, 1808, p 249). Joule (of the unit of energy) confirmed this, to the limits of his apparatus. Later, he and W Thomson (later Lord Kelvin) investigated the subject of the Wikipedia article you irrelevantly mention – namely gases being forced through a nozzle.
Or see Volume IV of “A Textbook of Physics” by J J Thomson and J Poynting, 1920. Of course, the first author was merely the discoverer of the electron, and the second merely the discoverer of the laws of radiation power.
* The simple molecules of oxygen and nitrogen at ordinary temperatures and pressures form nearly ideal gases.
Umm.
Perhaps Mr Wilde has the idea that the reduction in the amount of heat energy in a c.c. of SPACE as a gas expands is somehow equivalent to a drop in temperature? He uses “increase in space” as a CAUSE of cooling.
Hi DJC,
Thank you for the clarification that your generalization proved incorrect. Btw, magnifying glasses and concave mirrors concentrate solar energy but prisms do not. Prisms merely slow incoming radiation (refraction) splitting it into an observable spectrum. Herschel’s experiment directly refuted your claim and proved even low energy solar IR can reach the Earth’s surface and warm it. Your claim that direct solar IR impinging the surface cannot account for surface temps seems probable since much incoming solar gets absorbed by the atmosphere. The amount you believe it can warm the surface depends on the assumptions you’ve made in your energy budget which may or may no bear any relation to reality at all.
Have a great day!
DJC,
Your Mt. Everest example demonstrates your lack of understanding of any type of thermodynamics. You totally do not understand how to apply S-B temperature in any real way. A 1000 W/m^2 flux would get a surface to reach 91 C if the flux was constant (you don’t seem to understand thermal inertia, it takes time for materials to heat up before they can reach the equilibrium radiation temperature of the S-B equation) and there was nothing else to remove energy like surrounding air. In a vacuum there is no material to remove any surface energy so it is all by radiation. Mt Everest air temp is very cold (because of the lapse rate) and even with energy flowing into the rock the rock is in contact with cold air that is removing the energy at a rapid rate and so the rock does not warm quickly but I do not know how much it will warm to, do you have actual rock surface temperature measurements or are you pulling things out of the air to sound smart like your Uranus posts.
Doug:
You may be interested in a new paper at Hockey Schtick. Also the reference to Feynman’s Lectures, chapter 40; both have relevance for your work.
Nonetheless, I wonder whether we are not comparing apples and pears. The likes of Dr Spencer do want to be able to determine changes in the T over time and one component may be CO2/H2O, perhaps at a lower sensitivity which Roy has often suggested.
There is no doubt we have warmed over the last 100 years. What has caused that? Your hypothesis will not be able to answer it as I doubt whether there can have been sufficient change in insolation or specific heat of the atmosphere.
David Appell
If you visit this thread again, somewhere way up you responded to one of my posts with the faint sun hypothesis. It has created a conflict as to why the world was not an ice-ball planet back then.
Here is a paper with a possible explanation.
http://arxiv.org/pdf/astro-ph/0612321v2.pdf
gbaikie, Roy and others:
Yes indeed. It is “about absorbed [stored] energy” as you say. You’ll find my hypothesis is about energy that has been trapped (by gravity) “under” the sloping thermal plane over the life of the planet.
And, because you now admit that fact, you are agreeing that the solar radiation is having no effect in typical early morning and late afternoon situations I described. Unfortunately for the GH advocates, it has to be having an effect, for otherwise their mean solar radiation (and their assumed temperature supposedly caused by that radiation) is invalidated, because the calculation of their mean includes all these situations and locations (probably more than 80% of the sunlit hemisphere) where they should not be counting the solar radiation because it’s not having any warming effect.
By the time you have spent three or four hours really studying the two papers linked from the ‘Evidence‘ page the penny will drop (if I can assume you are an intelligent person with a grasp of physics) and you will realize that all the pieces of the jigsaw fit together. Radiation can’t explain it: gravity can and does – throughout the Solar System.
Just remember, 168W/m^2 of direct solar radiation can’t explain a mean surface temperature above -40°C. You can’t turn around then and say we should add the radiation from the atmosphere. All the radiation in all directions between the surface and the atmosphere is only cooling the surface and causing a transfer of thermal energy out of the surface. You can’t add just the downward radiation and say its value can be included in Stefan Boltzmann calculations. But even if you do (incorrectly) do that, so that even if you think you can use (168+324)W/m^2 in S-B calculations, the mean temperature that a uniform flux (24 hours a day) of 492W/m^2 striking a flat Earth (without an atmosphere) would produce is 32°C. But we don’t have that kind of Earth, and when the mean is really made up of quite variable flux (sometimes up to 1,000W/m^2) and that variable flux has a mean of 492W/m^2, then I’m afraid to have to tell you that the mean temperature achieved would be below 0°C. And it gets worse, because at the top of Mt Everest, even though we know why, the solar radiation of around 1,000W/m^2 on a clear summer day does not achieve anything like the calculated value of 91°C. So everywhere that we think S-B is explaining the temperature it is doing no such thing because the Earth is not only not flat, but it’s also rotating and the Sun doesn’t have enough time in the day to achieve S-B temperatures. So much of the day’s solar radiation is not used to raise the maximum temperature, but to make the nights less cold. And remember, you really shouldn’t have added the back radiation anyway.
PS – My blog that accepts comments is on FaceBook where I have a group of about 170 members at: https://www.facebook.com/groups/689409151120443/
Ball4,
It is correct that out in the wider atmosphere there is always a height change associated with horizontal movement and so there is always a temperature change.
However if there is no height change there is no temperature change if expansion occurs into a region of lower pressure at the same height.
That is what the well known experiment shows you.
It is that essential difference that demonstrates that the temperature change is due to work against gravity and not work against surrounding molecules when upward convection pushes into a region of lower pressure above.
Getting back to the subject of the thread: Roy, it seems like your data pretty directly conflict with other data such as Soden et al. (http://www.sciencemag.org/content/310/5749/841.abstract) and Dessler & co. (as summarized here: http://www.sciencemag.org/content/323/5917/1020.summary) that do clearly see the radiative signatures for moistening of the upper troposphere with increasing temperatures, especially robust for temperature fluctuations such as those due to ENSO (the long term secular trends being more susceptible to artifacts). Can you reconcile them?
Getting back to the subject of the thread: Roy, it seems like your data pretty directly conflict with other data such as Soden et al. (http://www.sciencemag.org/content/310/5749/841.abstract) and D*ssler & co. (as summarized here: http://www.sciencemag.org/content/323/5917/1020.summary) that do clearly see the radiative signatures for moistening of the upper troposphere with increasing temperatures, especially robust for temperature fluctuations such as those due to ENSO (the long term secular trends being more susceptible to artifacts). Can you reconcile them?
Another way to look at it is this:
If one allows higher pressure air to flow adiabatically into a lower pressure region within a gravitational field whilst preventing any net vertical displacement then half the molecules will move upward and become less dense whilst half move downward and become more dense.
The net change in density and temperature being zero because no net work is then being done in relation to gravity.
Nor is there any work being done against molecules in the lower pressure region otherwise there would be a temperature change from that but we observe none.In order for work to be done against surrounding molecules the receiving region must be at the same or higher pressure than the donor region.
The free expansion illustration excludes any net work done against gravity because potential energy for an ideal gas is set at zero.
As soon as net work is done in relation to gravity then the number for potential energy becomes non zero and the temperature can then change along with volume and pressure.
The earth is an open or at least a closed system, not an isolated system. Gravitation can not explain why the stationary surface temperature is higher than the effective radiation temperature.
Someday, humanity may experience some difference that makes a difference, like that between spheres and bubbles. In the meantime, convergence will happen one way or the other, the sustainable or the unsustainable. The Bread-and-Butterfly always dies, remember? Gregory Bateson solved that riddle…