With the rapid cooling now occurring in the global average tropospheric temperature, my previous prediction of a record warm year in the satellite data for 2016 looks…well…premature.
Here’s an update of what the average temperature trend would have to be in the next 6 months for 2016 to tie 1998 as record warmest year in the 38 year satellite record:
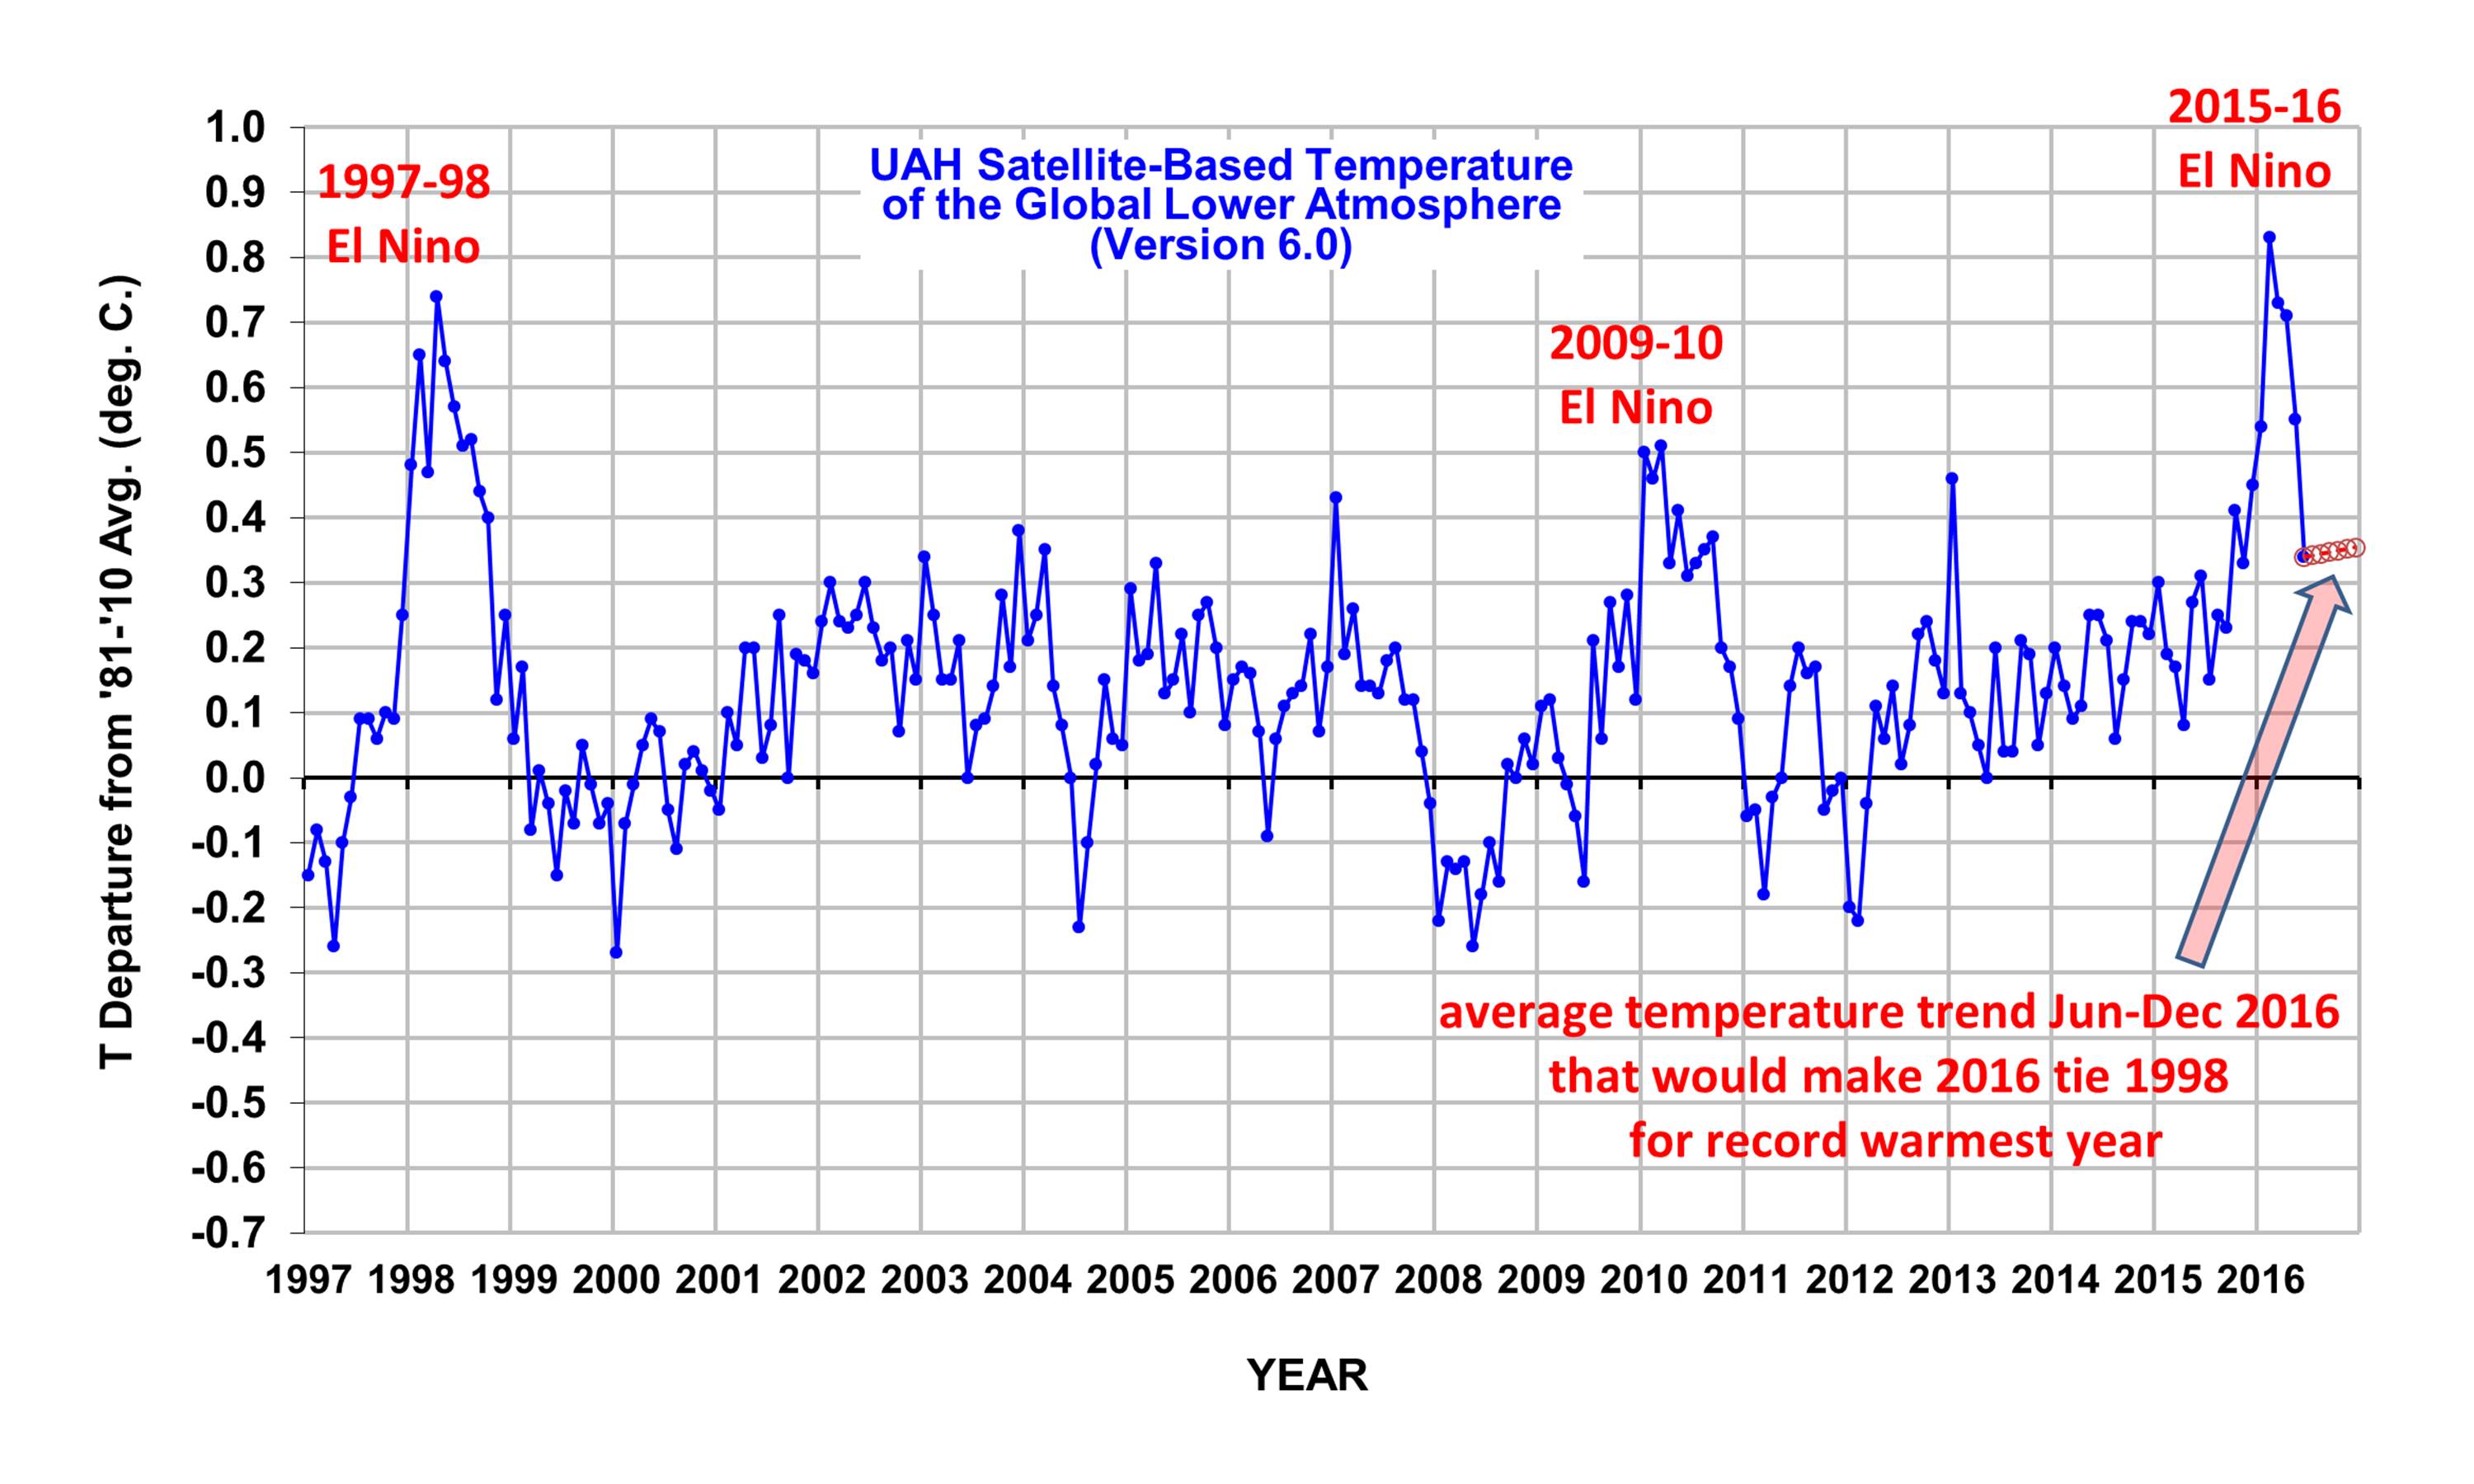
Basically, as long as the anomalies stay below the June value of 0.34 deg. C, 2016 won’t be a record warm year.
If only I had kept my mouth shut nine days ago….
“If only I had kept my mouth shut nine days ago…”
You were just getting your retaliation in first, against the trolls.
Now, temperature anomalies will probably jump up again! Murphy’s Law.
It’s too soon to tell.
But likely NOT the ‘Warmest June Evah’. Will be very interesting to see how this progresses.
Physically impossible for the present La Nina to reverse itself. It will continue to cool. If you can find an AGW zealot who is dumb enough to offer a wager, grab it.
mpainter, you were offered a wager, and you did not take it.
Wrong, Inquirer, I stipulated conditions that were refused. Go back and read the thread carefully.
The stake mpainter suggested was “accept the other person’s view.” No terms were stipulated by mpainter (he offered nothing to bet on). Several of my terms were refused or ignored. My suggested stake was also refused.
mpainter says:
June 24, 2016 at 1:08 AM
This is science, Im not interested in any money aspect. Dont care to collect if I win.
So lets keep it science. The loser of the wager will acknowledge the truth of the others position. Thats as it should be.
###
You refused these conditions, and started talking about me “putting your money where your mouth is”. I got disgusted, and I still am, especially at having to to rehash this. Your last comment was to propose a new wager with new terms. I invite anyone with an interest in this banal affair to go read the thread.
As I predicted – and I risked $10.
The irony is that he missed out on a wager concerning 2016 as a record warm year.
If he had the courage of his convictions he would now be in an apparently winning position.
He being mpainter.
No interest in money. I claim vindication. The gta is dropping like a rock. I predict that the UAH December anomaly will be at the baseline, or below. We will see a negative trend established within a year. I predict that governments worldwide will forget about their commitments under COP21. In fact, this has already begun. Germany is the latest. Ma Nature has turned the spike into a coffin nail, AGW RIP.
That is, during 2017.
Now this is like stepping into something foul and not being able to get it off your shoe.
###
No sooner said than look who shows up: exhibit A
mpainter. I did reread. I did not see any stipulations from you. And the parameters offered to you were certainly fair — coming from an AGW activist. While betting on temperature may be attractive to some people, I usually hesitate on such bets because of the multitude of adjustments done to temperatures; and I especially hesitate on adjusted temperature series that do not match known climatic phenomenon such as ice extent, record temperatures and heat waves. However, you were offered the UAH temperature series which does not exhibit internally inconsistent adjusted data.
My offered bets — none of which have been taken — typically center on predicted catastrophic consequences. And AGW activists are wise not to take them because climate-induced catastrophes are not increasing.
Cannot believe you re-read. See above. Barry grasped the stipulations without problem, so what’s yours, Inquirer?
Okay. I did not see that as stipulation or condition, but now with a little more discussion, I see it as substitute “stake” rather than the $50 “stake.”
Your proposed stake is a harsh one — and probably only a confident person would propose it!
“I predict that… we will see a negative trend established within a year.”
Say by June 30 next year?
What is the start date for this prediction? January 1998?
Sorry if I seem a little bit testy. I made the decision to have no further wager discussion with Barry for personal reasons. Now this is like stepping into something foul and not being able to get it off your shoe.
Your point about the reliability of UAH, and it’s aptitude as the basis for such a wager, is well taken. Certainly the the adjustments to surface datasets make these a most dubious basis for such a wager. Unless one is betting on the amount of adjustment over a certain time. Or how much they dare to adjust.☺
Can you also extrapolate a line for the coldest year of the satellite record? It seems a more likely scenario right now 😉
I could…but it would have to get unrealistically cold. The year started off too warm to have any chance of that happening.
Hmmm, I’ll stick with what I said 8 days age 🙂
June 23, 2016
AMO peaked wicked high at the end of the last two big el Ninos, 1998 & 2010 That is not happening this year. My bet is temps will dip a bit quicker than they did in 2010 and 1998
http://woodfortrees.org/plot/esrl-amo/from:1996.6/to:2015.3/plot/esrl-amo/from:2015.2/plot/esrl-amo/from:1997.29/to:1998.4/plot/esrl-amo/from:2009.58/to:2010.33
Well played, sir! I personally was predicting 0.42C for June, obviously I overshot it. But, there are still 6 months to go, consider this a temporary victory! Whether 2016 sets a new record or not for warmest year does not matter to me. Nature does what nature does.
This el nino is higher amplitude but shorter duration than 97 98… i bet it ends up with half the total heat above the 0.3 deg C line as 97 98 had. Each el nino reshapes my understanding of the phenomenon… this one is shaped like a pensil and will really be reduced in a running average to smooth noise. I dont think it will be close to being the warmest year in a 5 month or even 3month running average.
For me, an 11 or 13 month running average is meaningful to answer the question is the earth warming annually.
What index are you using for duration? Using ONI (SSTs Nino3.4), this el Nino has lasted longer (earlier start).
Ahh true.. i was talking in UAH satellite. But agreed the response (global temperature peak) doesnt match the nino 3.4 signal (tropical pacific). Any thoughts why?
UAH global temperatures warmed up earlier in 2015 than they did in 1997.
UAH tropical SSTs warmed up earlier in 2015 than they did in 1997.
Here’s global UAH. Top frame is 18 months from Jan 1997, bottom frame is 18 months from Jan 2015.
http://i1006.photobucket.com/albums/af185/barryschwarz/UAH%206.5%20evolution%201997%20-%20June%201998%20and%202015%20-%20June%202016_zpsudgiewty.png
Temps were already warm in early 2015 comparatively, correlating with already warm tropical SSTs. ONI monthly puts May 1997 as the first month of sustained Nino values. In 2015 it was a month earlier, in April.
http://www.cpc.ncep.noaa.gov/products/analysis_monitoring/ensostuff/detrend.nino34.ascii.txt
Here’s the 17 month tropical SSTs evolution for the 17 months from Jan 1997 (top) and 2015 (bottom).
http://i1006.photobucket.com/albums/af185/barryschwarz/UAH%206.5%20tropical%20ssts%201997%202015%2017%20months%20evolution_zpszjsm99tk.png
2015 had warmer tropical SSTs than 2017 except for July and December, and got warmer sooner in the year.
The earlier start to the Nino phase in 2015 is consistent with the earlier and more elevated warm tropical SST temps in 2015.
Weather variability plays a part. Tiny chunks of data say little about climate.
Doubtful whether 2016 el Nino had a higher amplitude than 1998. SSTs were warmer. El Nino indices (which are detrended against global temperature change) are about equal for both events over the 4 months centred on peak el Nino.
It’s difficult to compare month to month the ONI ENSO index (Nino3.4 SSTs) and the lower troposphere temperature, owing to a time lag of a few months.
Peak temperature one month
1998 0.743C (April)
2016 0.832C (February)
But…
ONI peak 4-month temps
1997/8
Oct 2.24
Nov 2.32
Dec 2.23
Jan 2.21
2015/6
Oct 2.03
Nov 2.36
Dec 2.31
Jan 2.23
Averages:
1997/8 = 2.25
2015/6 = 2.23
The warmest month between those (ONI) was Nov 2015.
El Nino is defined as a 5-month period of sustained temps beyond a certain threshhold (0.5C in ONI index, averaged tri-monthly), so it seemed proper to base peak Nino on 4-month average.
If you centre a 3-month average on the warmest month (ONI) you get:
1997/8 = 2.26
2015/6 = 2.23
At temp differences of hundredths of a degree per month, it’s too hard to pick out ENSO-driven variation from weather variation. The resulting temperature peak difference a few months later in the UAH record was 0.1C (Feb 2016 warmer than April 1997).
I’d call the ONI amplitude ‘comparable.’
This doesn’t seem correct.
This El Nino was 4 months in neutral territory and 6 months in quasi-El Nino territory before the El Nino started.
For all intents and purposes it was a two year El Nino.
The 1998 El Nino was a 13 month El Nino that came straight out of a La Nina.
The North Atlantic trend (at least to me) indicates that the lack of overturn in the Pacific led to extensive deep ocean cooling in the Atlantic.
Now that normal upwelling is occurring things could get cold fast.
The Blob is the big difference between 1998 and 2016.
The blob. I almost forgot about that one but good point (s).
I’m really curious what is going to happen.
You have to go back to 1957 to find an El Nino that lasted as long. And that was a weaker El Nino.
1982 came out of a La Nina.
1951 was the start of a three year period above neutral.
The trend seems to be: long El Nino – temperature is going down, short strong El Nino temperature is going up.
We’ll see. Whatever happens by 2020 is going to be enlightening one way or the other.
http://www.cpc.ncep.noaa.gov/products/analysis_monitoring/ensostuff/ensoyears.shtml
Now for some SCIENCE.
I have just decided to plot the UAH data like Roy does.
.
With one difference.
.
I plot the full set of values from 1979 to June 2016 (I recommend you try it, it is not difficult to do)
.
The graph is extraordinary given the obsessive focus by some on the short-term period 1998 onwards.
.
It shows a VERY CLEAR upward trend in the values. You would have to be blind not to see it.
.
The trend line corresponds to a an increase of +1.2 degrees per century.
The correlation coefficient [r] is +0.58.
The number of points is 450.
Taking into account auto-correlation, the degrees of freedom is estimated to be 38.
The associated probability [p] is 0.00013533
.
In other words, the UAH data shows a CLEAR and STATISTICALLY SIGNIFICANT increase over time.
.
People here who dispute this incontovertible FACT need to do some work and demonstrate otherwise.
Is that any different that whet the climate has been doing since the seventeen hundreds. I think not, we been warming since the little ice age, the only real question is when will it stop. I personal think we a due for a downturn soon and that is not good, after all the French Revolution was launched over the cooling climate and crop failure and we have far more people now than we did then. Remember warm is good cold is bad and if you don’t believe that good help you and you offspring and their offspring or hopefully several more generation can enjoy a warming world, if the world is not warming it cooling and the future generation that live in that world will end up paying the awful price when the climate cools, the question on cooling is not if it going to happen the only question is when going to happen. Warming not the only question there is when it stops.
— Mark Luhman says:
July 1, 2016 at 9:19 PM
Is that any different that whet the climate has been doing since the seventeen hundreds. I think not, we been warming since the little ice age, the only real question is when will it stop–
Yes and the nature of our current Solar Min, makes that rather uncertain. I would general guess that it will not cool
to level of 1970’s within 2 decades. On upside, I don’t we get a peak temperature higher than peak temperature during Medieval Warm Period or highest average temperature of decade being higher.
So it can be said that we are at highest temperatures in last 400 year, but can’t be said we are highest temperature in last 1000 years. But due to inaccurate measurements within the next few decades we might at around the same temperature and warmest periods of 1000 years. Though there is no reason to assume we will become as warm as warmest period within last 7000 years- or in such long term trend it is a very gradual cooling- within the next couple centuries.
“I personal think we a due for a downturn soon and that is not good, after all the French Revolution was launched over the cooling climate and crop failure and we have far more people now than we did then. ”
I don’t expect such dramatic cooling as possible within the next 2 centuries, though it would be quite bad if were to drop more than .5 C within couple centuries or within 1 century, which is possible- depending on the sun activity [[and volcanic activity [though huge volcanic activity would change to that outlook- but huge volcanic activity has more severe problems other than air temperature]]].
Well…
Solar flux is down to 1900 levels. That should lead to early 20th century temperatures.
But the 30s and 40s weren’t a lot colder than today so while it may get cool it will do it slowly.
— PA says:
July 4, 2016 at 8:18 PM
Well
Solar flux is down to 1900 levels. That should lead to early 20th century temperatures.–
Sea levels have risen by about 8″ since 1900 levels which indicates that entire ocean has warmed. If you get a trend
of 2 mm decline in sea levels over decades or sudden drop of 2″, then it’s indication that we could return to 1900 levels.
Or in 1900 AD earth was recovering from Little Ice Age, during the LIA, sea levels dropped and glacier advanced.
http://www1.lsbu.ac.uk/water/images/maximum_density.gif
The bottom half of the ocean could be cooling and it would have little effect on sea level.
The top half we have data on.
The ocean warming started before the CO2 and there seems to be little interest in teasing the CO2 induced and natural warming apart.
Reducing CO2 will have zero effect on the natural warming.
Treating all the sea level rise induced by warming as CO2 caused will result in a 2X or greater overestimation of the CO2 effect on sea level.
I’m interested in the 0-2000 heat content (which is a silly figure because the probes measure temperature not heat content).
If that goes negative and there are still claims of rising sea level, the satellite measured sea level methodology needs to be examined to find out what they are doing wrong.
— PA says:
July 12, 2016 at 6:15 AM
http://www1.lsbu.ac.uk/water/images/maximum_density.gif
The bottom half of the ocean could be cooling and it would have little effect on sea level.–
That graph is for water, the ocean is saltwater.
A step-up is not a trend. See UAH June update for the satellite era global anomaly chart.
Saying it over and over does not make it true.
Show me your analysis of the data.
I wager you can’t.
I have shown you, several times. Put down your straight edge and go search previous threads.
As a general principle, a step-up is not a trend. But you can’t grasp that. Thank you for this illustration of the obtuseness of global warmers. Please stick around. You have more contributions to make, I’m sure.
The ONLY rise comes from a STEP change around the 1998 El Nino.
The El Nino was NOT caused by CO2
That means that there is ZERO signature of CO2 warming in the whole of the UAH (or RSS) satellite data.
That’s just how it is.
Sorry. You are both WRONG.
The data reveals a warming trend of +1.6 degrees per century up to the end of 1998, followed by a warming trend of +1.1 degree per century from 1999 to the present.
These are FACTS.
Any “step” changes are figments of your imaginations.
And what exactly does that prove in terms of CO2 causation? Or even worse climate sensitivity?
We are not discussing causation here.
Just admit the UAH data reveals a warming trend of +1.2 degrees per century.
That is all I ask.
A step-up is not a trend, straight edger.
Dr No-nothing with his monkey-brained straight edge.
There are two distinct near zero trend sections, with a step change around the 1998 El Nino.
The 1998 El Nino step is the ONLY warming in the whole satellite data, and as you keep showing us all, you have to use it to create your trend.
It is this monkey-do, non-thinking, bullcrap that we come to expect of the average brain-dead climate alarmist.
“These are facts”.
No they aren’t facts. In fact the various temperature measures that combine atmospheric and surface measurements are a synthetic index that doesn’t have a physics based justification.
Claiming these synthetic indices are temperature data or facts is like claiming you can combine apples and oranges to get grapefruit.
Further the sparse surface measurement means these indices are less accurate than the S&P compared to a total market index. It is probably comparable to a 50 or 100 stock index in accuracy. All the dancing about this special adjustment or that special adjustment make it match the “real” temperature is just dancing.
A measure like GISS Global Index (Land/Ocean) indicates whether it is more likely to be getting colder or warmer. The claim that a 1 point increase in the index puts us in a danger zone is just a howler.
UAH is the closest thing to an actual temperature index since it measures a single temperature proxy (atmospheric emission) globally.
Until the Southern Oscillation spills warm water over the surface of the Pacific, it is just potential warming so the stepwise claim is also valid.
Using a straight edge to connect the endpoints of a time series is the preoccupation of the simple minded. These types ignore what is in between: no observations for them, makes their head swim.
Actually, using a straight edge, cherry picking my points, gives interesting results. So from March of 1998 to June of 2016 gives a 1.2 +/- deg decline over 100 years.
What is more amusing is the amount of discussion and rhetoric involved in these minute changes. Only modern science has given us the ability to measure so precisely, knowledge we could not possibly have naturally.
What is not amusing are the True Believers. They, like all religious zealots, intend the destruction of the sacrilegious. Their religion, being one of self hate, more exactly, hatred of mankind, is bent on destruction of everything we have accomplished.
They, the true believers, are to be feared. Much more than the climate.
mpainter,
Awwww. I joined the end points of the time series over the period between the average temperature of the surface of the Earth, from its creation as a molten blob, to a moment ago.
The surface has cooled, according to my graph. I’m a simple minded sort of fellow, but at least nobody can accuse me of cherry picking. Except Warmists, that is!
Cheers.
Come on guys!
Do you understand linear regression?
Am I preaching to monkeys here?
Yer molten globe glowed cherry-red when yer picked it, cherry picker.
doctor no,
“In statistics, linear regression is an approach for modeling the relationship between a scalar dependent variable y and one or more explanatory variables (or independent variables) denoted X. The case of one explanatory variable is called simple linear regression.”
Some foolish Warmists associate increases in temperature with increases in CO2 concentration. Foolish Warmists!
Measure the temperature of the atmosphere within a sealed room. Replace all the nitrogen and oxygen with CO2. Do your linear regression. You might need to add a lot of sciency but meaningless terms such as “back radiation”, “forcings” or “equilibrium climate sensitivity” to explain why the increased CO2 levels didn’t raise the temperature of a damned thing!
Blundering bumblers like Schmidt, Mann, Hansen, and the like, live in a world of delusion and fantasy. They have definitely regressed. Maybe even linearly! And you?
Cheers.
“You might need to add a lot of sciency but meaningless terms..”
There, you have it !
All summed up in a few words !!
IGNORANT and PROUD OF IT !!!
“IGNORANT and PROUD OF IT !!!”
Dr No-nothing has found his new sign-off.
You should use that at the end of all your posts, Dr No-nothing.
The regulars know it already, but you should at least warn the rest of your alarmist troll mates.
A best fit extrapolation is hardly science because u are extrapolating off of an El Nino warm peak. You either need to exclude the el nino or wait 2 more years to complete the natural ENSO couplet (comprised of el nino warm nearly equilized by la nina cool phase). The ENSO signal is to strong and ruins your method because as you can see in 97 98 there is at least a 0.7 degrees C change of global temperature in the 3 to 4 year couplet. This is about 60% of your century scale 1.2 degC warming but in a 3 year window that you are biasing by using only half the couplet. So i am all for science but your method is not really valid. Also, I agree with the above comments about putting such a short data set into the bigger context. Ultimately 120,000 yrs ago sea level was 6m higher (why the limestone reef quarries in Florida keys are 6m above sea level and 120,000 yr old) and CO2 was 290 ppm. So i dont think you can make much of a case this is abnormal warming… even of i were to accept such a flawed extrapolation.
Sigh.
There is no extrapolation involved.
Pay attention !
So God created the Earth and the Heavens in 1979.
How convenient.
God launched satellites in 1979 that allowed man to measure changes in the lower troposphere.
John Silver,
Didn’t you know that God created the Earth and the Heavens 6000 years ago.
That is what skeptics tell me.
Liar.
Doctor No,
the warming rate per decade is well below the published IPCC projected warming rate of at least .30 C to support AGW conjecture.
From 1979 onward in the UAH Satellite data show about a .12C per decade warming rate.
The postulated CO2 effect increase is still invisible in the data.
the published IPCC projected warming rate of at least .30 C…
Is not the “published” warming rate. Where do people get this stuff?
Straight from the 2007 IPCC report:
“For the next two decades, a warming of about 0.2C per decade is projected for a range of SRES emission scenarios. Even if the concentrations of all greenhouse gases and aerosols had been kept constant at year 2000 levels, a further warming of about 0.1C per decade would be expected.”
https://www.ipcc.ch/publications_and_data/ar4/wg1/en/spmsspm-projections-of.html
For the next two decades, a warming of about 0.2C per decade is projected for a range of SRES emission scenarios.”
Straight from the 2007 IPCC report. Correct. Prediction period: 2007 to 2026.
We’re almost halfway through the prediction period.
Let’s say “about” 0.2C/decade means 0.15 to 0.25C/decade.
The trend since January 2007 to present:
UAH 0.34C/decade
RSS 0.31C/decade
Had4 0.32C/decade
GISS 0.34C/decade
NOAA 0.37C/decade
Of course, these values are statistically non-significant. The time-period is too short. We’ll have a better idea in 2027 of how that prediction panned out.
So, 0.3 is actually 0.2, and the prediction date is from 2007, not 1979.
Keep using El Nino step changes and spikes to show a positive trend.
Its all you have..
and its very funny !! 🙂
You truly are a shoe-in for class clown, Swarzt !!
Barry, they said almost the same thing in the 2001 report too,you are just like other dishonest warmists out there.
You also left out the 2000 CO2 emission scenario which is currently higher than than they thought it would be.
Barry, they said almost the same thing in the 2001 report
Could you please provide a quote? I don’t remember any 20-year prediction from 2001 IPCC report.
A link would be gratefully appreciated, too.
IPCC 2001:
On timescales of a few decades, the current observed rate of warming can be used to constrain the projected response to a given emissions scenario despite uncertainty in climate sensitivity. This approach suggests that anthropogenic warming is likely to lie in the range of 0.1 to 0.2C
Based on the surface record, the mean trend is 0.12 since 2001. The statistical uncertainty in the trend is +/- 0.14.
Of course, we’ll have to wait “a few decades” to see how the prediction panned out.
The quote comes late in the TAR Summary for Policy Makers, which can be accessed here:
http://www.grida.no/publications/other/ipcc_tar/
Quick question. Did the IPCC report meant surface or lower atmosphere? And the models suggest that the lower atmosphere should warm 2 to 3 times the surface temperature right? That means according to UAH or RSS data set the surface should have only warmed about 0.04 to 0.06 per decade?
Surface. Models don’t suggest lower atmosphere should warm 2-3 times surface. Modeling of heat transport predicts the tropical mid-troposphere should warm more than surface.
Ped, one of the hilarious aspects of the IPCC pseudoscience is that they keep “moving the goalposts”. AR5 “cooled” their projections for surface temps, as they acknowledged the “pause”. That report also apparently dropped using the term “back radiation”. But, they held to their claim that CO2 was “warming the planet”. Their only evidence is from “science” papers that use the bogus Arrhenius CO2 equation.
They have successfully fooled many. Even some that claim to be skeptic have stated that “CO2 produces warming”!
Dagnabbit! All the garbaged text should be quotation marks!
Let’s get the facts straight from the IPCC. Here is their quote from the Summary for Policy Makers [SPM].
Due to natural variability, trends based on short records are very sensitive to the beginning and end dates and do not in general reflect long-term climate trends. As one example, the rate of warming over the past 15 years (19982012; 0.05 [0.05 to 0.15] C per decade), which begins with a strong El Nio, is smaller than the rate calculated since 1951 (19512012; 0.12 [0.08 to 0.14] C per decade)
Short time periods do not necessarily reflect long-term trends. As IPCC says, to 95% confidence limits, the trend since 1998 (to Dec 2012) could be anywhere between -0.05 to 0.15C/decade.
From AR5 Ch 2:
In general, trend estimates are more reliable for longer time intervals [30 yrs], and trends computed on short intervals have a large uncertainty. Trends for short intervals are very sensitive to the start and end years.
Trend estimates that ignore the uncertainty interval are snake-oil.
Barry, a step-up is not a trend. The IPCC errs when it speaks of trends during the satellite era. You propagate that error by citing them. Tsk, Tsk.
Straight edgers galore in climate science.
“Lets get the facts straight from the IPCC.”
Good luck with that.
https://www.ipcc.ch/report/ar5/
As you know, I think your ‘step-up’ mantra is baloney. No matter how many times I’ve asked you, you always justify it by cherry-picking your dates and subjecting your ‘hypothesis’ to absolutely no testing. You never reply to the substance of my rebuttals. Dunno if there is a remedy for your confirmation bias, but I do know by now that you will respond with re-assertion and scolding your opponents. Meh.
Lets get the facts straight from the IPCC.
Good luck with that.
You can find the SPM and verify the quote by clicking on the link you provided and using your eyes.
No luck required, just a tiny amount of diligence.
Barry, your straight edge technique is a Simpson’s delight.
Simpleton’s
“No luck required, just a tiny amount of diligence.”
Okay then, let us know when you have found their proof for the Arrhenius CO2 equation, which is the basis for their pseudoscience.
The step-up is there, Barry, and you acknowledged it on a previous thread. Thank you for this fine illustration of the mindset of a global warmer. Your type is always duly appreciated here.
“All the garbaged text should be quotation marks!”
I think that should read:
“All the text should be garbaged!”
The step-up is there, Barry, and you acknowledged it on a previous thread.
I refuted it.
Nope, you denied it. In the regular fashion of the global warmers, who deny all observations contrary to their meme. And it doesn’t bother you that any intelligent person can see the step-up at circa 2000-2002 in the UAH plot above.
You simply deny it. Thanks for this illustration of how the global warmers do science.
“And it doesnt bother you that any intelligent person can see the step-up at circa 2000-2002 in the UAH plot above.”
There there.
Calm down.
There is no step up.
You are having a bad dream.
And the second example of warmer-think. Thanks. But Barry has already acknowledged it. See below.
No, he hasn’t. See below.
Once again, Andy, I didn’t choose the time-period. Sunsettomy provided the prediction (quoting IPCC), then made a claim about it. I checked. Sunsettomy is wrong.
Read and think before you post. It will help to understand what’s happening in the discussion.
Barry,I set the trap and you fell for it since they said similar in the 2001 report.
They have been saying similar from day one,but the UAH data show only a .12C per decade trend since 1979 which is well below the continually projected .20C per decade projected rate since the 1995 report.
ALL NORTHERN Hemisphere warming since 1979 have been caused by EL-NINO events,while there has been about ZERO warming trend in the Southern Hemisphere.
When we are in Neutral or La-Nina state there is flat to cooling trend clearly vivid in the data. There is no clear AGW signal in it since CO2 never prevents those cooling trends that comes along when El-Nino fades away.
Then you like all warmists ignore the fact that energy leaves the planet a greater rate when there is warming,far more than CO2 theoretically can create during warming phases.
From John Kehr’s site:
“If the Earth were to warm by 1.1 C, the amount of energy lost would be almost 4 W/m2 greater than what it lost in 1984. If the Earth were to warm by 3.0 C which is what is predicted by a doubling of CO2, then the amount of energy lost would be > 10 W/m2 the energy loss that existed in 1984.
The science of this is very clear. The rate at which the Earth loses energy will increase at more than twice the rate that the theoretical CO2 forcing is capable of causing warming to take place. The amount of CO2 in the atmosphere cannot stop the Earth from losing more energy if it warms up. The reasons behind this are the wavelengths of energy that are transmitted by the Earth, but it can simply be shown by looking at the energy loss increase that has taken place over the past 25 years.”
http://theinconvenientskeptic.com/2012/05/the-science-of-why-the-theory-of-global-warming-is-incorrect/
What is really happening is that you are promoting deception by omission.
To point out little CO2 adds to warming the planet is this report:
“My approach was to determine the total net energy that is transferred from the surface to the atmosphere. I used Kiehl-Trenberth 1997 and 2008 and others. While slight differences existed the overall result is that there is 120 W/m^2 of energy transferred to the atmosphere by the Earths surface. This is 71% of the total energy that is absorbed by the surface from the Sun.
I then broke down each transfer mechanism. Here is the end result as shown in my book.
Evaporation: 80.0 W/m^2
Water vapor (GHG): 18.1 W/m^2
Convection: 17.0 W/m^2
CO2 (GHG): 3.3 W/m^2
Ozone (GHG): 1.0 W/m^2
Other (GHG): 0.7 W/m^2
he then show that CO2 adds only 1.0 C out of the 287 K total.It is indeed a very small player in the energy budget.
http://theinconvenientskeptic.com/2012/08/what-would-the-temperature-of-the-earth-be-without-co2-in-the-atmosphere/
Barry,I set the trap and you fell for it since they said similar in the 2001 report.
IPCC 2001:
On timescales of a few decades, the current observed rate of warming can be used to constrain the projected response to a given emissions scenario despite uncertainty in climate sensitivity. This approach suggests that anthropogenic warming is likely to lie in the range of 0.1 to 0.2C
Based on the surface record, the mean trend is 0.12 since 2001. The statistical uncertainty in the trend is +/- 0.14.
Of course, we’ll have to wait “a few decades” to see how the prediction panned out.
Al ‘Gore Effect’ Nino, 2016
Here is a real estate tip. It is definitely not too late to get in on global warming. I am talking beachfront property in Nunavut, Canada! 40,000 people in an area of 2,000,000 square kilometers.
Bing has, today, an interesting picture from space of coastal waters off Bylot Island. These waters are, admittedly, choked with ice at the moment, but we know the Arctic is warming fast. Refreshing dips will soon be possible.
The recent drop in global temperatures is due to the ending of EL NINO. The recent spike in global temperatures was due to EL NINO.
CONCULSION Natural climatic oscillations are in complete control of the global temperatures and CO2 has nothing to do with it.
Really? What is this telling us then?
http://static.berkeleyearth.org/pdf/annual-with-forcing.pdf
Simon,
Anything that has a confidence interval is a guess. Not worth a brass razoo. Seriously, would you get on an aircraft with a 95% chance of not crashing? Or go across a bridge that only had a 5% chance of collapsing?
I prefer a little more confidence. It seems likely to me that the Berkely Earth mob are a ragtag assortment of climatological wannabes – although I’m sure they wouldn’t agree with my opinion. You are free to make your own assessment, of course.
Cheers.
Mike Flynn says:
“Anything that has a confidence interval is a guess.”
Everything ever measured or calculated has a confidence interval. Everything.
Tsk tsk.
A rag-tag mob that depends on donations for its subsistence. We all know what that means: hype the spike. Now that they can’t hype 2016 as the warmest yeah evah, they are in a tough spot. Let’s see what they come up with.
Check out BEST funding:
http://berkeleyearth.org/funders/
“Anonymous” is the biggest funder.
That would be Putin.
That would be Putin the (commie) Trump supporter
Simon,
showing facts to these guys is like waving a crucifix in front of dracula.
The conclusion is that CO2 rise has nothing to do with el Nino timing. Climate is not measured over a couple of years.
El Nino doesn’t add energy to the climate system, it just shifts it around. El Nino is not responsible for the warming over the last century, just contributes to the brief ups and downs.
Barry, Simon, how much of the late El Nino spike was due to CO2?
Oh, you can’t say?
You just know that it was?
“El Nino is not responsible for the warming over the last century.. ”
###
Neither was CO2. The IPCC concedes that prior to 1950, CO2 levels were too low to cause warming. And we know that the only warming of the satellite era was at the step-up, of which you know.
Bottom line, no warming from CO2.
There is a solid reason why. Care to know?
Barry, Simon, how much of the late El Nino spike was due to CO2?
Oh, you cant say?
You just know that it was?
Can you even read? From my previous post.
“The conclusion is that CO2 rise has nothing to do with el Nino timing.”
Or amplitude, for that matter. ENSO indices are detrended against global surface temperature change.
Well, then you agree?
It would make things much clearer if you let me say what I think than try to do it for me. You’re often wrong. Of course CO2 does not influence the timing or amplitude of ENSO events. Where did you get this nutty notion? Not from me.
CO2 increase, does, over the long term, influence global temperature. That’s a different discussion to relative El Nino strength. Nino values are detrended from global temp change.
“CO2 increase, does, over the long term, influence global temperature.”
I notice you did not indicate whether the “influence” was up, or down, or other. Nor did you indicate an amount.
Nice pseudoscience—vague and unsupported, yet authoritative and assertive.
Hilarious!
how much of the late El Nino spike was due to CO2?
You mean the spike in surface/lower trop temperatures? Dunno. I don’t estimate climate change based on a few months or less than multi-decadal data. 25-30 years is a sound minimum.
The idea that el Nino is the main cause of global temperature change 1950 to present is nutty.
Yeah, but CO2 did not cause the warming of the satellite era. We know what caused the step-up.
You think you do. Your opinion is unjustified when subjected to skeptical analysis. You should try it.
Give yours.
Barry,
poor mpainter is having one of his episodes.
All he can say is “step up step up.step up..”
At least it is not “the pausethe pause the pause”
So you can ignore it again?
http://www.drroyspencer.com/2016/05/uah-v6-global-temperature-update-for-april-2016-0-71-deg-c/#comment-213442
http://www.drroyspencer.com/2016/05/uah-v6-global-temperature-update-for-april-2016-0-71-deg-c/#comment-213460
http://www.drroyspencer.com/2016/06/2016-will-likely-see-record-global-warmth-in-satellite-data/#comment-215500
http://www.drroyspencer.com/2016/06/2016-will-likely-see-record-global-warmth-in-satellite-data/#comment-215650
The main point is that the so-called ‘pause’ periods you’ve nominated are statistically non-significant. To 95% confidence intervals, it could be cooling, flat, or warming at the same rate as the full record.
EG:
Mean warming trend 1979 – present UAH6.5:
0.12C/decade
Trend + uncertainty 1979 – Dec 1997
0.08C/decade (+/- 0.14)
The ’79 – ’97 trend is anywhere between -0.06 and +0.22C/decade.
Trend + uncertainty 1998 – present
0.038C/decade (+/- 0.18)
The ’98 – ’16 trend is anywhere between -0.14 and +0.22C/decade.
Both trends are not statistically significant. Both have uncertainties that overlap with the long-term trend.
Can’t claim pauses for those time periods. Statistical uncertainty precludes.
This is the main point that you consistently ignore. You have for months. Maybe you’ll make some substantive comments on that today. But I expect you’ll ignore it again. In 3, 2….
Thanks, Barry. Quite clearly you acknowledge the step-up in your first words:
“The step-up is an artefact”
Then you proceed to give reasons for ignoring it,
Thank you for this confirmation of my claim that “The step-up is there, Barry, and you acknowledged it on a previous thread.”
Now, is a step-up a trend?
Barry, it is not a question of statistical significance. It’s a matter of describing the data. The 37 year UAH data chart is two flat trends connected by a step-up of about 0.3C. You will never be able to set down your straight edge and give it any thought. This rigid mindset is another fine illustration of warmer-think. Thanks.
“it is not a question of statistical significance. Its a matter of describing the data.” !!
IGNORANT and PROUD OF IT
“The 37 year UAH data chart is two flat trends connected by a step-up of about 0.3C”
No it isn’t.
It is one STATISTCALLY SIGNIFICANT trend of +0.12 degree per decade.
Thanks, Barry. Quite clearly you acknowledge the step-up in your first words:
The step-up is an artefact
Artefact definition:
“something observed in a scientific investigation or experiment that is not naturally present but occurs as a result of the preparative or investigative procedure.”
“the curvature of the surface is an artefact of the wide-angle view”
The so-called ‘step-up’ is an artefact of the data selection, not a real phenomenon. If you’d bothered to rigorously test your hypothesis, you would already know that. But you have your mantra and you’re sticking to it.
You are trammeled by your limitations. Shouting won’t help you. I advise counseling on anger control.
Barry, it is not a question of statistical significance. Its a matter of describing the data.
Statistical significance testing is fundamental to “describing” the data. Don’t know if you avoid it out of ignorance or convenience, but your hypothesis is empty without this requirement.
The trend since 2008 is 0.4C/decade (4C per century).
If we ignore the pesky statistical significance testing, I can announce that global warming has accelerated enormously since 2008. The pause is over and then some!
And you can’t rebut that because you think statistical significance is inapplicable.
There are myriad ways to ‘describe’ data. We winnow the useful from the useless by using the data to test the description. You should try it. Any half-decent skeptic tests their own theory. You simply assert yours over and over. You’re no skeptic.
Ah, but you again acknowledge the step-up, and proceed to abnegate its significance by labeling it an artefact. We agree it is there.
It is no artefact. It’s significance is that it is the only warming of the satellite era.
You see, when it comes to describing the data, you lack the necessary observational skills. Tsk Tsk. Straitedges for you.
Ah, but you again acknowledge the step-up, and proceed to abnegate its significance by labeling it an artefact.
Now you know that the word artefact means, basically, ‘not real,’ you citing me using that word has worked against your misconceived opinion.
So now you’re asserting that I agree with you based on… nothing.
This is tiresome. I do not, nor I have I ever agreed with your baloney about pauses and step-changes. Let’s just accept that and move on, eh?
3, 2…
Barry, it is not a question of statistical significance.
1. We have lift off. The point was waved away. Ignored.
Should have bet on that prediction…
From your definition of artefact:
something observed in a scientific investigation..”
Something observed. Do you understand yet?
So we dispute whether it’s an artefact. You are in the position of having to argue that the step-up is not real, having acknowledged it in order to deny its presence. Thus global warmers. Thanks.
Barry, with no powers of observation, you will never make a good scientist. You have the quality of a rigid mind that precludes science.
Bears repeating.
“Something observed..”
And Barry imagines that he can observe it and then un-observe it.
It’s no artefact, it is data. You have acknowledged the step-up, you have acknowledged the flat trends. Now you deny everything. Thanks for the illustration of the mindset of the global warmers.
Artefact definition.
something observed in a scientific investigation or experiment that is not naturally present but occurs as a result of the preparative or investigative procedure.
Your elision of the full quote is patently dishonest.
As is your characterization of what I’ve said.
Please continue with what you’re doing here. It really showcases the quality of your contribution.
(You may wish to quote the last 2 sentences. The sarcasm will be lost and you can make another BS claim about what I’ve said 🙂 )
Bears repeating:
Artefact
“something observed in a scientific investigation or experiment that is not naturally present”
IE, doesn’t exist.
Definitions from other sources:
“a spurious observation or result arising from preparatory or investigative procedures.”
Spurious. Geddit?
“a product of artificial character due to extraneous (as human) agency; specifically : a product or formation in a microscopic preparation of a fixed tissue or cell that is caused by manipulation or reagents and is not indicative of actual structural relationships”
Artifical. Not indicative of actual structural relationships.
“a substance or structure not naturally present in the matter being observed but formed by artificial means, as during preparation of a microscope slide.”
The procedure produces the result, which is not naturally present.
Let’s apply your elision technique…
“…observation or result…”
“…actual structural relationships…”
“…naturally present in the matter being observed…”
Inverting the meaning by editing out the negative is intellectually… creative.
“Something observed..” and here we agree. The rest we dispute.
But one thing is for sure: a step-up is not a trend.
You are no scientist, but a rigid and doctrinaire mathematician incapable of observation. Also a name caller. Thanks for these illustrations.
And here is a definition on statistical artefacts:
“artefacts, statistical and methodological A statistical artefact is an inference that results from bias in the collection or manipulation of data. The implication is that the findings do not reflect the real world but are, rather, an unintended consequence of measurement error. When the findings from a particular study are deemed to beat least in parta result of the particular research technique employed, rather than an accurate representation of the world, they are sometimes said to be a methodological artefact.”
Something observed.. and here we agree. The rest we dispute.
No, you dispute the dictionary. As you’re now rejecting the dictionary definition of a word, you’re in full denial mode. I’ll bid you good day and good luck.
“The step is an artefact.
What I see is a general warming trend for the whole record that can be sliced any number of ways. One way is yours, but I dont know why you favour it.”
Your own words betray you Barry. Here you acknowledge that my step-up is “one way” that the data can be “sliced”.
Repeat: “One way is yours”.
Your definition again ” An artefact is an observation..”
Who is the dishonest one?
Here is the quote with the header:
barry says:
May 6, 2016 at 3:37 AM
The step is an artefact.
What I see is a general warming trend for the whole record that can be sliced any number of ways. One way is yours, but I dont know why you favour it.
###
So now incontrovertible proof that you acknowledged the step-up before you went into catatonic denial. Thanks for the illustration.
Those who followed this thread might wonder at Barry’s behavior. He is fighting for his beliefs because the step-up is the only warming of the satellite era and it cannot be explained by increased CO2. In fact, it is explained by change in global cloudiness in the late 20th Century. Decreased cloudiness = increased insolation. This is from cloud data at NASA’s Earth Observatory.
Thus the step-up refutes the whole of the AGW hypothesis and Barry has come to realize that. And Barry is a global warmer of the “control knob” type. So one can perhaps understand his derangement.
One mustn’t laugh at Barry,
Here you acknowledge that my step-up is one way that the data can be sliced.
It can be sliced to show a warming trend of 0.4C/decade, twice the rate of the IPCC 2007 prediction.
It can be sliced to show a warming trend of 0.9C/decade (9C/century).
It can be sliced to show a series of warming trends, with brief intervals.
It can be sliced to show two flattish trends with a step-up.
It can be sliced to show a series of short cooling trends.
They are all spurious analyses. Including yours. Artefacts of data selection. Statistically meaningless.
Can’t be an artefact. Does not fit the definition.
1. It is genuine data, nothing spurious.
2. you cannot show fault with UAH procedures or technique.
What it comes down to Barry is that you have acknowledged the step-up and now you wish that you hadn’t. So you throw a bunch of definitions of the word “artefact” about, but none fit because the data is real. So now you reveal another aspect of your faulty judgment, and there is no end to that. The step-up is genuine, not an artefact.
None of your definitions say “artefacts of data selection” which is a nonsense phrase which you’ve just made up. Once again you provide an illustration of warmer think, thanks.
mpainter, I had taken you to be someone at least moderately conversant with the general topic and with science. It seems I was grossly mistaken. ‘Artefact’ has a specific meaning in science (medical, statistical, economic, natural sciences), and all it means is that the result is derived from the method, not indicative of a real phenomenon. They are found to be artefacts when further testing is done. One test is statistical. Another could be physical. The so-called ‘pauses’ fail statistical testing. They are a product of the noise in the data, not the signal.
A warmist could use your ‘method’ to make this claim.
The trend since 2012, UAH6.5, is about 1C/decade (+/- 1.14C).
That is derived from UAH6.5 data, using a simple linear regression. If you do not understand why that is statistically spurious, even after my explanations here and there, then naturally you cannot understand why your ‘pauses’ are spurious.
I can find multiple ‘pauses’ in the long-term data sets. The only ones that are statistically meaningful are those long-term mid-century trends that are statistically distinct form the warming trends either side. That is, the uncertainty bounds do not overlap when comparing trends +uncertainty.
This is not the case for any other period. So-called pauses elsewhere in the record are artefacts of data selection. The uncertainties overlap. No statistical confidence can be attached to them.
You may say “the uncertainty intervals are irrelevant.” This pure assertion does not demonstrate that your opinion is correct, only that you are ignorant of statistics.
Unless you are happy to agree with me that the current warming trend is 10C per century. That is a trend derived from UAH6.5 data. According to you, it does not mater how I slice it, it is ‘correct.’ I will describe the trend thus: “most recent.”
Looking forward to you accepting the new, extremely high trend, based on your own rubric – that uncertainties in the trend don’t matter.
Nonsense. You are inventing phrases.
“artefact of data selection” is your coined nonsense. The step-up joins two flat trends which you likewise acknowledged.
To sum up, Barry acknowledged on a previous thread that the step-up was in the data. He made it clear that he regarded the step-up as one way of looking at the data: “One way is yours”. He also made it clear that he did not share my conclusion, but he definitely acknowledged the step-up. He has now turned full catatonic denial from disagreement with my conclusions to desperately denying that he ever saw the step-up.
In his desperation he has turned to coining nonsense phrases such as “an artefact of data selection”. By Barry’s post modern methods, the El Nino spike now becomes “an artefact of data selection”! We now can ignore any data presented to us and dismiss it as “an artefact of data selection”.
We need the Barrys. They continually furnish examples of global warmer think that we can present to those who inquire into the issues. Thank you, Barry.
http://m.imgur.com/YwZ111q?r
Barry, here’s a graph of the carbon dioxide growth rate going back to 1979. It’s no secret that the growth rate tracks the uah temperature data set. You can see the step rise in the carbon growth rate circa the year 2000, a strong indicator that the step rise feature in the uah data set is real as well…
Once again:
A statistical artefact is an inference that results from bias in the collection or manipulation of data. The implication is that the findings do not reflect the real world but are, rather, an unintended consequence of measurement error. When the findings from a particular study are deemed to be at least in part a result of the particular research technique employed (see research design), rather than an accurate representation of the world, they are sometimes said to be a methodological artefact.
There is even a paper describing a similar technique to yours, mpainter – selectively removing or selecting data.
Selective blanking of the data between beats has been used to increase spectral signal-to-noise ratio. However, blanking also eliminates signal components and, thus, can potentially distort…
The pauses are artefacts of data selection.
Specifically, you pick a period of data in a time series that looks flat. A bit of experimentation will give you a start and end date that conform to what you want to see.
This doesn’t prove that the ‘pause’ is real, only that you have successfully selected the right data to give that impression.
So, what do you do next? Subject the data to analysis to see if the result is real or an artefact. This is the due diligence missing from your hypothesis.
How to test? First, is the result statistically significant? In your selection, no, not by a long shot.
Second, is the result statistically distinct from previous and following trends? In your selection, no. The trends are not statistically distinct (all trends have distinct ‘mean’ trends, but the testing is done WRT the 2 sigma level, or uncertainty envelope. The null hypothesis has to be disproved. If the uncertainty in the compared trends overlap, the null hypothesis is not disproved.
Note: proving or disproving a null does not give a final answer. It is a test to see if a hypothesis is plausible.
Third, is there a physical basis to corroborate results? Is the correlation sound?
WRT your hypothesis, you rely on the Mclean paper on cloud cover. I read it and don’t think it is sound.
1. The data set used is imperfect. As a result, the data collection instruments have been replaced since the paper.
2. Even if the date set used in the paper is sound, then the paper neglects the influence of different heights in clouds. Low-level clouds reflect more sunlight than absorb infrared. Less low level cloud means cooler srface. High level clouds absorb more infrared than reflect sunlight. More high level clouds mean warmer surface. The data used in the study show a decrease in low-level clouds and an increase in high level clouds.
To sum up, the temperature data for the periods you select is statistically non-significant, and is not statistically distinct from the general warming trend. The physical basis is uncertain at best, and the analysis in the Mclean paper doesn’t consider the effects of high level clouds.
Now, you have indicated that the break for the step change is around 2001/2. The lower troposphere trend from 1979 to 2001 is 0.11C/decade (+/- 0.14), and to 2002 is 0.13 (+/- 0.12). these are warming trends, not ‘pauses’.
Will you require me to “selectively blank” some of this data to fit the result you’re touting?
A child can see the step-up.
Fact: no warming in the UAH prior to the 1998 El Nino, meaning the data gives a flat trend.
Fact: no warming in the UAH after 2002, meaning that the data gives a flat trend.
These two flat trends are joined by a step-up of about 0.3C, this step-up somewhat obscured by the ENSO cycle.
This can all be perceived with a brief examination of the UAH plot: the data points prior to the El Nino fall mostly below the baseline, the data post El Nino plot above. All quite conspicuously.
Your reaction is to pronounce these conspicuous facts as “artefacts of data selection”, a phrase that you coined on the spot to justify your rejection of these observations. You only fool yourself, and you are well fooled.
“A child can see the step-up.”
As I suspected. Mpainter is still at school !
Only a child with a vivid imagination can see a step-up in the data.
Leave science to the big boys.
What years do you allege the step-up occurs, mpainter?
Cant be an artefact. Does not fit the definition.
1. It is genuine data, nothing spurious.
2. you cannot show fault with UAH procedures or technique.
It’s your method that I’m talking about. The one that refuses to be subjected to any kind of challenge or analysis to test it.
The ‘pauses’ are entirely a product of the method, not indicative of anything in the real world. They are statistical artefacts.
BTW, what year/s does the alleged step-up occur? Is it 2001-2?
You invented the term “artefact of data selection”. You coined this on the spot. By this sort of drivel, one can justify ignoring any data presented. One can call an El Nino spike and “artefact of data selection”. It’s twaddle.
It’s trend analysis, Barry. Two flat trends joined by a step-up. What’s your problem?
When does the alleged step up occur? What year/s? I’d like to test the hypothesis.
It’s an observation, not an hypothesis. Please don’t play games. See your links above from previous thread wherein I covered this thoroughly.
You can do trends, right? Two flat trends connected by a step-up.
All you had to do was say which years. Why make talking to you so difficult?
From memory, you’ve said 2001/2002 was the step-up point.
UAH6.5 trend Jan 1979 to Dec 2001 is 0.13C/decade
UAH6.5 trend Jan 1979 to Dec 2002 is 0.14C/decade
Don’t see a pause before the step-uo.
If it should be done differently, could you please explain exactly why. I’d like to audit according to the correct rubric. For example, if strong el Ninos should be excluded from trend analysis, let me know that. If I have the step-up point wrong, let me know.
Barry has problems seeing the step-up. A child can see it, but Barry can’t. What does that tell you?
It tells you that if the earth cooled 0.3C over the next 4 years, Barry would refuse to acknowledge it.
I notice you did not indicate whether the influence was up, or down, or other. Nor did you indicate an amount.
It wasn’t required of me. If CO2 goes up or down, so does global temperature. There are other influences. Are you familiar with climate sensitivity values?
Immediate response of global temperature to a doubling of CO2 is about 2C. (TCR – transient climate response)
Mean equilibrium response (about 30 years after system has equilibrated with forcing) is 3C (1.5C – 4C).
Time factor and amplitude depend on rate of CO2 increase.
As there are other interannual influences, as well as decadal, you need multidecadal analysis to determine CO2 contribution. Also need to account for changes in other long-term forcings (like industrial aerosols, solar, volcanic).
The temperature change from the beginning of the 20th century to present is consistent with the immediate climate response (TCR). Temperature increase is nearly 1C. We’re nearly half way to doubling CO2 from 1900.
Short time-periods are useless for this assessment. Climate change is multidecadal.
Barry,
Climate sensitivity is more Warmist sciency nonsense words.
Climate is the average of weather. An average is a number. It is insensitive to CO2.
Transient climate response is more Warmist climatological non-science. Fill a room with CO2. Its temperature changeth not. Wait till the sun goes down. The temperature drops. Does this cause the CO2 concentration in the atmosphere to drop also?
Foolish Warmists are gullible enough to believe pretty well anything. Look at Michael Mann – he believed he was a Nobel a Laureate! Even more bizarrely, no Warmists pointed out the truth!
What a bunch of foolish fatheads Warmists are, in general.
Thermometers respond to heat, not CO2.
Cheers.
Ah, so now we have the truth: CO2 = control knob. This explains everything.
Barry, prove that CO2 has anything effect on temperature, please and thank you.
“Climate sensitivity is more Warmist sciency nonsense words.”
I love that word SCIENCY.
It usually describes something with a scientific flavour.
Here it is being used in a pejorative sense.
“Thermometers respond to heat, not CO2.”
Well, well.
I would never have guessed it.
What a brilliant insight.
Give that man a nobel prize.
doctor no,
I’m glad you agree that CO2 heats nothing. Someone like Michael Mann might claim a Nobel Prize for work claiming that CO2 increases thermometer readings, but of course, he didn’t actually get one. So sad, too bad.
I gather the very sciency sounding “climate sensitivity” alludes to some sort of heating effect due to CO2. I agree with you that it’s totally nonsensical, but many gullible Warmist fools believe that such is the case.
Not you or me, obviously.
Cheers.
Climate is the average of weather. An average is a number. It is insensitive to CO2.
When the stove is switched on the temperature of the water in a pot rises. It always has an average temperature at any point in time. According to your logic, the pot of water stays at the same temperature, because a number is insensitive to the heating element.
Fill a volume with CO2 that has radiative energy pasing through it and the volume temperature will increase. this is demonstrated by math (physics) and by physical experimentation. Tyndall published on it in the 1860s. You can prove it in a high school science room. There are examples all over you tube. But read Tyndall’s paper first to get the background.
Warming from CO2 increase has a physics and empirically tested basis. Being ignorant of that is not the same thing as it not being true.
Satellites have measured the darkening of atmospheric radiance over time in the spectra where CO2 absorbs *and re-emits) infrared. The evidence is overwhelming. One of the reasons, presumably, why Dr Roy Spencer accepts that CO2 is a greenhouse gas that causes warming at the surface when atmospheric concentrations increase.
There are genuine disputes in the general debate. This is not one of them. Either one is a crank, or one is a skeptic that questions, doubts and investigates within the bounds of reality.
barry,
Unfortunately, the fact that CO2 can be warmed, has nothing to do with any greenhouse effect. If you read Tyndall, you will discover that his thermopile showed a reduction in temperature when CO2 was placed between the heat source and the thermopile.
Tyndall calculated the amount of heat prevented from reaching the thermopile compared with dry, CO2 free air, for a number of gases. Maximum energy transfer occurs in free space – a vacuum.
The silly Warmists never think to substitute a gas that has no claimed greenhouse effects (for example argon) in their amateurish so called experiments. What is causing the temperature of the argon to rise?
Before you claim that oxygen or nitrogen cannot be heated, feel the air in the room you are in. It’s not absolute zero. It has been heated.
CO2 provides no heat. Like any matter, it can be heated. Also, as Tyndall showed, remove the heat source, CO2 cools rapidly to equilibrium with the environment.
Apparently the greenhouse effect doesn’t work indoors, or at night, or in the shade. Only in sunlight, outdoors!
Pointless and irrelevant analogies involving pots, stoves, water, or tobacco, are a typical Warmist attempt to deny, divert, and confuse the fact that CO2 warms nothing at all.
Climatology? Cargo Cult Science at best. Self serving delusional psychosis at worst.
Just one repeatable scientific experiment would help, but of course that’s impossible. Probably why there aren’t any, just lots of hand waving!
Cheers.
Awaiting Barry’s proof of CO2 control knob fantasy. None yet. He must be busy on the “selection of data” that he wants to present.☺
Apparently the greenhouse effect doesnt work indoors, or at night, or in the shade
You’re kidding, I hope.
If the greenhouse effect didn’t work at night the surface of the Earth at midnight would be roughly the same temperature as the dark side of the moon.
The reason the near-surface atmosphere at night is > 100C warmer than the dark side of the moon is because of the greenhouse effect.
I’m going to assume you’re not that stupid and are baiting me. Ciao.
barry,
I presume you are confusing the greenhouse effect with the relatively small, but life sustaining insulating and temperature integrating effects of the atmosphere.
CO2 heats nothing. The atmosphere prevents more than 20% of the insolation from reaching the Earths surface, and slows the rate at which the days absorbed radiation leaves the surface at night.
No greenhouse effect, just radiative physics.
As you point out, the Moon provides an example of temperatures without an atmosphere. Over 100C in the Sun, around -150 C at night. Earth, maybe 70 C to -90 C.
The Earth is colder during the day, warmer at night. A’lls well.
Cheers.
“im going to assume youre not that stupid”
LOL!
.
I think you assume wrongly.
Mike Flynn says: “No greenhouse effect, just radiative physics.”
Just six words!
Brevity is the soul of wit.
So far only blather about CO2. IR astronomers report that atmospheric IR flux consists only of 3% in the 15 micron band. And guess what? Most of that is from water. AGW RIP. The spike is a coffin nail.
The atmosphere prevents more than 20% of the insolation from reaching the Earths surface, and slows the rate at which the days absorbed radiation leaves the surface at night.
No greenhouse effect, just radiative physics.
Congratulations. You’ve just described the ‘greenhouse’ effect and then said it’s not the greenhouse effect. Just to add, the atmosphere also slows down escape of radiation to space during the day. This happens whether or not the surface is receiving sunlight.
Looks like the quibble has been over terminology. Yawn.
Barry, prove that CO2 has anything effect on temperature, please and thank you.
Rather than pepper my comment with corroborating links (which you’ll hand-wave anyway), I’ll quote from an expert in atmospheric analysis who is firmly in the ‘skeptic’ camp. Dr Roy Spencer.
“It has been calculated theoretically that, if there are no other changes in the climate system, a doubling of the atmospheric CO2 concentration would cause less than 1 deg C of surface warming (about 1 deg. F). This is NOT a controversial statement it is well understood by climate scientists.”
http://www.drroyspencer.com/global-warming-101/
Note: the title of that article is ‘Global Warming 101.’
From Dr Spencer’s post: 10 Skeptical Arguments That Don’t Hold Water
“Please stop the no greenhouse effect stuff. Its making us skeptics look bad. Ive blogged on this numerous times… maybe start here.”
The 2nd Law of Thermodynamics… “is not violated by the greenhouse effect… a cooler body can make a warm body even warmer still… as evidenced by putting your clothes on.”
http://www.drroyspencer.com/2014/04/skeptical-arguments-that-dont-hold-water/
It’s a question of the contribution of CO2 to the GHE. It is about 85% redundant to atmospheric water vapor and clouds in regard to the 15 micron IR band. The big secret is out: the GHE is strictly water with CO2 making only an insignificant contribution.
So more CO2 does contribute to warming (but only by a little amount according to you).
We’ve settled that.
Water vapour varies from 0 – 4% of the atmosphere at different locations. Where there is little water vapour (deserts, Arctic/Antarctic etc), the CO2 effect is more pronounced.
CO2 is present in the atmosphere at higher levels than water vapour. Upwelling (ground-based or re-emitted) radiation is still absorbed by CO2 once it passes through water vapour altitudes.
Just some of the details that you’ve overlooked here.
Dr Spencer’s view is in line with all qualified experts on the topic, skeptics and others: a doubling of CO2 produces about 1C warming at the surface. The question then turns to feedbacks.
CO2 bands are 12-18 micron, 10 micron range, 4 micron and others. Strongest is the 12-18 micron band, but the others play a part.
Redundant. Look it up. Study absorbency spectra.
I have. The 15 micron range is 12-18 microns. CO2 is also opaque to the 10 micron band, and, much less saturated, the 4 micron range.
Water vapour is opaque (at average humidity) at other wavelengths, and overlaps part of the 15 micron range and at longer wavelengths. Water vapour is opaque to more of the spectrum but doesn’t occlude all the specrtum that is taken up by CO2 opacity.
In low humidity, CO2 intake of the 15 micron range spectra is much stronger than water vapour. At high humidity, water vapour and CO2 overlap, but CO2 still accounts for half that range alone. At high altitudes, CO2 effect is stronger than water vapour.
Water vapour concentration is a function of temperature and pressure. If the atmosphere warms it can hold more water vapour (obvious in the tropics).
CO2 is long-lived in the atmosphere. While a single molecule has a residence time of 5-12 years, any excess above background levels can take decades to centuries. The sources and sinks are about equal. Excess CO2 is removed by rock weathering, a slow process.
Water vapour residence is a matter of days, responding quickly to changes in temperature and pressure.
CO2 and other long-lived gases (greenhouse and non-greenhouse) provide the structure of the atmosphere, water vapour responds to changes in that structure (heat, pressure). This is the basis for the water vapour feedback effect to a warming (or cooling) atmosphere.
I’ve been reading up on this for a long time (over the last 8 years). Far as I can tell you joined the conversation here just over a year ago, right after the UAH Beta 6 revision that lowered temp trends from 1998. Were you active on climate boards prior to that? Where, if I may ask?
You forgot about clouds, Mr. Learned AGW person. CO2 is 100% redundant to clouds. 50% to water vapor. The GHE is water. CO2 is of no account.
Clouds are part of the mix. 0-4% water vapour in the atmos, as I said. Clouds hold the higher percentages.
Nothing to say about the spectrum? That water vapour does and does not overlap with CO2 opacity? That WV only partly covers the 15 micron range? That CO2 absorbs at other frequencies where WV doesn’t? That CO2 effect is strongest when there is little to no water vapour? That CO2 absorbs high in the atmos where there is little to no water vapour? That WV and CO2 act together, rather than one obscuring the other?
Speaking of forgetting…
Barry crows about his qualifications as a climate scientist, from above: “Ive been reading up on this for a long time (over the last 8 years). Far as I can tell you joined the conversation here just over a year ago, right after the UAH Beta 6 revision that lowered temp trends from 1998. Were you active on climate boards prior to that? Where, if I may ask?”
But watch Barry claim that clouds are water vapor:
barry says:
July 4, 2016 at 6:00 PM
Clouds are part of the mix. 0-4% water vapour in the atmos, as I said. Clouds hold the higher percentages.
###
Thank you, Barry.
No warming of the upper troposphere, no cooling of the lower stratosphere, no tropical hotspot, Tsk,Tsk. AGW RIP.
barry says, July 3, 2016 at 5:05 AM:
“Fill a volume with CO2 that has radiative energy pasing through it and the volume temperature will increase. this is demonstrated by math (physics) and by physical experimentation. Tyndall published on it in the 1860s. You can prove it in a high school science room. There are examples all over you tube. But read Tyndalls paper first to get the background.
Warming from CO2 increase has a physics and empirically tested basis. Being ignorant of that is not the same thing as it not being true.”
Yes, this can occur given particularly controlled laboratory settings where any convective effects are precluded. You do this by 1) heating the volume from above, and/or 2) making the space containing the volume very narrow indeed. Even then, however, it is not at all for certain that pure CO2 will produce a temperature effect over that of regular air.
These things have been tested extensively. Here’s a paper published in 1990 detailing an experimental study performed by researchers Reilly, Arasteh and Rubin of the Windows and Daylighting Group at the Applied Science Division of the Lawrence Berkeley Laboratory in 1989, called “The Effects of Infrared Absorbing Gasses on Window Heat Transfer: A Comparison of Theory and Experiment”:
http://gaia.lbl.gov/btech/papers/29389.pdf
You should read it.
The study is about the relative insulating properties of IR absorbing gases and low transfer coatings on glass for double-glazed insulation. Simple experiments like this are done at the high school level in all sorts of ways, confirming that CO2 absorbs radiation, heating the volume. For an experiment that more accurately reflects the amplitude of this effect in the atmosphere you need a deeper experimental column of atmosphere than a few millimeters.
But watch Barry claim that clouds are water vapor:
barry says:
July 4, 2016 at 6:00 PM
Clouds are part of the mix. 0-4% water vapour in the atmos, as I said. Clouds hold the higher percentages.
Thanks for quoting me. Shows what a liar you are.
I’m pretty much done with your muck.
http://isccp.giss.nasa.gov/role.html#FORMANDTRAVEL
barry says, July 8, 2016 at 11:13 AM:
“The study is about the relative insulating properties of IR absorbing gases and low transfer coatings on glass for double-glazed insulation. Simple experiments like this are done at the high school level in all sorts of ways, confirming that CO2 absorbs radiation, heating the volume. For an experiment that more accurately reflects the amplitude of this effect in the atmosphere you need a deeper experimental column of atmosphere than a few millimeters.”
IOW, you didn’t read the paper. Barry, you’re clearly the one who’s in denial. The radiative properties of pure CO2 gas isn’t able to reduce the heat transfer through a medium any more than pure air does. That’s even without convection included (horizontal window heated from above). With convection included, this is what the paper finds:
So exactly the opposite of what you assert, that you need a deeper column of air to appreciate the full strength of the radiative effect. No, the deeper the column of air, the more convection takes over the transport of heat through the medium, and so any potential radiative effects on that transport are effectively annulled …
Salvatore Del Prete says:
“The recent spike in global temperatures was due to EL NINO.”
But why were surface and LT temperatures for this first El Nino year (2015) about 0.3-0.4 C above 1997’s, and why were its temperatures about 0.3-0.4 C warmer than 1982’s El Nino?
Oh dear, Mr mpainter.
I thought you were doing better with your new hobby. What happened? I forget which hobby it was, but you were down to only spending 4-6 obsessive hours a day posting on Roy’s website. Now you are back to 16 hours non-stop. Given the copious scientific research that goes into your posts, I can only assume that the short pauses are because you are reading the latest literature. It seems you never sleep at all! Please, for the sake of science, try to take better care of yourself and find a new hobby. Otherwise, your voice will be silenced soon by the inevitable grim hand.
May I suggest competitive planking as a new hobby? Not sure of the rules, but I think you could squeak in a nap during competitions as well. Might suit you.
Best,
Max
mpainter says:
July 1, 2016 at 7:01 AM
July 1, 2016 at 7:19 AM
July 1, 2016 at 8:11 AM
July 1, 2016 at 8:42 AM
July 1, 2016 at 9:45 AM
July 1, 2016 at 11:10 AM
July 1, 2016 at 11:48 AM
July 1, 2016 at 1:02 PM
July 1, 2016 at 1:40 PM
July 1, 2016 at 2:07 PM
July 1, 2016 at 2:56 PM
July 2, 2016 at 6:09 PM
July 1, 2016 at 6:21 PM
July 1, 2016 at 6:25 PM
July 2, 2016 at 6:36 PM
July 2, 2016 at 6:43 PM
July 1, 2016 at 6:57 PM
July 1, 2016 at 7:18 PM
July 2, 2016 at 7:25 PM
July 2, 2016 at 7:21 PM
July 1, 2016 at 7:39 PM
July 1, 2016 at 7:50 PM
July 1, 2016 at 9:09 PM
July 1, 2016 at 9:27 PM
July 1, 2016 at 10:33 PM
July 1, 2016 at 11:17 PM
July 1, 2016 at 11:21 PM
My hobby is making fools of the global warmers which is sort of like shooting fish in a barrel. It’s entertaining, delightful fun. Restorative too. So don’t you worry about me, I’m doing fine. I always know that I’ve scored big when you pop up. So thanks for coming. ☺
Poor Max, obviously an mpainter STALKER.
Is that really all your life is about, max..
seems pretty min, to me.
Yes, it seems that I have attracted a certain type. Note “the inevitable grim hand”. Wishful thinking on his part.
Yeah, painter, bauer’s obsession here with death is earily similar to that of mr. elliot… (i mean, what are the chances of having two different commentors so similarly disposed?)
Bauer first showed up at the thread on which Bignell was calling various and sundry a liar (he even called Massimo a liar!).Curious coincidence. It seemed to me Bignell and Bauer were the same, at the time.
Mr mpainter,
For at least the fifth time, I am not Bignell!
I don’t understand what put that thought in your head. Actually, I don’t understand anything about your head except that you are an old, angry, scientifically unsophisticated boor whose only joy in life seems to be posting crap on Roy Spencer’s blog and making snarky insults to those who disagree with you.
If you think about it for 10 seconds you will realize that Bignell has the same psychological problem as you, but seems to control it a bit better. He might have a hobby. I think you need one too. Have you considered growing Psilocybin Mushrooms as a hobby? They thrive in bovine excrement, which you are awash in. Ingestion opens the mind in profound ways, and they are even the current rage in treatment of age related dementia. A triple benefit for you.
Let us know how it progresses.
MB
mpainter,
By the way, I also offered to send you my email address to prove to you that I am not Bignell, but you never responded.
I just reacted to another post suggesting that you need a hobby. I can’t agree more. I come here to learn, and you sir detract from the sum of human knowledge.
MB
Dear M. Bauer,
You can learn here sir, but when the boys go at it, you must accept the learning becomes less but the entertainment more.
Further, I suggest you remind yourself this is Dr. Spencer’s blog to police, not yours.
MPainter goes on a bit, but not so much you can’t skip past if you don’t care for his writing. Not so with others, like (shoveled wool) who find themselves banned. There are others who go on as well. Barry comes to mind today, but his going back and forth with Painter and Flynn is rather entertaining, as was your complaint.
Happy forth, shoot something.
You came to spew poison.
“Given the copious scientific research that goes into your posts, I can only assume that the short pauses are because you are reading the latest literature.”
The short pauses (no pun intended?) are when he studies his latest comic titled “The Return of the Pause”
Even then, it takes him some time.
or, was it called: the dummies guide to step ups ?
no, i think he has been reading “Super skeptic man versus Al Gore and the world wide conspiracy”
How clueless some are when it comes to the climate.The climate has reacted pretty much as expected over the past few years due to all the natural climatic factors favoring warmth from moderate to high solar activity due to the weak but still maximum of solar cycle 24 , to a lack of any major volcanic activity , to a warm PDO/AMO, to the recent very strong El Nino and warm ocean temperatures in general which are due to high to very high solar activity all of last century especially 1940 -2005.
Global cloud cover and snow cover also have been in general below average which allow for the climate to warm.
Yes solar activity has been less then normal post 2005 but the maximum starting just 5 years later although weak still dampened solar effects. The solar criteria being much above my solar criteria through out the recent maximum of solar cycle 24 which I feel is needed for the sun to impact the climate.
Now surprisingly sooner then I thought many of the solar parameters have come down or are very close to the solar criteria I have called for which should result global cooling. It is only July 2016 and this down trend is forecasted to bottom out around year 2019 or even later. How low will the solar parameters go as we head forward? The data will show and needs to be closely watched. All of the solar data presented in this article will have to be monitored.
CURRENT SOLAR PARAMETERS WHAT I CALLED FOR TO CREATE COOLING
COSMIC RAY COUNTS AROUND 6450 UNITS CALLLED FOR +6500 UNITS
EUV LIGHT AROUND 90 UNITS CALLED FOR SUB 100 UNITS
SOLAR FLUX LATELY WELL UNDER 80 CALLED FOR 90 OR LOWER
SOLAR WIND STILL ABOVE 350 K/SEC CALLED FOR SUB 350KM/SEC
AP INDEX STILL + 10 LAST FEW MONTHS CALLED FOR 5 OR LOWER
These conditions once all met which I think will happen and if sustained in duration should effect the natural climatic factors which will bring the climate toward cooler conditions moving forward.
“How clueless some are when it comes to the climate.The climate has reacted pretty much as expected over the past few years due to all the natural climatic factors favoring warmth ”
LOL
When did you ever predict a record warm spike? Answer: Never
And, while we are at it:
“Global cloud cover and snow cover also have been in general below average which allow for the climate to warm.”
LOLx2
That is like saying: the reason why burglary rates are up is because more houses are being robbed.
Or like saying: the reason why hospitals are full is because people get sick
Or like saying: the reason why the temperature increased is because it got hotter
[if you miss my point, why not think about asking why cloud and snow cover is less?]
ANSWER IS BECAUSE SOLAR ACTIIVTY HAS BEEN HIGH.
The only prediction I have made and care about is the global cooling going forward.
https://wattsupwiththat.com/2016/06/30/the-sun-is-as-blank-as-a-billiard-ball-solar-activity-dwindling-to-lows-not-seen-in-200-years/
The article I was referring to in my above post.
Salvatore:
I would be curious to see what you think is behind the changing northern hemisphere snow cover.
http://climate.rutgers.edu/snowcover/chart_seasonal.php?ui_set=namgnld&ui_season=1
Fall and winter graphs show increasing cover since 1967 while spring graphs show quickly decreasing.
My guess is that increased temperatures lead to the quicker melting in spring, but what is leading to the increased amounts in fall and winter?
Anyway, as always, I hope you are wrong and it stays warm. Who wants more snow and ice? (besides the usual True Believer Alarmists)
Garan wrote: “I notice you did not indicate whether the influence was up, or down, or other. Nor did you indicate an amount.”
Yeah, what about that?
I think the reason there is no reply, is because those things are not known.
Garan was referring to CO2 when he said: I notice you did not indicate whether the influence was up, or down, or other. Nor did you indicate an amount.
And I replied:
Yeah, what about that?
I think the reason there is no reply, is because those things are not known.
I reposted this because I thought it would appear as a reply to Garan but it did not, and was not self-explanatory in itself.
I didn’t read any replies from those promoting AGW/CAGW about Garan’s statement.
Will 2016 set a new record for RSS? (UAH was done earlier.)
There are many similarities between 1998 and 2016. There was an extremely strong El Nino which caused records to be set in the beginning of each year. Then there was a drop in 1998 and so far, there is a similar drop in 2016.
However there are important difference between 1998 and 2016. In 1998, the highest anomaly was in April of 1998 and therefore not surprisingly, the second quarter of 1998 was the quarter with the highest anomaly. In contrast, the highest anomaly in 2016 was in February making the first quarter of 2016 the one with the highest anomaly.
The difference between quarters 2 and 3 for 1998 for RSS was 0.140. The difference between quarters 1 and 2 in 2016 was 0.245. While this is not as close as for UAH6.0beta5, I will make similar calculations.
There are several different approaches one can use to arrive at the best guess as to whether or not 2016 will set a record. I have decided to give the averages for each of the four quarters in 1998 and the first quarter of 1999 as well as the four quarters of 2016. The first quarter of 1998 will be called 98(1), and so on.
Here are the numbers we know:
98(1): 0.624
98(2): 0.697
98(3): 0.557
98(4): 0.322
99(1): 0.162
16(1): 0.828
16(2): 0.583
And here are my estimates for what we do not know.
16(3): (0.348)
16(4): (0.188)
This gives an average of 0.487 for 2016 putting it into second place between the 0.550 of 1998 and 0.467 from 2010.
Obviously, I could only give the first two quarters of 2016 and I had to estimate the last two. Feel free to comment on whether you think my methods are reasonably good enough or whether you think they are totally out to lunch. I took the difference between the following quarters: 4 and 3 of 1998, and 1 of 1999 versus 4 of 1998. Then I applied those differences to quarters 3 and 4 of 2016 and put those numbers in ( ) above for 16(3) and 16(4).
Then I calculated the average for 2016 based on those numbers and compared that to the 1998 and 2010 averages.
Weather variability, even at global scale, is superimposed on ENSO changes. With this in mind, it’s difficult to predict with any certainty that 2016 will be cooler or warmer than 1998. A coming la Nina could bottom out as drastically or more so than that of 1999/2000, but other natural variability could dampen that cooling. Obversley, a coming la Nina could be mild and short, but other variability could deepen the cooling for a while and make 2016 cooler than 1998.
Side note: UAH6.5 dropped 0.2C May to June, but the drop was less than 0.1C in RSS.
Very True. But keep in mind that we have at least 3 months of declining ENSO numbers in the pipeline that will affect things over at least 3 more months. And if temperature anomalies drop at least 3 more months, there is no way 2016 will set a record.
In reality, the pause never ended as the El Nino spike is only of transient effect, an effect of no significance. I predict a cooling trend by the end of 2017.
Are you willing to bet the stake you offered on this? That the winner accepts the other’s point of view?
Meanwhile, if I calculated correctly, RSS LT just set a record for the warmest 12-month period.
So did last month; this month has an even higher 12-month moving average. Beats the prior record period Jan 1998 – Dec 1998.
I agree! However UAH is still higher for 1998 by a greater margin. But this could change next month if neither RSS nor UAH show any change over June if I calculated correctly.
Yes. Plus it could change when RSS LT goes from v3.3 to v4 in, I heard it will be, a few months.
I see David is still supporting AGW theory which will be obsolete before this decade ends as the global temperatures drop.
Crunch time David ,now that my solar parameters are starting to be reached.
It took a while for me to finally figure out what svalgaards problem is over at wuwt… It seems he’s oblivious to the concept of there being a threshold level of solar activity. Hundreds of years ago solar activity was even weaker than it is now. Anything above that activity (of centuries past) should give us some warming. (perhaps that depends on a new, evolving equilibrium state as well) What svalgaard seems to fail to recognize is that sc24 brought no warming over sc23 levels, however sc23, being stronger, did bring higher temps than sc22. Should be interesting to see just what sc25 brings temp wise, especially if sc25 is similar to sc24. All in all there is quite a bit of “solar denial” going on over there at watts. Bob Weber and his graphs are for what ever reason just not sinking in over there. How on earth can they be denying that a correlation even exists?! Call it spurious or whatever, but stop denying the obvious (especially when bob holds it in front of their faces every other day)…
What svalgaard seems to fail to recognize
He has 40 years as a solar scientist and one of the leaders in the field. Takes some unbelievable self-regard to contradict that kind of expertise, especially since he is an avowed IPCC skeptic.
No, it doesn’t barry… When the “experts” are failing us left and right, it only takes a little common sense. What i’m suggesting is very similar to trenberth’s deep ocean warming. Sea surface temps need not increase (in fact could even decrease) to produce ocean warming. What is needed is not a warming surface, rather a surface that’s warmer than the equilibrium state set centuries ago. Trenberth’s is a relatively recent addition to climate science and they are just figuring ocean warming out now?(!) This is something that should have been well established from the get go, but here we are, this late in the game. The exact same sort of problem exists when it comes to solar activity. How many times have we heard that it can’t be solar because solar peaked half a century ago? Solar activity is STILL high in comparison with centuries ago and this basic fact is getting lost on many even apparently on svalgaard.
Salvatore, you have been wrong all along. How do you explain that?
“here is my prediction for climate going forward, this decade will be the decade of cooling.”
– Salvatore del Prete, 11/23/2010
http://ourchangingclimate.wordpress.com/2010/10/20/andrew-dessler-debating-richard-lindzen/#comment-8875
Temperatures in response to this will decline in the near future, in contrast to the steady state of temperature we presently have,or have been having for the past 15 years or so.
– Salvatore Del Prete, 11/6/2012
http://www.drroyspencer.com/2012/11/uah-v5-5-global-temp-update-for-october-2012-0-33-deg-c/#comment-64939
“I think the start of the temperature decline will commence within six months of the end of the solar cycle maximum and should last for at least 30+ years.”
– Salvatore Del Prete, 7/13/2013
http://www.drroyspencer.com/2013/07/uah-v5-6-global-temperature-update-for-june-2013-0-30-deg-c/#comment-84963
“I think this blip ends before NOV. is through and if solar conditions continue to be sub par cooling in a more pronounced way will start in year 2014.”
– Salvatore del Prete, 11/15/13
http://www.landscheidt.info/?q=node/4#comment-1047
Feynman: Science is the belief in the ignorance of experts.
“Feynman: Science is the belief in the ignorance of experts.”
That seems to be the quotation of last resort, when someone has no arguments left.
Feynman would certainly understand manmade climate change, and he’d probably be prominent in pointing out the foolishness of the “skeptic” community, in that brash, reverent tone he had.
David, among too many others, is a True Believer. Tell us David, how many virgins for you in the next life?
barry was holding svalgaard up as though he was some sort of demigod. And i was just giving barry a reminder a la feynman (if that’s o. f***ing k. with you)…
Yes, the latest 12-month average for UAH6.5 is about 2 hundredths of a degree cooler than the 1998 average – the current front-runner in 12 month averages.
Jan – Dec 1998
Av anom 0.484C
Jul – Jun 2015/16
Av anom 0.460
(Yes. Plus it could change when RSS LT goes from v3.3 to v4 in, I heard it will be, a few months.)
With the pause already gone, and with RSS being very close to UAH now, and having the warmest 12 months already, exactly what do they hope to accomplish? Do they want to be compared to Karl? I think the PR would be negative if this were done.
Presumably they are simply trying to improve their methods. UAH has just done a revision and waiting on peer review to critique the changes. Why shouldn’t RSS do the same?
No, Werner, they have an organization in place ready to propagate any AGW meme. RSS revs up their model to crank out higher temperature, and the Mosher types ballyhoo this abroad. It’s a power play dressed up like science.
And UAH are doing everything they can to lower temps with their latest revision?
Come on, these conspiracy theories are wacko.
Werner wrote:
“I think the PR would be negative if this were done.”
Are you kidding? That’s what science is and what scientists do — improve their methodologies.
All datasets go through many versions. UAH is on, what, it’s 30th? (6 versions plus subversions.)
The bad PR would be if scientists DIDN’T keep trying to improve their calculations.
Then the attorneys general and the AGW crowd will hold a press conference and announce that they are indicting Roy Spencer for disseminating false satellite temperature data and lying to the public about the risks of climate change. Watch.
(The bad PR would be if scientists DIDNT keep trying to improve their calculations.)
Improving calculations is one thing, but warming the present or cooling the past about 90% of the time looks very suspicious. Think pause busters.
Werner, the exact same could be said about John Christy and Roy Spencer – deliberately cooling their temperature record because they are opponents of the IPCC and mitigation policy.
It’s all turbid speculation.
Skeptics that have done their own work on the temp data – comprehensive work like Roman M and Jeff Id – have corroborated the institutes. Roman M found a warmer trend then Phil Climategate Jones with his method. So did the BEST team.
Furthermore, the surface temp records are corroborated by various institutes, including the Japanese Meteorological Institute. Eventually one has to perceive that the conspiracy theory must include researchers from many countries, and most national science institutes of the world. A reasonable mind turns skepticism to the idea that thousands of climate researchers from different countries are in on it together, and that the skeptics that have done comprehensive work to construct their own temp records must also be in on it!
Read this article. Two skeptics worked for months to create their own temp record with raw data.
https://noconsensus.wordpress.com/2010/03/24/thermal-hammer/
(Werner, the exact same could be said about John Christy and Roy Spencer deliberately cooling their temperature record because they are opponents of the IPCC and mitigation policy.)
The problem with this interpretation is that they in effect agreed that RSS was better. If both had the same pause originally and then if UAH changed things to have a much longer pause, that would have looked suspicious.
UAH had a higher trend than RSS, in line with the surface temp records. The latest revision lengthened the pause, giving UAH, at the time, a sudden negative trend.
Linear trend (OLS) from 1998 to Dec 2014
UAH 5.6 = +0.07C/decade
UAH 6.5 = -0.03C/decade
I think Spencer and Christy are doing their best to provide a best estimate.
So are other compilers of the temp records.
The latest UAH revision did not make it ‘better’ simply because it was closer to RSS. It only brought better agreement between the 2 records. They could both be ‘wronger’ than the surface records (or better).
If RSS next revision revises temps upwards (as it looks like it will), UAH would be the outlier. For many skeptics, the better agreement betwen 4 temp records would make them suspicious, and the outlier more ‘true.’ This is not well-considered. All it would reveal is that those skeptics like the coolest temperature series.
Werner, did you read this (conclusions near the end)?
https://noconsensus.wordpress.com/2010/03/24/thermal-hammer/
That work, and BEST, is why I think there’s no fudging going on. Everyone is doing their best to make a best estimate.
That work, and BEST, is why I think theres no fudging going on. Everyone is doing their best to make a best estimate.
You could be right. It is beyond my comfort level. I am prepared to trust others here who know more than me.
An important aspect of the El Niño phenomenon which deserves more attention is the effect on surface layer mixing in the ocean. Normally wave driven mixing results in a similar temperature throughout the mixed surface layer down to a depth of about 100m. However, El Niño conditions bring extended periods of calm and the doldrums expand greatly in latitude. During periods of extended calm wave driven mixing ceases and after a week of no wind the top meter or two at the surface can become as much as 4-5 C or more warmer than the remainder of the normal oceanic surface layer beneath.
When the wind comes up again this extra warm layer can disappear in a few hours as wave induced mixing resumes.This effect probably accounts for most or all of the recently observed rapid cooling.
This relatively thin skin of surface warmth does not appear in the temperature record from the cooling water intakes of ships which make up the vast bulk of the historical sea surface temperature record. However, this extra warm interface with the atmosphere over large areas of tropical ocean must surely have a significant effect on weather and which currently is poorly understood.
Walter, diurnal overturning circulation involves the upper ten meters or so. I don’t see how this would stop because of wind conditions.
Is this a study that you cite from?
“An important aspect of the El Niño phenomenon which deserves more attention is the effect on surface layer mixing in the ocean. Normally wave driven mixing results in a similar temperature throughout the mixed surface layer down to a depth of about 100m.”
I doubt it’s similar temperature [in range of surface to 100 meters]. Though if mean not a lot difference- less than 5 to 10 C difference, that could seem plausible.
Though when warm water are being piled up hundreds of meters of depth towards eastern side of pacific, one could see similar temperatures in surface to 100 meter depth.
Also when windy and during the night the temperature difference between surface and 100 meter depth would seem to have a less difference in temperature.
“However, El Niño conditions bring extended periods of calm and the doldrums expand greatly in latitude. During periods of extended calm wave driven mixing ceases and after a week of no wind the top meter or two at the surface can become as much as 4-5 C or more warmer than the remainder of the normal oceanic surface layer beneath. ”
It seems to me to be likely though it seems one could warmed layer which is much more than 1 to 2 meters deep. Two things, lack of deep water mixing will allow warmer water to rise and the more closer to uniform the temperature in column of water the slower this occurs.
The other process is sunlight warmed ocean in calm conditions can over week long periods make the top 1 to 2 meters significantly warmer than ocean with same amount of sunlight which has wind and waves mixing the water in top 100 meters.
barry,
Insulators provide no heat at all. They warm nothing. Put as many overcoats on a corpse as you wish. It stubbornly refuses to heat up.
If you believe the greenhouse effect is just insulation, other Warmists will disagree violently with you.
Dr Spencer’s example of an overcoat “warming” a person is misleading. An overcoat merely slows the rate at which heat leaves the body. If the person dies, the body will cool to ambient, albeit more slowly than without the insulating layer.
On the other hand, the dark robes worn by the desert Tuareg keep the body cool in the blazing sun. Old Tuareg saying- “If I’d known it was going to be this hot, I would have worn a thicker robe.” I think it was Bristol University researchers who actually measured the effect.
So still no CO2 heating effect. None at all. The proof is under your feet. No molten surface, as it once was. The surface managed to cool, in spite of all your reasons why it shouldn’t have.
Wriggle, Wriggle, Warmist Worm!
Cheers.
Greenhouse gases slow the rate at which infrared radiation from the surface escapes to space. This is the greenhouse effect.
A sweater slows the rate at which heat escapes the air adjacent to your skin.
It seems we agree on this.
I’m not sure what we disagree on. Your posts don’t make much sense other than these facts. Are you disagreeing for the sake of it, or what opinion do you think I have that earns your replies?
barry,
Warmists seem to believe that increasing the amount of CO2 in the atmosphere increases the temperature of the surface.
The atmosphere no more increases the temperature of he surface than an overcoat increases the temperature of a corpse – fresh or otherwise.
Why anyone would want to claim that the greenhouse effect increases the temperature of anything is beyond me, and presumably beyond you as well. The surface warms during the day, and cools at night, summer is warmer than winter. And so on.
Cheers.
The theory goes that adding more CO2 is like adding another garment layer. The near-surface warms as a result.
I can’t see anything wrong with this theory. If the rate at which IR escapes to space is slowed down by more GHGs in the atmos, then the surface will get warmer.
I’m not sure what you’re trying to do with the corpse analogy. Do you think the surface of the Earth emits no radiation?
barry,
Of course the Earth’s surface emits radiation. Everything above absolute zero does, continuously. So does a corpse. Insulation provides no heat.
That’s why the Earth cools at night, and in the afternoon. Adding extra insulation doesn’t heat the surface. It still cools. Boil some water, put it in a Thermos flask (the best readily available insulators I can think of). Let it stand overnight. It cools. It doesn’t get any hotter.
I wouldn’t be surprised if you have a long think about the greenhouse effect, and come to the same conclusion I did.
No CO2 warming. Any warming is due to heat increases. That’s what thermometers respond to.
I’ll leave it to you.
Cheers.
“The atmosphere prevents more than 20% of the insolation from reaching the Earths surface, and slows the rate at which the days absorbed radiation leaves the surface at night.”
Mike, what do you think causes this “slowing”?
Is it Oxygen, Nitrogen, Co2, H2o. or some other mysterious gas?
Tell us please, after all it is simply radiative physics which you claim to understand.
I emit thermal radiation. When I put a colder object on, like a sweater, that makes the air between my skin and the sweater warmer. (I’m not a corpse).
You seem to be going through all sorts of contortions. You agree that ‘greenhouse’ gases keep the surface warmer than it would be without them, owing to slowing down the rate of thermal emission to space. But your thinking seems to break down when the notion that more GHGs slows down the rate even more warming the surface is presented. Then you start talking about corpses.
I’ve thought about this for 8 years, read papers, delved into contrarian blog posts etc. Denying the enhanced greenhouse effect is nutty. You’d agree that the surface of the Earth would be colder without GHGs, but seem to believe that the level of warmth is somehow fixed regardless of whether the atmospheric concentration of GHGs changes. It seems like magical thinking to me.
You also seem to be instructing me that GHG molecules are not by themselves heat engines. Well, duh.
I’ll take the expertise of Roy Spencer and every skeptic with qualifications in atmospheric physics, as well as atmospheric physicists who are not part of the skeptic camp – who all agree that more CO2 = more warming at the surface – over the noodlings of random bloggers on the net.
Your mileage may vary.
Barry, it’s a matter of the contribution of CO2 to the GHE. CO2 is mostly redundant to atmospheric water vapor and clouds in its absorbency of IR. This redundancy means, of course, that doubling CO2 has no effect on temperature.
You are at odds with every skeptic astrophysicist here, as well as the mainstream. We’ve done some details. Eventually I have to give up and let you believe what you want to believe.
Skeptic astrophysicists? Hunh?
None of the AGW crowd address the redundancy, it’s true, but what does that tell you?
The IR absorbency of CO2 is 100% redundant to clouds. Now, who says that’s false?
Will you ignore this incontrovertible fact, as have ..all.. the other AGW advocates.
The point is that atmospheric thermalization of the CO2 IR bands takes place without CO2. As a radiative gas, CO2 is redundant to water.
Are you saying that water vapour molecules somehow get in front of CO2 molecules and absorbs before CO2 can?
CO2 and water vapourbothj absorb. A mmolecule absorbs IR, colides with another, re-emits. The process continues throughout the atmosphere.
Did you know that water vapour is scarce beyond the tropopause, but CO2 is still present in the atmos at 300ppm+ up to 50 km altitude?
Redundant. CO2 thermalization of IR within the atmosphere is not additive to water’s GHE, in the main.
CO2 is 100% redundant to the IR absorbency of clouds, meaning it adds nothing to the GHE of clouds (thermalization of IR).
It is about 50% redundant to the GHE of water vapor, meaning that it shares with water the same absorbency. This last is somewhat inexact due to variability in the atmosphere.
The bottom line is that the “shoulders” of CO2 are already thermalized; hence increased CO2 has no effect.
Water vapor present at all levels in the troposphere. See the contrails at 10 km. Water vapor is the dominant ghg at all levels of the troposphere. TOA 15 micron spectrum due mostly to high cirrus and water vapor; CO2 role greatly exaggerated.
Mike, what do you think causes this slowing?
Is it Oxygen, Nitrogen, Co2, H2o. or some other mysterious gas?
Indeed, which gases slow the rate of escape of infrared radiation from the surface, Mike? Leaving halocarbons/CFCs aside (the list is long) can you name the other gases that have this function?
Mike Flynn says:
“Insulators provide no heat at all. They warm nothing. Put as many overcoats on a corpse as you wish. It stubbornly refuses to heat up.”
But they do slow the rate at which the corpse loses heat.
“Greenhouse gases slow the rate at which infrared radiation from the surface escapes to space. This is the greenhouse effect”
I thought all radiation travels at the speed of light. Please explain where the “slowing” occurs.
Barry spouts the usual AGW twaddle.
LOLx2
Both ignorant and seemingly proud of it.
And poodle laps it up.
I thought all radiation travels at the speed of light. Please explain where the slowing occurs.
Infrared radiation is absorbed by greenhouse gases then re-emitted. This process slows down the escape of net IR to space.
Mack says:
“I thought all radiation travels at the speed of light. Please explain where the slowing occurs.”
GHGs change the direction of some of the infrared radiation — less travels upward in the atmosphere, and more travels downward. It still travels at the speed of light (in air).
Hi David Appell,
you wrote “GHGs change the direction of some of the infrared radiation less travels upward in the atmosphere, and more travels downward.”
Why?
I thought that since the atmospheric density is lower for upper layers, it was vice-versa.
That is, a photon released downward has more probability to be catched by an another underneath CO2 molecule (there are more CO2 molecules below), than one photon released upward (there are less CO2 molecules above).
Under a radiative point of view, this should make the whole GHGs atmosphere a cooling system not a heating one.
Haved a great day.
Massimo
Massimo PORZIO says:
“Why?”
Because when a molecule of CO2 absorbs an upwelling infrared photon, it emits it a short time later in a random direction, which includes back down.
This is basic science. You really ought to read up on it.
If you can do some math, this is an excellent 12-part introduction. There’s hardly any math in the first several parts:
https://scienceofdoom.com/roadmap/atmospheric-radiation-and-the-greenhouse-effect/
I understand it, but I don’t agree with the “less travels upward” and “more travels downward”.
This is could be valid only for the very first layers above the ground at the beginning of the emission when all the CO2 molecules above hadn’t already absorbed any photon.
But as the photon goes up (also because some Co2 molecules have already absorbed a photon and haven’t still re-emitted it), once absorbed and re-emitted it has more probability to be re-absorbed by a underlying CO2 molecule than an overlying one, because the CO2 molecules below are more than above, which should make the whole system better radiating upward not downward.
I know that the downward narrow FOV spectra show an apparent missing outgoing energy at the 666cm-1 bite, but the whole outgoing energy at the TOA shouldn’t be only that.
There is all the energy outgoing with other angles including the limb views, which have peaks of emissions at 666cm-1 instead.
Have a great day.
Massimo
Eventually IR escapes to space, but GHGs slow the process down. Increased GHGs mean there are more molecules in the atmos, so there is more re-emisson in all directions. If (roughly) half of re-emissions are towards the surface, doubling the amount of GHGs in the atmos roughly doubles the amount of IR radiated back to the surface, warming it. The surface temperature has to increase to radiate with the new equilibrium set by the atmosphere.
Massimo, I don’t understand your writing and handwaving.
See what barry wrote in response.
Hi Barry,
I agree with you, I know the theory, I’m contesting David in his assumption that less travels upward and more travels downward.
But reading more in deep his assertion maybe I misunderstood him.
Maybe he was arguing that increasing the GHGs concentration, less photons travel upward and more travel downward. I believed he was writing about the probability of the emitted photon of run upward or downward for the whole atmospheric path, while he is right for the small paths that photons take exiting the single molecule.
Anyways, if he was writing about the photonic vertical flux only then he was right too, but as far as we analyze photons escaping with different angles than zenith the LWIR flux spectrum changes and looking at the TOA (which is the layer that matters for the energy balance), the limb fluxes are complementary to the Nadir one, that is more CO2 equates to more escaping energy.
My point instead is that for each photon absorbed the probability of being emitted downward and reach again the ground is lesser than being emitted upward and escaping in the outer space. That because the density of any gases (included GHGs), reduces as function of altitude.
About the ability of warming up the surface by back-radiation, I would agree only if someone tell me why we don’t take account also of the whole energy needed to keep up in the sky all that bunch of molecules which the atmosphere is made of. The gaseous molecules stay there against gravity, not because of a kind of magic, but because the heating ground fires them upward losing energy that it receives back delayed later, exactly as per the photonic LWIR energy emitted and received back per the GHGs theory. With a little difference, the photons based exchange is quantized by the number of GHGs molecules in the sky (so it is independent by ground temperature), while the work done to keep the atmosphere up there is a function of the ground temperature, that is the higher the temp the higher the energy delayed.
If it was a really positive feedback, I suspect we already experienced a runaway.
Thank’s God we have a bunch of water on this planet, with evaporation and condensation stabilize our climate, but of course there is someone out of here who is ready to support that that is positive feedback too.
About David,
I’m not handwaving, I’m just proposing hypotheses, tell me that they are wrong by scientific explanations and I agree with you.
Have both a great day.
Massimo
I agree with you, I know the theory, Im contesting David in his assumption that less travels upward and more travels downward.
That’s the case with the current net flux. The energy budget is out of equilibrium at the top of the atmosphere. Incoming solar energy is slightly more than outgoing infrared energy. Ultimately the amount is the same (when net equilibrium becomes equal), but if the TOA equilibrium is out of balance, the atmosphere has to change temperature to re-equilibrate. The sun is not going to do that. 🙂
Technically the TOA is always disequilibriated, but the net equilibrium over time has been out of balance in one direction. I think that’s what David means by more down less up. Net energy budget is perennially catching up.
Civility is refreshing. You have a great day, too.
Hi barry,
“Thats the case with the current net flux. The energy budget is out of equilibrium at the top of the atmosphere. ”
If you still haven’t did it, I suggest you to read my reply to David here:
http://www.drroyspencer.com/2016/07/record-warm-2016-what-a-difference-one-month-makes/#comment-216512
IMHO we don’t know the effective outgoing LWIR radiation, we just suppose it.
Of course is just a conjecture of mine, but I never find any trace of documentation which invalidate it.
Have a great day.
Massimo
IMHO we dont know the effective outgoing LWIR radiation, we just suppose it.
Satellites measure the amount of outgoing IR to space and incoming solar radiation. One of the many pieces of evidence is spectral darkening of IR radiance in the bands associated with CO2 over time.
Ground instruments also measure the amount of IR heading Earthward from the atmosphere. We have monitored an increase over time.
Of course is just a conjecture of mine, but I never find any trace of documentation which invalidate it.
List of peer-reviewed studies on observations of outgoing IR measured by satellites:
https://agwobserver.wordpress.com/2009/08/02/papers-on-changes-in-olr-due-to-ghgs/
List of peer-reviewed studies on observations on downwelling IR to the surface measured by ground-based instruments:
https://agwobserver.wordpress.com/2009/08/19/papers-on-changes-in-dlr/
Paper list of radiation budget, some are observational, some theoretical:
https://agwobserver.wordpress.com/2009/10/16/papers-on-earths-radiation-budget/
These are what you’re looking for.
Hi Barry,
“Satellites measure the amount of outgoing IR to space and incoming solar radiation. One of the many pieces of evidence is spectral darkening of IR radiance in the bands associated with CO2 over time.”
I still suggest you to read my reply to David, especially my reply to his: The chart shows the flux integrated over all outgoing angles.”
Have a great day.
Massimo
Massimo, the studies listed are of different satellite and ground-based instruments and measurements over time. They all corroborate.
They verify what’s expected from physics.
Have a look at the lists. Read some of the papers. Most of them have full versions.
You said you knew of nothing that contradicted your opinion. Dozens of observational studies are now available to you.
Hi Barry,
“the studies listed are of different satellite and ground-based instruments and measurements over time. They all corroborate.”
No doubt about that, they all measures the very same parameter.
The problem is whether or not that parameter represent the whole outgoing radiation at the TOA.
“You said you knew of nothing that contradicted your opinion. Dozens of observational studies are now available to you.”
Really?
Since all the studies I read till today never taken in account that fact because the climatologists believe that it suffices take the radiation pointing the mass barycenter, I’ll be very grateful with you if you highlight me at least one of those “dozens of of observational studies” you linked, which stated that they considered the whole hemispheric radiation spectrum outgoing at the TOA.
Sorry, I’m only an electronic engineer, and I’m Italian. So I’ve 2 issues wasting my time reading those papers, the first is that I’ve to spend very long time reading them because of my bad English knowledge, the second is that this is not my field, and sincerely being almost sure that those papers say nothing about it, I don’t really want to get bored myself with them. It could really be a very waste of time for me.
I don’t need 10, 100, 1000 proof that I’m wrong it suffices 1.
So, as I already wrote above, if you know that there is at least one paper which deals with the issue of the angular non homogeneous spectrum at the TOA, I’ll be very grateful with you if you link that paper.
Have a great day.
Massimo
“Because when a molecule of CO2 absorbs an upwelling infrared photon, it emits it a short time later in a random direction, which includes back down.”…David Appell
###
Nope. No re-emission. The energy is thermalized. Read up.
Your welcome.
☺
Hi mpainter.
Yes and no.
It depends on extinction time and the time between consecutive multiple bumps between molecules.
Anyways, in low troposphere you may be right.
Have a great day.
Massimo
Hi, Massimo
The way it was explained to me is that a gas molecule has billions of collisions/second and that CO2 re-emission was timed in millionths of a second, presumably in the lower troposphere, not at the fringes of space. It is through the collisions that a radiative gas warms the atmosphere, transferring the energy absorbed from IR to nitrogen and oxygen molecules.
Yet I’m told that the dry lapse rate is adiabatic. This fact hardly squares with the concept of energizing the first several meters of the troposphere through surface radiation. AGE has many inconsistencies.
Hi mpainter,
I partially agree with you, because in my opinion there is still space for re-emission, because it’s not the time between single bumping that must be used to establish the probability that the photon’s energy is thermalized, but the time between the event of two contemporary bumpings of the CO2 molecule with two other molecules. Only in that case the other two molecules involved in the event gain KE, and the CO2 molecule loses the photon’s molecular bending energy.
So, I think there should be time for some photons re-emission indeed even at lower troposphere. Not so much I guess, but it’s just a guess.
Have a great day.
Massimo
David the solar parameters from 2010 -recently were way above the solar criteria I have called for which will result in the sun having a cooling effect on the climate.
The climate not cooling in the past 6 years does nothing to weaken my theory.
Now that solar is reaching my criteria only now will we know if my thinking is correct.
David, if solar as it appears to be doing reaches my criteria and global cooling does not come about then you can say I was wrong but until then your words are meaningless.
It will take several years. Boo to the fast food and eating on the run mentality.
Salvatore wrote:
“The climate not cooling in the past 6 years does nothing to weaken my theory.”
When you make prediction after prediction and none of them come true, your theory is clearly a very poor one.
You lose credibility.
Wrong David.
I have stated in my theory that in order to have global cooling due to solar activity the sun would have to reach certain criteria.
The sun from 2010 until very recently did not reach the criteria therefore it should have not had a cooling effect on the climate which is what happened.
Now the sun is starting to reach my criteria and now we will see if the climate responds.
The prediction I made wrong back then was solar ,in that I did not think the maximum of solar cycle 24 (although weak) would send the solar criteria I called for for cooling, so far above the values I had called for and for such a long period of time.
David if my solar criteria is met which seems is now finally starting to happen and the global temperatures do not respond by going down then you will be able to say I was wrong and I will agree.
Crunch time is coming and we will see.
Crazy Davy would do well to worry about his own lack of credibility instead of running around worrying about the credibility of others…
“Crunch time is coming and we will see.”
And you’ve been saying that for years and years. But it never happens and you just move the timeline ahead, pretending no one knows your history of terrible predictions.
Dave I do not think you know how to read because if you did you would have a different reply.
Your comment above is the same old thing, Salvatore — you throw out a bunch of numbers, and then predict imminent cooling.
You were wrong in 2010, 2012, and 2013 (twice). I detect a trend….
Remote Sensing System’s June LTT has been posted and it is down again. UAH and RSS do not always track identically, month-to-month (after all RSS has a smaller “cover” than UAH), but the net change over a few months is generally very close. Thus:
Change in UAH anomaly, from February 2016 is – 0.49 C.
Change in RSS anomaly, in same time is – 0.51 C.
– 0.49 C
That is ‘ minus 0.49 C ‘, not ‘ “dash” 0.49 C. ‘
ONI ENSO index (Nino3.4 SSTs) is updated.
http://www.cpc.ncep.noaa.gov/products/analysis_monitoring/ensostuff/ensoyears.shtml
Compared to 1998, the current el Nino has lasted longer (started earlier) and is a little warmer for the last few months than ’98.
It’s fun to watch “Team Pseudoscience”, composed of “barry”, “doctor no”, and of course Davie. What a great comedy team!
They wallow in the GHE theory that has absolutely NO validation. The “theory” is based on a bogus mathematical equation that has NO mathematical proof. The equation creates energy out of “thin air” (400 ppmv)!
Folks, you don’t get great comedy like this everywhere.
Ignorant, proud, and now hysterical.
(leave science to the big boys)
Show the mathematical proof of the bogus Arrhenius CO2 equation, bucko.
It’s put up of shut up time.
Show that current radiation math is the same as his. Cite IPCC, and not as a historical note.
Arrhenius’ equations were outmoded years ago, after the US air force in WWII examined the atmosphere to help with radio signalling.
A seminal paper on heat transfer through the layers of the atmospheric gases and clouds is this one from 1978. Plenty of math for you to audit.
http://www-ramanathan.ucsd.edu/files/pr15.pdf
You keep avoiding the issue, barry. I wonder why.
You can’t throw the Arrhenius CO2 equation overboard, thinking that will save your sinking ship. The IPCC pseudoscience is based on the equation.
Arrhenius’ ‘equation’ gave him a 5.4K temp rise to doubling CO2. that’s nearly twice as much as the mean estimate currently.
see me smile
☺
geran, most of my views are consonant with Roy Spencer, Roger Pielke Snr and so on. Qualified skeptics of the IPCC etc.
It’s a pity that there are skeptics who deny the greenhouse effect and other basic concepts that Dr Spencer listed in his article ‘Skeptical Arguments That Don’t Hold Water.’ As he said in that post, these people make the skeptics look bad. I also have some sympathy with him that his blog is peppered such in nearly every comments section.
You and others would do well to acquaint yourselves with this:
http://www.drroyspencer.com/2014/04/skeptical-arguments-that-dont-hold-water/
The absolute certitude of many in the debate, the ones who seem to have zero curiosity about science, is a bit sad. All this access to information and fora to enquire of experts in near real-time, and for many it seems the deluge of data has closed their minds, as if it’s too much info to take in, so they take a position instead and hold to it with minds permanently shut.
barry, Dr. Roy has a great sense of humor. He has also stated that measuring sky temps with a handheld IR thermometer is proof of the GHE.
Was he confused, or was he just kidding?
I’m sure the points he made in the Skeptical Arguments That Don’t Hold Water were quite serious. He banned D**g C*t*on, serial denier of the greenhouse effect, from posting here. Dr Spencer and Anthony Watts have no patience for time-wasters of that ilk.
He bought a more powerful instrument to demonstrate increased back radiation nearer the surface.
http://www.drroyspencer.com/2013/05/imaging-the-greenhouse-effect-with-a-flir-i7-thermal-imager/
I doubt people who disagree with him have ever performed a comparable experiment. Much easier to read blogs – and then pick the ones you just happen to like.
Dr Spencer has posted more on the greenhouse effect.
http://www.drroyspencer.com/2010/06/faq-271-if-greenhouse-gases-are-such-a-small-part-of-the-atmosphere-how-do-they-change-its-temperature/
All the qualified skeptics – Lindzen, Pielke Snr and Jr, John Christy, Anthony Watts (somewhat qualified) agree on these fundamentals. That leaves random bloggers on the net who disagree with IPCC skeptics and the rest. Must be a good reason why the skeptic experts are considered less knowledgeable than random bloggers…
It’s a question of the contribution of CO2 to the GHE. It’s redundant to atmospheric water vapor and clouds and it’s GHE contribution is vastly exaggerated. Measured IR in the CO2 band is about 3% of the atmospheric flux.
Nice obfuscation, barry.
So, does a handheld IR thermometer prove GHE?
Obfuscation? Dr Spencer has written more and used more powerful instruments. Did you not read the links? Are you obfuscating those by repeating yourself?
Seriously, you can wave off every atmospheric physicist if you like, but you’re also saying that Richard Lindzen, Roy Spencer, John Christy and Roger Pielke Senior – prominent skeptics researchers who are qualified in the relevant topic – are also wrong.
When every skeptic expert agrees with mainstream experts on the fundamental greenhouse effect, rejecting that view in favour of random bloggers is crazy.
To Warmists of the Insulation subcult –
The atmosphere supports a vast amount of particulate matter. Brownian motion keeps particles above certain sizes permanently suspended. There are also things like clouds. As well, EMR which is sufficiently energetic is absorbed by oxygen, resulting in the formation of ozone. The rate of transmission of energy through a medium is effectively retarded as a result – in both directions. The atmosphere is not completely transparent to any wavelength of light at all. Even Tyndall realised this, and assigned a nominal opacity to dry air, free of CO2. Free space – a vacuum – is totally transparent, nothing else.
However, notwithstanding Warmist misunderstandings about physics, consider what happens to a molecule of say, CO2, if it absorbs a photon. Simply put, the molecule’s speed increases. This is why pressure increases when gas is heated in an enclosed space.
However, the molecule collides with others, and as a result, transfers momentum to them, whether they be oxygen, nitrogen, or whatever. This can be noticed when taking an atmospheric temperature. Regardless of the concentration of CO2, a sample of air at 20 C is at that temperature. A sample of pure oxygen can also be heated to 20 C if you so desire. Interestingly, without continued external energy being supplied, all the gases in a mixture will continuously emit energy at longer and longer wavelengths, eventually ceasing to radiate energy when absolute zero is reached.
No magical CO2 properties, unfortunately.
As to the insulating properties of GHGs, temperatures drop at night, as energy from the Earth’s radiates away. In arid areas, say tropical deserts, the temperature drops sufficiently quickly that the Romans made ice in the Libyan desert using this principle. The same principle has been used in other deserts – in Rajasthan, for example.
If CO2 is well mixed in the atmosphere (as claimed by Warmists), the insulating effect from CO2 seems to be conspicuously absent in arid tropical deserts. Extremely hot during the day, bitterly cold at night.
However, H2O is supposedly the most effective GHG, and it is obviously lacking in the atmosphere over arid regions. The less insulation, the more variation between daytime and nighttime temperatures, as I said.
Sorry chaps – as Fourier pointed out, at night the surface loses all the heat it absorbed during the day, plus a little bit of the Earth’s internal heat.
Hence the Earth’s surface has cooled from its initial molten state to its present conditions – roughly -90 C to +55C. No greenhouse effect needed, or observed.
Cheers.
The reason temperature drops in the deserts is because water vapour, the strongest GHG, is hardly present. If CO2 was not an ‘insulator’ these regions would drop to much colder temps at night, approaching that of the dark side of the moon. CO2 (and, to a much lesser extent CH4 and O3) keep deserts 100C warmer at night than they would be with no GHGs.
Earth’s internal heat has essentially zero part to play re temps on the surface. The moon has an internal temp of about 1000C, but this makes little difference to surface temps on the dark side (-150C).
Wrong, Barry, water vapor is still the dominant ghg of the dry desert atmosphere. In the driest of all, over Antarctica, it is twice the concentration of CO2. The reason overnight lows are not lower in the Sahara is due to wv, not CO2.
barry, you are of course aware of the fact that the surface of the Moon has about 29 times as much time to cool between sunset and sunrise as the surface of the Sahara desert.
The average cooling rate of the latter is actually much higher than that of the former …
http://onlinelibrary.wiley.com/doi/10.1029/2011JE003987/pdf
Fastest rate of temp drop at moon equator is 100K over 12
(Earth) hours, or 8.3K/hour. This is less than half the diurnal range of the equatorial moon.
How does this rate compare with deserts cooling after sundown?
Lunar equator bottoms out at about -150C 10 terrestrial days after dark.
Arctic bottoms out to about -34C a couple of months after dark (Winter period).
The reason the equatorial Lunar surface is 100K colder after 10 days without sunlight than the Earth’s North Pole after a couple of months without sunlight is because the Earth has an atmosphere with greenhouse gases that slow the rate at which the Earth’s surface cools.
“Fastest rate of temp drop at moon equator is 100K over 12
(Earth) hours, or 8.3K/hour. This is less than half the diurnal range of the equatorial moon.”
Sure. Which is equivalent to the actual solid surface somewhere in the Sahara desert cooling by ~3.4 degrees during the steepest 25 minutes of temperature drop from the peak to the trough of the diurnal cycle.
But the overall drop in surface temperature at basically any site in the Sahara desert is much larger over a 12h period of cooling than it is at any place on the Moon over a 14-15d period of cooling … per hour. And so the average cooling rate is much higher in the Sahara than on the Moon. So if we let our Saharan site cool for another two weeks without any hint of sunshine, and without any warm air advected in from other places (like in the Arctic during winter), and without any water vapour condensating anywhere, why shouldn’t it be able to cool as much in the end as the lunar surface (200-300 K), when it cooled by say 30-40 K only during the first half day?
And also, why shouldn’t it heat much more during the day if that day lasted for two weeks rather than 12 hours?
So if we let our Saharan site cool for another two weeks without any hint of sunshine, and without any warm air advected in from other places (like in the Arctic during winter), and without any water vapour condensating anywhere, why shouldnt it be able to cool as much in the end as the lunar surface (200-300 K), when it cooled by say 30-40 K only during the first half day?
We have our answer right here on Earth, as I pointed out above.
Lunar equator bottoms out at about -150C 10 terrestrial days after dark.
Arctic bottoms out to about -34C a couple of months after dark (Winter period).
The reason the equatorial Lunar surface is 100K colder after 10 days without sunlight than the Earths North Pole after a couple of months without sunlight is because the Earth has an atmosphere with greenhouse gases that slow the rate at which the Earths surface cools.
After 2 months of darkness on Earth, the Arctic Winter is still 100k warmer than the equatorial lunar surface at the deepest part of night.
But the overall drop in surface temperature at basically any site in the Sahara desert is much larger over a 12h period of cooling than it is at any place on the Moon over a 14-15d period of cooling
The moon rotates slowly – 29 Earth days in relation to the sun. The slow rotation stretches the length of declining incidence over days instead of hours. When the sun is completely out of sight, temps drop precipitously. Also, the lunar surface has had 14 days of continuous sunlight and temps above 350K. Despite this long build up of thermal inertia at the surface at much higher temps than Earth, temps drop precipitously when full darkness arrives and bottoms out at 100K colder than the depths of Arctic Winter (or night-time deserts) Reason: no atmos to slow the process after complete darkness falls.
Arctic Winter answers your question. After 2 months of darkness, the temp drop is nowhere near the amount that occurs in 10 days of lunar darkness.
The reason this is so is because Earth has an atmosphere with GHGs. Heat travels latitudinally as well as to altitude. If GHG effect makes little difference, the Northern Arctic would not receive that transported heat and retain it. It would escape to space long before it reached 80 degrees N in arctic Winter.
Hi barry,
“The reason the equatorial Lunar surface is 100K colder after 10 days without sunlight than the Earths North Pole after a couple of months without sunlight is because the Earth has an atmosphere with greenhouse gases that slow the rate at which the Earths surface cools.”
So, is it just radiative warming?
No matter the effects of Hadley cells in your world?
Uhmmm…
I left Kristian play with you, he is much more educated in this field than me, who I’m just an ignorant outsider.
Have a great day.
Massimo
Polar Hadley cell is relatively thermally isolated in Winter when the polar vortex is strongest. Hadley cells operate over deserts, too. Doesn’t stop quick cooling there. Wouldn’t stop quick cooling at the pole, where there is 5 months of night. Average temp of the North pole is -40C in Winter, where darkness last 5 months. Temp equatorial moon is -170C at night where darkness lasts 13 days.
Polar Hadley cell takes warm air to the tropopause at the 60th latitude where the air is thin. If minimal GHG effect, that layer would quickly bleed radiation to space as the air heads poleward, especially in Winter.
Barry,
please, do you really believe that the mass of air above the pole in winter is insulated from the other at lower latitude?
I cited Hadley cells just to highlight you that the atmosphere is dynamic. Air moves following thermodynamic laws.
If you really believe that CO2 is the only warming factor at the pole in winter, you lose any credibility for me
.
As always said I am electronic engineer, so an ignorant in this matter, but I can’t get your statement as true.
Have a great day.
Massimo
Barry,
please, do you really believe that the mass of air above the pole in winter is insulated from the other at lower latitude?
Not completely, but in Winter the polar vortex is strongest. The temperature gradient between pole and mid-latitude increases in Winter, which means stronger circulation for polar cell and more outward push of polar cold temps. Lower latitude cells are weaker because the temp gradient isn’t as steep.
In summer there is more warmth permeating the pole from lower latitudes, as the jet stream relaxes and meanders more.
The Antarctic has an even stronger circumpolar vortex (both atmospheric and ocean). The Antarctic is the most thermally iinsulated place on Earth, except for the peninsula, which protrudes beyond the vortices, and has warmed at a rapid pace compared to the global average.
CO2 concentration is 300ppm+ at 50 km altitude, Water vapour is barely present at the tropopause (8 km). The warmer air at this level would quickly dissipate if not for GHGs above.
Let’s do a though experiment and give as much power to the notion that heat transport through the atmosphere is responsible for Arctic surface temps in Winter.
With no atmosphere, baseline surface temps at the pole after 50 days of darkness should be at least as cold as the lunar equatorial surface after 10 days. -170C.
Let’s imagine that equatorial heat flows poleward without pause, without cooling, and without rising from the surface. Let’s give it a value of 50C.
-170C + 50C = -120C
That’s 80K cooler than actual Wintertime temps at the pole after 50 days of night.
Let’s allow an extra 25K added from ocean heat transport, constantly replenished.
Let’s allow thermal inertia at the surface to retain an extra 25K above baseline after 50 days of night.
We’re left with to 70C surface temps allowing for these factors.
Still 30C warmer at the terrestrial polar surface after 50 days of night than it is at the equatorial moon after 10 days of night.
These values are unrealistically large, but allowing for them, what is giving us the extra 30C warmth?
Amending (it’s late):
Still 30K cooler at the terrestrial polar surface halfway through the polar night than the observed Winter average.
What’s giving us the extra 30K warmth?
mpainter says:
July 4, 2016 at 7:47 PM
Wrong, Barry, water vapor is still the dominant ghg of the dry desert atmosphere. In the driest of all, over Antarctica, it is twice the concentration of CO2. The reason overnight lows are not lower in the Sahara is due to wv, not CO2.
###
Since you missed my comment, seemingly, I copy it here so that you can respond,
Barry.
Hi Barry,
I’m not sure where you get those values of temperature, and what you are arguing with that.
If you are arguing that those missing 30K are due to GHGs, I think that you are doing a very simplistic case of circular argument.
Do you really think that keeping the molecules of air up in the sky doesn’t anything to the ground temperature?
I suggest that if the GHGs conjecture worked then also the heating by keeping gases “on air” must work the same, or even better because in this second case all the energy involved in the process is returned back to the ground.
Have a great day.
Massimo
mpainter, Kristian is saying that the greenhouse effect is entirely minimal. He rejects water vapour (as well as CO2) as of being of much consequence in keeping the surface warm.
Minimum concentration of water vapour in the lower troposphere goes down to 0.01%. CO2 is 0.04%. In dry air, CO2 is 4 times the concentration of water vapour.
Massimo, by coincidence 30K is roughly the calculated extra surface warmth due to GHGs.
Dr Spencer (and the other qualified skeptics) all agree on the greenhouse effect, and that GHGs keep the surface 33K (diurnal average) warmer than it would be without GHGs.
I consider rejection of the greenhouse effect well outside the bounds of reality. So do prominent skeptics. Anthony Watts has banned proponents of this idea (Skydragon Slayers) from his website. Dr Spencer has banned one here who kept posting this idea, and bemoans that skeptics take on this position (says it makes skeptics look bad).
We have empirical evidence of the effect from radiance measurements over time of outgoing IR in the bands associated with CO2. We have empirical evidence of the effect from radiance measurements of downwelling radiation from ground-based instruments. The results confirm what Dr Spencer, Richard Lindzen, John Christy, Anthony Watts, Roger Pielke Snr – prominent researchers qualified in atmospheric research – all agree on, along with the mainstream experts.
If you’re interested, here are lists of papers observing changes in infrared radiation upwelling and downwelling from the atmosphere over time.
https://agwobserver.wordpress.com/2009/08/02/papers-on-changes-in-olr-due-to-ghgs/
https://agwobserver.wordpress.com/2009/08/19/papers-on-changes-in-dlr/
Best wishes,
Barry.
Yeah, but Barry said that CO2 is the dominant ghg of the Sahara, and Barry has not acknowledged his error.
Hi Barry,
I’m not contending the satellite’s spectrum measurements and their changes as function of the CO2 concentration. The issue is related whether to consider those measurements the effective outgoing radiation for a single point of the TOA or not.
Those spectra perfectly fit the theoretical transmittance of the atmosphere at Nadir, but IMHO they can’t be used for estimate the effective total outgoing radiation, because they don’t account for other angles outgoing radiation which surely reduce the effect of GHGs. That because (for example), the limb radiation is complementary to the radiation at Nadir, so it increases as the GHGs concentration increases.
About the 33K issue: I don’t believe that they are all attributable to GHGs, because I still think to the whole energy needed to keep all the gases in the atmosphere up there. The process is the same as per the GHGs; the ground transfers energy to the air molecules and fires them up (transferring it as heat), but all of them return back by gravity. This returning back to the ground of the molecules returns all the energy back to the ground too (still transferring it as heat).
My question is: where is the difference between the GHGs effect where only half the energy at a particular wavelength return back to the ground and this effect which surely exists, where all the energy is returned back to the ground?
This process exists because at 0K in case the molecules are not affected by the gravity of a bigger mass, all gases collapse into a single point becoming a solid; while in case they are affected by a big-mass gravity force (such as for the Earth case) the gases collapse down to the big mass (the ground).
So it’s evident that the whole atmosphere exist because of the energy flow through it. Thus if the GHGs effect matters for those 33K, also this effect must be accounted.
How much is an another issue.
Have a great day.
Massimo
Gaseous water represents a small but environmentally significant constituent of the atmosphere. The percentage water vapor in surface air varies from 0.01% at -42 C (-44 F)[16] to 4.24% when the dew point is 30 C (86 F)
CO2 concentration is 0.04%.
The atmosphere over inland Antarctica has the lowest water vapour concentration on the planet. (I don’t remember saying anything about the Sahara)
Water vapour concentration beyond the tropopause (10km altitude) is virtually non-existent. CO2 has a much greater relative concentration up to 50 km (300ppm+).
barry says:
July 4, 2016 at 6:55 PM
The reason temperature drops in the deserts is because water vapour, the strongest GHG, is hardly present. If CO2 was not an insulator these regions would drop to much colder temps at night, approaching that of the dark side of the moon. CO2 (and, to a much lesser extent CH4 and O3) keep deserts 100C warmer at night than they would be with no GHGs.
##
Barry, here is your error. Now you have chance to correct your error. Let’s see if you even confess your error.
Present average temp of the Earth is 15-18C, not 55C.
Not sure you want to compare the early atmosphere (no oxygen) with today. The high surface temp of the earth coincided with much higher CO2 levels 4 billion or so years ago….
But it’s a daft comparison to begin with. Completely different terrestrial structure, atmospheric structure, solar luminosity (much lower) etc.
barry, do you realize your pathetic desperation? High temp in my area today was 96 F. But for you Warmists, if was 960 F.
When science means nothing to you, why complain about a decimal place?
Rank propaganda with the cherry-picking at January 2008. So much for Barry.
barry,
What part of what I wrote do you disagree with?
You’re doing the Warmist Wiggle, by the look of things.
If I’m wrong, I’m wrong.
If you’d care to correct me by quoting something I said, and providing facts to show I was wrong, I’d be grateful.
To keep claiming that insulators create a rise in temperature to a mainly externally heated body like the Earth, is just delusional. A Warmist fantasy.
I’ll just point out that the Earth has cooled over its lifetime. Nothing was able to stop it. No energy balance there, at all. It cooled. It’s still cooling.
Try and stop a white hot ball of rock from cooling if you wish. Use the finest insulator you can find. Nope, it still cools. Try and heat water using the 300 W/m2 emitted by an iceberg. Nope, doesn’t work. Climatological Warmist physics only apply in the Warmist fantasy world of toy computer programs.
Cheers.
The Earth has not cooled steadily; there have been significant periods of warming:
https://en.wikipedia.org/wiki/Geologic_temperature_record#/media/File:All_palaeotemps.svg
How do you explain those, if you think the Earth is just a big ball cooling off?
DAVID post the Holocene optimum the earth has been in a cooling trend overall with periods of warmth within the cooling trend.
The warming trend from 2008, UAH6.5, is 0.36/decade (3.6C/century).
Apparently warming has accelerated since Jan 2008.
If we exclude 2016 data (el Nino), the trend is:
Jan 2008 – Dec 2015 = 0.23C/decade.
Looks like warming is back, and stronger, since 2008 even if we exclude the 2016 el Nino year.
I’d appreciate it if skeptics explained carefully why this is wrong.
(Ad hom will be ignored. Only substance will be attended to)
barry,
Thermometers respond to heat, not CO2. This should tell you all you need to know.
Maybe you can show otherwise.
Cheers.
Again, you prove you don’t understand anything.
The El Nino effectively started at the beginning of 2015
There was NO WARMING between the end of the previous El Nino effect and the start of the next on.
https://s19.postimg.org/nmwvbguyb/UAH_after_El_nino.png
And from the graph anyone can see your utter deceit in cherry-picking 2008 as your starting point
Andy, please explain what is different about picking 2008 as a start-date and picking any other year.
IOW, what’s a mathematically sound way of rejecting cherry-picks?
Barry, your cherry-picking is too obvious.
I’d appreciate someone laying out the reasoning here. How is picking this period any less valid than picking any other?
I’m hoping someone will go into a little detail. I have a reason for asking for that, which you may enjoy if anyone can make a cogent reply.
Understanding the climate system.
You should try it some day… beyond you for certain.
(Trend Jan 2008-Dec 2014 is 0.17C/decade, by the way. Warming has resumed at higher pace?)
No warming in the satellite era except for the step-up due to increased insolation, Barry. Otherwise, two flat trends joined by the step-up.
Why is my selection less valid than any other? Surely there is a well-reasoned explanation beyond “it’s a cherry-pick.” How does one determine what is and isn’t a cherry-pick in a neutral way?
There is a warming trend since 2008. I’m curious to know how skeptics reject that time period in a way that could be applied to any other. IE, a formula or some such that determines what is and isn’t a cherry-pick.
There was a steeper cooling period from 2002-2008.
How do you reconcile that with CO2 warming.
GHGs creates long-term warming, but there are other, shorter-term influences too.
AGW doesn’t mean the temperature increases monotonically year after year.
Ghg created long term cooling: the ice age. Right? CO2, water vapor, ozone,..right?
There was a steeper cooling period from 2002-2008.
Do you think these trend periods are meaningful? If so, what is your criteria? If not, why not?
What I’m looking for is not to prove warming or cooling, but to get an idea from people how they establish that a trend is meaningful or a cherry-pick, or statistically unsound.
IOW, is there a standard that skeptics hold to when analysing trends?
Until Mike Flynn (below) I’ve never seen a skeptic describe any kind of formula or test or parameter that determines whether a trend is sound or not.
Mike, by the way, espoused that 30 years was a minimum requirement for establishing a climate trend. He cited WMO, so I already know the rationale behind it, being familiar with the WMO formula.
But other skpetics here use shorter time periods. I’m wondering if they have any kind of standard at all (beacause of not, then the temperature change between one month and the next could be described as a meaningful trend WRT climate change.
So, Andy, do you have a standard method for assessing the validity of a trend?
And just to play your moronically childish cherry-picking games.
The COOLING TREND from 2002 to 2008 was -0.26C/decade.
(Looks like warming is back, and stronger, since 2008 even if we exclude the 2016 el Nino year.
Id appreciate it if skeptics explained carefully why this is wrong.)
Two things wrong here. You start in a strong La Nina year and end in a neutral year. So of course you have a high slope. Secondly, anything under 15 years is not very meaningful so short periods really accentuate cherry picked starts or ends.
1. No warming in the UAH satellite record from 1980 to 1998 El Nino
2. No warming between the end of that El Nino in 2001 and the start of the current El Nino at the beginning of 2015.
3. No warming in the southern polar region for the whole 38 years of the satellite record.
4. No warming in the southern ex-tropicals for 20 years.
5. No warming in Australia for 20 years, cooling since 2002
6. No warming in Japan surface data for the last 20 years, No warming from 1950-1990.. zero trend
7. No warming in the USA since 2005 when a non-corrupted system was installed, until the beginning of the current El Nino.
8. UAH Global Land shows no warming from 1979 1997, the no warming from 2001 2015
9. Iceland essentially the same temperature as in the late 1930s as now, maybe slightly lower
10. Southern Sea temperatures not warming from 1982 2005, then cooling
11. Even UAH NoPol shows no warming this century until the large spike in January 2016.
That is DESPITE a large climb in CO2 levels over those periods.
There IS NO CO2 WARMING effect.
The ONLY warming has come from ElNino and ocean circulation effects.
“1. No warming in the UAH satellite record from 1980 to 1998 El Nino”
This is wrong, as is easy to show by doing a basic calculation.
Linear regression over that time period (up to Dec 1997) gives a trend of 0.093 C/decade — a warming of 0.18 C.
Yawn!
https://s19.postimg.org/f3dhdpmlv/UAH_before_El_nino.png
That chart leaves out the first 13 months of UAH LT data, which were among the coldest in the record.
Why is that?
I said no warming from 1980 – beginning of El Nino.
You obviously have great reading difficulties.
No wonder you are stuck writing low-end sci-fi in a backwater rag.
And if you knew anything about El Ninos, you would get it.
Not expecting anything.
Fetch bot, fetch. !!
You’re trying to pass off deceptive charts and hoping no one notices. But people notice.
You’re doing numerology, not science.
You’re cherry picking — choosing beginning and end points purely to get the result that you want, without regard to their scientific significance.
That’s all you got here.
Tsk tsk.
I said no warming from 1980 beginning of El Nino.
1982/3 was a super el Nino. This would interfere with the trend analysis.
Shouldn’t 1982/3 be excluded too?
Just looking for a consistent standard.
“I said no warming from 1980 beginning of El Nino.”
So there is no warming from 1/1989-12/1996, but there is +0.09 C/decade of warming from 12/1978-12/1996.
You just fiddling with the interval boundaries to get a result you want, while paying no attention to the physical significance of those boundaries or what the trend says about climatology.
Yes, that how it looks to me.
I get a 30-year warming pause from about 1940 to 1970 using surface data sets. And, it’s statistically distinct from previous warming trend. However, warming resumed after 1970.
Suggesting to me that the longer-term signal can be temporarily suspended due to other changes (in the mid-century case, by global dimming resulting from increased industrial aerosols).
With a strong La Nina forecast, it will be HILARIOUS to watch as barry and his brain-washed mates as temperatures drop back down to the trough of 2008 or 2011.
And then with the sleepy sun, DON’T COME BACK UP AGAIN 🙂
The squirming and scurrying back into their crevasses with be a joy to behold. 🙂
“Thermometers respond to heat, not CO2.”
Yes, and there is more of it in the lower troposphere when there is more CO2 in the atmosphere.
But not much more — almost all the trapped heat goes into the ocean. Lower troposphere heating since 1978 has been less than 0.01 W/m2 since 1978, I estimate from a calculation like this:
http://davidappell.blogspot.com/2015/05/heat-changes-due-to-uahs-new-dataset.html
whereas the top half of the ocean has gained 0.61 W/m2 just since 2005, according to a recent paper in Nature Climate Change:
http://www.nature.com/nclimate/journal/v6/n7/full/nclimate3043.html
The lower troposphere has warmed and will warm more, but it’s a pretty lousy place to track global warming, especially on a decadal scale.
David Appell,
Foolish person. Try and trap some heat. Now store it for a bit, in an environment which is hotter or colder than the heat which you trapped.
How did that work out for you?
After four and a half billion years of heat trapping, the Earth’s surface has cooled. Amazing, wot?
The seas even stopped boiling. Did they stop trapping heat? Where did it all go?
Silly. Silly. Silly. Heat affects thermometers, and CO2 provides none. Left to itself, it will rid itself of heat continuously, until it reaches absolute zero!
Foolish Warmists – they believe anything.
Cheers.
“Heat affects thermometers, and CO2 provides none.”
CO2 slows the rate of cooling.
Imagine a gas in a box, which has a constant internal heat source.
Now reduce the box’s rate of heat loss.
What happens to the temperature inside the box?
Or, imagine the Earth, which has an external heat source . . . Actually, I prefer reality to your imaginings.
Foolish Warmist. Irrelevant and pointless analogies. What’s wrong with facts? Don’t suit your agenda? So sad – too bad!
The Earth’s internal source is not constant. After four and a half billion years, most of the initial radioactive elements have decayed. You may have noticed that the surface is no longer molten. It has cooled.
Warmist silliness that you can increase the temperature of the surface by adding CO2 to the atmosphere would be laughable, if it wasn’t for the fact that so much money has been wasted pursuing this particular piece of nonsense.
Oh well, that’s life amongst the fools!
Cheers.
Answer the question — it’s a simple one, and illustrates the basic point without getting into complexities.
Go ahead.
David Appell,
I hope you don’t mind if I disobey your order.
I’ve better things to do than playing stupid Warmist games. What has your question to do with reality? Have you stopped eating too much? Answer the question, I demand it!
Don’t be stupid. The Earth has cooled. Deny, divert, confuse all you wish.
You still can’t heat anything using the magical powers of CO2 (or H2O, for that matter).
Keep trying. I’ll be watching.
Cheers.
“CO2 slows the rate of cooling.”
BULLSHIT !!!!
“Imagine a gas in a box, which has a constant internal heat source.
Now reduce the boxs rate of heat loss.
What happens to the temperature inside the box?”
That is probably the most MORONIC analogy to the Earth’s atmosphere that anyone could give..
Even a low-end Sci-fi writer should know better.
https://www.youtube.com/watch?v=zrWoG8IckyE
David, you seem confused. The earth’s atmosphere is not a box. Really, David, is this what you learned from your quark soup?
It warms Dave. But now do your experiment and change the gas in the box from 0.03% to 0.04% of weak CO2 mixed with about 10% water vapor in an inert Nitrogen blend. Seriously, what happens? Virtually nothing. The box analogy has very limited representation.
Don’t forget to add some convective cooling to your box, and also, the transfer of latent energy aloft from where it’s radiated to space.
Mike, you know exactly why my question is relevant, and you know what the answer to it is, and you’re running away from it.
Aaron S says:
“But now do your experiment and change the gas in the box from 0.03% to 0.04% of weak CO2 mixed with about 10% water vapor in an inert Nitrogen blend. Seriously, what happens? Virtually nothing.”
The answer is a matter of calculating, not opining.
What number does your calculation give?
David, your grossly over simplified box does not serve as an analogy for the earth’s atmosphere.
It wasn’t meant to. It’s meant to demonstrate a principle.
But Mike won’t answer a simple question. Because he knows the inconvenient answer.
@David Appell…”CO2 slows the rate of cooling”.
Considering that every atom on the earths surface, including land and oceans, is radiating part of an immense flux of electromagnetic energy in the IR band, how could CO2, making up only 0.04% of the atmosphere slow anything?
Physicist/meteorologist, Craig Bohren, who has written a book on atmospheric radiation, refers to your theory as a metaphor at best, and at worst, plain silly.
Explain with numbers how that would work. You can’t, and no alarmist scientist has ever calculated it or explained it. Nor has any scientist explained how GHGs, which form 1% of the atmosphere, being 96% water vapour, can act like a greenhouse.
Based on that 1%, a greenhouse with 100 panes of glass would require the removal of 99 panes to reach some sort of equivalence.
You are forgetting about the 99% of the atmosphere made up of nitrogen and oxygen. Do you think that 99% plays no part in heat transport via convection?
“Id appreciate it if skeptics explained carefully why this is wrong.”
Your cherry-picked data are not wrong, barry, it’s your interpretation of the data.
But, we continue to enjoy you climate-comedy.
Trend was derived from ordinary least squares regression. Please explain how the interpretation is incorrect.
Barry, you are running out of credibility.
Until someone comes up with a cogent explanation, I’m not worried about my credibility. So far, zip.
barry, until you have a mathematical proof for a mathematical equation, you are only a zealous believer devoid of scientific principles.
No warming in the satellite record except at the step-up.
“No warming in the satellite record except at the step-up.”
UAH LT trend, v6beta6:
Dec1978-Dec1997: +0.09 C/decade
Jan2000-present: +0.11 C/decade
overall trend: +0.12 C/decade
Love how you continue to use El Ninos warming to prove OUR point. 🙂
Strong el Nino events in 1982/83, 1997/98, and 2015/16.
Just to clarify, Andy. You are saying that el Ninos should not be used if they are on or near the end-points of a trend line. Is that correct?
barry,
Just take the longest period possible. Nobody can possibly accuse you of cherry picking then.
That would presumably be from the creation of the Earth to just now. My assumption is that he Earth’s surface was molten when it was created. Of course, I might be wrong.
Anyway, use whatever statistical methods you like, and prepare your trend. Of course, the trend might reverse, just as your cup of coffee might decide to get hotter, if you breathe some extra CO2 onto it.
Let me know the results, if you wish.
Cheers.
Mike Flynn, thanks for the reply.
Longest period possible.
Much of the discussion here is focused on the UAH6.5 data set.
Is that data set too short to say anything about climate? change?
barry,
Absolutely. Climate is the average of weather, according to the IPCC and WMO, over a nominal 30 years.
Warmists haven’t got much of a clue, really. The weather has always changed, and I’m assuming always will. Hence the climate will, also. Trying to stop the climate from changing is an exercise in futility.
Data relates to the past. It shows what has been, and not necessarily what is to come.
Are rising temperatures good or bad? Arrhenius thought an increase in temperature was to be greatly desired. Forecasts of doom from temperature increases seem to be a little premature.
CO2 is wonderful stuff. The planet seems to be greening. CO2 has no heating properties, of course.
It doesn’t matter whose data set you use, the Earth has still cooled. Good luck with the alarmism. Not many people seem to be paying a lot of attention.
Cheers.
Yes, I always thought the 30-yr average was a good benchmark. It’s long enough, at least with global surface temperature data, to get statistically distinct trends. EG, mid-century 30 year flattish period is statistically distinct from the 30+ year warming period that followed. Shorter periods and the uncertainties overlap.
But other ‘skeptics’ have different ideas. Let’s see what they say.
Have you pointed out to mpainter that his use of 18-year trends too short WRT your opinion?
Mike Flynn says:
“Warmists havent got much of a clue, really.”
Mike, I’m not really interested in your science, which is all wrong. I’m more fascinated by how you believe you’re right and every scientist on the planet for the last 100 years has been or is wrong.
Can you elaborate on that?
barry,
You mentioned an 18 year period. If climate is a 30 year average of weather, then 18 years is more than enough to change the 30 year average.
But it doesn’t really matter. Warmist love projecting trends, in the blind hope that a trend will continue. Nonsense. Financial fools do the same thing. I don’t often use analogies, but trend projection is about as silly as driving your car by looking in the rear view mirror. Because the road has been straight for the last few kilometres just means a corner is getting closer!
Physics is better, in my view. Nobody has yet demonstrated that wrapping CO2 around an object, or filling an enclosed space with CO2 will cause the temperature to rise. Blunderers like Bill Nye demonstrate you can heat CO2. Turn on a hair dryer, and you’ll discover you can heat oxygen and nitrogen too!
The somewhat dim doctor no, and the odd David Appell, have difficulty with facts, and try the usual Warmist deny, divert, and confuse, stratagem.
The foolish Appell, for example, claims that I disagree with every scientist over the last 100 years. He’s obviously getting his information from his well worn copy of the Warmist Book of Fantasy. I only disagree with scientists who are wrong.
As to anyone who claims miraculous insulating powers for CO2, I suggest looking up the R value of 100% CO2. You’ll quickly discover why no one employs CO2 as an insulator, not even in double glazed gas filled windows. Or just go into an arid tropical desert, and try to survive the night being insulated by CO2, or warmed by back radiation.
All the CO2 nonsense is a result in of James Hansen’s desire to ban coal for some bizarre reason.
It’s plant food, for goodness’ sake! The planet is greening!
Oh well, keep playing with your historical data, and pretending that it enables you to peer into the future. It’s a cheap hobby, at any rate.
Cheers.
You mentioned an 18 year period. If climate is a 30 year average of weather, then 18 years is more than enough to change the 30 year average.
Are you now saying that an 18 year period (only) is sufficient to determine a climate trend?
That’s nearly half the period you originally stated.
Could you clarify?
“Youll quickly discover why no one employs CO2 as an insulator….”
Venus, Earth and Mars do — all have surface temperatures higher than can be explained by the sunlight they receive.
“…not even in double glazed gas filled windows.”
Not enough CO2. That shouldn’t be hard to understand.
“Its plant food, for goodness sake! The planet is greening!”
Why is a greener planet a good thing?
Why is a greener planet desirable? By David A. This is a prime example of a rhetorical question.
Not enough CO2 to fill windows? Yet I can buy 20 lb bottles of it at the gas supply house for $40, just to play paintball with.
Lewis: Why is a greener planet desirable?
barry = a monkey with a straight edge.
He has the rational thought pattern of a chimpanzee..
AndyG55,
I think the chimp feels offended by your comment. I’ll apologise on your behalf. Sorry, chimp. Of course barry’s not nearly as rational as you. No offense to chimpanzees intended.
Cheers.
Typical skeptic’s response.
No knowledge of statistics, the radiative transfer equation or mathematics.
Cannot produce any evidence except wave their paws.
Ignorant, proud to be ignorant and now hysterical.
A bit like watching inmates at the asylum.
Poor Dr No-nothing
Failed junior high maths it seems.
Dr of social science??
And yes, you do seem to be extremely proud of your ignorance.
The insults aren’t hurtful. The best ones are entertaining. But repeated use is a clear indicator of the value one should place on the author’s thoughts in general.
Wrestling with pigs only gets you dirty. I prefer other activities.
Werner, thanks for your reply.
Two things wrong here. You start in a strong La Nina year and end in a neutral year. So of course you have a high slope. Secondly, anything under 15 years is not very meaningful so short periods really accentuate cherry picked starts or ends.
So, is your formula not to include years near the beginning and end of the trend with strong ENSO events?
How do you gauge that 15 years is not enough? By statistical analysis? Or some other way?
(So, is your formula not to include years near the beginning and end of the trend with strong ENSO events?
How do you gauge that 15 years is not enough? By statistical analysis? Or some other way?)
No answer is perfect, but if you end with a certain thing such as a strong ENSO, you should start with one. Also apply this to a neutral situation and La Nina.
As for the 15 years, I was in a discussion years ago with a warmist about Phil Jones comments on 8 years and 15 years. He said 8 years means nothing, but 15 years should be taken more seriously. And that makes sense since it is half of the 30 years that climate scientists like to use.
If I begin with a strong el Nino (1982/3) and end with one (1997/8), I get a warming trend of 0.22C/decade, UAH6.5.
17 years, observing your conditions.
Would you say that the warming trend for this period is valid?
I was in a discussion years ago with a warmist about Phil Jones comments on 8 years and 15 years. He said 8 years means nothing, but 15 years should be taken more seriously.
That’s your standard for periodicity? ‘A warmist told me.’
I was hoping for something a little more technical.
True, the warming was valid then. Then the pause set in and presently, the warming from December 1997 is much smaller and not even statistically significant. Dec 1997 to May 2016
Rate: 0.273C/Century;
CI from -1.101 to 1.648;
As for the statement by a warmist, if I am not mistaken, he was a university professor and the thought that I meant to convey was that even he would not treat a 15 year period too lightly. Furthermore, it is also a reasonable position to take.
Technically, trends of 15 years in the satellite global record are all (but one) statistically non-significant. The period is too short.
I have statistically robust reasons to believe global lower tropospheric temp trends require a minimum 26 (preferably 30) years. I lay that out below.
Firstly,
WMO indicates 30 years is a good minimum for climate change, to even out natural variation (ENSO, large eruptions etc)
The satellite data is more variable than surface, so longer time periods would be necessary for a signal to emerge from the noise
Here is how I approach this issue.
These are all the minimum length trend periods from 1979 in RSS lower trop global, where statistical significance is permanent after the end date:
1979 – 2003 (25 yrs)
1980 – 2003 (24 yrs)
1981 – 2003 (23 yrs)
1982 – 2002 (21 yrs)
1983 – 2003 (21 yrs)
1984 – 2002 (19 yrs)
1985 – 2003 (19 yrs)
1986 – 2004 (19 yrs)
1987 – 2009 (23 yrs)
1988 – 2007 (20 yrs)
1989 – 2004 (15 yrs)
1990 – 2015 (26 yrs)
1991 – 2015 (25 yrs)
1992 – 2015 (24 yrs)
1993 – no statistically significant trend from 1993
Notes:
The trend from 1987 to 2006 is statistically significant, but it loses statistical significance adding more years, and becomes permanently statistically significant from 2009.
1991 – 2004 is statistically significant, but significance fails from 2009, and doesn’t become statistically significant again until 2015.
3 other years (1988, 1990, 1992) have this ‘double dip’ of statistical significance. Significance is an artefact of the noise for the shorter time periods. These shorter time period trends are dubious at best.
You can also get significance for ridiculously short time periods – eg, the trend from 2011 to present is statistically significant: 0.87C/decade +/- 0.82. That, of course, is a nonsense trend.
This is how I formulate a robust minimum period for global lower tropospheric temp data. 26 years is the absolute minimum requirement, but 30 years is a more solid standard.
barry, a nice calculation. Did you include autocorrelation — that a month’s temperature is more likely to be similar to the month before it. Or months before it. Often it’s assumed that a data point is influenced by the point before it, called lag-1 autocorrelation, and it can be incorporated by using a different number Neff for the number of data points.
Its effect is to increase the time interval required for statistical significance.
There’s a very clear presentation here:
“Statistical issues Regarding Trends”
Author: Tom M.L. Wigley, NSF NCAR
http://nimbus.cos.uidaho.edu/abatz/PDF/sap1717draft37appA.pdf
and of the basic statistical techniques in general.
ARMA (1,1) regression applied that accounts fairly well for autocorrelation. AR1 could also be applied, which would give very slightly shorter time periods for significacne (a few months at most). The basic message would be the same.
I also generally use complete 12-months periods, as there is an annual cycle in satellite TLT data which produces artefacts if there is a part-twelvemonth period at the beginning or end of the trend.
Using annual averages is even better.
(This is how I formulate a robust minimum period for global lower tropospheric temp data. 26 years is the absolute minimum requirement, but 30 years is a more solid standard.)
So since both satellite data sets have no statistically significant warming for 23 years now, what should we do about it?
“So since both satellite data sets have no statistically significant warming for 23 years now, what should we do about it?”
Use intervals where statistical significance can be established!
The WMO recommends a minimum of 30 years.
Otherwise you’re just doing numerology — analyzing the noise, not the signal.
Treat any claim about trend or not trend under 26 years as statistically dubious and only use long trends (26+ years) for satellite data.
So since both satellite data sets have no statistically significant warming for 23 years now…
I trust you realize the difference between no statistically significant trend and no trend. Failing statistical significance doesn’t mean there is no longer-term signal, only that for the period selected, we can’t say for certain that there is a warming, flat or cooling trend.
It’s a very common mistake. The significance test doesn’t tell you if there is a trend or not, only that a particular hypothesis has not been falsified. Nothing is proved when the null hypothesis is not rejected. The common error is tnking that something IS proved. The null test has a strictly limited scope.
That doesn’t stop skeptics claiming ‘pauses.’ Eg, the RSS trend from 1998 to Dec 2015 is 0.001C/decade (+/-0.18). That’s not a pause. All the statistical analysis tells you is that within the 95% confidence interval, the trend is anywhere between -0.179C to +0.181C/decade.
You can’t say anything affirmative about any trend (or not) for this period. This is where many skeptics (and some others) get things very wrong.
Amending for clarity:
Failing the significance test doesnt tell you if there is a trend or not, only that a particular hypothesis has not been falsified. Nothing is proved when the null hypothesis is not rejected. The common error is thinking that something IS proved. The null test has a strictly limited scope.
I trust you realize the difference between no statistically significant trend and no trend.
I certainly do! I wrote a post about the difference between the two on December 2014 here:
http://wattsupwiththat.com/2014/12/02/on-the-difference-between-lord-moncktons-18-years-for-rss-and-dr-mckitricks-26-years-now-includes-october-data/
My point was whether or not billions should be spent combating global warming if the period is 23 years but not if it is 26 or 30 years. If a La Nina sets in, that 23 years could easily get to 26 or 30 years in a few years.
Mcitrick made the mistake of using part-years beginning and end making the trend susceptible to residuals from annual cycle, which is definitely present in the RSS trend (Dr Spencer may verify this re satellite data).
To do a regression that reduces this artefact, use complete 12 month periods.
Using RSS data and using complete years, I can get a 25-yr trend with no statistical significance.
But as you “certainly do!” understand the difference between no statistically significant trend and no trend, you must realize that you absolutely cannot conclude that there has been no trend. You should also know that the probability of that 25 year period being of no trend is very small, whereas the 18 year flattish trend had a 50/50 chance of being warming/cooling.
The lesson to be learned here is to use more data to uncover a signal. That’s it.
Ah, I see that the trend was annual periods – Nov 1988 to Oct 2014.
I get 0.129C/decade (+/-0.106)
That’s statistically significant.
Using start and end date of 1988.91 to 2014.91 will give you the correct time period, to run a trend with regression model that accounts strongly for autocorrelation (ARMA (1,1).
Try here:
http://www.ysbl.york.ac.uk/~cowtan/applets/trend/trend.html
I know that McKitrick and Nick Stokes had slightly different periods. So their methods must have been slightly different. However there is no way that I can express an opinion on who is better.
As for Cowtan, I believe he uses 2 sigma (95.4%) and not 95% that Nick Stokes does.
Cowtan uses ARMA(1,1) regression model, which accounts best for autocorrelation and is more conservative (higher CI level). Nick uses AR1 model, which also accounts for autocorrelation, and gives ever so slightly longer periods of stat sig. Dunno what McKitrick uses. If you have a link to his work, I’ll check it out. If he’s using wodfortrees, that’s an ordinary least squares regression, the least conservative. Doesn’t account for autocorrelation at all.
I HAVE NOT ONLY BEEN OPPOSED AS TO HOW THE SUN MAY EFFECT THE CLMATE BUT IF EVEN MY SOLAR CRITERIA WAS REACHABLE.
Just of note the solar criteria I have called for, for all of the categories is now starting to be realized which is part one of my solar /climate theory. I always thought this criteria was reachable. Still only time will tell as to how sustained this my be.
Part two will be does it have the climatic effect (if the solar criteria is sustained) that I have said it will.
If it does have the climatic effect I have called for then those who oppose will have to prove why this is not the case. The tables will be turned. I explained in detail why/how it would happen. Now people with David’s kind of thinking (if it happens) will have to prove me wrong.
Salvatore, you are becoming incomprehensible.
Calm down. Being wrong all the time is not a crime.
Salvatore, you make declarative statements that usually do not depend on criteria.
“Also, here is my prediction for climate going forward, this decade will be the decade of cooling, due to the sun, soi oscillation, volcanic activity, nao,ao oscillations ,pdo/amo ocean circulations all phasing toward a colder mode, prior to 2005 they were al mostly in a warrm mode and that is what accounts for the temp. rise last century.”
https://ourchangingclimate.wordpress.com/2010/10/20/andrew-dessler-debating-richard-lindzen/#comment-8875
“Temperatures in response to this will decline in the near future ,in contrast to the steady state of temperature we presently have,or have been having for the past 15 years or so.”
http://www.drroyspencer.com/2012/11/uah-v5-5-global-temp-update-for-october-2012-0-33-deg-c/#comment-64939
Also:
“I intend to make sure everyone will know who forecasted the climate correctly, and who forecasted it wrong.”
http://www.drroyspencer.com/2015/07/revised-uah-global-temperature-update-for-june-2015-0-33-deg-c/#comment-194674
It’s you whose forecasts are always wrong.
AGAIN DAVID YOU HAVE NOT PAID ANY ATTENTION TO WHAT I HAVE SAID.
My forecast is based on solar activity reaching certain criteria which will impact the climate. Until/when solar reaches the criteria will decide how accurate my climate prediction is.
Salvatore, those two quotes from you did not include caveats about solar activity. You made declarative statements without qualifying them.
Also, here is my prediction for climate going forward, this decade will be the decade of cooling, DUE TO THE SUN, soi oscillation, volcanic activity, nao,ao oscillations ,pdo/amo ocean
DAVID I said due to the sun. Seems clear to me.
Another declarative, unequivocal prediction.
I’ll add it to the list.
The seminar has covered the touch thoroughly and the conclusion is obvious: the temperature record of the satellite era is two flat trends connected by a step-up of about 0.3C, this step-up due to late 20th Century changes in cloudiness globally. CO2 is determined to be mostly redundant to water vapor and clouds in regard to the GHE. Thanks for participating.☺
Keep repeating your mantra if it makes you feel better.
Don’t forget to keep saying it when you get tucked into bed tonight.
“Yip-yap” opines the attack poodle.
Bears repeating:
mpainter says:
July 3, 2016 at 9:27 PM
A child can see the step-up.
Fact: no warming in the UAH prior to the 1998 El Nino, meaning the data gives a flat trend.
Fact: no warming in the UAH after 2002, meaning that the data gives a flat trend.
These two flat trends are joined by a step-up of about 0.3C, this step-up somewhat obscured by the ENSO cycle.
This can all be perceived with a brief examination of the UAH plot: the data points prior to the El Nino fall mostly below the baseline, the data post El Nino plot above. All quite conspicuously.
Your reaction is to pronounce these conspicuous facts as artefacts of data selection, a phrase that you coined on the spot to justify your rejection of these observations. You only fool yourself, and you are well fooled.
###
Any children in your family, Barry?
“Fact: no warming in the UAH prior to the 1998 El Nino, meaning the data gives a flat trend.”
False. Dec1978-Dec1997 trend = +0.09 C/decade
“Fact: no warming in the UAH after 2002, meaning that the data gives a flat trend.”
False. Jan2003-present trend = +0.11 C/decade
It would be HILARIOUS watching you try to catch a high ball.
You would be thinking it was heading upwards as it hit you between the eyes… yet again !!
No wonder you are stuck writing low-end sci-farce for a back-water journal.
Too many bumps on the head from trying to catch baseballs.
What numbers do you calculate for these trends, using linear regression?
Fact: no warming in the UAH prior to the 1998 El Nino, meaning the data gives a flat trend.
Fact warming of 0.08C/decade to 1997 in the satellite record. Statistically non-signifiant.
Fact 1983 was a super el Nino year near the beginning of the trend, so 1984-1997 should be the benchmark to avoid Ninos either end.
Fact: The mean trend is 0.13/decade in the dsatellite record. Statistically non-significant.
Fact: The statistical uncertainty for all trends in the satellite record overlap. There’s no way to tell them apart with any certainty.
Fact: You completely dismiss the uncertainty, rendering your opinion statistically unsound.
Fact: The mean trend is 0.13/decade in the satellite record. Statistically non-significant.
1984-1997 – avoiding strong el Nino contamination at both ends of the trend.
Your reaction is to pronounce these conspicuous facts as artefacts of data selection, a phrase that you coined on the spot…
I’ve been describing the ‘pauses’ as a statistical artefact since at least March on this very site. My view has been consistent, though the way I phrase it has varied.
Any children in your family, Barry?
Show the UAH data to them. They will help you see.
I’ll take on any substantive comments. That was not one.
Trend 1979-1997 in sat record is 0.08C/decade, with large uncertainty.
That’s not a pause.
Trend has 1982/3 strong el Nino near the beginning. You say strong el Ninos should not be included. To be consistent, shouldn’t we excise 1982/3 from the trend analysis?
Your .08C trend is an artefact of data selection. When the data is selected correctly, it yields a flat trend.
Your El Nino spike is also an artefact of data selection. It can be ignored.
How’s about it, Barry? Is turnabout fair play?
If Jan 1979 to Dec 1997 is the wrong data choice, tell me the right one. It’s the selection you’ve consistently referred to as a ‘pause’. Except it’s 0.08C/decade, UAH6.5 data.
If you think strong Ninos should be excluded, the trend 1984 – 1997 is 0.13C/decade.
I’m looking for a consistent standard from you. Do you have one?
“Your .08C trend is an artefact of data selection. When the data is selected correctly, it yields a flat trend.”
Huh??
The data are the data. You don’t get to “select” which you want and discard the rest.
Exactly.
Your idea Barry, which I turned around and pointed back at you: “artefact of data selection” you claimed, and then rejected the step-up. Funny that you don’t remember your comments yesterday.
David’s criticism is a paraphrase of mine. You can’t make arbitrary selections of data and then not test your choice. If you do, you find what looks like a pause isn’t verified.
If you want an actually verified pause, you can find one in the mid-20th century, roughly 3 decades from 1940 to 1970. Verified because the uncertainty in that trend (slightly negative) does not overlap with the uncertainty in the 30-yr trends either side. The mid-century flattish period is statistically distinct from the prior and proceeding long-term trends. That’s a solid test for a real change in temp trend.
The ‘pauses’ you think you see fail this test.
and then rejected the step-up
I’ve been rejecting the validity of your ‘step-ups’ ever since I saw you post about them here in March. I described them in that March post as statistical artefacts. That’s always been my view. What may look like a pause isn’t one until you do some verification testing. I have. They aren’t.
Yes, but they are not artefacts, not by any definition but yours. The step-up is an observation;it is data. I have explained elsewhere your knee-jerk AGE denial of observations counter to the AGW meme.
Well the trend since 2011 is 0.4C/decade, indicating warming has resumed at a blistering pace. As there is no formula for selecting which periods are valid choices (according to you – no such thing as statistical artefacts), how can that view be wrong?
The trend since March is a cooling at the rate of 200C per century. We’re all gonna ______ (you fill in the blank).
The satellite era shows two flat trends connected by a step-up.
B.S. button on the claim that eighteen years of temperature data cannot be analyzed. In fact. I analyze the entire 37 years of data.
Yeah, but Barry, the only warming of the satellite era is the step-up that connects two flat trends, and yes, a child can see it.
False.
Dec1978-Dec1997 trend = +0.09 C/decade
Jan1999-May2016 trend = +0.11 C/decade
choosing the very low point of the El Nino cycle yet again
All you have.
Zip nada , nothing.
1. No warming in the UAH satellite record from 1980 to 1998 El Nino… PROVEN
2. No warming between the end of that El Nino in 2001 and the start of the current El Nino at the beginning of 2015… PROVEN
3. No warming in the southern polar region for the whole 38 years of the satellite record.
4. No warming in the southern ex-tropicals for 20 years.
5. No warming in Australia for 20 years, cooling since 2002
6. No warming in Japan surface data for the last 20 years, No warming from 1950-1990.. zero trend
7. No warming in the USA since 2005 when a non-corrupted system was installed, until the beginning of the current El Nino.
8. UAH Global Land shows no warming from 1979 1997, the no warming from 20012015
9. Iceland essentially the same temperature as in the late 1930s as now, maybe slightly lower
10. Southern Sea temperatures not warming from 1982 2005, then cooling
11. Even UAH NoPol shows no warming this century until the large spike in January 2016.
That is DESPITE a large climb in CO2 levels over those periods.
There IS NO CO2 WARMING effect.
The ONLY warming has come from ElNino and ocean circulation effects.
David,
Try May 98 to May 16.
You know, start in the same month of the year. Of two el nino years. Better yet, for your purposes, use Jan 99 and Jan 2012.
Tell us what you get.
Telling us the temperature is going up by such an insignificant amount is rather scary David. Tell me another.
You didn’t respond to any of my points.
Trend 1979-1997 in sat record is 0.08C/decade, with large uncertainty.
Thats not a pause.
?
Trend has 1982/3 strong el Nino near the beginning. You say strong el Ninos should not be included. To be consistent, shouldnt we excise 1982/3 from the trend analysis?
?
See above.
You can’t answer the points. That’s ok, except that you may not know it.
No warming in the UAH data except at the step-up, no tropical hotspot, no warming in the lower stratosphere, no warming for 18 years (discounting the transient El Nino spike), with the pause poised to extend into the next decade and until the next super El Nino, some 15-20 years from now.
Don’t see much of a future for the AGW followers.Tsk Tsk.
no warming in the lower stratosphere
GHG warming predicts cooling in the lower stratosphere. One of the finger prints of AGW.
Lower strat has cooled since 1979.
No cooling since 1993. This cooling due to Pinatubo.
Trend lower strat since 1993 is -0.08C/decade. UAH6.5 data.
Show 0.184C cooling in the lower stratosphere since 1993, please and thank you. Produce your data points.
http://i1006.photobucket.com/albums/af185/barryschwarz/lower%20strat%201993_zpsltfexldu.png
Here’s the data:
http://vortex.nsstc.uah.edu/data/msu/v6.0beta/tls/tlsglhmam_6.0beta5.txt
“Show 0.184C cooling in the lower stratosphere since 1993.”
AGW predicts that the stratosphere will cool.
But the situation up there is complicated by our manmade changes in ozone.
Your plot is phoney.UAH data shows utterly different plot. Sorry, very unconvincing.
I’ve provided you the data. My plot is based on that lower strat data from 1993. You are welcome to use the data provided and do your own plot to check. Please let me know if you got a different result.
here, again, is the data.
http://vortex.nsstc.uah.edu/data/msu/v6.0beta/tls/tlsglhmam_6.0beta5.txt
(TLS in the e web address stands for “temperature lower stratosphere.” The UAH version is clearly shown at the end of the string)
I get -0.10 C/decade, for Jan1999-May2016 for UAH LS v6beta5.
Better to use complete years, David. There’s annual cycle in TLT data, and as it is a structural artefact, I expect it’s present in LS data.
El Chichon produced the step-down cooling of 1983. CO2 had nothing to do with those two stepdowns. No cooling since Pinatubo.
What effect did the super el Nino 1982/3 have on this?
You tell us
I’m trying to get your opinion. So far all I have from you is ‘step-changes: children are able to see it.’ That’s the extent of your ‘analysis.’ I don’t think you have anything more cogent than that.
Willing to be proved wrong.
El Chichon was in 1982. Takes 2-3 years for the dust to settle and cooling influence to abate, so I ran a trend from 1986.
Lower strat trend since 1986 is -0.25C/decade.
You think volcanic eruptions cause step changes? Physically unreal. The effect is temporary.
Show -.75 C cooling of the lower stratosphere since 1986 lest you be suspected of lying, please and thank you. Show your data.
http://i1006.photobucket.com/albums/af185/barryschwarz/lower%20strat%201986_zpsr1spap4p.png
Here’s the data:
http://vortex.nsstc.uah.edu/data/msu/v6.0beta/tls/tlsglhmam_6.0beta5.txt
Here, Barry, let me do it for you.
Barry: those stepdowns are “artefacts of data selection”.☺
Correction, no cooling in the lower stratosphere.
Only if you ignore the whole record and cherry-pick periods.
Excepting the step-down associated with the V5 events:El Chichon and Pinatubo.
You have the signal wrong. Volcanoes warm the lower stratosphere for the 2-3 years. They cool the troposphere. So step-ups is what you mean to say regarding the lower stratosphere.
Except they are spikes only. Eruptions produce aerosols that take 2-3 years to fall back to Earth. The effect is temporary. The notion of ‘steps’ WRT to eruptions is completely non-physical.
There was a step-down following each temperature peak, relative to pre-peak temperature levels, in the lower stratosphere. Your plots are worthless.
You’re in denial. Here is the UAH6.5 lower strat data to do your own trend analysis.
http://vortex.nsstc.uah.edu/data/msu/v6.0beta/tls/tlsglhmam_6.0beta5.txt
You’ve tied yourself in knots here.
You’re claiming that every spike in volcanoes results in a ‘step’ downwards in lower stratospheric temps, even though the eruption spike warms the lower stratosphere.
As the effect is opposite in the lower troposphere, are you claiming that major eruptions cause a temporary trough in temps followed by a step-up?
This would interfere with you 18-yr ‘pauses’. The timing is out. Your view is becoming even more incoherent.
No, it’s your perennial confusion. Stay away from the AGW crowd if you wish to improve.
Your contradictory views would confuse anyone.
But thanks for not clarifying. You probably confused yourself there.
Bears repeating:
No warming during the satellite era except for the step-up due to increased insolation. No tropical hotspot. No cooling of the lower stratosphere except for the step-downs of the V5 events.
The evidence is conclusive: CO2 makes no contribution to the GHE. This conclusion is supported by the fact that CO2 is redundant to water vapor and clouds in its IR absorbency.
“Bears repeating:
No warming during the satellite era except for the step-up due to increased insolation.”
False.
Dec1978-Dec1997 trend = +0.09 C/decade
Jan1999-May2016 trend = +0.11 C/decade
“The evidence is conclusive: CO2 makes no contribution to the GHE.”
Yet more false.
All you have to do to see the evidence is look at this chart of Earth’s outgoing longwave radiaton measured at the top of the atmosphere:
http://www.giss.nasa.gov/research/briefs/schmidt_05/curve_s.gif
David,
that chart doesn’t show any outgoing radiation indeed, it just shows the vertical one exiting at the nadir of one point of the TOA imaginary surface.
To be precise, I’m not arguing that there is no back-radiation by GHGs, but while that chart could show the effects of back-radiation on the outgoing flux under a qualitative point of view, it surely doesn’t do that under a quantitative one. It surely exaggerates the effects of GHGs.
And I add, that using simulators such as MODTRAN to play the game of doubling the CO2 and adjusting the ground temperature to get the very same outgoing radiation at the TOA for demonstrating the effect of CO2 is a very silly trick, because the “game” doesn’t take account of the CO2 spreaded radiation which exits the TOA with angles different from Nadir one. That exiting radiation, increases with doubling CO2, making the whole retained flux at TOA lesser than the one predicted by that chart.
Have a great day.
Massimo
Massimo, the label on the chart says “Spectral Flux at Top of Atmosphere.”
It’s the energy flux measured across the spectrum up to wavenumbers of 2000/cm.
Back radiation — which is just the downward energy flux radiated by the atmosphere — is not seem at the TOA.
“…because the game doesnt take account of the CO2 spreaded radiation which exits the TOA with angles different from Nadir one.”
The chart shows the flux integrated over all outgoing angles. By symmetry, the that angle won’t matter, and it suffices to measure flux along the line from the center of the Earth.
Hi David:
“The chart shows the flux integrated over all outgoing angles.”
You are just supposing what you wrote.
It’s not true. Since that chart is the result of a spectrometer measurements, if you know how it works (no matter whether it is a moving grating or a Michelson interferometer based one), you should know that the input slit need to get a coherent light to discriminate the wavelengths.
If you read the spectrometer specification of a satellite, then you learn that they have very little FOV (usually less than 1 degree). That so little FOV is also required to make the incoming light sufficiently coherent to make the spectrometer works right.
The only way to source the slit of the spectrometer with wide-angle-not-uniform-light is applying an integrating sphere in front of it.
AFIK no satellites have one installed till today.
The MODTRAN simulator which reports more or less that chart plot, is set to simulate a very narrow FOV, measuring the regular transmittance of the atmosphere, no ways the “flux integrated over all outgoing angles”.
And no, it doesn’t suffice “to measure flux along the line from the center of the Earth” because as I already told you, there is proof that the limb TOA exiting spectrum is exactly complementary to the Nadir one. It has been measured by a spectrometer installed on a balloon at an altitude of 34km that had a bending mirror in front of its slit, suited to target the Nadir the limb and the outer space.
We are far from knowing the effective outgoing LWIR radiation at any TOA point.
You wrote: “Back radiation which is just the downward energy flux radiated by the atmosphere is not seem at the TOA.”
I’m not sure what you argue with it, I’m not the one who suggested that that chart evidence that GHGs works, you did it indeed.
I just highlighted that if you want to use the TOA for demonstrating that some energy is back-radiated, you need to consider all the outgoing energies, not only the one at the Nadir narrow FOV.
Have a nice day.
Massimo
Thanks, Massimo. Interesting.
“The evidence is conclusive: CO2 makes no contribution to the GHE. This conclusion is supported by the fact that CO2 is redundant to water vapor and clouds in its IR absorbency.”
This is mostly true in regards to tropics and region close to it- or mostly true in regard to about 1/2 of the world in which most of warming of Earth occurs- tropics being 40% of world and up to say 35 degree latitude north and south being about 1/2 of the planet.
So on average the tropic and near it is where most of energy of sunlight reaches earth and other half of the world would have average of below O C from energy directly from the sun. Or ocean and atmosphere transfer heat poleward and increase the average temperature other half of the world.
If CO2 worked in tropics the heat transport poleward would increase. And/or it would mean that tropical average temperature would increase- which it isn’t.
[Of course things like El Nino do increase heat transport poleward]
Instead average temperature in the tropics remain fairly consistent on average even during wide swings in Earth’s average temperature [glacial periods vs Holocene Thermal Maximum].
I’ve always wondered what the alarmist flailing would look like once the end finally sets in for them. I think this thread has demonstrated it well…
Quite a coincidence. I see contrarians avoiding data analysis like the plague, resorting to ad hom and repeating the same talking points over and over. That looks like flailing to me.
EPIC FAIL = EPIC FLAIL
What end? Did the ‘pause’ return yet?
barry, there’s not a new pause, there’s an utterly catastrophe cooling trend taking place.
It started in Dec2015, and is 0.5 years long.
The UAH LT trend since then is -18.4 C/century.
Humanity might have to move underground, you think?
DAVID , you know full well that I had low average value solar criteria that is needed in order to have solar have a cooling effect upon the climate.
My website has had the criteria on for years.
Then why do you go around making declarative predictions without providing the criteria they are based on?
And I’ve never once seen a link to your Web site.
barry, theres not a new pause, theres an utterly catastrophe cooling trend taking place.
It started in Dec2015, and is 0.5 years long.
The UAH LT trend since then is -18.4 C/century.
A socialist world government is necessary to tax everyone to extinction so we can build massive engines that push the earth closer to the sun, comrade.
It would also be great if we all wore the same drab uniforms as a symbol of our collective effort for the Peoples’ Earth-Push Initiative, brother.
David, More or less the cry of the alarmists – telling us to be very afraid: we might get less snow and ice and more sun and a longer growing season.
I’ve been planting corn earlier these past few years I’m so afraid.
How long an interval between super El Ninos? The latest was eighteen years. Assuming the next is eighteen years hence, the AGW crowd will have no spike to hype for…eighteen years! With the flat trend extending into the next decade, the real question is what is wrong with the AGW hypothesis?
Answer: plenty. But it boils down to the fact that the role of CO2 as a ghg has been greatly exaggerated. AGW RIP
“With the flat trend extending into the next decade….”
There wasn’t a flat trend after the 1997-98 El Nino — the trend from Jan1999 to Dec2014 was +0.04 C/decade.
Though the period is too short to be of climatological significance.
DAVID HERE IS THE CRITERIA WHICH I HAVE POSTED 100’S OF TIMES
SOLAR FLUX SUB 90
SOLAR WIND SUB350KM/SEC
AP INDEX 5 OR LOWER
COSMIC RAY COUNT 6500 OR HIGHER
EUV LIGHT 100 UNITS OR LOWER
SOLAR IRRADIANCE OFF .015% OR MORE
COR SOLAR IRRADIANCE OFF .15%
1983 was a super el Nino. So was 1998. That gap was 15 years.
(Super el Nino is sustained period of 2C+ anomaly NINO3.4)
With only 3 samples, it’s not enough data to make a prediction about periodicity of super el Ninos. For all we know they could be random, but probably not sooner than every 5 years.
EG, I flip a coin 10 times. Heads comes up every 3 flips. Does that tell you about the frequency of heads (3:10)? Nope. Need more data.
(With a binary selection and an unweighted coin, we know the answer from math. Too many variables for ENSO to do a similar calc)
Eighteen years, Tsk, tsk
1983-1998 is 15 years. Can’t do math?
1998-2016 = how many years? 15, you say? Barry? Hello?
That’s 18 years. 1983-97 is 15 years.
There’s no reason to expect a regular beat of 18 years between strong el Ninos. Tisdale has a list of these on his blog, and some of them are many decades apart. There is no consistency of timing.
Mis-key: 1983-98
The flat trend extended to April of 1997, which then began the precipitous El Nino spike of 1998. And there was no warming after 2002. These two flat trends are joined by a step-up of about .3C, and there’s your warming for the satellite era.
Now, does that sound like CO2?☺
“The flat trend extended to April of 1997….”
False.
The trend from Dec1978-Apr1997 was +0.08 C/decade, a warming of +0.15 C.
False,David
Data does not start in December, 1978.
Trend does not rise 0.15C.
UAH6.5 data starts Dec 1978, as have all versions of UAH data set.
Cripes, I keep learning how little you know.
Here’s the complete data set.
http://vortex.nsstc.uah.edu/data/msu/v6.0beta/tlt/tltglhmam_6.0beta5.txt
You know, if only you accepted statistical uncertainty you could make a much better case here. It’s ironic.
But you only accept mean trend estimates, so that’s what we’ll use.
I’ll do the calc myself.
The trend rate Jan 1979 to April 1997 is 0.0743C/decade.
Making the temp rise over the 220 months 0.136C/decade
Rounding it out, decadal trend is 0.07C, and temp rise Jan 1979 to April 1997 is 0.14C
The 1 hundredth degree difference is probably due to regression type. I used OLS for this one.
What regression model did you use for the linear trend, David?
better explain that to Roy, who has stated that there was no rise prior to the 98 El Nino. Personally, i think the two of you are lying in concert. Its too obviously a flat trend. In fact, you agreed so in a comment in a previous thread, Barry. So what happened? Did you decide to lie your way out?
I said you could slice the time series up to see pauses (by eyeball). I’ve consistently said that the so-called pauses aren’t real (including in that post). I subjected them to trend analysis. The data is the data and the trend is the trend.
Here’s the data. Do your own trend analysis. Jan 1979 – April 1997, isn’t it?
http://vortex.nsstc.uah.edu/data/msu/v6.0beta/tlt/tltglhmam_6.0beta5.txt
If you can’t, man up and say so. I’ll show you how, if you have Excel on your computer.
Your methods prove that there never was a pause? Is that what you mean? All in the math, right?
Not my methods, standard ordinary least squares linear regression. Just plug in the UAH6.5 data, press the right buttons and the numbers come up. Subtract to get the difference between end points, divide by number of months, multiply by 120 (months) to get decadal trend. Not difficult.
You instructed me to run a trend somewhere in this thread. That’s what I’ve done. Didn’t touch the equations. They’re standard. Excel has this feature in an add-on data processing package. It’s a free bundle provided by the makers of Excel.
A couple of apps on the net run a different regression model (ARMA (1,1) ). When UAH Beta6 has been peer-reviewed, accepted and published, these apps will be updated and we can check trends + uncertainty just by plugging in dates.
You can use Nick Stokes’ app, but this one is easier.
http://www.ysbl.york.ac.uk/~cowtan/applets/trend/trend.html
Looking forward to UAH Beta6 being accepted after peer-review and added to these apps.
Do you know what “fabrication” means? If not, look it up.
Resorting to snark instead of running a trend analysis of the data yourself to check (because you can’t) is at the level of pond-scum.
A step-up is not a trend.
Personally, i think the two of you are lying in concert.
It’s ok if you are unable to verify it by doing it yourself. It would be dishonest at this point, however, not to admit it. Ask for help. I’ll explain how to do it using Excel. You can also do it using woodfortrees, just by pressing buttons. No calculation is even necessary that way.
Ah, yes, the PDO. If you are looking for the AGW signal, you must mask the natural variations. Only then can the true AGE trend be discerned. The first thing to do is to determine the proper baseline. I’ll get back.
Ah, yes, the PDO
Wow, what a non sequitur.
You pontificate about trends and you can’t even derive your own. That’s no shame, but wriggling away from the fact with specious deflections is.
Come on, ask me how to do it. I like helping people.
If you insist, yes it’s possible that the trend since 1997 is not flat, but negative- cooling…if you insist.
Trend since 1997 is 0.05C/decade (+/- 0.17)
So the possible trend is between -0.12C and +0.22C/decade (95% confidence interval)
Yes, the trend could be flat, or cooling, or warming. The uncertainty is larger than the trend so we can’t make a positive determination either way.
Calculated trend from 1997 shows transient effect of 2016 El Nino, which transient effect can be ignored. This spike hyping appeals to you, does it not? Trend remains flat, and this will obviously extend through the next decade.
Calculated from 1997 shows the transient effect of 1997/98 el Nino. You’re happy to let that el Nino stand to cool the trend but not 2016 el Nino to warm it. Very bad cherry-pick, inconsistent application of standard. It’s better to use a peak-to-peak, Nino, to Nino period than favour either end of the period with a strong el Mino but not the other.
But let’s go with your cherry-pick.
Makes no difference if I do a trend 1997 to Dec 2015 or Dec 2014, the result is the same. The uncertainty is larger than the trend, so could be cooling, flat or warming. We are unable to make a determination either way.
1997 to Dec 2015:
0.01C/decade (+/- 0.16)
Trend is anywhere between -0.15C to +0.17C/decade (95% confidence interval)
Could be cooling flat or warming. We can’t make a determination with this period.
1997 to Dec 2014:
-0.01C/decade (+/- 0.18)
Trend is anywhere between -0.19C and +0.17C/decade (95% confidence interval)
Could be cooling flat or warming. We can’t make a determination with this period.
(note that the uncertainty is greater with a shorter period)
Data used was UAH v6.5, obtained here.
http://vortex.nsstc.uah.edu/data/msu/v6.0beta/tlt/tltglhmam_6.0beta5.txt
Barry shows that the earth may have cooled these last eighteen years.
Based on the satellite data alone, yes, the data suggests that the globe may have cooled. Or no change in temps. Or warming.
Why is it so difficult to admit that the uncertainty also suggests the latter may have occurred? Is it because you are biased?
The lower tropospheric data is not the only data we have. The surface temperature data sets are not the only data we have.
Your opinion rests on discarding half the uncertainty in one or two data sets out of scores of them. Eg, sea level, sea ice, glaciers, ocean heat content etc etc.
Talk about selection bias!
Barry, you do wish to identify AGW, right? Well, that means you must mask the natural variability of climate. You know what I mean,I’m sure. Like changes in cloud albedo. Or reduction in aerosols. I’ll get back to you on this.☺
A number of studies have attempted to subtract ENSO, volcanic (aerosols) and solar variability from the data. If you can find papers that attempt to subtract cloud variability that would make interesting reading, but it’s hard to do owing to problems with cloud cover data, and with the opposition contribution of low and high level clouds. It’s a bit easier with solar, volcanic and ENSO, because those factors are more easily observed.
Those “studies” used massive fabrication of data. Fabrication is the delight of the global warmers. It characterizes their science. None of that for me.
Which ones do you mean? Name them and I’ll show you others.
Don’t know what fabrication is? Look it up.
Painter claims “fabrication” whenever he is backed into a corner and has no better reply.
It’s his desperate cry of last resort.
And even then it looks ridiculous.
David Appell does not know what fabrication is, either, and refuses to look it up, for fear of what he may find.
Yep, verified.
But no one should use truncated twelvemonth period in satellite data. there’s an annual cycle that produces artefacts in trend analysis. However, the trend is the same using complete years (Jan 1979-Dec1997).
If we excise 1997 from the period, to get rid of the start of el Nino warming, the trend Jan 1979 to Dec 1996 is still 0.08C/decade.
Barry,
As I perused this discussion, I saw your post on the trend Jan 1979 to Dec 1996 as 0.08C/decade. I did not read the context of the post, and undoubtedly you were trying to show mpainter that the trend was not a flat line. Nevertheless, I gotta say that .08C/decade or 0.8 per century does not stir my fears catastrophism. Before the record was adjusted in the 21st century, the trend from 1890 to 1940 was 1.7 degrees per century.
The uncertainty in the trend is +/- 0.16. mpainter totally dismisses it, but that’s the fact. I only state the mean estimate because he figures it is statistically meaningful. Of course, the time period is to short to say anything about a trend.
Trend is 0.08C/decade (+/- 0.16), 95% confidence interval. Trend could be between -0.8 to 0.24C/decade. Gave up trying to explain statistical uncertainty to mpainter. He just doesn’t want to hear it.
B.S. button, Barry. “Statistical uncertainty” was your obscuring phrase. And then you came through with it.
Statistical uncertainty, statistical significance, confidence intervals (all the same thing in statistical analysis).
It’s a standard of statistical analysis. “What’s the statistical validity of my trend result? Does it disprove the null hypothesis?” etc.
For evidence of the use of confidence intervals (statistical uncertainty) I direct you to that paragon of skeptical knowledge, What’s Up with that?
https://wattsupwiththat.com/2014/12/02/on-the-difference-between-lord-moncktons-18-years-for-rss-and-dr-mckitricks-26-years-now-includes-october-data/
“…statistically significant at the 95% level…”
Sound familiar? That’s the language I’ve used throughout the thread. Werner Brozek is here and may be able to explain it to you if you won’t take my word for it.
(Werner’s acronym ‘CI’ in that article stands for confidence interval. That’s the statistical uncertainty in a trend)
Here’s a trend + uncertainty quoted from the WUWT page:
…real warming rate is 0.0123944 C/year +/- 0.0123944 C/year…
“(+/- X)” is the confidence interval, or statistical uncertainty of the trend (at the 95% confidence level).
That’s the notation I’ve used many times in this thread. Eg,
0.08C/decade (+/-0.16)
That’s the trend analysis + uncertainty Jan 1979 – Dec 1996.
You need to get to grips with this if you want to discuss trends. Ask Werner.
Ah, so. Two flat trends connected by a step-up. The step-up is due to changes in cloud albedo. This is part of the natural variability that we need to remove in order to detect the CO2 signal. I’m working on this.
Ok, good on you for trying to remove natural variability. As I mentioned above, there are a number of studies that have estimated temp evolution with ENSO, solar and volcanic aerosols changes removed.
Earlier efforts to obliterate the pause neglected the step-up connecting two flat trends. With the step-up properly adjusted for, there evolves one flat trend.
I am working on the best way to factor the aerosol reduction of the late seventies.
What will the scaremongering do without a spike to hype? Invent one?☺
Fifteen, then eighteen, next…?
Tsk, Tsk, poor warmers
Painter, i think a good nick name for barry would be “emBARRass”… If it can be said that the ipcc is way out in left field, then barry would be way up in the bleechers (or even out in the parking lot). I like his studious attitude and do think that he’s a portrait of politeness (certainly as far as warmists go), but his conclusions are a little bit nutso. It’s as though he’s marching to the beat of his own drum. Is this where the agw debate is heading? Not recognizing an essentially flat trend when it’s staring them in the face? I predicted a while ago that AGWers were going to start claiming that the warming a hundred years ago is anthropogenic and lo and behold i’ve seen an awful lot of that lately (even on this very thread). I really think that there’s nothing that these agw “alinski” types won’t say to further their cause. Even if it means ignoring mainstream climate science! Remember, my friend, we’re not dealing with rational people here. The radical left will say and do ANYTHING to advance their cause…
We’re not dealing with a rational discussion about climate science, no, we’re dealing with alinski radical elements (!)
Exactly, fonz, these hard-core AGW types will never admit that
1. CO2 levels prior to 1950 were too low to have any effect, even though the IPCC itself acknowledges the obvious
2. That there has been no warming since the 1998 El Nino (the late spike being of transient effect)
Who has difficulty recognizing that CO2 rate increase was lower in the early 20th century, and therefore has a smaller impact on temp evolution?
No one I’ve heard of. It’s mentioned in the IPCC. Do you have a link to anything or anyone that says differently?
Many of the AGW crowd have that problem. Surely you have witnessed the multitude of occasions that some hard core AGW zealot has attributed the pre-1950 warming to AGW and CO2. Surely you have. Your pretense that this is not done reveals you.
The warming of 1890-1940 began when there were approximately 283 ppm CO2. It ended at approximately 305ppm CO2. The CO2 data from the Law Dome of Antarctica.
barry july 2, 2016 10:18pm
…Immediate response of global temperature to a doubling of CO2 is about 2C. (TCR- transient climate response)… …The temperature change from the beginning of the 20th century to present is consistent with the immediate climate response (TCR). Temperature increase is nearly 1C. We’re nearly half way to doubling CO2 from 1900…
(☺)
Surely you have witnessed the multitude of occasions that some hard core AGW zealot has attributed the pre-1950 warming to AGW and CO2.
I’ve read the IPCC saying there was a combination of CO2 warming and solar warming, possibly volcanic (aerosol) contribution to the warming. Natural variation and AGW combined causing warmth. I know of no one who maintains pre 50s warming was all CO2. Could you provide a link?
beginning of the 20th century to present
Is a 115 year record, not a 50-year record from 1900. Using the full period is a good idea, as it minimises the effects of natural oscillations/variation (solar, volcano, ENSO, PDO, ANO etc).
The warming over that period is consistent with transient climate sensitivity of 2C per doubling. That’s the calculated sensitivity in immediate response to doubling. ECs (equilibrium climate sensitivity is a calc of surface temps after the system after it has equilibrated with forcing. This includes thermal inertia of oceans, which is 1000 times greater than atmosphere, and which causes equilibrium to take at least 30 years after doubling (why a pot of water doesn’t boil immediately when it comes into contact with a 100C element). TCR is the metric if you want to compare with temps at the time of doubling.
barry july 2, 2016 10:18pm
Immediate response of global temperature to a doubling of CO2 is about 2C. (TCR- transient climate response) The temperature change from the beginning of the 20th century to present is consistent with the immediate climate response (TCR). Temperature increase is nearly 1C. Were nearly half way to doubling CO2 from 1900
###
Your link, sir.
☺
https://www.ipcc.ch/publications_and_data/ar4/wg1/en/ch9s9-6-2-3.html
There is no so-called climate sensitivity associated with the redundant IR absorbency of CO2. This is confirmed by the satellite era temperature record, which reflects only natural variability.
These natural causes have been identified:
1. The late seventies reduction in aerosols due to enforcement of pollution regulations, worldwide; this effect conjoined to the sudden shift in the PDO to a positive mode. These two effects gave an increase in the global temperature anomaly of about 0.2 C.
2. The late 20th Century changes in cloudiness globally, with a corresponding reduction in cloud albedo and increase in insolation (2.5 W/m sq – 5 W/m square. This gave the step-up of about 0.3 C.
And so the warming since the mid-seventies is fully accounted as natural variability with none attributable to increased CO2.
mpainter says:
“There is no so-called climate sensitivity associated with the redundant IR absorbency of CO2. This is confirmed by the satellite era temperature record, which reflects only natural variability.”
False. Anthropogenic CO2’s effect has been observed on the greenhouse effect:
Radiative forcing measured at Earths surface corroborate the increasing greenhouse effect, R. Philipona et al, Geo Res Letters, v31 L03202 (2004)
http://onlinelibrary.wiley.com/doi/10.1029/2003GL018765/abstract
“Observational determination of surface radiative forcing by CO2 from 2000 to 2010,” D. R. Feldman et al, Nature 519, 339343 (19 March 2015)
http://www.nature.com/nature/journal/v519/n7543/full/nature14240.html
Press release for the latter: “First Direct Observation of Carbon Dioxides Increasing Greenhouse Effect at the Earths Surface,” Berkeley Lab, 2/25/15
http://newscenter.lbl.gov/2015/02/25/co2-greenhouse-effect-increase/
Were not dealing with a rational discussion about climate science
Making things up is not exactly rational. I keep getting my ‘opinion’ handed to me and rarely recognize it as mine. What can be said about people who do that?
Direct quote from Barry: “artefact of data selection”. Barry shows the hard core predilection of
1.inventing rules on the spot, aka “climate ball”
2. dismissing observations that tend not to support the AGW meme.
This term, coined on the spot by Barry, is a contradiction in terms. Data is not an artefact unless it is a spurious result of faulty methods of collection or presentation methods. Interpretation of data might include selection and or exclusion of data. Selective presentation of data is at the heart of science. There is no such principle as the above coinage by Barry, who shows the usual lack of science founding to be observed in the AGW crowd.
Statistical artefacts are not my invention. I’ve already pointed to the phenomenon mentioned in peer-reviewed papers and provided the scientific definition.
You can see this sort of thing in commercial economics. A glossy brochure shows you the success rate of a superannuation plan over 10 years. Portfolio value increases by 15% over 10 years. What is not shown is that the portfolio declined over the previous 10 years, because the trend ended a year after a long-term economic downturn, and the 15% rate was an unusual rebound. Doesn’t show you that the 40-yr rate of return is only 10% per decade.
The promoted favourable result is an artefact of data selection to give a false impression. It’s not the whole (true) story. Shysters do it deliberately. Well-intended people can do it by accident if they don’t test their selection properly, such as against a longer-term trend.
Fuzzy fuzzy sez he.
Address the issue. Show in science where “artefact of data selection” is accepted as a meaningful term. It’s not. It is a term you coined on the spot.
In fact, UAH data is no artefact, as you claimed. Or show how UAH data is an artefact. Again, address the issue.
Again, the artefact is not the data but a result of the method applied, in your case, biased selection.
Artefact:
a spurious observation or result arising from preparatory or investigative procedures.
Show “artefact of data selection”, as a term in use, Mr.Wriggle.
Show artefact of data selection, as a term in use, Mr.Wriggle.
https://scholar.google.com.au/scholar?q=%22artefact+of+data+selection%22&btnG=&hl=en&as_sdt=0%2C5
https://scholar.google.com.au/scholar?q=%22artifact+of+data+selection%22&btnG=&hl=en&as_sdt=0%2C5
Satisfied?
Nope, because others can coin the same sort of spurious terminology that you have. You have admitted that the data is reliable. You have read the McLean paper which explains the late 20th Century warming, that is , the step-up.
Yet you deny that the warming and the step-up coincide.
We shall have to agree to disagree.
I am content that others can see what I see in the data. Your “artefact of data selection” is simply a form of name calling. You never supported your name calling except with arcane statistical jargon.
You have documented other cases that duplicate your abuse of the term “artefact”.
Was your purpose to cite a source for your misuse of that term? Or did you mean to show that others likewise abuse the term?None of the definitions of the word artefact or artifact refer to “data selection”.
Another term for what you’ve done is ‘data dredging’. Look it up.
Also look up ‘post-hoc theorizing.’
You see what looks like a pause, you do a trend analysis, hey presto! It is a pause.
What you should do is test the data further to see if the pause is actually present, or a consequence of a biased selection of data, or valid when compared to out-of-sample data. There are various techniques.
What you, mpainter, actually do, is not do further tests, but repeat the same test over and over. A form of circular reasoning. There is zero rigour to your analysis.
I’ve tested the data for statistical significance (there is none). I’ve tested for a statistically significant change in trend from previous trends (there is none). I’ve done out of sample testing to see if the periodicity is a generally valid choice (it isn’t). I’ve looked for general ‘rules’ that come out of the complete data series to apply to the data in question.
Look upthread. All these tests demonstrate that the ‘pauses’ are not verified. And that you are in denial.
I’ve also done a trend analysis for the earlier ‘pause’ (as have others) and found a mean warming trend (as have others). You summarily reject this, accuse me of lying, but do not do your own trend analysis of the period to show that your view is correct.
Do you have any idea how this looks?
Your spurious statistics fail, and you fabricate spurious terms which you refuse to back down on when caught.
The whole 37 year satellite era is two flat trends connected by a step-up. You use sophistry and specious statistics (lies, damned lies, and statistics) against these observations.
The present preoccupations of the AGW crowd is fabrication and sophistry to deny the pause, which is poised to extend for decades. AGW RIP.
And no, it is neither data dredging nor data mining, but the identification of a conspicuous feature: the step-up. And the step-up coincides with late 20th Century changes in cloudiness, globally.
You are not engaged in science, Barry, but name calling, sneering, sophistry, and a spurious statistics that fools none but yourself. And you are well fooled.
And the step-up connects two flat trends spanning 37 years of satellite data and refutes any notion of AGW, finally and completely.
Your spurious statistics fail, and you fabricate spurious terms which you refuse to back down on when caught.
All the terms I’ve mentioned are in use.
Selection bias:
https://www.google.com.au/webhp?sourceid=chrome-instant&ion=1&espv=2&ie=UTF-8#q=%22selection%20bias%22
Confirmation bias:
https://www.google.com.au/webhp?sourceid=chrome-instant&ion=1&espv=2&ie=UTF-8#q=%22confirmation%20bias%22
Artifact of data selection:
https://www.google.com.au/webhp?sourceid=chrome-instant&ion=1&espv=2&ie=UTF-8#q=%22artifact%20of%20data%20selection%22
Artefact of data selection (alternate spelling)
https://www.google.com.au/webhp?sourceid=chrome-instant&ion=1&espv=2&ie=UTF-8#q=%22artefact%20of%20data%20selection%22
Data dredging:
https://www.google.com.au/webhp?sourceid=chrome-instant&ion=1&espv=2&ie=UTF-8#q=%22data%20dredging%22
I understand if these are new concepts to you. Some are more commonly used than others.
Barry, the issue concerns your coining the nonsense term “artefact of data selection”.
You provide from the internet one example of the use of that term.
One.
I too searched and found one instance.
One.
That was the same reference you found.
One.
This reference concerned seismic data, earthquakes.
You have not denied coining your nonsense term on the spot. I consider your search result as confirmation that you indeed coined the term. On the spot.
And you double down on your name calling:
“confirmation bias”
“data dredging”
“selection bias”
Your name calling reflects your frustration over the obvious identity of the step-up and it’s conjunction with late 20th Century warming due to reduction in cloud albedo globally.
“The whole 37 year satellite era is two flat trends connected by a step-up.”
A bald-faced lie.
trend from 12/1978 to 12/1997 = +0.09 C/decade
trend from 1/1999 to present = +0.11 C/decade
Painter is a liar.
David Appell calls Barry Shwartz a liar because he claims that the trend is flat, “within the bounds of statistical uncertainty”.Tsk, Tsk.
barry, people here like mpainter are liars. They have no problems whatsoever lying about conclusions of the data, over and over again.
They won’t stop lying. They won’t acknowledge lying.
Lying is now the only recourse they have left.
David, let’s see if Barry agrees with you that he is a liar. Because Barry claims a flat trend, “within the bounds of statistical uncertainty.”
And yet, still no repeatable scientific experiment showing the wondrous heating abilities of CO2. Just like phlogiston, caloric, the ether, or spicy foods causing stomach ulcers.
Fooey! As Feynman said “And now you find a man saying that it is an irrelevant demand to expect a repeatable experiment. This is science?”
Cheers.
Correctomondo, Mike. And there is still NO mathematical proof of the bogus Arrhenius CO2 equation. The Warmists avoid that topic like the plague.
CO2 is NOT a thermodynamic heat source. The atmosphere is NOT a “blanket”. You can NOT bake a turkey with ice cubes.
Yet, the comedy continues.
It’s very well recognized by now that Arrhenius wasn’t exactly right.
You don’t seem aware of that.
No davie, you don’t seem aware that I recognized that years ago.
You have so much to learn.
Mike Flynn says:
“And yet, still no repeatable scientific experiment showing the wondrous heating abilities of CO2.”
You should know by now that noone can do “experiments” on climate.
But relevant observations are doable. And revealing:
Radiative forcing measured at Earths surface corroborate the increasing greenhouse effect, R. Philipona et al, Geo Res Letters, v31 L03202 (2004)
http://onlinelibrary.wiley.com/doi/10.1029/2003GL018765/abstract
“Observational determination of surface radiative forcing by CO2 from 2000 to 2010,” D. R. Feldman et al, Nature 519, 339343 (19 March 2015)
http://www.nature.com/nature/journal/v519/n7543/full/nature14240.html
Press release for the latter: “First Direct Observation of Carbon Dioxides Increasing Greenhouse Effect at the Earths Surface,” Berkeley Lab, 2/25/15
http://newscenter.lbl.gov/2015/02/25/co2-greenhouse-effect-increase/
So, it means the flat trend extending into the next decade with no spike-hype for at least fifteen years, maybe twenty.
No doubt the cognoscenti who advise elected leaders worldwide understand this. Their message? “No warming, no sweat, your road is free and clear.” Thus Denmark has abandoned it windmill scheme, Germany says COP21? What’s that? Spain long gone, GB gone sour on the EU and AGW both. AGW RIP
1. No warming in the UAH satellite record from 1980 to 1998 El Nino
2. No warming between the end of that El Nino in 2001 and the start of the current El Nino at the beginning of 2015.
3. No warming in the southern polar region for the whole 38 years of the satellite record.
4. No warming in the southern ex-tropicals for 20 years.
5. No warming in Australia for 20 years, cooling since 2002
6. No warming in Japan surface data for the last 20 years, No warming from 1950-1990.. zero trend
7. No warming in the USA since 2005 when a non-corrupted system was installed, until the beginning of the current El Nino.
8. UAH Global Land shows no warming from 1979 1997, the no warming from 20012015
9. Iceland essentially the same temperature as in the late 1930s as now, maybe slightly lower
10. Southern Sea temperatures not warming from 1982 2005, then cooling
11. Even UAH NoPol shows no warming this century until the large spike in January 2016.
That is DESPITE a large climb in CO2 levels over those periods.
There IS NO CO2 WARMING effect.
The ONLY places with a warming trend is in those places effected by El Ninos and ocean circulations
….. And of course UHI effects, either neglected or “adjusted” the wrong way by GISS et al.
But those “adjustments” are NOT really warming, they are just a fabricated +ve trend in the MEANINGLESS, farcically calculated, global surface temperature.
Do you know why the adjustments are necessary?
Do you know that adjustments reduce the long-term warming trend?
So you know that the temperature numbers from satellites are the most heavily adjusted of any temperature results?
The UAH data reveals a warming trend of +1.6 degrees per century from the start of the data up to the end of 1998, followed by a warming trend of +1.1 degree per century from 1999 to the present.
These are FACTS.
Why don’t you learn how to do statistics?
Otherwise leave science to the big boys.
Maybe you could consider what causes thermometers to show increased temperatures?
CO2? I think not.
Cheers.
What do you think causes the increased temperatures?
1. The late seventies reduction in aerosols due to enforcement of pollution regulations, worldwide; this effect conjoined to the sudden shift in the PDO to a positive mode. These two effects gave an increase in the global temperature anomaly of about 0.2 C.
2. The late 20th Century changes in cloudiness globally, with a corresponding reduction in cloud albedo and increase in insolation (2.5 W/m sq 5 W/m square. This gave the step-up of about 0.3 C.
And so the warming since the mid-seventies is fully accounted as natural variability with none attributable to increased CO2.
1. Why would the effect of reducing aerosols not be apparent from the 1970’s onwards as a gradual warming?
2.There is no reason why these processes should suddenly start nor suddenly stop. The PDO, for example, refers to the Pacific Decadal Oscillation – not to the Pacific Step Up.
3. You also think that Pacific Ocean temperatures and cloudiness have decreased but why would they do so? ..you are kicking the can down the road.
drno, 1.you posit a reduction in aerosols as a basis for warming post seventies. But you have no data to support such a supposition. Typical AGW bald assertion.
2. The PDO is expressed in the data as an abrupt step-up circa 1977-78. This was a warming event, not cooling as you supposed.
This warming is reflected in the global temperature anomaly post 1977
3. You are obtuse and lacking in reading comprehension. Nowhere did I claim that “Pacific Ocean temperatures” have decreased.
Concerning Reduction in global cloudiness, see John McLean, 2014, Late 20th Century Warming and Changes in Cloudiness.
Trend from 1979 for up for lower troposphere, down for PDO.
http://www.woodfortrees.org/plot/rss-land/from:1979/to:2015/plot/rss-land/from:1979/to:2015/trend/plot/jisao-pdo/from:1979/to:2015/normalise/offset:-0.7/plot/jisao-pdo/from:1979/to:2015/normalise/trend/offset:-0.7
Trends run to Dec 2014 to avoid large el Nino inflection at the end of the time series.
Mike Flynn says:
“Maybe you could consider what causes thermometers to show increased temperatures?…. CO2? I think not.”
Does CO2 absorb infrared radiation?
David Appell,
Indeed it does – just like a thermometer does.
What is your point?
Are you trying to tell me a container of CO2 is hotter than a container of O2, at the same temperature?
How hot is solid CO2? What about CO2 at 100C?
If you surround a thermometer showing 200 C with CO2 at 100 C, are you stupid enough to think the temperature will rise? Even you are not quite that stupid (or maybe you are – I can’t read your mind).
So the tricky Warmist gotcha you posed, is shown to be completely irrelevant, pointless, and yet another Warmist example of delusional behaviour and denial.
What were you really trying say? Don’t be a girly-man, just come right out and say it! If people laugh, they laugh.
That’s life!
Cheers.
Mike Flynn says:
“Are you trying to tell me a container of CO2 is hotter than a container of O2, at the same temperature?”
Are you ever going to answer the question I posed to you a few days ago?
Or are you going to keep running away from it?
I just answered your stupid question.
What else don’t you know, or are you trying for a “gotcha”.
This is what you get when you try to compare Appells with facts.
How about you respond to my last answer? Of course you can’t, because the facts would result in distortion of the fantasy field with which you surround yoursel!
Is your journalistic ineptitude on a par with your scientific ineptitude? Answer the question! (Laughs).
Cheers.
Mike, are you ever going to answer the question I posed to you a few days ago?
Or are you going to keep running away from it?
So far you have been running.
Mike Flynn:
Does CO2 absorb infrared radiation?
Asked and answered, you foolish Warmist. Can you not read, or do you not like the answer?
Cheers.
Mike, are you ever going to answer the question I posed to you a few days ago?
Or are you going to keep running away from it?
So far you have run.
That was just what I expected. It’s what deniers always do when presented with hard questions.
Keep running, Mike.
Mike Flynn says:
“Maybe you could consider what causes thermometers to show increased temperatures? CO2? I think not.”
That is what thermometers are reading, dumb shit.
David Appell,
If you take a rectal temperature, are you taking the temperature of the CO2 in your lungs?
In your case, maybe you are. I suspect you may be talking through your backside.
Maybe you could wonder why a sample of O2 or N2, Ar or any gas at all at 20C, shows that temperature whether mixed with CO2 or not.
Foolish Warmist!
Cheers.
Mike, why are you so proud of being so ignorant?
Concerning the warming step-up of the late seventies, it can attributed to the abrupt switch of the PDO (Pacific decadal oscillation) from its cool phase to its warm phase. This step-up coincides with, and was augmented by reduction in aerosols, globally. This aerosol reduction is attributed to pollution control measures enacted and enforced worldwide during earlier years of the seventies. This step-up can be put at about .25-.3 C, and ended in 1980. The satellite temperature record begins in December, 1978 and records about .25 C of this step-up.
So we see the satellite era begins with a step-up. This terminates in 1980. Thus we mask off the effects of the PDO and reduced aerosols by taking the average global temperature anomaly of 1980, or -.5 C, as our working baseline. With this we can scan the ensuing data for warming attributable to CO2. But we find no warming;the trend is flat until the 98 El Nino.
“But we find no warming;the trend is flat until the 98 El Nino.”
False.
Trend in UAH LT v6beta6 from 12/1978 to 12/1997 = +0.03 C/decade.
Trend over the entire UAH LT dataset = +0.12 C/decade.
Poor David and his reading incomprehension problems.
David, I get 0.08C/decade linear trend UAH6.5. Is yours a typo?
1. Same result for Jan 1979 – Dec 1997
2. Same result for Jan 1979 – Apr 1997
2. Same result for May 1979 – Apr 1997
1. Period chosen to avoid annual cycle present in TLT data UAH (and RSS)
2. Period chosen based on mpainter’s opinion that April 1997 is prior to 97/98 Nino warming
3. Period chosen to avoid annual cycle present in TLT data UAH: complete 12-month blocks applied
Yes, barry, I was wrong.
Thanks for catching that.
I find,for the linear trend of UAH LT v6beta6 from 12/1978 to 12/1997, a linear trend of +0.09 C/decade.
Thanks for the help.
“Concerning the warming step-up of the late seventies, it can attributed to the abrupt switch of the PDO (Pacific decadal oscillation) from its cool phase to its warm phase.”
In other words, a natural influence.
Then the PDO turned negative around 2001. That was natural cooling factor.
A year or two ago the PDO turned positive again.
And look at how much temperature has increased since 1980, over a full PDO cycle.
Why? Manmade, that’s why.
M PAINTER IS CORRECT.
All of the global warming can be shown to be linked to natural climate oscillations and factors that control the climate.
Those ranging from high solar activity until 2005 and the associated effects which would result in warming, lack of major volcanic activity , a mostly positive AO,NAO Index, PDO /AMO warm mode for most part featuring more EL NINO versus LA NINA activity.
This has started to change post 2005 and now with the maximum of Solar Cycle 24 ending, the recent strong EL NINO gone, cooling not warming going forward will be the rule.
I also suspect Sea Surface Temperatures on a global basis(in response to very weak sustained solar activity moving forward)will be cooling, Global Cloud Coverage will be on the increase along with greater Sea Ice/Snow Coverage, and a more meridional atmospheric circulation.
Increased Volcanic Activity (major)is more likely then not since we have not had any volcanic activity with an explosive index of 5 or higher since 1992 will be another factor in contributing to cooling going forward.
Just a 1% increase in albedo would wipe out all of the global warming that has happened post 1840.
I think if solar remains very low from now – 2020 that at the very least all of the global warming that had taken place post 1840 will be gone.
The wrong predictions of Salvatore del Prete:
“here is my prediction for climate going forward, this decade will be the decade of cooling.”
– Salvatore del Prete, 11/23/2010
http://ourchangingclimate.wordpress.com/2010/10/20/andrew-dessler-debating-richard-lindzen/#comment-8875
Temperatures in response to this will decline in the near future, in contrast to the steady state of temperature we presently have,or have been having for the past 15 years or so.
– Salvatore Del Prete, 11/6/2012
http://www.drroyspencer.com/2012/11/uah-v5-5-global-temp-update-for-october-2012-0-33-deg-c/#comment-64939
“I think the start of the temperature decline will commence within six months of the end of the solar cycle maximum and should last for at least 30+ years.”
– Salvatore Del Prete, 7/13/2013
http://www.drroyspencer.com/2013/07/uah-v5-6-global-temperature-update-for-june-2013-0-30-deg-c/#comment-84963
“I think this blip ends before NOV. is through and if solar conditions continue to be sub par cooling in a more pronounced way will start in year 2014.”
– Salvatore del Prete, 11/15/2013
http://www.landscheidt.info/?q=node/4#comment-1047
“I can not wait to see what they will say once the temperature trend is down, and I wonder how accountable they will be for their wrong climate forecast.”
– Salvatore Del Prete, 7/8/15
http://www.drroyspencer.com/2015/07/revised-uah-global-temperature-update-for-june-2015-0-33-deg-c/#comment-194674
Dave why don’t you go on record today and make a climate prediction for the next 5 years.
Stop talking and predict.
I say if solar remains near or at my criteria which is very likely going forward that global temperatures will be back to at least 1970’s readings if not lower by year 2020.
What do you say Dave?
Go on record, then we will see who is correct and who is wrong.
del Prete:
are you now admitting your past predictions were wrong?
Dave again the solar criteria I called for when I made my climate predictions 5 years ago did not materialize therefore it is impossible to know if they were right or wrong.
Presently and this is also addressed to Barry ,it looks like solar conditions going forward will meet the solar criteria I have called for which should result in global cooling if sustained which is also likely.
If the above happens and global temperatures do not respond by cooling off I will admit to being wrong.
Thanks Salvatore. We can record your prediction thus:
I say if solar remains near or at my criteria which is very likely going forward that global temperatures will be back to at least 1970s readings if not lower by year 2020.
Noting that satellite data begins Dec 1978, which temperature record will you accept as the measuring stick for your prediction?
No answer, huh Barry?
I’m not surprised. Salvatore will do anything to wiggle out of his past predictions.
I think if solar remains very low from now 2020 that at the very least all of the global warming that had taken place post 1840 will be gone.
A clear prediction. I don’t think it’s physically possible, even if various influences combine to cool the surface from now – 2020.
If the warmth remains 1840 – 2020, will that cause you to revise your hypothesis, or will you extend the prediction?
Yes Barry if low solar conditions those that meet the criteria I called for prevail and global temperatures go up or stay the same I will be wrong.
What I like about my approach is it states x solar criteria will influence the climate in an x way which will give an x climate result.
There is no spin and it is black and white. It is either going to be correct or not correct.
Fair enough. Which temperature record is acceptable to you to as a measuring stick for your prediction? (Satellite records begin
Dec 1978)
SATELLITE RECORDS WILL BE THE DATA I WILL USE.
Which satellite record?
And why do you consider them more reliable than surface data? Even Carl Mears doesn’t think that, and he runs RSS:
Carl Mears, Senior Research Scientist, Remote Sensing Systems (RSS)
“A similar, but stronger case can be made using surface temperature datasets, which I consider to be more reliable than satellite datasets.”
http://www.remss.com/blog/recent-slowing-rise-global-temperatures
Barry thanks for being fair with me unlike some others.
Time will tell.
Roy, why does your site suddenly stop accepting comments?
It accepts some for awhile. Then it just stops accepting them.
Why?
Davie, think wavelength.
It’s a little glitchy. Nothing nefarious.
Dr Spencer, if you’re reading this far down:
Does the latest revision UAH Beta6 remove the annual cycle present in TLT data?
Any update on review of your submitted paper? Have you had replies from reviewers, for example?
What annual cycle?
Dr Spencer discusses it here, about a quarter way down the updates page:
http://vortex.nsstc.uah.edu/data/msu/t2lt/readme.06Oct2014
“It was brought to my attention by Anthony Watts that there has been some discussion about the noticeable annual cycle in the LT and MT trends when done by months. In other words, the trend for Februaries is on the order of 0.12 C/decade warmer than the trend for Mays.
Other data sets don’t have such a large range in trends when calculated by months, RSS for example has a range of 0.05 C/decade. (Note, this issue doesn’t affect the overall trend.)
The feature arises when the AMSU data are adjusted and merged into the MSU data stream beginning with NOAA-15 in Aug 1998, then carries forward with NOAA-16 and AQUA (both of which are AMSUs too). The process involves at one point the removal of a mean annual cycle in the anomaly differences from one satellite to another.
It turns out that all satellites have a residual annual cycle due to each instrument’s peculiarities. In the end, all annual cycles are matched to NOAA-6 and NOAA-7.
Detecting the impact of this peculiarity is difficult. For example, it is not seen when gridded data are directly compared against radiosondes (see Christy and Norris 2006 and 2009.) However, an annual cycle in the difference time series is clear in RSS data when compared with balloons (see Fig. 2 of both papers.)
I’ve tested a number of alternate processing methods (basically versions of not removing the annual cycle in the difference time series from the first AMSU onward) and the range from the highest to lowest is reduced to just under 0.09 C/decade. This in effect establishes a new annual cycle for the AMSUs based on the first AMSU.
I think the magnitude of the annual cycle in the monthly trends is a legitimate problem to address. The range in the current v5.2 LT looks too large (about 0.12 C/decade). However, one should expect differences from month to month, especially when ENSOs and a volcano have different impacts by months so the range shouldn’t be zero. I’ll keep looking into this and if a reasonable result is produced, I’ll rename the dataset v5.3.
The important point in all of this is that the overall global trend of the entire time series ranges insignificantly from +0.123 to +0.125 C/decade even under the different merging methods used to date. This is because the removal of the annual cycle of differences from satellite to satellite does not add any bias to the time series, so the overall trend doesn’t change.”
While the effect is unimportant for the full period, if shorter periods are trended without using complete 12-month period the residual annual cycle may have a stronger influence on the resulting trend.
I don’t know if this has been addressed in previous revisions (from V5.3), and I wondered if this artefact was reduced in version Beta6.
It had been somewhat addressed in V5.3, 2010, but the residual annual cycle was still present in that data set.
Graphic depiction
https://deepclimate.files.wordpress.com/2009/03/global-month-trends1.gif?w=500&h=341
Roy:”The important point in all of this is that the overall global trend of the entire time series ranges insignificantly from +0.123 to +0.125 C/decade even under the different merging methods used to date. This is because the removal of the annual cycle of differences from satellite to satellite does not add any bias to the time series, so the overall trend doesnt change.”
###
I shall be glad to explain this for you, Barry.
I already have, thanks.
Something not many people on the climate blogs know is that the average surface temp is about 15C, whereas for the average lower troposphere temp as measured by satellites (UAH, RSS) is about -9C.
An example of the difference between the two metrics.
Thus, with the satellite data adjusted for step-change due to natural variations, we get -.5 C as our working start point for calculating the satellite era trend to 1997. Thus we see no warming prior to the El Nino of 1998, that is, the step-up.
You’ve masked PDO for the whole period, consistent with masking it for the beginning?
Starting with -0.5C would mean a higher trend than 0.08C to 1997. Current anomalies are between -0.011 and -0.360 for the first two years of the UAH6.5 data set.
Correct, should be .05 C. Thank you for pointing out that mistake.
Rather,-.05 C.
I can work out the trend for you if the first 12 months of the UAH6.5 data set are all set at -0.5C. Or how would you like me to go about it?
Plotting anomalies and trend for RSS (proxy for UAH6.5) and PDO, there is very poor correlation for that period. In fact, they are most often anti-correlated as far as I can see.
http://www.woodfortrees.org/plot/rss/from:1979/to:1998/plot/rss/from:1979/to:1998/trend/plot/jisao-pdo/from:1979/to:1998/normalise/offset:-0.6/plot/jisao-pdo/from:1979/to:1998/normalise/trend/offset:-0.6
No warming from 1980 to the step-up of the late 20th Century warming. The step-up prior to 1980 is also due to natural variability: reduced aerosols and the shift in the PDO to its warm phase.
Hence, no warming attributable to CO2, but two flat trends connected by a step-up. Thus the satellite era.
Rinse, repeat.
The UAH6.5 TLT trend from Jan 1979 to Dec 1997 is 0.08C/decade
The UAH 6.5 TLTtrend from Jan 1979 to Apr 1997 is 0.08C/decade
Pause?
Rinse, repeat. If you have trouble understanding my comment, you must be specific. What, exactly, eludes you?
You seem to want to subtract PDO (and aerosols?) in some way so as to change the values for the beginning of the satellite record. Yet you don’t want to do that consistently for the whole period.
Be specific about which years/months this adjustment applies to.
Explain why the adjustment for PDO should not be applied for the whole temperature series. When removing an effect, isn’t it cherry-picking to subtract it from one part of the record but not the rest?
Atmospheric aerosol loadings are uncertain indices. They are difficult to monitor. Similarly to PDO, shouldn’t you apply the aerosol ‘masking’ for the whole temperature record to avoid cherry-picking to obtain desired results?
Here is a link to aerosol indices from 1995 to present.
http://www.temis.nl/airpollution/absaai/
I don’t know of any index that starts earlier, unfortunately.
I have described my method above, July 8, 1:48 pm and all your questions are answered there.
The -.05 C is the average for 1980. I have masked the step-up by elmiminating it from the time series, and trends start at December, 1978 through 1980 single value of -.05 C.
This method is simple, but it yields a basis for scanning the data for a CO2 signal.
The find is no warming until the step-up coinciding with the ENSO cycle 1997-2000.
Could you pls provide links to your posts? Saves scrolling through many to find it.
Concerning the warming step-up of the late seventies, it can attributed to the abrupt switch of the PDO (Pacific decadal oscillation) from its cool phase to its warm phase. This step-up coincides with, and was augmented by reduction in aerosols, globally. This aerosol reduction is attributed to pollution control measures enacted and enforced worldwide during earlier years of the seventies. This step-up can be put at about .25-.3 C, and ended in 1980. The satellite temperature record begins in December, 1978 and records about .25 C of this step-up.
Data links?
Aerosol control maesures were not adotped “worldwide.” This would refer primarily to the US. China and India had no such legislation and the 70s marked acceleration in industrial output for those countries. The UK Clean Air Act was adopted in 1956.
Changing all values to -0.05C for all months Dec 1978 to Dec 1997 yields a trend of 0.06C/decade.
Pause?
PDO trend for 1979 to 1997 is -0.04C/decade. This component had a cooling trend for the period. Subtracting (or ‘masking’) that effect would warm the temperature record slightly.
Typo:
Changing all values to -0.05C for all months Dec 1978 to Dec 1980 yields a trend of 0.06C/decade.
Could you also describe in some detail how you arrived at the exact value of -0.05C?
I have described my method above, July 8, 1:48 pm and all your questions are answered there.
The -.05 C is the average for 1980. I have masked the step-up by elmiminating it from the time series, and trends start at December, 1978 through 1980 single value of -.05 C.
This method is simple, but it yields a basis for scanning the data for a CO2 signal.
The find is no warming until the step-up coinciding with the ENSO cycle 1997-2000.
Could you pls provide links to your posts? Saves scrolling through many to find it.
Concerning the warming step-up of the late seventies, it can attributed to the abrupt switch of the PDO (Pacific decadal oscillation) from its cool phase to its warm phase. This step-up coincides with, and was augmented by reduction in aerosols, globally. This aerosol reduction is attributed to pollution control measures enacted and enforced worldwide during earlier years of the seventies. This step-up can be put at about .25-.3 C, and ended in 1980. The satellite temperature record begins in December, 1978 and records about .25 C of this step-up.
Data links?
Aerosol control maesures were not adotped worldwide. This would refer primarily to the US. China and India had no such legislation and the 70s marked acceleration in industrial output for those countries. The UK Clean Air Act was adopted in 1956.
Changing the values to -0.05C for all months Dec 1978 to Dec 1980 yields a trend of 0.06C/decade for the alleged ‘pause’ period prior to the ’98 el Nino (Dec 1978 – Dec 1997).
Pause?
PDO trend for 1979 to 1997 is -0.04C/decade. This component had a cooling trend for the period. Subtracting (or masking) that effect would warm the temperature record slightly.
2nd para is your post.
Note: The period is still statistically insignificant. The confidence interval is 0.156 – much larger than the mean trend.
Thus, if all months from Dec 1978 to Dec 1980 are ‘adjusted’ to -0.05C, the trend is anywhere between -0.1C to +0.2C/decade (95% confidence interval).
Statistically indistinguishable from a flat trend. Two flat trends connected by a step-up.
Also statistically indistinguishable from a warming trend of 0.2C/decade and a cooling trend of -0.1C/decade.
Is the cause of all these purported step-ups the same? Or are there different causes for each?
So how do you get the figure of -0.05C for each month Dec 1978 to Dec 1980? The post of your ‘methods’ provides no calculation for it.
We have an average for the satellite data prior to ENSO cycle of approximately -.1 C and a post ENSO average of approximately .14 C which difference yields approximately .24 C as the value of the late 20th Century warming (i.e., stepup) due to decreased cloud albedo, globally.
How do you calculate to arrive at -0.05C per month for Dec 1978 to Dec 1980?
Can you clarify whether you think ENSO phenomena are partly responsible for temp differences, or are merely coincident time markers for the actual causes (clouds/PDO/albedo)?
More clearly: Can you clarify whether you think ENSO phenomena are partly responsible for temp differences between ‘pause’ periods, or are merely coincident time markers for the actual causes (clouds/PDO/albedo)?
Given above: average 1980, approximately.
How is that record La Nina progressing?
Also,
here are the annual average PDO values.
I asked a child but they could not see a step up at 1980.
1975 -1.1
1976 0.0
1977 0.3
1978 0.0
1979 0.2
1980 0.3
1981 -0.1
1982 0.8
1983 0.9
1984 -0.2
1985 -0.4
And the past is connected to the future in what fashion?
If nobody had any PDO values, would the future’s weather (and hence climate) be any different.
Trend followers are deluded fools. Warmists often follow trends.
Cheers.
So do the other mob. Must feel good to above all that.
Still no answer. Just claims of “They do it too!”
I’m not sure what feelings have to do with facts, but I feel content with facts, f that helps.
Whether it’s war, politics, finance, economics or weather, the experts seem to be quite dreadful at peering into the future.
Calculating trends, reading chicken entrails, casting runes, or just using your own judgement, might well be as accurate as each other.
What do you think?
Cheers.
“Calculating trends, reading chicken entrails, casting runes, or just using your own judgement, might well be as accurate as each other.”
So, I gather that :
(a) you agree that there may be a warming trend BUT
(b) you don’t believe it means anything for the future
(c) you are skeptical of predictions in general
(d) you only make decisions on facts
Is that a fair summary?
If so then
(a) you must equally disagree with anybody who claims there is a cooling trend or no trend, or a step up, or a step down or .any other contortion of the data
(b) you equally do not believe that solar variability, or PDOs or ENSOs provides any guide to the future
(c) you pay no attention to weather forecasts, stock market forecasts or economic forecasts
(d) you pay no attention to probabilities.
Would that be a fair inference?
Im not sure what feelings have to do with facts
Me neither. But seeing everyone examines the trends, your singling out ‘warmists’ (not exactly a dictionary word, is it?) doesn’t exactly smack of objectivity.
Political jargon in a discussion about ‘facts’ is always a giveaway.
First, I agree that they may be warming trends somewhere. Or there may be cooling trends somewhere. It will depend on temperature readings over time at a specified location. Alternatively, for example, if a complete Antarctic continent goes from ice free to icebound, it is obvious it cooled. Is it a trend? Does it point to the future?
b) You are correct. Unless you know what causes PDOs, ENSOs, solar variability etc., the mere fact that you may assume they represent any guide to the future is just an example of wishful thinking.
c) I’m not sure why you assume I pay no attention to weather forecasts. In general, howeve you are correct. Observations are in a different class, of course. Anybody who believes stock market forecasts is a fool, well intentioned perhaps, but a fool nevertheless. Economic forecasts are even worse, if that is possible. Surely no rational person (obviously not including politicians) would give these dimwit forecasters the slightest credence!
d) I pay attention to useful probabilities on occasion. Often I ignore them. For example, when travelling on an aircraft, I assume the probability of arriving safely is 1, even though statistically this is not true. On the other hand, the chance of a fair coin coming down heads is close to 0.5. I have met fools who will give me better than even money on another head after a run of heads. The coin doesn’t care, and the probability that next toss will result in a head is still close to 0.5. The coin has no memory. So knowledge of probabilities may give you no advantage, nor knowledge of the future.
In relation to weather, and hence climate, even the IPCC says that future climate states can not be predicted. I agree. I make assumptions about the future, using my own judgement, and act accordingly. So far, so good. I’ve never lost money on the stock market, and my financial decisions have meant that I haven’t suffered financial loss in other areas. Other people may follow the pronouncements of experts if they wish. I wish them well.
Cheers.
A consensus about the utility of trends doesn’t turn a feeling into a fact, as far as I am aware.
The Oxford dictionary provides th following definition of Warmist –
“A person who accepts the proposition that climate change caused by human activity is occurring (used by those who do not accept this proposition):
“the warmists insist the planet is warming, and they want us to attempt to cool it down””
It is “exactly a dictionary word”. Foolish Warmists often make condescending assertions without basis in fact. I don’t know why.
I believe foolish Warmists who believe that they can reliably see into the future are gullible or delusional. Objective? Evidence based subjective assessment, of course. What difference does it make?
The past doesn’t provide a reliable guide to the future. You may believe otherwise if you wish. Just don’t expect to fund your belief, if you don’t mind.
Cheers.
Thanks for pointing out the Oxford dictionary reference.
I have another for you.
http://www.oxforddictionaries.com/definition/english/lol
As the Oxford D points out, the word ‘warmist’ is used by those in an opposing camp. It’s political jargon, not neutral, and your use is a giveaway.
Fact-based discussion should be above tribalism, don’t you think?
barry,
You say my use of the word “Warmist” in a derogatory sense is a giveaway. Well, yes, if you’re really thick, you might need a few extra clues to realise I’m not exactly a fan of foolish Warmists.
Sorry if I’ve been too subtle for you.
CO2 still has no heating properties. Blaming me won’t improve the situation.
Cheers.
Im not exactly a fan of foolish Warmists.
You’re a fan of generalized sledging. So facts-oriented.
Skeptics analyse trends all the time. But you don’t seem inclined to sledge them for it.
You’re not concerned enough with ‘facts’ or good reasoning to criticise when a skeptic posts tripe.
You’re a team-player, I’ll give you that.
The past doesnt provide a reliable guide to the future.
Pffft. Assertion free of any constraints. But maybe the sun won’t come up tomorrow, maybe the population of the Earth will start diminishing tomorrow…
I do hope you have nothing invested in stocks. That kind of investment is based entirely on past performance providing a guide to the future.
Do you need to re-jig your superannuation? Don’t know what’s left if you eradicate all assets that rely on trends to presage the future.
In fact, many successful predictions are made from assessing trends (and, often causes). The lazy non-objective make sweeping generalizations.
barry,
Maybe the Sun won’t come up tomorrow, maybe I’ll have a heart attack tonight . . . Who knows?
I assume that the one will happen, but the other won’t.
I have nothing invested in stocks, because the past doesn’t predict the future. Cashed in my super years ago. Good decision, as it turned out. Even Governments require a warning to floggers of financial “products” that past performance is not a reliable indicator of future performance.
Many foolish Warmists, financial advisers, economists,Governments etc., get caught flat footed because they thought that they knew what the future held.
Do as you wish. You’ll expect me to pay for your gullibility if things go wrong, of course. Pity.
Cheers.
“Warmists”
Ultimately it’s based on physic. Trend analysis is only part of the whole story. You can believe it’s a “warmist” trait, but the truth is everyone does it, and the truth is you didn’t chastise ‘skeptics’ for doing it.
You’re not remotely objective, so don’t pretend to be so lofty.
CO2 still has no heating properties.
GHGs have optical properties that keep the surface warmer than an atmosphere without them.
Deny this and we can safely disregard your opinion on CO2.
Accept it and you’ll need to qualify that remark.
Do as you wish. Youll expect me to pay for your gullibility if things go wrong, of course. Pity.
You keep mentioning money. The fundamentals of science are based on the thickness of your wallet, perhaps?
It’s odd to see you lauding ‘facts’ and decrying ‘feelings’ when almost every post you make has a political reference.
You’d be a tad more convincing if you weighed some criticism on ‘skeptics’, who have posted views opposite to your on this thread quite often.
But they are your ‘tribe’ and you don’t have enough objectivity to to be even-handed in who and what you criticize.
You’re not here to shine a light, just spar with the enemy. So spare us the pretense of being concerned with ‘facts, eh?
barry,
Unfortunately, neither you nor any other foolish Warmist can even propose a falsifiable hypothesis relating the the alleged heating effects of CO2. Heating, as in temperature, increase, not stupid Warmist Weaselwords like “warmer than it otherwise would be”.
Ascribing vague magical properties “. . . CO2 has optical properties . . . ” is just trotting out meaningless sciencey rubbish.
You need some actual science. Just one repeatable experiment demonstrating the ability of CO2 to actually raise the temperature of an object would settle the matter. Unfortunately, foolish Warmists claim that raising the temperature of CO2 proves something or other.
You might have noticed that any gas at all can be heated and cooled. Nothing special about CO2 in that regard. You can heat CO2 with infrared if you wish. You can heat yourself with infrared also. Remove the infrared source, and CO2 cools.
Professor John Tyndall showed this over a century ago, but foolish Warmists don’t bother reading Tyndall’s work for themselves.
So no, I don’t believe in magic, or phlogiston, or the luminiferous ether.
CO2 heats nothing. Never has, never will.
Cheers.
You deny the greenhouse effect. Ok.
Thanks for the chat.
Remove the infrared source, and CO2 cools.
Missed this in the scroll – the best piece of nonsense yet.
Every object emits radiation. Unless we are expecting the Earth to cool to absolute zero in the near future, your point is entirely moot. The ‘greenhouse’ effect will be in play for a few billion years, at least on this planet.
Given above: average 1980, approximately.
Given above…
The satellite temperature record begins in December, 1978 and records about .25 C of this step-up.
Average anomaly of the purported pause period is -0.11C (Jan 1981 – Dec 1997, UAH6.5 data: rejected pre 1981 data as being part of the purported step-up)
Subtract 0.25C for temps prior to purported pause = -0.36
PDO switch happens from August 1976, when PDO abruptly goes from negative values to sustained positive values.
Number of months from Aug 1976 – Dec 1980 = 53
Purported step-up period (0.25C) per month is 0.0047C per month
By Dec 1978, purported step-up has reached -0.22C
By Dec 1980, purported step-up has reached -0.11C
Average anomaly Dec 1978 – Dec 1980 = -0.165
(Actual average UAH6.5 anomaly Dec 1978 – Dec 1980 = -0.13C)
Here is an example of simple calcs to determine what the average temperature anomaly should be for the Dec 1978 – Dec 1980 period, using the values you’ve given.
I get a different result to -0.05C.
I ask again, how did you calculate it? Can you show please with at least the detail I’ve given here?
A different calc, based on what you said.
Change from Dec 1978 to Dec 1980 is +0.25C of a total 0.3C of the purported step-up period.
Based on previous: average anomaly of the purported pause is -0.11C
Subtract 0.25 to get Dec 1978 value = -0.36
(By coincidence (?), that’s exactly the value we see in the UAH6.5 record for Dec 1978)
Average anomaly from Dec 1978 to Dec 1980: -0.235
That’s quite different to your estimate of -0.05C average for the same period.
Please show your calculations.
You are dyslexic, right?
Try again. Average 1980.
Dyslexic?
The satellite temperature record begins in December, 1978 and records about .25 C of this step-up.
But ok, let’s work out the average temp for 1980, based on everything you’ve said.
Average anomaly ‘pause’ period = -0.11C
Purported step-up amplitude = +0.25C from Dec 1978 to Dec 1980.
Satellite period for Dec ’78 for Dec ’80 step-up = 25 months
0.25C / 25 months = 0.01C per month: subtract that amount for each month of 1980 from -0.11C ‘pause’ period average to arrive at -0.23C for Jan 1980.
Average 1980 anomaly under your provisions = -0.17C
Quite different from your -0.05C 1980 average.
Third invitation: please show your detailed calculations.
@Mike Flynn,
“Anybody who believes stock market forecasts is a fool, well intentioned perhaps, but a fool nevertheless. Economic forecasts are even worse, if that is possible. Surely no rational person (obviously not including politicians) would give these dimwit forecasters the slightest credence!”
You are absolutely right!
What it’s worse, it is that doing those silly forecasts (always failing) they finally achieved the right of “print money” to make their previsions right. Now the stock market is no longer driven by the demand and offer of goods produced by the myriad of working people who made the true and healthy economic power of our civilization, but the demand and offer of pieces of paper.
Paper that sometimes can be sold before they have been bought allowing the stock operators to literally make money leading to bankrupt healthy companies.
I don’t know Mike, but it looks like that everywhere statistical analyses have been used without care, produced damages.
Have a great day
Massimo
A ‘skeptic’ anti-capitalist. Don’t see that every day.
Hi Barry,
I don’t know why you should link the two things, anyways I’m not an anti-capitalist.
It depends on what “capitalist” means for you.
In last years that concept changed a lot, if you really believe the capitalism is just making money speculating in the stock market (as many economists believe), then yes, I’m an anti-capitalist.
But I’m absolutely convinced that it has nothing to do with the real capitalism who leaded the western countries to the highest wellness they ever experienced before.
There is no difference between allowing the stock traders to speculate and make money just dealing on the value of some certificates and print false money.
Have a great day.
Massimo
More like a true capitalist. The system we have now has been designed over time to minimize the potential for market crashes. It was all done with good intentions but it has resulted in what used to be the support systems of finance and banking becoming the tail that wags the economic dog instead of the other way around. This change has been manifested in terms like “bubble” and “too big to fail”. We will not be a true capitalist nation ever again until the economy drives the market instead of the other way around. But that isn’t likely to change without a great deal of pain because the practice of “crony capitalism” is much easier to practice with the current system.
Hi RAH,
“We will not be a true capitalist nation ever again until the economy drives the market instead of the other way around.”
Can’t say it better!
Have a great day.
Massimo
Decrying the stock exchange is a pretty socialist view. Capitalists love it, obviously. It’s the tertiary outcome of buying and selling goods for profit.
I’ve always seen it as a bit of roulette wheel.
Interesting perspective.
The commonality between climate science and stock market forecasting is — wait for it — MODELS.
Both are chaotic systems that have too many variables to model accurately. Although this means that we cannot predict finite results, we can understand fundamentals.
The laws governing stocks include Present Value, Return on Equity, Compounding Interest, etc. If a person invests in these fundamentals and diversifies, the market is your friend. It is when charlatans pitch investment paradigms that violate these laws (like Madoff) when trouble ensues.
There are also physical laws of heat transfer, SW vs. LW penetration of water, the lapse rate which expose the CO2 charlatans. Unfortunately, people fell for Madoff and Trenberth in equal fashion.
In climate science, this had led to strange twists of physical laws that are fundamental violations of established physics
Slowed cooling makes objects warmer
Insulation “creates” heat
Ocean temperatures are raised by an atmosphere that garners most of its heat from the very cooling process the ocean uses (evaporation)
How climate science forgot basic physics is a mystery that will one day be unravelled.
Right you are, Massimo, to be skeptical of the stock market hucksters and the climate hucksters, both.
Yes mpainter,
I believe that one shouldn’t be ashamed of being skeptic when something doesn’t sound good.
In late 90s, when the “new economy” had been established, I’ve been called communist from some friends for having said what I wrote above about the stock market.
Now I feel like Cassandra, because it happened exactly what I predicted those days, and they lost a bunch of money that I don’t.
IMHO one big issue of these times is that many people want ear just what they suppose it’s better in their point of view. And often prefer a rhetorical approach to discussions instead of the rational one.
I’m like S.Thomas, if it’s so easy to demonstrate the point of discussion just clearly explain me it, let me thrust my finger in the side of problem.
Have a great day.
Massimo
many people… often prefer a rhetorical approach to discussions instead of the rational one.
+1
I ask for calculations and I get sentences. Where do I sign up to your world?
Right calculations must be provided by who supports a theory not by who is skeptical of it. And they don’t suffice, they results must be observed and verified in reality.
One can’t ask a skeptic to falsify the things he/she is skeptical that they exist, if the ones who support those things don’t demonstrate that they really exist before.
The whole GHGs theory in its magnitude (even if it exists) is far to be demonstrated.
If it wasn’t true, we were not here discussing about it.
Have a great day.
Massimo
Right calculations must be provided by who supports a theory not by who is skeptical of it.
Boy, did I get that the wrong way around. mpainter proposed a claim, then I tried to verify it with some calculation. Asked him to, but he didn’t. I just knew there was something wrong with that picture.
I suppose I should verify what I mean. The latter part of the discussion is just above, starting from here.
http://www.drroyspencer.com/2016/07/record-warm-2016-what-a-difference-one-month-makes/#comment-216771
Still waiting for some calculations from mpainter…
Guess I should brace for more sentences.
Barry, you will get nothing until you show better comprehension. Everything you ask is given in my previous comments, if only you tried to read comprehendingly. For the forth time, average 1980 data
No calculations needed, that’s given in the data. Might be closer to -.04 C than -.05
I calculated 1980 average.
http://www.drroyspencer.com/2016/07/record-warm-2016-what-a-difference-one-month-makes/#comment-216783
I get a different result to you.
4th invitation. Please show your calculations.
“Guess I should brace for more sentences.”
Should have been on that.
50 bucks says mpainter will reply in sentences again, no calc. Anyone care to back mpainter?
I made no calculations. The average is given in the data, as I have stated, how many times? You must some impairment to your comprehensive faculties, Barry Swartz.
Read the data, the UAH data, what’s wrong with you?
I made no calculations.
Finally. As I suspected. Persistence can pay off.
The average is given in the data, as I have stated
The 1980 average with no adjustments for the 0.25C ‘step-up’ is -0.04C
The trend is still 0.08C/decade Jan 1979 to Dec 1997. Nothing’s changed.
One cant ask a skeptic to falsify the things he/she is skeptical that they exist, if the ones who support those things dont demonstrate that they really exist before.
A true skeptic questions first whether they themselves understand the issue. True skepticism means subjecting one’s own opinion to rigorous testing.
No, It’s not enough just to disbelieve and then demand evidence to the contrary. That’s not skepticism. It’s contrarianism. A skeptic studies for themselves, deeply, before coming to a provisional opinion.
It’s decidedly not skepticism to dismiss evidence when presented. That, too, is contrarianism.
Barry imagines to instruct us on the principles of skepticism.
!
Mainly you.
A true skeptic constantly turns the spotlight on her own opinions. Intransigence is pretty much the opposite of skepticism.
Intransigence is the trait of the AGW hard core, with their rigid, doctrinaire theory and their inability to assimilate observations.
And when I insist on observations, then I get called “denier”, or “contrarian”.
“Contrarian” is a term of the investment world which characterized the practices of a certain class of investors. Has no place in science.
So Barry imagines himself as the fount of truth on proper skepticism. I’m amused. ☺
Down with the imperialist stock market.
Down with the communist climate change agenda.
Mercy. Bartering privately owned goods might be the way to go.
The warming of the satellite era is fully explained entirely by natural variations,specifically, the shift in the POD to its warm phase, aerosol reduction, both these in the late seventies, and then the late 20th Century warming due to reduction in cloud albedo, otherwise known as the step-up.
Masking the first of these yields two flat trends connected by the step-up and masking the step-up yields a 76 year trend without any AGW effect.
a linear trend with a low-frequency cycle will cause the step-like behavior…I discussed it here: http://www.drroyspencer.com/2013/11/the-magical-mystery-climate-index-luis-salas-nails-it/
Right, and if a low frequency cycle can be identified, then it starts to come together. But add another factor, such as a general “brightening”, and it’s more complex.
I am much impressed by the 98 ENSO, manifesting as it does the step-up, with its unprecedented spike and a La Nina not so cool as previous low anomalies.
My view is that only increased insolation could account for this.
This for me makes Pinatubo an intriguing phenomenon, with its permanent effect on the temperature of the lower stratosphere, seemingly.
Ah, well, speculation can be interesting.
Where’s barry when we need him… to tell dr spencer that “step-like behavior” is just a figment of his imagination. ☺ (we sure are getting a lot of milage out of these happy faces ain’t we painter?)
“a linear trend with a low-frequency cycle will cause the step-like behavior”
I said from the outset that you can find step-like periods in a linear trend. I demonstrated it by fabricating numerous data that were designed to have a trend and showing step periods of up to 50 years and then hunted for ‘pauses.’ The pauses were artefacts of the selections I made, because the quasi-random data had been deliberately designed only to display a trend.
You don’t even need a low frequency cycle, just careful cherry-picking.
“I demonstrated it by fabricating numerous data that were designed to have a trend and showing step periods of up to 50 years…”
###
Fabrication? You demonstrated _what_ by fabrication? The real world?
Sounds like fun!☺
This is one of the ways you can test a hypothesis based on real world data. Create synthetic data of same variance and trend and see if what you think you see occurs in data with the same statistical properties. That’s what I did. Created data with same trend and variance as lower trop. Did I find pauses? Yes. Were they of similar duration? Yes. Were they at exactly the same timing? No.
Synthetic data with the same trend and variance as lower trop produced what looked like pauses. Therefore the variance can explain pauses. Because the pauses weren’t built in to the synthesis, only trend and variance.
Hi fonz,
What Barry in fact claimed was that the step-up was “an artefact of data selection”.
Interestingly, Roy Spencer seems to be one of those who engage in “data selection”. I trust that Barry will show him the error of his ways and the pitfalls of “data selection”.☺
As Roy explained, a “step up” is a mirage due to the effect of two behaviours.
In your case it is due to a linear trend (global warming) plus an erratic ENSO cycle.
i.e. Your “step up” (which only you can see) does not represent a physical process on its own.
I suggest you take up another hobby and leave science to the big boys.
Hi Barry,
“A true skeptic questions first whether they themselves understand the issue”
For your knowledge, I’m an electronic engineer and in the past I designed a lot of things (I’m not retired so I still design), some professionally and other just for passion.
So it happens that I designed a 0.1nm resolution UV/Vis/IR
spectrometer having solid state and photomultiplier detectors with 90dB of dynamic, doing that I learnt on the field what’s the difference between regular and diffused transmittance, regular transmittance for EM active gaseous samples never give a complete amount of energy that passes through the gaseous sample.
My skepticism arises because some climatologists want to use those regular transmittance spectra to stablish the effect of well know EM active gases.
I wasn’t thinking of you personally when I posted.
So, I little know about what I wrote, but of course I could be wrong when I argue that nobody really knows what’s the real outgoing LWIR at the TOA. I repeat, it suffices one paper which show me that someone has considered the whole non-nadir radiation, and I stop my skepticism about that.
Have a great day.
Massimo
I agree.
You appear to know little about what you comment on.
For example, do you understand “solid angles”?
Why don’t you just say what you want to say, instead of asking witless gotchas?
Or do you really not understand what a solid angle is? If you do, what is the point of your question?
Are you just trying to be gratuitously offensive? A fairly puerile effort, if so.
Do let me know if you really don’t “understand solid angles”. I’ll be glad to instruct you how to search the Wide Workd of the Web.
Foolish Warmist.
Cheers.
Hi Dr.No,
tell me what do you want know about solid angles?
Have a great day.
Massimo
Massimo,
Or even at night, or in the depths of Winter.
The foolish Warmists don’t even realise that light covers all energies, from the indescribably small, to the unimaginably large.
Some Warmists don’t realise that terms such as TOA, ECS, TCS, ERL, and suchlike, are convenient fictions, generally not as useful as a frictionless surface, or infinite plane.
Some Warmists don’t realise that the atmosphere changes in both physical and optical thickness between the poles and the equator, and chaotically and unpredicably in all locations.
CO2 Warmists ascribe physically impossible heating properties to CO2.
Foolish Warmists cannot even state a falsifiable CO2 heating hypothesis, but insist one must exist, otherwise CO2 Warmists must all be foolish, gullible, delusional, or some combination of the three.
Hence, some of them lurch off into discussions of politics, economics, Big Oil, conspiracies, or any thing else which enables them to deny, divert, and confuse.
What a pack of foolish Warmists!
Cheers.
The foolish Warmists dont even realise that light covers all energies, from the indescribably small, to the unimaginably large.
Not ‘light.’ That’s what we call the spectrum visible to humans. You mean ‘electromagnetic radiation.’
If you are not human, I apologize.
Some Warmists dont realise that the atmosphere changes in both physical and optical thickness between the poles and the equator
I certainly realize that. Tropopause is nearer the surface at the poles, for example. Water vapour is in different concentrations all over the atmosphere, for example. To a much lesser degree, same with CO2.
CO2 Warmists ascribe physically impossible heating properties to CO2
I don’t. But you say bizzarre stuff to me as if you believe I do.
Like things about removing IR and CO2 cools. A useless observation regarding the effect we’re discussing. The Earth isn’t going to stop emitting IR any time soon. Atmospheric CO2 will continue to absorb and re-emit it.
Mike, are you imagining that “warmists” believe CO2 molecules create energy?
GHGs don’t create energy. They redirect it.
The external power source is the sun.
IR emitted from the surface of the Earth that would otherwise head straight out to space is scattered by GHGs. The net effect is to slow that escape to space. Back radiation to the surface warms it. No energy is created or destroyed, only the flow is affected.
That part is pretty simple to understand.
Barry spouts: “Back radiation to the surface warms it.”
Barry you are lost in a big ocean with a sinking canoe and no paddle.
Barry, the more astute AGW types have abandoned the “back radiation warms the surface” meme. The Trenberth type energy budget diagrams have been discarded, as it is obvious that they violate fundamental radiative physics: LWIR cannot warm water.
Slowly, inch by inch, the AGW meme is being modified to agree with the principles of physics formerly ignored. This is due to skeptics.
Much more revision is needed, however. This will take place as the pause extends through the next decade.
It starts with “back radiation to the surface warms it”
Then, when LWIR proves incapable of warming water (70% of the earth’s surface), the claim changes to “slows cooling”
Then, when slowing cooling proves incapable of raising ocean temperatures above direct insolation, the argument switches back to LWIR warms the ocean surface and the wind mixes it. Usually with a link to the ridiculous Tangaroa (sp) study on Skeptical Science.
Of course, wind enhances evaporation which definitively cools the ocean surface.
Lastly, It all devolves to a 97% scientists final claim, and then the roosters kick over all the chess pieces and strut across the board claiming victory.
AGW, the religion of post-modern science.
barry,
I was using the term in the physical, rather than the foolish Warmist sense –
“In physics, the term light sometimes refers to electromagnetic radiation of any wavelength, whether visible or not.” Or you could read Richard Feynman’s book “The strange interaction between light and matter”, if you want more.
Even so, it appears that some Warmists refer to ultraviolet light, and infrared light. Maybe they don’t know they’re wrong according to you.
I find light easier to use than electromagnetic radiation, but please feel free to substitute electromagnetic radiation when I write light. It makes no difference, as far as I can see. Sorry if I assumed you were more physics literate than you are.
I said “some” Warmists. I am pleased you agree there is no fixed TOA or ERL in physical terms.
Any normal physicist knows that without replacing radiated energy, a body will eventually fall to absolute zero (in theory, of course). CO2 is no different in this regard.
CO2 has no intrinsic heating properties. At absolute zero it can heat precisely nothing, not even itself
Perhaps someone out there believes GHGs are sources of energy. Go and repeat this refrain to them. You’re talking to me and this is a straw man argument.
In the real world (Earth system) infrared radiation is a constant. So is the greenhouse effect.
Barry identifies Warmists “Perhaps someone out there believes GHGs are sources of energy.”
Barry the basis of the IPCC scandal is “radiative forcing”! Do you not understand that? It is creating energy out of thin air.
‘Radiative forcing’ includes solar, GHGs, aerosols, black carbon, albedo etc.
The IPCC does not claim that added GHGs cause more energy in the whole atmosphere. GHG ‘forcing’ is about the redistribution of energy. More GHGs cause more warming at the surface, not throughout the atmosphere. That’s the IPCC posit.
Treating the atmosphere as an undifferentiated slab is century old thinking.
You’re wrong Barry. The IPCC uses the bogus Arrhenius CO2 equation to arrive at about 2 Watts/sq. meter–energy from “thin air” (400ppm).
You’re attempting to support pseudoscience. Your canoe is rapidly sinking.
No and no.
I’ve asked for a cite from IPCC reports that they use “Arrhenius’ equation” as the working basis. No one ever comes up with the goods.
Arrhenius came up with a climate sensitivity of 5.6K per doubling CO2. That’s a lot more than IPCC.
They hide it in the references they use. Translation: They know it is bogus!
barry,
Sorry. Accidentally sent before. Please excuse any typos.
CO2 can only heat things cooler than itself, or be heated by hotter things. A sample of CO2 and a sample of O2 at the same temperature, are in thermal equilibrium with each other. Each receives as much light (or energy, if you don’t understand light), as it emits. And both will eventually reach equilibrium with their surrounding environment, be it 0 K, or 1000 K.
I am glad you realise that GHGs don’t create energy. They heat nothing. Redirecting energy heats nothing overall, either. No foolish Warmist misdirection about back radiation will magically create additional energy resulting in a rise in temperature.
For example, the foolish Warmist Gavin Schmidt breathlessly proclaims “Hottest year EVAH”, indicating an absolute global temperature increase. As you point out, the Sun’s output remained constant, so redirecting its energy does not change the total heating effect available.
There are a few blindingly obvious reasons for terrestrial thermometers to show increases in temperature over time. I am aware of at least one peer reviewed paper published in a reputable journal recently, based on data supporting conventional, rather than Warmist physics, showing one such reason.
CO2 fixated Warmists cannot tear themselves away from the cultist thinking of James “Death Trains” Hansen, and his odd predictions of boiling seas, apocalyptic storms, Venusian conditions, and all the other cult leader scary stuff.
No heating due to CO2. None. No increase in global temperature due to CO2. Objects heated by the Sun during the day, cool down at night. Fourier noted this, and added that at night, the Earth also loses a part of its own heat. He endeavoured to calculate the Earth by using heat loss measurements, and extrapolating backwards. Like Lord Kelvin, he was wrong, not being aware of heat created by radioactive mass conversion to energy.
Now’s your chance to accuse me of being a communist, capitalist, or some other -ist, if you can’t find any actual facts to support your CO2 heating hypothesis. Best of luck.
Cheers.
Redirecting energy heats nothing overall…
A focussed mirror will heat things locally.
The universe has an average temperature, but elements within get hotter and colder all the time.
Redirecting energy changes nothing “overall”, but it does change temperature locally – as in in the surface of the Earth. That’s why we have seasons. Insolation is redirected by orbital dynamics.
GHGs redirect energy through the atmosphere, causing the surface to be warmer than it would be with no GHGs. The radiative balance between the energy coming from the sun must be in equilibrium, but the temperature of various strata of the atmosphere may change according to how energy is directed.
A pot of water with a lid boils faster than a pot without. The overall energy is the same, just redistributed over time.
I add sweaters to my body and I get warmer. The overall emissivity remains the same, but the thin layer of air near my skin gets warmer.
Energy is redistributed, not created. This is the cause of the greenhouse effect.
barry,
I said overall. If you redistribute energy, to heat something, you cool something else. Or does the miracle of CO2 heating mean that nothing cools down, when you redistribute energy away from it?
Sorry, not possible.
If an object is warming, there is no equilibrium. In an object is cooling, there is no equilibrium. The Earth has cooled over the last four and a half billion years. No equilibrium.
As to your foolish Warmist pointless and irrelevant analogies, taking refuge in pot lids is just as foolish as claiming that any number of sweaters on a corpse will raise its temperature. Place a pot with a lid in the Sun. The water heats more slowly than without the lid. It eventually reaches the same temperature anyway. More foolish Warmist denial and obfuscation.
CO2 heats nothing. As for concentrating or redistributing energy, foolish Warmists believe that it is possible to concentrate 300 W/m2 in such a way as heat water. A block of ice at below freezing emits more than 300 W/m2. Try concentrating that emission to boil water. Use as many cubic kilometres of ice as you like.
Foolish Warmists don’t understand what they are talking about.
No heating due to CO2 in the atmosphere. Rather the opposite, according to radiative transfer equations.
Cheers.
A focused mirror??? Implying the atmosphere is now a focused mirror?
Nope. It was an example in response to a general comment.
A “focused mirror”??? Implying the atmosphere is now a “focused mirror”?
Seriously?
Barry, you are really getting desperate.
A focused mirror??? Implying the atmosphere is now a focused mirror?
Nope. It was a response to a comment that was not specific to the atmosphere.
See how desperate you are–even submitting the same comment twice!
So, you now admit the “focused mirror” has NOTHING to do with the atmosphere, huh?
Occasionally I hit the wrong ‘reply’ button, and then repost to the correct thread when I’ve noticed it.
So, you now admit the focused mirror has NOTHING to do with the atmosphere, huh?
The remark was in response to this point.
Redirecting energy heats nothing overall
Which is not specifically about the atmosphere but about radiative dynamics in general.
There’s nothing to admit.
I said overall. If you redistribute energy, to heat something, you cool something else. Or does the miracle of CO2 heating mean that nothing cools down, when you redistribute energy away from it?
Yes, things cool down in the atmosphere under GHG warming. The lower strat gets cooler under GHG warming scenario.
Thought exercise: can you tell me what cools down when you put a lid over a pot?
And if I put 4 tight sweaters on at once, what cools down as a result?
The overall ‘system’ in these examples create no energy. But heat is redistributed. So the water gets warmer with a lid on the top of the pot and my skin gets warmer with added layers of tight sweaters.
What cools in these examples?
Time-dependent answers are acceptable. 🙂
Should have been more specific:
Thought exercise: can you tell me what cools down when you put a lid over a pot that is heated underneath by an element at 120C?
Barry, to answer your question, “what cools down?” (while not entirely accurate as a question) is the air above the pot.
barry,
I don’t think your foolish Wsrmist attempts to deny, divert, and obscure are working all that well.
You seem to be obsessed with demanding that I answer questions when you are quite obviously not seeking knowledge. Foolish Warmist tactics. As I said, put as many sweaters as you like on a corpse. It still won’t heat up.
It doesn’t matter how you redistribute non existent heat from the Sun at night. There isn’t any appreciable amount. The surface cools. So does the atmosphere, apparently. Maybe you think it heats up to restore some Warmist balance. I don’t, obviously.
How about sticking to the supposed heating abilities of CO2? There aren’t any of course, but fixated foolish Warmists cannot accept fact.
Cheers.
As I said, put as many sweaters as you like on a corpse.
You keep repeating this irrelevant point.
The earth has a heat source – the sun.
A live body has a heat source – internal chemical processes.
A corpse is not an apt analogy for the Earth. Red herring.
What is cooled when a live body gets covered in sweaters? Overall emissivity stays the same, so why is the air near the skin warmer?
To repeat myself – what cools – again, not an accurate question, is the surrounding air, which no longer receives the heat from the covered body.
How about sticking to the supposed heating abilities of CO2?
What would the average surface temperature of the earth be the same as it is if there were no GHGs?
There’s only one correct answer to this. As your position is unclear, a direct answer would be appreciated. Just be straight with the question, please.
barry,
You wrote –
“What would the average surface temperature of the earth be the same as it is if there were no GHGs?”
Could you please write your question in plain English, rather than Warmese? As written, it doesn’t appear to make any sense.
Cheers.
sweaters on a corpse
You keep referring to an object that has no replensishing heat source. Please stop. It’s irrelevant. The Earth and its atmosphere have a constant heat source.
Like a live body, not a corpse.
(Mind you, a decaying body gives off some small amount of heat for a time, but quite negligible compared to a live one)
barry,
Place the corpse in the Sun if you wish. That might heat it up. As I’ve pointed out, I insulate my house to keep it cool. I live where there are a lot of sunlight hours, in the tropics. It still cools down at night.
The Earths internal heat source is insufficient to maintain its surface temperature.
It has cooled for four and a half billion years as a result.
How about just pasting a falsifiable hypothesis of the Warmist CO2 heating effect? I’m pretty sure you can’t because there isn’t one.
Back to pot lids, sweaters, Big Oil, or anything but the Warmist heating properties of CO2, I guess.
Keep wishing. Miracles or magic might occur.
Cheers.
Back to pot lids, sweaters, Big Oil, or anything but the Warmist heating properties of CO2, I guess.
I don’t know what “warmist heating propertis” are. Something in your mind about GHGs being a source of energy. As I’ve stated that’s not my opinion, I don’t know why you keep inferring that it is.
I’ve explained how GHGs keep the surface warmer. You haven’t dealt with that except to talk about corpses and CO2 as some magical heat source.
Whoever you think you’re talking to, it clearly isn’t me.
I’m interested in your answer to my question below. As you’ve done a lot of rejecting and hardly any propounding (except about “warmists” and corpses), it’s unclear how you formulate the role of IR absorbing gases in the atmos and that effect on the surface. You tell me what you think GHGs cannot do, but very little about what they do do.
barry,
Foolish Warmists claim that the presence of GHGs in the atmosphere raise the temperature of the surface, (not just keep it warmer). As in “Hottest year EVAH!”
It’s clearly nonsensical.
To raise the temperature of the surface requires additional energy. You apparently claim that after four and a half billion years of cooling, CO2 is redistributing heat from the Sun to cause the cooling to stop, and the surface to increase its temperature. As in “Hottest year EVAH!”
CO2 has never been shown to have this property. Even foolish Warmists are unable to put forward a falsifiable hypothesis to support such magical behaviour. Just more attempts to deny, divert, and confuse.
How about a repeatable experiment, showing the Warming heating abilities of CO2? Not the ability of CO2 to be heated – which it shares with all matter. You can’t.
Cheers.
Place the corpse in the Sun if you wish.
But I don’t wish. You have been asked straightforward questions. Seems you want to keep deflecting to corpses and warmists. Your interests have been noted. Hopefully you can move on.
Your choice. I’m trying to discuss the suppose heating properties of CO2. You can’t actually point to any, or even propose a suitable falsifiable hypothesis.
That’s the nature of foolish Warmists.
Cheers.
How about sticking to the supposed heating abilities of CO2?
Would the average surface temperature of the earth be the same as it is if there were no GHGs?
Your position is a little unclear. A direct answer would be appreciated. Just be straight with the question, please.
barry,
The direct answer to your question is no, of course.
Let me know if there are any other questions to which you don’t know the answer.
It’s a foolish Warmist trait to make a statement masquerading as a question. I assume you’re not foolish enough to try that. I might be wrong, of course.
Cheers.
Barry is flailing around mid-ocean trying to save himself. His canoe sank minutes ago.
Then we are agreed that GHGs in Earth’s atmosphere affect the temperature at the surface.
Let me know if there are any other questions to which you dont know the answer.
I’ve been saying that since we started interacting. Took your time to agree with me.
So, GHGs in the atmosphere do have an effect on energy at the surface. Looked like you’d been trying every trick in the book to dismiss that fact.
So, if we add or remove GHGs in the atmspohere, that changes the net energy at the surface, right?
Barry,
Yes, you are correct. According to NASA (not always reliable, I admit), the atmosphere results in around 23% of the Suns radiation not reaching the surface.
GHGs are part of the atmosphere.
Hence the reduction in surface temperature in direct sunlight below that which is possible in the absence of an atmosphere (including GHGs).
Foolish Warmist. Use the radiative transfer equations. At night the temperature drops, but not as much as it would without any atmosphere. Use the radiative transfer equations, if you want to check. Or Newton’s Law of Cooling.
You may think what you like. Foolish Warmist.
How’s your falsiable hypothesis hunt going! Or are of the view that Warmists don’t need no stinkin’ real science – Cargo Cult Science is sufficient for foolish Warmists!
Cheers.
barry,
I don’t need “tricks”. They seem to useful to foolish Warmists – as in “Mike’s Nature trick”. The foolish Warmist version of science. Fools. It’s a travesty, as a noted foolish Warmist said.
Cheers.
Poor Mike.
Would you rather spend a winter’s night, out in the open, under a clear sky or a cloudy sky?
I would prefer a cloudy sky since it will be much warmer.
But, I hear you exclaim, the clouds- like CO2- cannot warm you.
Then, why am I warmer?
AND – You have not explained why, in your own words, the presence of the atmosphere slows down the surface cooling at night.
i.e.you admit and deny a greenhouse effect at the same time !
Poor confused skeptic.
Cheers.
dr doesn’t know queries “Then, why am I warmer?”
You don’t understand heat transfer.
I’ve explained the reasons for the atmosphere slowing down the rate of cooling at night, as the obverse of the mechanism which reduces the rate of heating during the day. The radiative transfer equations give you some idea of the numbers involved.
Foolish Warmists have some weird ideas about the properties of the atmosphere.
There is no greenhouse effect. Even foolish Warmists get tongue tied trying to describe the operation of a greenhouse with no walls, and no roof, which has been steadily cooling for four and a half billion years.
That’s foolish Warmists for you. Cargo Cult Science at its finest.
How’s your “CO2 heating “falsifiable hypothesis going?
Cheers.
I repeat – why am I warmer?
Does it have something to do with the presence of H2O in the clouds – way up in the sky – maybe about 1km up?
Sometimes the clouds could be cirrus – even further away – maybe 10km up in the sky – yet, still, they have a significant effect on overnight surface temperatures.
Strange – isn’t it?
But (I hear you say) – that has nothing to do with CO2.
Why, I ask? Both H2O and CO2 absorb and emit in the relevant wavelength bands.
More H2O would mean higher surface temperatures.
Ditto CO2.
Simple really.
Discuss.
How’s your falsifiable CO2 heating hypothesis going?
Can’t actually find one? What a surprise!
Cheers.
So tell me, foolish Warmist, what has your preference to do with the supposed heating ability of CO2?
Your pathetic attempts at gotchas are both pointless and irrelevant.
I’m sure you would prefer a proper blanket or sleeping bag to all the CO2 heating ability in the world, but I might be wrong.
The ability of CO2 to raise the surface temperature of the Earth, or even a small brick, is precisely zero.
No amount of deny, divert, and confuse will overcome this simple fact. You may whine all you wish about people refusing to obey your commands and demands, but CO2 still heats nothing.
If you don’t know the difference between CO2 (a gas), and a cloud (not a gas), then it would seem you are eminently unsuitable to provide factual information about either.
Clouds, like CO2 provide no heat. Anybody silly enough not to take shelter from the blazing sun when there is shade provided by a cloud, might not realise this. Foolish Warmists, and mad dogs, go out in the midday sun! Rational people stay in the shade.
Provide a falsifiable CO2 heating hypothesis if you choose. Otherwise, I’ll continue to use foolish Warmists as a source of humour, even the butt of an occasional joke.
Cheers.
“If you dont know the difference between CO2 (a gas), and a cloud (not a gas), then it would seem you are eminently unsuitable to provide factual information about either.”
I see, you think it is the difference between gases and liquids that affects the surface temperatures.
You imply that H2O as a gas does not absorb and emit infrared radiation the same way as H2O as liquid droplets. That is an interesting viewpoint.
Barry, you are doing an admirable job trying to educate the ignorant.
I fear it is a lost cause with this mob.
Your fears are well justified. But keep going. Maybe you can threaten to hold your breath until you turn blue in the face!
That’ll fix ’em! Or give them a good laugh! Who knows?
Cheers.
Mike, go and stand in the naughty corner until the bell sounds.
doctor no,
If I don’t, will you throw a tantrum? Please?
Cheers.
I will have to keep you in and subject you to another lecture on the science of greenhouse warming. You would like that (not) !
Mike,
Hence the reduction in surface temperature in direct sunlight below that which is possible in the absence of an atmosphere (including GHGs).
I thought you understood that the hypothetical was only about removing GHGs. Let’s try again so we’re on the same page.
If everything else in the atmposphere was the same (including pressure), but all GHGs removed, do you believe the temperature at the surface would be the same?
Yes or no?
You foolish Warmist.
Can you not understand plain English?
Are you stupid, or just addicted to asking witless gotchas for some bizarre reason?
There is no greenhouse effect.
Fill a room with CO2, the temperature will not increase.
You can’t even produce a falsifiable hypothesis proposing heating due to the presence of CO2 in any concentration at all. Cargo Cult Science, without even the suggestion of a repeatable experiment to support your insistent hand waving. You may choose to follow an incompetent pack of blundering, bumbling, bearded balding buffoons. I wish you contentment.
I prefer fact to fantasy. Foolish Warmists prefer fantasy to fact. If you are asking me whether removing GHGs from the atmosphere results in higher temperatures, it cerainly does in tropical arid deserts. Foolish Warmists don’t believe their own lying eyes, obviously. They foolishly think that reducing GHGs results in lower temperatures for some magical reasons.
No heating due to CO2. Never has been, never will be. Even foolish Warmists such as Hansen, Schmidt, and Mann are arguing with each other. Surprise, surprise. They’re equally foolish.
Cheers.
Barry, Mike answered previously, he said ‘no’.
GHG’s would include methane, CO2, H2O and what else?
It seems many of the arguments here have devolved to… Let me go a different direction.
Their are 3 things going in the kind Dr. Spencer’s blog –
climate and weather discussions, politics and other. Dr. Spencer’s job and, I believe, passion, is weather and climate. He comes to politics kicking and screaming, but not afraid. He maintains this blog to spread information about his passion. It is always interesting to read, and try to understand, the pieces about weather and climate.
But politics has entered the Drs realm. Those who believe mankind to be a bad actor have seized upon carbon, specifically CO2, as representative of the bad acts of humankind. Currently their focus is to browbeat naysayers into submission so those who would curtail the work of industrial man are not interfered with by those who dont agree. Theirs is a religious pogrom. Much of that goes on here.
That Dr. Spencer lets this go on is a tribute to his belief in the right to individual opinion; the right of association and free speech; his belief in freedom, even to be wrong. Of those who come here with differing political opinions than his, I cannot say the same.
Well stated, Lewis!
* The word ‘warmist’ gets 116 hits on this page alone, once every 7 posts on average.
Political identification. It’s the biggest game in town.
barry is a warmist.
117
Lewis,
Mike was answering a different question to the one I asked, as he later revealed. I asked if the temperature of the surface would be the same if there were no GHGs. He said, “no.” I thought he was agreeing that GHGs have an impact. But in the next post he revealed he had answered the question with the qualifier “without an atmosphere” in his mind. So I clarified the question.
He never answered my second question directly. But after a coupe of days posting I finally got him to say outright that he doesn’t believe there is a greenhouse effect.
Dr Spencer disagrees, and has banned people who promote this crankish idea – when they spam the message too often.
I’m with Dr Spencer. Mike isn’t.
I’m not interested in politics. Mike is.
Most of the political inference is from skeptics here. The tribalism is strongest in those. We see words like “warmists,” “alarmists,” constantly*. And comments like;
Currently their focus is to browbeat naysayers into submission so those who would curtail the work of industrial man are not interfered with by those who dont agree. Theirs is a religious pogrom. Much of that goes on here.
That is pure fantasy. That sort of thing might go on in other places – places I don’t visit – but not here.
It seems you yourself want to bring politics into the discussion. Or is it religion? Whatever.
I doubt you are a “warmist,” though, eh?
One of the most common habits of commenters here is to talk about the enemy tribe. That’s basically political. The exceptions for the most part are Massimo and Werner and David. Not many others.
Barry,
It seems you took it personally. Nothing was directed towards you. I was making a general observation as I have been reading this blog for some years.
Have a nice day.
Lewis
* The word warmist gets 116 hits on this page alone, once every 7 posts on average.
Political identification. Its the biggest game in town.
Your answer is no.
And you have finally outright said “There is no greenhouse effect.”
Good.
You misunderstand Tyndall’s experiment. Did you happen to get your misinformation from a blog such as this?
http://planetaryvision.blogspot.com.au/2014/04/why-tyndalls-experiment-does-not-prove.html
(You may find the comments section interesting. The author makes a few critical errors that are familiar to our discussion)
Clearly you dent the optical properties of GHGs. You already poo-pooed the phrase, so that’s clear enough.
barry,
Maybe you should read what Tyndall actually wrote. Tyndall demonstrated, and meticulously recorded, that gases which absorb radiation result in less radiation reaching his thermopile, and lower temperatures resulted.
As he pointed out with a diagram, an example using a solid rather than a gas, to show why this should be.
Foolish Warmists ignore his experimental results.
Even Dr Spencer cannot actually produce a falsifiable hypothesis relating to the planet heating properties of CO2. I make a distinction between foolish Warmists, and Warmists generally. I don’t consider Dr Spencer to be a foolish Warmist, just a Warmist
Foolish Warmists use terms like “climate denier” as a derogatory term for anyone who disagrees with them.
Who denies that weather exists? No one of course. Climate is the average of weather. Who denies the existence of climate? No one.
Foolish Warmists redefine words as they wish, to suit their current foolish purpose.
Foolish Warmists deny that the Earth has cooled. Maybe they are right. Maybe the Earth was created cold – my assumption is that the surface was once molten. If so, I’m right, and the foolish Warmists are wrong, wrong, wrong!
But still, no falsifiable hypothesis relating to the planet heating abilities of CO2. Warmists call this science?
It makes no difference, barry. Regardless of James “Death Trains” Hansen’s predictions of imminent doom, it seems like the rest of the world (the vast majority) will continue to ignore the beatings of a handful of misguided foolish Warmists.
Thank goodness. More CO2 good, less CO2 bad. Try growing plants without water and carbon dioxide, both resulting from hydrocarbon combustion. Even your cells produce CO2 and H2O. It can’t be all bad, can it?
Cheers.
Hi Dr.No,
I repeat the question here, so you don’t miss it
Tell me what do you want know about solid angles?
If you referred to my “less than a degree” I just remember you that the slits of spectrometer are asymmetric to improve the detector sensitivity, so their FOV s monodimensional.
If you don’t believe me go to the web site of most satellites on board instruments and see what is the FOV unit.
Sorry, here you are a Dr. but not better than me.
Have a great day.
Massimo
Sorry, I would write “anisotropic” instead of asymmetric.
Hi Massimo,
Yes, now it makes sense. The gas molecules in the upper atmosphere emit isotropically, the instrument records anisotropic EM.
Hi mpainter,
I don’t believe that the anisotropic detected EM flux it’s a real issue indeed, the problem is that it is only the coherent detected EM flux the one detected.
CERES instruments (which are radiometers with scanning mirrors in front of the input slit) do the measurements better, in fact Lindzen & Choi using their data got a lesser CO2 “forcing” (please excuse me if I put “forcing” between quotation marks, but I’m an EE and for us forcings and feedbacks are little different things).
They found the CERES measurement noisy, and attributed that noise to the clouds pattern below, but I suspect that in part that noise could be due to the different spectra at different FOV angles.
If I’m right (“if” of course), it meant that the CO2 “forcing” could be much lesser than we thought. Because as the FOV approaches the atmospheric limb, the CO2 become a “feedback”.
Have a great day.
Massimo
barry says, July 8, 2016 at 11:13 AM:
“The study is about the relative insulating properties of IR absorbing gases and low transfer coatings on glass for double-glazed insulation. Simple experiments like this are done at the high school level in all sorts of ways, confirming that CO2 absorbs radiation, heating the volume. For an experiment that more accurately reflects the amplitude of this effect in the atmosphere you need a deeper experimental column of atmosphere than a few millimeters.”
IOW, you didn’t read the paper. Barry, you’re clearly the one who’s in denial. The radiative properties of pure CO2 gas isn’t able to reduce the heat transfer through a medium any more than pure air does. That’s even without convection included (horizontal window heated from above). With convection included, this is what the paper finds:
So exactly the opposite of what you assert, that you need a deeper column of air to appreciate the full strength of the radiative effect. No, the deeper the column of air, the more convection takes over the transport of heat through the medium, and so any potential radiative effects on that transport are effectively annulled …
The larger vertical gap widths are measured in the 10s of millimetres. To run an experiment for the free atmosphere you’d need a vacuum chamber tall enough to include the tropospheric lapse rate. The size of the apparatus is cost-ineffective when we have laboratory experiments of the optical properties of CO2.
Yep, convection is also part of the atmosphere – but the paper is talking about convective effects in a narrow space, not an atmospheric column.
There’s a small irony here – the ‘greenhouse’ effect is a misnomer, though people who know anything about it aren’t misled. The apparatus for the experiment you’ve cited reflects a greenhouse much more than the real atmosphere.
The real (cost-effective) experiment is empirically based and the results are in the HITRAN spectroscopy data base. There is no question CO2 absorbs infrared. None. But high school students all over the world set up apparatus to see that adding CO2 to a volume receiving radiant energy causes changes in temperature, to the volume (increase), or to a monitor situated on the other side of the volume (decrease).
Variations of such experiments can be found on you tube. Mythbusters performed one as carefully as they could. Tyndall’s experiment was the first formally published.
There are also empirical studies of observations in the spectra associated with CO2 through the atmos and ground-based instruments, recording a darkening in those spectra from altitude, and a brightening recorded by ground instruments over time.
The atmospheric greenhouse effect is real, corroborated by independent lines of evidence. Even the experiment you cited notes the optical (IR absorbing) properties of CO2.
barry says, July 12, 2016 at 8:55 AM:
“The larger vertical gap widths are measured in the 10s of millimetres. To run an experiment for the free atmosphere youd need a vacuum chamber tall enough to include the tropospheric lapse rate. The size of the apparatus is cost-ineffective when we have laboratory experiments of the optical properties of CO2.”
Yes, no one disputes the optical (radiative) properties of CO2, barry. What we dispute is the THERMAL EFFECT of these properties on the surface of the Earth. Where is the real-world evidence of this? Please remind us …
“Yep, convection is also part of the atmosphere but the paper is talking about convective effects in a narrow space, not an atmospheric column.”
Exactly. Convective effects are even larger in an atmospheric column. You know, evaporation and condensation effects included …
“Theres a small irony here the greenhouse effect is a misnomer, though people who know anything about it arent misled. The apparatus for the experiment youve cited reflects a greenhouse much more than the real atmosphere.”
Does it indeed? Once again, barry, please remind us, where is the real-world evidence of +CO2_atm -> +T_sfc?
“The real (cost-effective) experiment is empirically based and the results are in the HITRAN spectroscopy data base.”
Er, no, because that specifically excludes convection barry. Hence my reference to the paper in question. The Beer-Lambert law only works when the air column is completely static and the heat transfer completely ruled by radiative transfer. In real life it isn’t. Far from it …
“There is no question CO2 absorbs infrared. None.”
Who claims there’s a question …? But what this paper shows is that CO2 aborbing (and emitting) IR is not equal to a *thermal effect* resulting from it, barry. Read the paper …
“But high school students all over the world set up apparatus to see that adding CO2 to a volume receiving radiant energy causes changes in temperature, to the volume (increase), or to a monitor situated on the other side of the volume (decrease).”
Yes, when and if the experiment is set up as to NOT resemble the real atmosphere, it is …
“The atmospheric greenhouse effect is real, corroborated by independent lines of evidence. Even the experiment you cited notes the optical (IR absorbing) properties of CO2.”
The atmospheric TEMPERATURE effect on the solar-heated surface of the Earth is very real. It simply isn’t caused by the Earth’s own thermal radiation. That’s an effect of temperature, not a cause of it …
Meaning, the surface temperature determines air temperature, as over the oceans, where air temperature is always slightly less than SST. The AGW crowd is backing off from their exaggerated back radiation claims. They now confess that LWIR cannot warm the oceans.
Mike Flynn says: “Ascribing vague magical properties . . . CO2 has optical properties . . . is just trotting out meaningless sciencey rubbish.”
Yes, there are people who deny it.
Yes, no one disputes the optical (radiative) properties of CO2
Mike Flynn does.
barry. What we dispute is the THERMAL EFFECT of these properties on the surface of the Earth. Where is the real-world evidence of this? Please remind us
Infrared radiation cannot physically warm anything? Is that what you’re saying? That only energy in the solar spectrum can do this?
Observed evidence:
https://agwobserver.wordpress.com/2009/08/19/papers-on-changes-in-dlr/
https://agwobserver.wordpress.com/2009/08/02/papers-on-changes-in-olr-due-to-ghgs/
What thermal structure of the atmosphere is necessary for convection to occur, Kristian?
That only energy in the solar spectrum can do this?
Should have said ‘visible light’ spectrum. Sunlight includes non-visible spectra, of course.
barry:
“Infrared radiation cannot physically warm anything? Is that what youre saying? That only energy in the solar spectrum can do this?”
*Sigh* No, barry, that’s not what I’m saying. You’re not this stupid.
“What thermal structure of the atmosphere is necessary for convection to occur, Kristian?”
Is CO2 causing convection to occur, barry? Or is the Sun? Is CO2 causing the negative tropospheric temperature gradient necessary for there to be a “radiative greenhouse effect” as defined?
Mike Flynn says: Ascribing vague magical properties . . . CO2 has optical properties . . . is just trotting out meaningless sciencey rubbish.
Yes, there are people who deny it.
Except CO2 adds insignificantly to the GHE, being redundant in its radiative properties to water vapor and clouds.
mpainter, would you kindly tell Mike Flynn, Kristian and geran that there is a greenhouse effect at all? You might get more traction with them than I do.
barry,
I am impressed with your patience with the nonscientists who continue to attack your posts without the ability to understand the content of what you post. I have also tried to explain the physics to them but it is beyond them to understand how the process of GHE works. I have even linked them to actual measurements of daily downwelling IR and it does not seem to open their minds. I would suggest not attempting to change their strongly held beliefs as it is not possible to do.
Roy Spencer has had a number of posts on how the GHE works and why but they do not understand it. They falsely believe you are saying that Carbon Dioxide is a heat source itself (not acting by redirecting the continuous flow of IR radiation) and will not try to understand what you are actually stating.
Norman! I’ve been missing your ridiculous pseudoscience. Do you still believe cabbages emit visible light?
Geran, i think your losing your touch… It’s “NORMIE!” (☺)
They falsely believe you are saying that Carbon Dioxide is a heat source itself (not acting by redirecting the continuous flow of IR radiation) and will not try to understand what you are actually stating.
So it seems.
I’ve linked to observations of upwelling and downwelling IR in the spectra associated with CO2, too. Made by satellites for the former, no less, the platform for the blog-owner’s data. People sure have a knack of selectively dismissing data that doesn’t fit with their view – but accepting data from the same source when it does.
I was never fooled that I had reasonable interlocutors – denying the greenhouse effect is pretty out there – but it’s been entertaining nevertheless.
Downwelling IR is NOT proof of the GHE! Claiming such nonsense is pseudoscience. A fruit tree emits IR. Does a Warmist advocate cutting down all fruit trees?
actually, I believe that downwelling IR *is* proof of the GHE. It is almost always measured with temperature devices, like a bolometer or thermopile, which are designed to be sensitive to IR wavelengths. Since they measure a temperature increase in response to increasing downwelling IR (the self-emission of IR by the device is also taken into account), that — by definition — *IS* the greenhouse effect (the temperature increase in response to downwelling IR).
Well then, get out your chainsaw and start cutting down all those peach trees to “save the planet”!
if we are talking about 2m temperatures or surface skin temperatures, then trees DO increase nighttime temperatures, through their IR emission effect…I see this routinely on cold, calm, clear nights…but they also decrease daytime temperatures because of shade. In contrast to trees, greenhouse gases (1) are nearly transparent to sunlight, and (2) extend through the full depth of the atmosphere, affecting all levels (cooling the upper layers, warming the lower layers).
Dr Roy, what I think has you confused is that a device, such as a bolometer, is DESIGNED to absorb IR. The surface of the Earth does NOT absorb all photons that impact it. Low energy photons, such as 15 micron from CO2, are easily reflected. The downwelling IR that you measure is only “proof” that matter emits IR. QED. But that is NOT proof the surface of the Earth is warmed by atmospheric CO2.
you are just making stuff up, now. The IR emissivity of all kinds of materials hav been measured and are widely available. At window channel frequencies, satellites routinely show brightness temperatures approaching thermometric temperatures, so the ground emissivity (including vegetation) is typically 0.95 or more.
That is why a turkey cannot be baked with ice cubes, even though ice is emitting about 300 Watts/square meter.
geran, if you don’t understand that the temperature of an object represents a balance between all energy gains and energy losses, I can’t help you. No, ice cubes cannot cook a turkey…. but the radiation from a plate of ice at, say, -5 deg. C can keep a turkey heated at a constant rate from within warmer than if that plate is cooled to -190 deg. C with liquid nitrogen. Please tell me you are smart enough to understand this.
A REAL greenhouse does trap heat. In fact, the heat builds so that the temperature inside a greenhouse, if the windows remain closed, can exceed the outside temperature. A car parked in full sun, with the windows up, can easily reach temperatures 20 degrees F above the ambient.
In your thought experiment, even with BOTH the sheet of ice and the sheet cooled by liquid nitrogen, the turkey will NEVER show any increase in temperature. In fact, you can double the size of the two sheets, and still no increase in turkey temperature. Increase the sheets by a factor of 20, still no increase in turkey temperature.
Earth’s atmosphere is NOT a greenhouse.
The IPCC CO2/GHE/AGW/back-radiation is pseudoscience.
Roy W. Spencer, Ph. D. says, July 12, 2016 at 11:42 AM:
“actually, I believe that downwelling IR *is* proof of the GHE.”
Are you kidding me!? That simply shows that the atmosphere has a temperature. It doesn’t reveal how it got that temperature …
Dr Spencer,
I don’t believe anyone except a foolish Warmist would believe that a body above absolute zero is not continuously emitting light (EMR, radiation, photons, energy, as you wish).
Radiation from the atmosphere to the surface is unceasing. Radiation at a rate of 300 W/m2 is characteristic of a body with a temperature of less than 0 C. Under these conditions, “back radiation” of this amount will allow the surface below to cool to below 0 C, and of course this is what happens in arid tropical deserts. The “back radiation” never raises the temperature of the cooling surface. 100 gigawatts of radiation at 300 W/m2 will not raise the the temperature above freezing.
What is often overlooked is that the atmosphere is constantly losing energy by emitting radiation. At night, with no energy source from above to provide replacement energy, the atmosphere cools, and the ill named “back radiation” decreases as a result.
The well documented nighttime low level inversions are a result of the interplay between several factors, of which I am sure you aware. They support what I have been saying. The warmer air layers cannot even raise the temperature of the colder surface below them. Tyndall explains the mechanism quite well, but foolish Warmists won’t bother to read Tyndall.
Without a falsifiable hypothesis relating to the planet heating abilities of CO2, it just ain’t science. Assertion, no more no less.
I notice that Warmists generally are faced with ever diminishing estimates of what they mistakenly call ECS etc. The figure will eventually be found to be indistinguishable from zero, at which point everyone can walk away looking satisfied with themselves!
All part of the rich tapestry of life.
Cheers.
Of even greater note is the transient climate response which is the warming that we should have seen already… TCR is claimed to be about 2C and we’re almost half way to a doubling of CO2 now. The ipcc tells us that as little as half of recent warming can be attributed to an increase of CO2 and lays no claim on pryor warming. That would be about .2C which is woefully short of the 1C that we should have seen already. Even if we were generous to the ipcc and assigned a .3C warming to their “at least half” mantra, added an extra .1C for prior warming, AND another .1C for good measure, we would still only be seeing just half the warming that we would expect to be seeing already…
fonzarelli – We are at 400ppm over a pre-industrial baseline of 280ppm. That is an increase of 43%. Ignoring the logarithmic definition of “sensitivity” and treating it as linear within this small range, that would yield an increase of 0.85K for a sensitivity of 2K.
The last time I plotted a linear trend line from Roy’s UAH raw data series, from December 1978 to May 2016, it yielded a trend rate of 0.001005K per month, yielding an aggregate increment of 0.452K over just 450 months. (37.5 years.) The Met Office reported in November that the increment over pre-industrial levels was approaching 1K, while most sources place the increment over pre-industrial temperatures at 0.8K and the recent el Nino peak at 1.4K over pre-industrial. Using Roy’s data stream or the other widely-accepted figures, therefore, and applying your own reasoning, 2K sensitivity would appear to be spot on, or based on the el Nino peak a serious underestimate.
This is a common danger when you combine convenient reasoning with convenient data. Apply the same reasoning to real data or real reasoning to inconvenient data and it can shoot you in the foot. I suggest you desist.
http://www.metoffice.gov.uk/research/news/2015/global-average-temperature-2015
Mike Flynn
Mike says: “What is often overlooked is that the atmosphere is constantly losing energy by emitting radiation. At night, with no energy source from above to provide replacement energy, the atmosphere cools, and the ill named back radiation decreases as a result.
The backradiation is not much effected by direct solar radiation of the day.
http://www.esrl.noaa.gov/gmd/grad/surfrad/dataplot.html
On this link click the variable “Downwelling Solar” and also “Upwelling IR” and “Downwelling IR”.
The backradiation is a result of the surface emission not direct solar so at night is still has a source of input. It goes down but not as much as you might think. I would suggest you try plotting some graphs on this link as it will certainly change what you currently are accepting as Truth.
Kristian
The diatomic gases of O2 and N2 emit almost no IR (not measurable by the instruments scientists are using). Even a very warm atmopsphere without GHG (IR emitting) would have no measurable downwelling IR. The fact there is a measurable IR flux from above is the GHE and it is real energy that will lower the rate of cooling when the sun is not shining.
Elliott,
even MODTRAN, which still use the Nadir radiation only predicts a 0.45K warming for changing from 280 to 400ppm (@ tropics, where is the maximum impact of “backradiation”).
Try it here:
http://climatemodels.uchicago.edu/modtran/
Where do you get your get you “increase of 0.85K”?
Have a great day.
Massimo
Salve, Massimo.
“Where do you get your get you increase of 0.85K?”
2K sensitivity as the basis for discussion provided by Fonzie: “TCR is claimed to be about 2C”
400ppm over 280ppm yields a 43% rise; 43% x 2K yields 0.85K. Sorry, I thought this was clear from context. As the reported increase over pre-industrial times appears to be about 0.8K, Fonzie’s own reasoning supports the inclusion that a sensitivity of 2K is pretty-much spot on based only on temperature rise to date. Add in latency, as the atmosphere continues to accumulate heat due to CO2e which is already resident, and 2K actually looks conservative.
I am not advocating one figure or another, of course, only pointing out that consequences of following Fonzie’s reasoning as applied to observed warming.
Norman,
Many foolish Warmists claim that molecules such as O2 and N2 cannot emit IR. As Tyndall showed, they can. If you have access to a hair dryer, you can feel the heat emitted by the O2 and N2 after it has been heated – a remote thermometer will detect the radiation, if you can’t feel it on your skin from a distance.
Actually, when you measure air temperature, you are actually measuring the response of the instrument to radiation from the air, which is mainly N2 and O2.
This usually comes as a shock to foolish Warmists, who seem to think they can determine the CO2 content of a mixed gas sample by taking its temperature. Silly, but true.
Foolish Warmists will also prattle on about the GHE at night in an arid desert, while the temperature plummets, firmly convinced that a reduction in the rate of cooling results in a rise in temperature. No, a fall in temperature is cooling, not heating.
Since its creation, the Earth’s surface seems to have cooled. Not heated, but cooled. Any falsiable hypothesis needs to account for this fact, also that any supposed heating effect of CO2 is not measurable at night, indoors, in the dark, or in the absence of an external heat source.
Knock yourself out. Introduce a bit of science, if you wish. Foolish Warmists can’t, of course, but you may not be a foolish Warmist.
Cheers.
“Actually, when you measure air temperature, you are actually measuring the response of the instrument to radiation from the air, which is mainly N2 and O2.”
The logical error here is so simple it barely needs pointing out: The fact that the radiation is from air and air is mainly N2 and O2 does not, very obviously, permit the inference that the radiation is mainly from N2 and O2.
“If you have access to a hair dryer, you can feel the heat emitted by the O2 and N2 after it has been heated”
If you put your hand in or near the stream so that the air can deliver heat directly to the skin by conduction, yes.
Norman says, July 13, 2016 at 5:07 AM:
Still stuck on this, Norman?
There is no IR flux to the warmer surface from the cooler atmosphere above. There are of course photons flying around everywhere, creating a so-called “photon cloud”, but no thermodynamic (macroscopically detectable) movement of radiative energy from a cold place to a warm.
Look, the atmosphere and the surface CONTAIN energy. That’s their “internal energy” [U], providing them with a measurable temperature. That internal energy accumulated during the build-up phase towards a final steady state, where as much energy (heat) exits as what enters per some unit of time. In the steady state, the energy content and thus the temperature stay pretty much constant.
‘Contained’ or ‘stored energy’ is thermodynamically defined specifically as the antithesis of ‘moving energy’ or ‘energy transfers‘. Thermodynamically relevant movement of energy from one place to another occurs ONLY as a difference in potential (like temperature) between those two places is induced.
The surface has its “photon cloud”, equilibrated with the surface temperature. Likewise, the atmosphere has its “photon cloud”, equilibrated with the atmospheric temperature. These two “photon clouds” are in direct physical contact. But they are both just “clouds” of energy, contained radiative energy occupying the exact same space as the two distinct ‘bodies’ or ‘systems’ creating and maintaining them with their temperatures. Actual movement of energy between and/or through the “photon clouds” only happens as a result of the temperature difference between the systems harbouring them, or rather, because of the energy density gradient from the one (the surface cloud) to the other (the atmospheric cloud). This detectable (macroscopic, “net”) movement of radiative energy goes only one way, from the warm surface cloud UP to and through the cool atmospheric cloud. And beyond …
So, energy, radiative energy included, is THERE all the time, everywhere, as long as there are temperatures. And at a microscopic (quantum) level, there is energy exchange going on all the time and everywhere, in ALL directions, not just two. But energy is TRANSFERRED thermodynamically (macroscopically) only from warmer to cooler temps. As a direct result of the difference in potential (temperature), hence of the energy density gradient, between the regions at different potentials/temperatures.
– – –
You can’t have an atmosphere that isn’t IR active, Norman. Such an atmosphere would not be able to rid itself of all the energy it absorbed (non-radiatively) every day from the surface below. It would heat, inflate and erode away into space …
The radiative properties of our atmosphere enable it to adequately cool, thus keep our Earth system stable. They are not a cause of Earth temperatures.
Hi Kristian,
I usually agree with your posts, but in this case I still on Norman side, probably because I missed something and I would like you explain me what I missed.
IMHO Norman stated something that I believe is true, that is without any LWIR active molecule in the air we shouldn’t see nothing pointing a FLIR camera to the sky.
That doesn’t mean that the atmosphere still doesn’t exchange its heat with the ground and vice-versa as if the GHGs were there (let me call the IR active gases that way, just because it is easier to identify them), the process just happens by conduction, diffusion and convection and keep the ground a little warmer than without any atmosphere, because of the delay in cooling due to the atmospheric mass.
How could a GHGs free atmosphere emit photons in the LWIR band?
IMHO a FLIR camera sees that photons just because being warmer its internal thermopile side exposed to the lens tries to dissipate to the outer space, but finding the GHGs some of those photons return back limiting the dissipation (I’m doing it easy, of course no matter if the returning back photons were coming from the camera detector or from other places on the ground).
This no way means that those photons heat the camera sensor, they just reduce its dissipation on the side exposed to the lens.
In my opinion without any GHGs the FLIR camera should see nothing in the sky, which doesn’t mean that the atmosphere is not at the very same temperature of the GHGs atmosphere.
Just to say, I don’t agree with Dr.Spencer when he states that the FLIR camera measured temperature is the average temperature of the atmosphere in the camera FOV.
Have a great day
Massimo
even MODTRAN, which still use the Nadir radiation only predicts a 0.45K warming for changing from 280 to 400ppm (@ tropics, where is the maximum impact of backradiation).
Try it here:
http://climatemodels.uchicago.edu/modtran/
Where do you get your get you increase of 0.85K?
Positive feedbacks. That’s included in TCR.
Elliott, you are aware that TCR (transient climate response) is not ECS (equilibrium climate sensitivity)? TCR is the estimated sensitivity at the time of doubling, not the estimate of the system after near-equilibrating to changes in radiative forcing, which occurs some 30-40 years after the doubling owing mainly to the thermal capacity of the oceans.
Massimo PORZIO says, July 13, 2016 at 3:08 PM:
“IMHO Norman stated something that I believe is true, that is without any LWIR active molecule in the air we shouldnt see nothing pointing a FLIR camera to the sky.”
The problem with this eternal warmist argument is that it describes a reality that could never be, and so the argument is moot. There is no way you could have a massive atmosphere that is not IR active. As I wrote above:
“You cant have an atmosphere that isnt IR active (…). Such an atmosphere would not be able to rid itself of all the energy it absorbed (non-radiatively) every day from the surface below. It would heat, inflate and erode away into space …
The radiative properties of our atmosphere enable it to adequately cool, thus keep our Earth system stable. They are not a cause of Earth temperatures.”
In fact, I could counter Norman’s ‘thought experiment’ with another, ‘showing’ how there is no “radiative greenhouse effect (rGHE)”.
Here’s Raymond T. Pierrehumbert “explaining” the rGHE:
https://geosci.uchicago.edu/~rtp1/papers/PhysTodayRT2011.pdf
But he’s already provided the reason in this very quote why this is not so. Yes, an “atmospheric greenhouse gas” (no, an IR active gas) does enable Earth to radiate at a temperature lower than the ground’s, but only because it 1) enables the atmosphere to cool radiatively to space, and 2) because there is a negative temperature gradient in the troposphere. The IR active gas, however, specifically didn’t cause that negative temperature gradient in the troposphere. So whatever caused the negative tropospheric temp gradient is what causes “the surface temperature in balance with a given amount of absorbed solar radiation to be higher than would be the case” … if that negative temp gradient weren’t there.
IOW, if there were no negative tropospheric temp gradient, then there would be no rGHE, no matter how much “back radiation” the atmosphere sent down to the surface, because then the temperature would be the same at the tropopause as at the surface.
Again, the radiative properties of our atmosphere are a TOOL, enabling the atmosphere to cool to space and thus to keep our Earth system stable. They are not a CAUSE of Earth temperatures …
barry – “Elliott, you are aware that TCR (transient climate response) is not ECS (equilibrium climate sensitivity)”
Yes, but the post to which I was responding does not give an equilibrium value. As I am arguing from currently observed responses and using the value of TCR given by the respondee, this simply reinforces my point – a valiue of 2K for TCR appears to be spot on, and the value for ECR must be higher.
barry, bigmouth is wrong and you know that i called you out on this higher up in the post. The ipcc in no ways claims that the entire .8C rise in temps since the LIA is due to CO2. (they only make a claim for “at least half” of recent warming) If you go there again, you are merely establishing yourself here at this blog as a light weight troll…
Fonzie, as usual, is failing to think clearly because it would get in the way of his preferred conclusion. The fact that the IPCC does not attribute all change to GHGs, very obviously, does not imply that any of the change is due to anything else. Firstly, it only establishes what they are confident in attributing. There is no reason to suspect that 100% of the observed change is not due to GHGs but cannot be attributed with confidence. Secondly, of course, the IPCC is bound BY LAW to issue the most conservative statements consistent with all the evidence, so if two-thirds of their papers say it’s all due to GHGs and one-third say it just might be all GHGs, they are REQUIRED to say “it just might be all GHGs”.
And, of course, Fonzie does not actually know what the IPCC really says on the matter. You can find it here:
https://www.ipcc.ch/publications_and_data/ar4/syr/en/spms2.html
“Most of the observed increase in global average temperatures since the mid-20th century is very likely due to the observed increase in anthropogenic GHG concentrations.[7] It is likely that there has been significant anthropogenic warming over the past 50 years averaged over each continent (except Antarctica) (Figure SPM.4). {2.4}
“During the past 50 years, the sum of solar and volcanic forcings would likely have produced cooling. Observed patterns of warming and their changes are simulated only by models that include anthropogenic forcings. Difficulties remain in simulating and attributing observed temperature changes at smaller than continental scales. {2.4}”
Reading off the graph further down, the last 50 years covers 0.6K of the observed temperature rise to date. Fonzie, surprise, surprise, is repeating hearsay because it suits what he wants to believe.
Fine… f*** the ipcc then AND their b***s*** models. It’s warmed .8C since the LIA and it’s NOT all from CO2. And BTW, we’re at a 405 ppm average and that would put your TCR at .9C, BUCKO (!)
Roy Spencer has had a number of posts on how the GHE works
Not much you can do when unqualified ‘skeptics’ dismiss a qualified view from another skeptic. Ferdinand Englebeen has the same trouble with historic CO2 levels. Some in the home crowd just wave it off.
Exactly.
Not even the good Dr Roy’s advice has any impact on these last few recalcitrants.
It is as if they have developed some sort of immunity to common sense.
A bit like seeing a few cockroaches surviving the effects of an insecticide.
Still, it is morbidly fascinating to watch them scurry and wail.
So what are engelbeen’s qualifications?
Who or what is englebeen and what has it to do with cockroaches?
An engelbeen is the biggest, ugliest cockroach that was ever immune to a spray…
Engelbeen, a skeptic who believes that the effect of rising CO2 concentrations on Earth’s temperature is minimal, has spent thousands of hours investigating the notion that the rise of CO2 since the industrial revolution is due to something other than industrial emissions. Dr Spencer has posted an email from him on this blog.
http://www.drroyspencer.com/2009/01/the-origin-of-increasing-atmospheric-co2-a-response-from-ferdinand-engelbeen/
His work is so incredibly comprehensive that he is often cited, even by non-skeptics.
This is a brief example of the work he has done. It’s only a fraction of his research, but a god read for anyone curious about the notion of how (or if) CO2 increased in the atmos since the mid-1700s.
http://www.drroyspencer.com/2009/01/the-origin-of-increasing-atmospheric-co2-a-response-from-ferdinand-engelbeen/
He is the only one among the skeptical milieu to have researched the issue in such extraordinary depth and breadth. Ernst Beck’s work is a fraction of Engelbeen’s, for example.
There are two components of the debate that have been thoroughly tested by skeptics and corroborated: 1) the CO2 rise for the last 250 years is almost entirely anthropogenic: 2) the surface temperature records are sound within the limitations of data.
Despite this corroboration from skeptics who spend thousands of hours researching and conducting their own experiments and constructing their own methodologies, some in the skeptical milieu wave it away in favour of much less well researched blog blather.
The greenhouse effect is in the same category. Every qualified skeptic agrees on its effect, only people without the qualifications necessary to thoroughly vet the science disagree.
There are components in the debate that are uncertain enough to be worthy of a healthy debate. But opposing mitigation policy does not mean that black could be white or that physics is overturned. There is enough uncertainty on things like climate sensitivity, long-term cycles and particular components of the climate system (eg clouds/aerosols) without having to inject junk science into the mix – except if one’s goal is to muddy the waters rather than seek the truth.
Engelbeen is one who sought the truth. After a very long time digging away, he found it, and it wasn’t what he thought. I brought him up because he is like Anthony Watts, Roy Spencer, John Christy, Roger Pielke Snr and other skeptics with actual credentials and their opinion on the greenhouse effect. There is a unanimous opinion from atmospheric physicists who have antipathy towards the IPCC – they all agree the greenhouse effect is real. The only ones left denying this effect are unqualified bloggers and the people who like what they blog.
Engelbeen is the example of this rift in skeptical thought. That’s one of the problems with the skeptical canon. The mainstream theory is consistent. There is no uniform skeptical ‘theory’ on why the planet has warmed, because skeptics disagree with each other, regardless of how much work has gone into examining any particular component. There is no coherence. Rejection is the most consistent theme.
Ferdinand Engelbeen’s qualifications: Bachelor Degree in Industrial Chemistry at the Institute of Technology in Antwerp in 1965.
Apparently qualified enough to get 4-part article on Anthony Watts’ blog, What’s Up With That?
https://wattsupwiththat.com/2010/09/24/engelbeen-on-why-he-thinks-the-co2-increase-is-man-made-part-4/
Wrong link, should have been:
This is a brief example of the work he has done. Its only a fraction of his research, but a good read for anyone curious about the notion of how (or if) CO2 increased in the atmos since the mid-1700s.
http://www.ferdinand-engelbeen.be/klimaat/co2_origin.html
I suggest that you read part 1 of ferdinand’s four part 2010 series (the one on the mass balance argument), especially the debunking in the comment page there in. You will clearly see what a shamelessly deceptive purveyor of junk science that “engelSPIN” truly is…
The first few comments from skeptics are that the issue has already been accepted and isn’t in question (that the increase in atmos CO2 since the industrial revolution is almost entirely anthropogenic).
Still, there are skeptics who deny it. I’m sure there are quite a few of the 613 comments in that post that push back. (They are specious. The most compelling argument is irrefutable, and it’s based on simple arithmetic)
But thanks for helping to demonstrate the incoherence of the ‘skeptical’ canon on AGW/global warming. There is no uniformly agreed on alternative theory, just a lot of opinions, many of which contradict (such as this component). The only thing in common is rejectionism.
So what are engelbeens qualifications?
I cited them. You ignored that and moved on. Quite typical for nay-sayers.
Or perhaps you’d like to comment…?
Ferdinand Engelbeens qualifications: Bachelor Degree in Industrial Chemistry at the Institute of Technology in Antwerp in 1965.
“(that the increase in CO2 since the industrial revolution is almost entirely anthropogenic)”
You missed it… Go back and read the comments again. Where ferdi gets in trouble is not to far from the top. He made the same mistake that you are making with the above quote and got caught with his pants down. The mass balance argument does NOT say that the rise is “almost entirely anthropogenic”. It says that the rise is ENTIRELY anthropogenic. Ferdi got caught, went running to the safety of his beloved ice cores and was called out by other commentors. Go back and read it again; if you can’t find it, let me know and i will go back and find it for you…
Corrections:
“not to far” should read “not too far”
data from ice cores tells us that the natural contribution over the last half century is about 8 ppm while the mass balance argument dictates that the rise over the last half century is ZERO. (the mass balance argument cannot be applied as such all the way back to the beginning of the industrial revolution because human emissions were lower back then than carbon growth…)
BTW, i didn’t stick with the subject of engelbeen’s qualifications because you demonstrated that i didn’t need to. There are plenty of other people with differing points of view over at wuwt who have degrees, too. (some actually have degrees in climate science, unlike f. e.) All those qualified skeptics with differing points of view can’t all be right. As far as ferdinand is concerned, he’s just another egghead in the crowd…
Hello, Dr. Roy. I notice that this version of your graph does not show the 13-month moving average. The monthly update DOES show it, and it hints at a reason as to why you do not show it here: Reading by eye, the latest 13-month average ALREADY ties with the peak for the running average during the 1997-8 el Nio. The calendar year might not set a record, but the coincidence of the timing of the start of the Gregorian calendar year has no significance whatsoever. The year to date, the only figure which we already have in our hands, is already tying for the record – or pretty close, I can’t seem to get into the raw data to check the exact figures.
So I have to wonder why you would be talking about the calendar year at all.
OMG. You caught me, Elliott. I was trying to fool everyone with an elaborate conspiracy that Exxon Mobil paid me an extra $1 million to perpetrate on everyone. Now I fear I won’t get paid! Curse you! (translation: you’ve got to be effing kidding me.)